24
Poverty and Health – An Inconvenient Truth Dr. Timothy M. Bray Director, The Institute for Urban Policy Research
| Date post: | 10-Feb-2017 |
| Category: |
Presentations & Public Speaking |
| Upload: | timothy-bray |
| View: | 207 times |
| Download: | 0 times |

Poverty and Health – An
Inconvenient Truth
Dr. Timothy M. Bray
Director, The Institutefor Urban Policy Research
Will Rogers
“It’s not what we don’t know that
hurts us, it’s what we know that just ain’t
so!”

Rooted in Inequality…

What is Poverty?

How is Poverty Defined?
How Much Is Enough?
How Much is Too Little?
"Mollie Orshansky 1967" by UnknownSocial Security Administration History Archives.Licensed under Public Domain via Wikimedia Commons
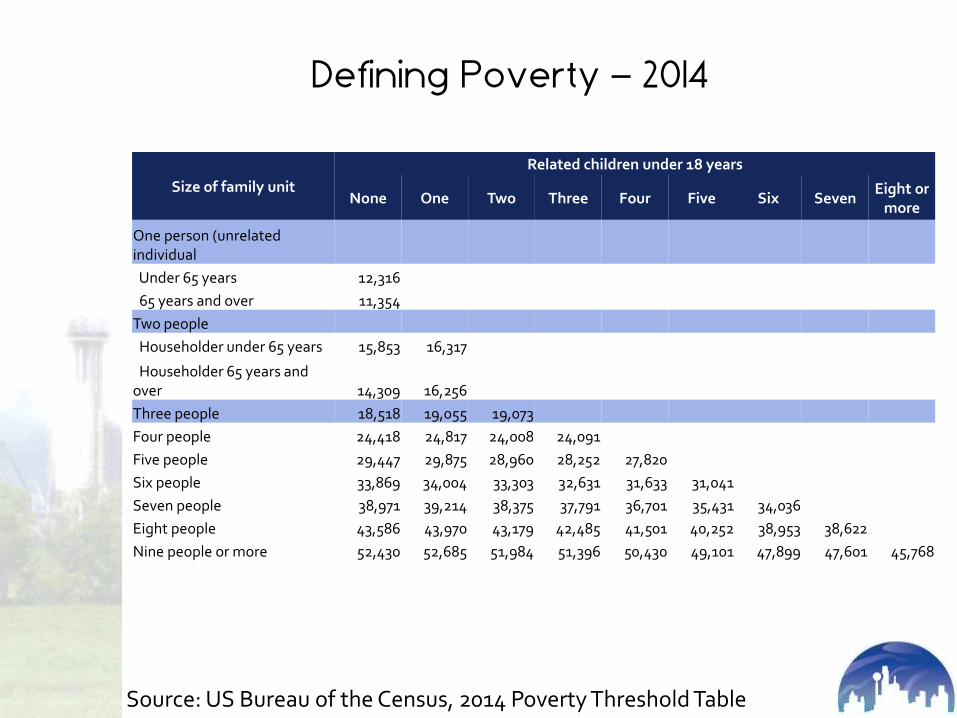
Defining Poverty – 2014
Size of family unit
Related children under 18 years
None One Two Three Four Five Six SevenEight or
more
One person (unrelated individual
Under 65 years 12,316
65 years and over 11,354
Two people
Householder under 65 years 15,853 16,317
Householder 65 years and over 14,309 16,256
Three people 18,518 19,055 19,073
Four people 24,418 24,817 24,008 24,091
Five people 29,447 29,875 28,960 28,252 27,820
Six people 33,869 34,004 33,303 32,631 31,633 31,041
Seven people 38,971 39,214 38,375 37,791 36,701 35,431 34,036
Eight people 43,586 43,970 43,179 42,485 41,501 40,252 38,953 38,622
Nine people or more 52,430 52,685 51,984 51,396 50,430 49,101 47,899 47,601 45,768
Source: US Bureau of the Census, 2014 Poverty Threshold Table

Minimum Wage Is Often Below Poverty
Wage
Size of family unit
Related children under 18 years
None One Two Three Four Five Six SevenEight or
more
One person (unrelated individual)
Under 65 years 122%
65 years and over
Two people
Householder under 65 years 190% 92%
Householder 65 years and over
Three people 244% 158% 79%
Four people 247% 182% 126% 63%
Five people 256% 202% 156% 107% 54%
Six people 267% 222% 181% 139% 95% 49%
Seven people 271% 231% 196% 160% 123% 85% 44%
Eight people 277% 240% 210% 177% 145% 112% 77% 39%
Nine people or more 259% 229% 203% 176% 150% 123% 94% 63% 33%
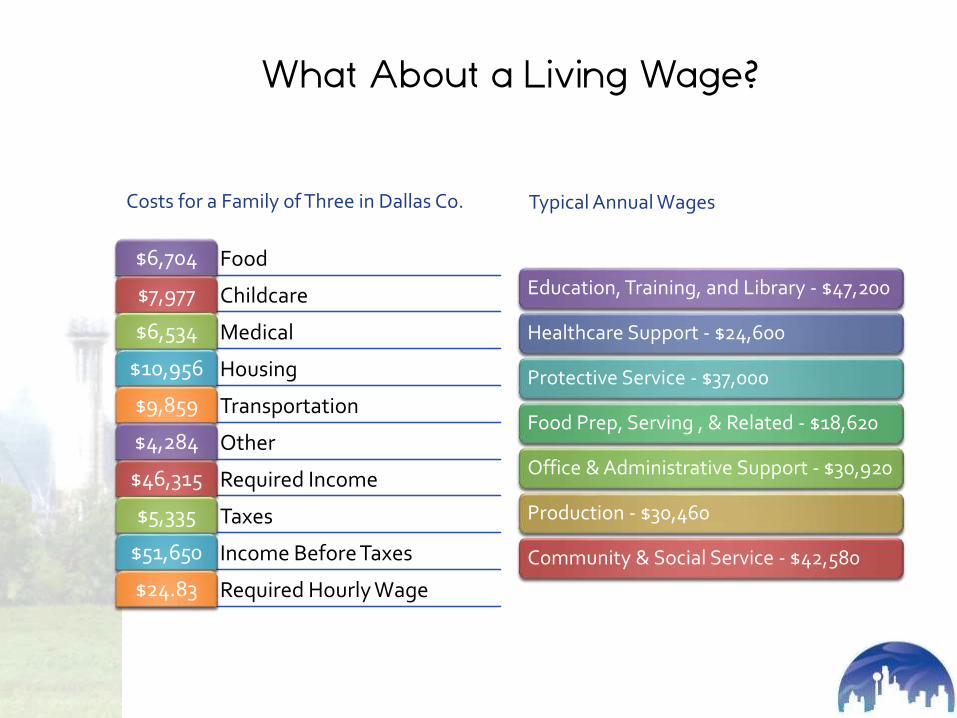
What About a Living Wage?
Costs for a Family of Three in Dallas Co.
Food$6,704
Childcare$7,977
Medical$6,534
Housing$10,956
Transportation$9,859
Other$4,284
Required Income$46,315
Taxes$5,335
Income Before Taxes$51,650
Required Hourly Wage$24.83
Typical Annual Wages
Education, Training, and Library - $47,200
Healthcare Support - $24,600
Protective Service - $37,000
Food Prep, Serving , & Related - $18,620
Office & Administrative Support - $30,920
Production - $30,460
Community & Social Service - $42,580

Poverty? in Dallas??

Poverty in Dallas
Among Highest in
Poverty Rates
• In 2014, 25% of Dallas residents lived below the poverty line.
• 46% lived below 185% of the poverty line.
Poverty Outpaced
Population Growth
• Population grew by 8% from 2000-2014.
• Persons living in poverty grew by 49% from 2000-2014.

Who is Poor in Dallas County?
• 20.0% (502,605) of Dallas County Residents Live at or Below 100% of the Poverty Threshold (±1.1%)
At the Margin
• Non-Hispanic White 08.7%(±1.0%) 67,940
• Non-Hispanic African American 24.0%(±2.1%) 131,749
• Non-Hispanic Asian 14.3%(±3.5%) 20,064
• Hispanic of Any Race 27.0%(±2.3%) 267,352
By Race and Ethnicity
• Under 18 30.8%(±2.4%) 208,613
• 18 to 64 16.8%(±1.0%) 267,574
• 65 and Up 10.8%(±1.7%) 26,418
By Age
Source: Institute Analysis of American Community Survey Public Use Micro Sample (PUMS) 2014 1-Year Estimates
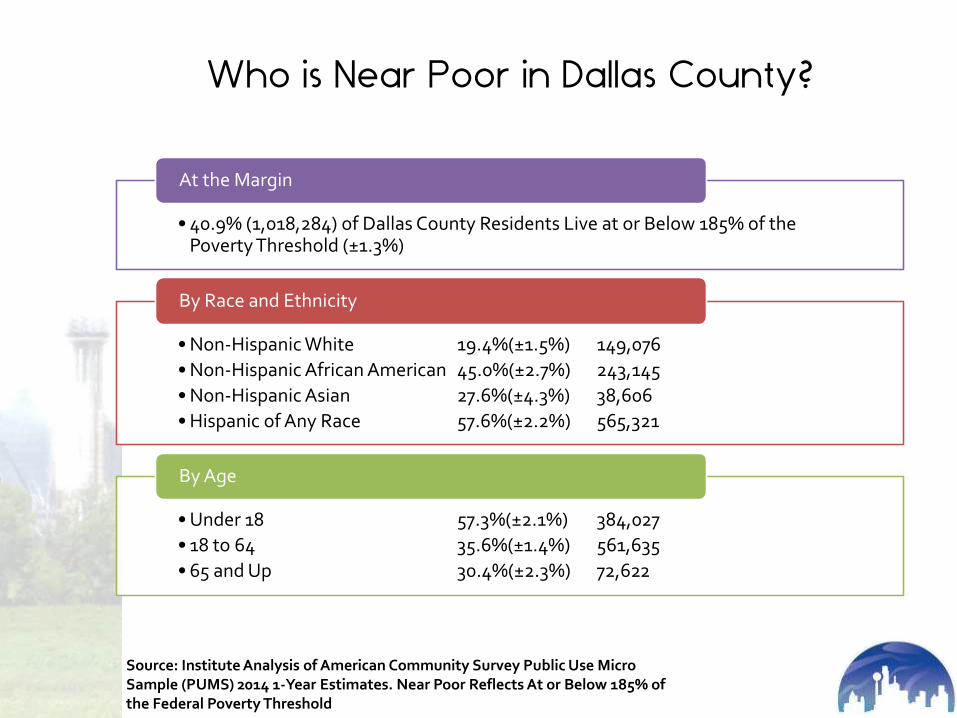
Who is Near Poor in Dallas County?
• 40.9% (1,018,284) of Dallas County Residents Live at or Below 185% of the Poverty Threshold (±1.3%)
At the Margin
• Non-Hispanic White 19.4%(±1.5%) 149,076
• Non-Hispanic African American 45.0%(±2.7%) 243,145
• Non-Hispanic Asian 27.6%(±4.3%) 38,606
• Hispanic of Any Race 57.6%(±2.2%) 565,321
By Race and Ethnicity
• Under 18 57.3%(±2.1%) 384,027
• 18 to 64 35.6%(±1.4%) 561,635
• 65 and Up 30.4%(±2.3%) 72,622
By Age
Source: Institute Analysis of American Community Survey Public Use Micro Sample (PUMS) 2014 1-Year Estimates. Near Poor Reflects At or Below 185% of the Federal Poverty Threshold

2014 Poverty by Tract
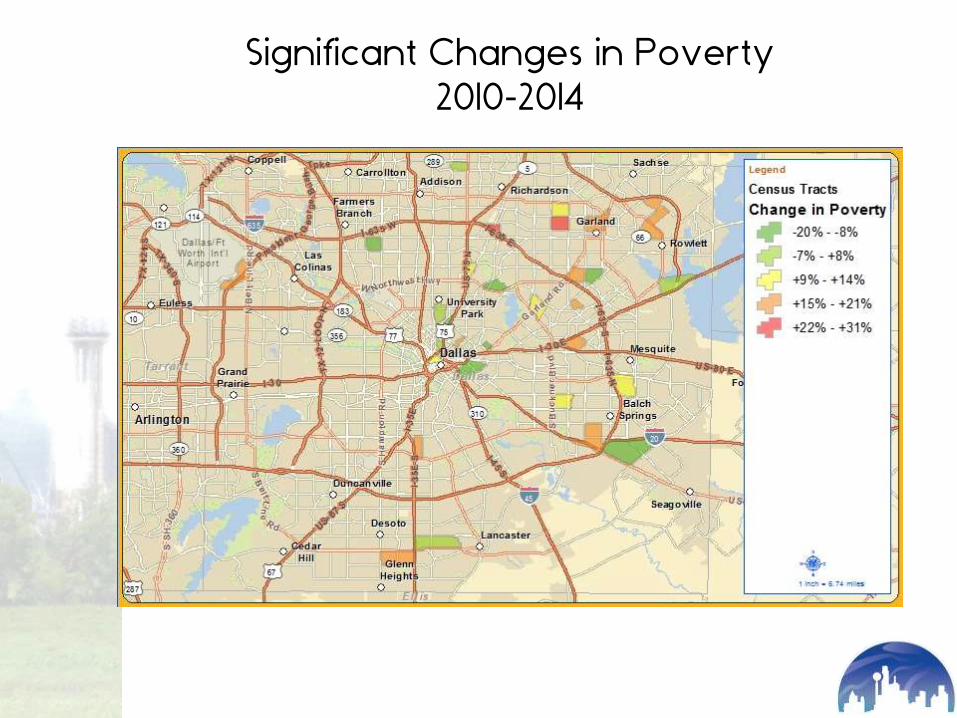
Significant Changes in Poverty
2010-2014

Concentrated Poverty in Dallas
2014

Why Does Poverty Matter?

A Different World…
An Inequality of Opportunity

Number of Grocery Stores
Within 30 Minute Public Transit

Number of Pharmacies
Within 30 Minute Public Transit

Major Racial and Ethnic Identities in
Concentrated Poverty Neighborhoods

Poverty and Health Insurance
0
0.1
0.2
0.3
0.4
0.5
0.6
0.7
0.8
0.9
1
25% 50% 75% 100% 150% 185% 200% 300% 400% 500%
Probability of Health Insurance Coverage by Product Type and Percent of Poverty Threshold, Dallas County
Employed Persons Age 25-64, 2014
Company-Paid Self-Paid Low-Income Uninsured
Source: Institute Analysis of American Community Survey Public Use Micro Sample (PUMS) 2014 1-Year Estimates.

The Impact of Toxic Stress
Source: US Department of Health and Human Services Healthy Marriage and Responsible Fatherhood
Poverty Impacts Brain Development

For More Information
Dr. Timothy M. Bray
Institute for Urban Policy ResearchThe University of Texas at Dallas
800 West Campbell Road, WT20Richardson, Texas 75080
V: 972-883-5430F: 972-883-5431
[email protected]://iupr.utdallas.edu
www.slideshare.net/TimothyBray
@timothy_bray


