www.parliament.uk/commons-library | intranet.parliament.uk/commons-library | [email protected] | @commonslibrary BRIEFING PAPER Number 7096, 31 August 2018 Poverty in the UK: statistics By Feargal McGuinness Inside: 1. Definitions, measurement and sources 2. Recent trends 3. Long-run trends since 1961 4. Prospects for future years 5. Poverty dynamics 6. Poverty and employment 7. Poverty and housing tenure 8. Poverty and disability 9. Regional poverty data 10. Constituency and local area data – child poverty 11. Material deprivation 12. Minimum Income Standards
and sources 2. Recent trends 3. Long-run trends since 1961 4. Prospects for future years 5. Poverty dynamics 6. Poverty and employment 7. Poverty and housing tenure 8. Poverty and disability 9. Regional poverty data 10. Constituency and local area
data – child poverty 11. Material deprivation 12. Minimum Income Standards
Number 7096, 31 August 2018 2
Contents Summary 3
1. Definitions, measurement and sources 6 1.1 Relative and absolute low income 6 1.2 Housing costs 7 1.3 Absolute low income and inflation 7
Variations in the inflation experiences of households 8 1.4 Production of poverty statistics 8
2. Recent trends 9 2.1 Whole population 9 2.2 Children 11 2.3 Pensioners 12 2.4 Working-age adults 13 2.5 Under-reporting of benefit income is likely to inflate poverty estimates 15
3. Long-run trends since 1961 17
4. Prospects for future years 19 4.1 Children 20 4.2 Regional differences 21 4.3 Limitations 22
5. Poverty dynamics 23 5.1 Persistent poverty 23 5.2 How many people experience poverty? 25 5.3 Poverty entry and exit rates 25 5.4 Factors associated with entering or exiting poverty 26 5.5 Government indicators of disadvantage affecting families and children 27
6. Poverty and employment 29
7. Poverty and housing tenure 31
8. Poverty and disability 33
9. Regional poverty data 34 9.1 Relative low income 34 9.2 Persistent low income 35
10. Constituency and local area data – child poverty 36 10.1 HMRC estimates 36 10.2 End Child Poverty estimates 37
11. Material deprivation 38
12. Minimum Income Standards 40 Number of people with income below the standard 41 How has the standard changed over time? 41
Summary This note sets out information on the levels and rates of poverty in the UK, including historical trends and forecasts for future years. The focus here is on poverty defined in terms of disposable household income, although poverty may be defined in different ways and there is no single, universally accepted definition.
Measuring poverty Various poverty measures based on disposable household income are in common use and the trend can look quite different depending on the measure used. Two commonly used measures are:
• people in relative low income – living in households with income below 60% of the median in that year;
• people in absolute low income – living in households with income below 60% of (inflation-adjusted) median income in some base year, usually 2010/11.
So the ‘relative low income’ measure compares the households with the lowest incomes against the rest of the population in that year, while the ‘absolute low income’ measure looks at whether living standards at the bottom of the distribution are improving over time. A low income measure can also be combined with an assessment of whether households have access to key goods and services, for a measure of low income and material deprivation.
Income can be measured before or after housing costs are deducted. Poverty levels are generally higher based on income measured after housing costs, because poorer households tend to spend a higher proportion of their income on housing.
The extent of poverty Around one in six people in the UK are in relative low income before housing costs (BHC), rising to more than one in five once we account for housing costs (AHC).
The % of all people in relative low income has been fairly flat in the past few years…
Relative low income in the UK in 2016/1710.4 million people (16%) are in relative low income BHC and 14.3 million AHC (22%).
This includes 2.7 million children (19%) in relative low income BHC and 4.1 million AHC (30%).
…but there has been an increase in the % of children in relative low income
0%
5%
10%
15%
20%
25%
30%
35%
06/07 08/09 10/11 12/13 14/15 16/17
AHC
BHC
0%
5%
10%
15%
20%
25%
30%
35%
06/07 08/09 10/11 12/13 14/15 16/17
AHC
BHC
Number 7096, 31 August 2018 4
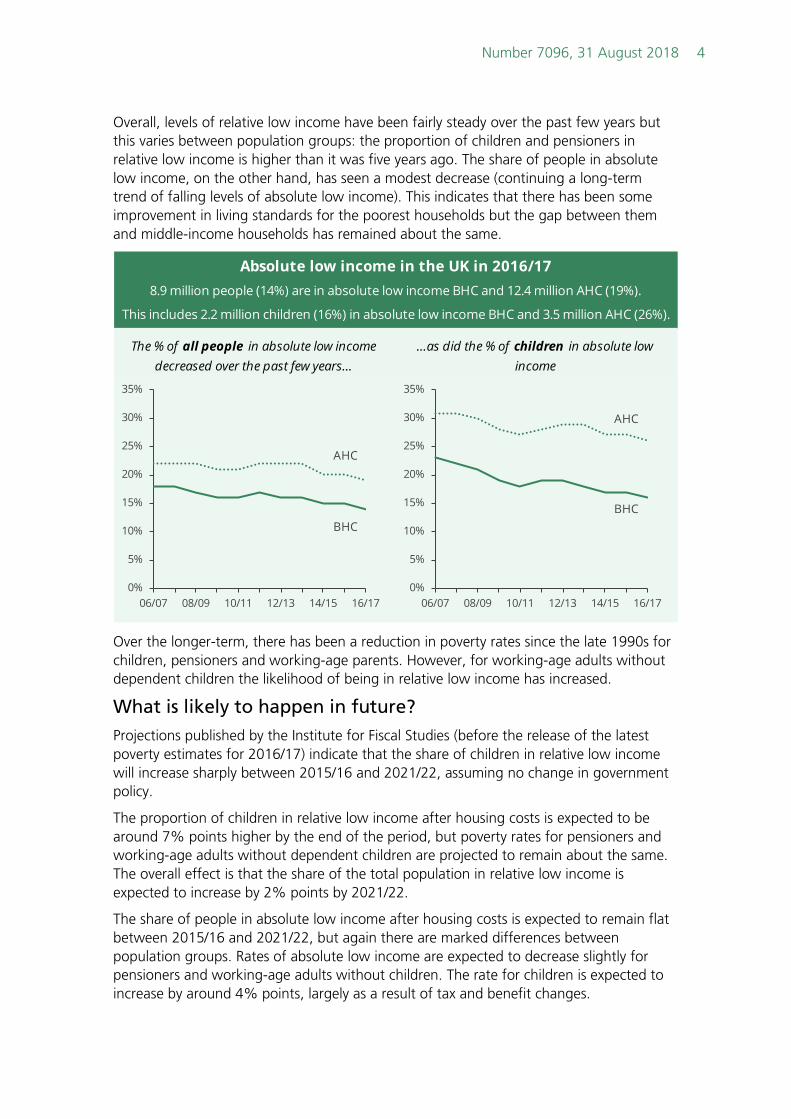
Overall, levels of relative low income have been fairly steady over the past few years but this varies between population groups: the proportion of children and pensioners in relative low income is higher than it was five years ago. The share of people in absolute low income, on the other hand, has seen a modest decrease (continuing a long-term trend of falling levels of absolute low income). This indicates that there has been some improvement in living standards for the poorest households but the gap between them and middle-income households has remained about the same.
Over the longer-term, there has been a reduction in poverty rates since the late 1990s for children, pensioners and working-age parents. However, for working-age adults without dependent children the likelihood of being in relative low income has increased.
What is likely to happen in future? Projections published by the Institute for Fiscal Studies (before the release of the latest poverty estimates for 2016/17) indicate that the share of children in relative low income will increase sharply between 2015/16 and 2021/22, assuming no change in government policy.
The proportion of children in relative low income after housing costs is expected to be around 7% points higher by the end of the period, but poverty rates for pensioners and working-age adults without dependent children are projected to remain about the same. The overall effect is that the share of the total population in relative low income is expected to increase by 2% points by 2021/22.
The share of people in absolute low income after housing costs is expected to remain flat between 2015/16 and 2021/22, but again there are marked differences between population groups. Rates of absolute low income are expected to decrease slightly for pensioners and working-age adults without children. The rate for children is expected to increase by around 4% points, largely as a result of tax and benefit changes.
This includes 2.2 million children (16%) in absolute low income BHC and 3.5 million AHC (26%).
…as did the % of children in absolute low income
The % of all people in absolute low income decreased over the past few years…
8.9 million people (14%) are in absolute low income BHC and 12.4 million AHC (19%).
Absolute low income in the UK in 2016/17
0%
5%
10%
15%
20%
25%
30%
35%
06/07 08/09 10/11 12/13 14/15 16/17
AHC
BHC
0%
5%
10%
15%
20%
25%
30%
35%
06/07 08/09 10/11 12/13 14/15 16/17
AHC
BHC
5 Poverty in the UK: statistics
Other ways of thinking about poverty Although this note discusses income-based measures of poverty, these have been criticised by government ministers since 2010 as failing to acknowledge the root causes of poverty and resulting in skewed policy responses that try to lift those just below the poverty threshold to just above it. The Welfare Reform and Work Act 2016 removed four child poverty targets previously set out in the Child Poverty Act 2010, and instead introduced statutory ‘life chances’ indicators relating to children in England living in workless households and educational attainment at the end of Key Stage 4 (age 16).
A policy paper published by the Department for Work and Pensions in April 2017, Improving Lives: Helping Workless Families, set out seven other non-statutory indicator areas, relating to parental conflict; poor parental mental health; drug and alcohol dependency; problem debt; homelessness; early years; and youth employment.
Defining poverty: Relative and absolute low income
There are various ways of defining poverty and no single definition is universally accepted. In the UK, the headline measures are based on household income and so these are the focus of this paper. In particular, two commonly used measures are:
• An individual is in relative low income (or relative poverty) if they are living in a household with income below 60% of median household income in that year. This measure essentially looks at inequality between low- and middle-income households.
• An individual is in absolute low income (or absolute poverty) if they are living in households with income below 60% of the 2010/11 median, uprated for inflation. By using an income threshold that is fixed in time, this measure looks at how living standards of low-income households are changing over time.
Income can be measured before or after housing costs have been deducted (BHC or AHC). Poverty levels are generally higher when household incomes are measured AHC, as households at the lower end of the income distribution tend to spend a larger share of their income on housing than higher-income households.
Official poverty estimates for the UK are published by the Department for Work and Pensions (DWP) in its annual Households below average income (HBAI) publication.
1.1 Relative and absolute low income The headline poverty measures used in the UK count the number of individuals falling below a threshold of household disposable income. This threshold can vary from year to year in line with average incomes, or may be held constant in real terms (i.e. after adjusting for inflation).
One commonly used measure is people in relative low income (sometimes referred to as relative poverty). This counts people living in households with income below 60% of median household income.
Another measure is absolute low income (or absolute poverty), which counts people living in households with income below 60% of the median in some base year (usually 2010/11), uprated for inflation.
The median is the point at which half of households have a lower income, and half have a higher income. In simple terms, the relative low income measure looks at inequality between low- and middle-income households. The absolute low income measure on the other hand indicates the extent to which living standards of low-income households are improving over time, although it does not take into account changes in what is commonly perceived as an acceptable standard of living.
However, income will not always reflect the extent to which a family can afford necessities. Therefore a low income threshold may be combined with some assessment of whether households are able to access key goods and services for a measure of low income and material deprivation (see section 11 of this briefing paper).
Individuals and households can obtain income from a range of sources. These include earnings from employment, cash benefits (for example the State Pension, housing benefit, tax credits, etc), investments, private pensions and other forms of income. Some of this income may be taxed. In the context of poverty statistics, we generally look at household income measured after adding on benefits and after deducting direct taxes (that is, disposable income) as a guide to the resources available to the household. Household income is likely to be more informative than individual income in this context, since we may expect income to be shared between household members. Certain forms of income are also determined by household composition – for example, tax credit awards or child benefit payments. However, a larger household is likely to need a higher level of income in order to enjoy the same standard of living as a smaller household. Therefore, to better enable comparisons of living standards, the statistics on household income are ‘equivalised’ to adjust for differences in household size and composition. Equivalisation means that the income threshold below which someone is considered to be in poverty differs by household type. Suppose a family with children has the same (unequivalised) disposable income as a single person: it is possible for the family to be counted as being in poverty even if the single person is not, because they have to make their income stretch across all household members. The standard of living afforded by a given level of income will of course depend on the price of goods and services, so when making comparisons between years we adjust incomes for inflation (to obtain ‘real’ incomes).
1.2 Housing costs Household income may be measured before or after housing costs are deducted (BHC or AHC). Both measures are commonly used, although in some cases one measure may be more appropriate than the other.
A BHC measure acknowledges that some households may choose to spend more on housing in order to enjoy a better quality of accommodation. On the other hand, variations in housing costs may not always reflect differences in the quality of accommodation (for example, geographical differences mean two households could face very different costs for a comparable standard of housing). In this case, an AHC measure is arguably more illuminating. 1
Poverty levels are generally higher when household incomes are measured AHC, as households at the lower end of the income distribution tend to spend a larger share of their income on housing than higher-income households.
1.3 Absolute low income and inflation An individual is in absolute low income if their household income is below 60% of the median in some base year, adjusted for inflation. DWP’s Households below average income (HBAI) publication uses 2010/11 as the base year in order to measure absolute low income. This briefing paper follows HBAI and also uses 2010/11 as its base year.
1 A short summary of the arguments for and against deducting housing costs from
household income can be found in DWP, Households Below Average Income, 2010/11, 11 June 2012, Appendix 2: Methodology, p266.
See also Appendix A in Jonathan Cribb et al, Living standards, poverty and inequality in the UK: 2017, Institute for Fiscal Studies Report R129, 19 July 2017, pp77-9
The number and percentage of people in absolute low income depends on how you adjust for inflation. The official poverty statistics presented in the HBAI report for 2016/17 use an absolute low income threshold uprated based on the Consumer Prices Index (CPI) measure of inflation.
Editions of HBAI before 2014/15 used the Retail Prices Index (RPI) measure, which tends to show a higher rate of inflation than the CPI. This affected the estimated number and proportion of people counted as being in absolute low income. Annex 4 of the HBAI Quality and Methodology Information Report for 2014/15 compares the trend in absolute low income under both CPI and RPI.
Variations in the inflation experiences of households Regardless of the choice of inflation index, the absolute low income measure does not account for differences in households’ experiences of inflation. Households with different levels of income will have different spending patterns, meaning the cost of living may rise more quickly for some households than for others.
Research funded by the Joseph Rowntree Foundation and conducted by the Institute for Fiscal Studies found that low-income households experienced a higher average annual rate of inflation than richer households over the period 2002/03 to 2013/14. The research estimates that the proportion of people in absolute low income would have been 0.5% points higher in 2013/14 if the threshold was uprated based on inflation rates that vary with household income.2 More recent data from the Office for National Statistics indicates that higher-income households experienced a slightly higher rate of inflation than lower-income households during 2017 and early 2018.3
1.4 Production of poverty statistics Official figures for the number of people in relative and absolute low income are published by the Department for Work and Pensions (DWP) in its annual Households below average income (HBAI) publication. The latest figures are for 2016/17 and were published on 22 March 2018.
The figures in HBAI are derived from the Family Resources Survey, which surveys over 19,000 households in the UK annually. Survey findings are weighted to produce estimates for the whole UK population. All data in this briefing come from this source unless otherwise stated.4
2 A Adams and P Levell, Measuring poverty when inflation varies across households,
Joseph Rowntree Foundation, 5 November 2014. Research by the Office for National Statistics (ONS) also found low-income households tend to experience higher rates of inflation than richer households: Variation in the Inflation Experience of UK Households, 2003-2014, 15 December 2014
3 Office for National Statistics, CPIH-consistent inflation rate estimates for UK household groups: April to June 2018, 15 August 2018
4 Analysis of trends in relative low income by housing tenure in section 7 are based on analysis of survey microdata: Department for Work and Pensions. (2017). Households Below Average Income, 1994/95-2015/16. [data collection]. 10th Edition. UK Data Service. SN: 5828, http://doi.org/10.5255/UKDA-SN-5828-8
There was modest growth in real incomes (i.e. incomes adjusted for inflation) for households across the income distribution between 2015/16 and 2016/17, reflecting growth in employment and real earnings as well as low inflation. Seeing as incomes grew faster than inflation, levels of absolute low income fell slightly. Levels of relative low income stayed about the same since incomes for those around the threshold grew at a similar pace to incomes at the middle of the distribution.
The proportion of people in relative low income declined between 2009/10 and 2010/11 in the aftermath of the recession. This arose because although average earnings fell in real terms, benefits better kept pace with rising prices, meaning poorer households saw a smaller fall in real incomes than those at the middle of the distribution.
Levels of relative and absolute low income remained fairly flat up to 2013/14, before real incomes started to increase more strongly for both high and low income households. Increases in employment among poorer households along with low inflation meant that levels of absolute low income stayed the same or reduced from 2013/14, despite the impact of benefit changes. Incomes also increased for middle-income households, so that the overall level of relative low income was fairly steady. However, there was still some variation between different population groups, with increases in the proportion of children and pensioners in relative low income between 2013/14 and 2015/16.
2.1 Whole population In 2016/17, there were 10.4 million people in the UK in relative low income before housing costs (BHC), about the same as the previous year. 16% of the population were in relative low income BHC.
On an after housing costs (AHC) basis, 14.3 million people were in relative low income, an increase of 300,000 from the previous year. 22% of the population were in relative low income AHC.
% of people in relative low incomeGreat Britain (1997/98-2001/02) and UK (2002/03-)
AHC
BHC
Number 7096, 31 August 2018 10
There were 8.9 million people in absolute low income BHC, a decrease of 500,000 from the previous year. 14% of the population were in absolute low income BHC.
The number of people in absolute low income AHC decreased by 400,000 to 12.4 million. The proportion of the population in absolute low income AHC was 19%.
Previously, the proportion of people in relative low income fell between 2009/10 and 2010/11, both on a BHC and AHC basis. This was because there was a larger decrease in real incomes for households at the middle of the income distribution than for households at the bottom, and the relative low income threshold moves in line with median income.
This decrease in median income between 2009/10 and 2010/11 reflected a decrease in real median earnings. Benefit and tax credit income, on the other hand, fell only slightly in real terms meaning that poor households in receipt of benefits and tax credits saw a smaller fall in their real incomes than was the case for middle-income households.
One group which did not experience a reduction in relative low income following the 2008 economic downturn was working-age adults without children. However, this group is less likely to be in receipt of benefits than pensioners or families with children.5
5 DWP, Households Below Average Income, 2010/11, 11 June 2012, p46
2.2 Children 2.7 million children were in relative low income BHC in 2016/17, about the same as the previous year. 19% of children were in relative low income BHC.6
On an AHC basis, there were 4.1 million children in relative low income, 100,000 more than the previous year. 30% of all children were in relative low income AHC.
The number of children in absolute low income BHC was 2.2 million, a decrease of 200,000 from the previous year. 16% of children were in absolute low income BHC.
3.5 million children were in absolute low income AHC, also down 200,000 from the previous year. 26% of children were in absolute low income AHC.
6 Children are defined here as people aged under 16, or who are aged 16-19, not
married or co-habiting and in full-time non-advanced education.
% of children in absolute low incomeGreat Britain (1997/98-2001/02) and UK (2002/03-)
AHC
BHC
Number 7096, 31 August 2018 12
2.3 Pensioners When analysing pensioner incomes, it is often more useful to look at incomes AHC since around three-quarters of pensioners own their homes (otherwise we may get a misleading impression of the relative living standards of pensioners who do not own their home and so incur significantly higher housing costs). Pensioners are defined as all adults above State Pension age.
1.9 million pensioners were in relative low income AHC in 2016/17, about the same as the year before. 16% of pensioners were in relative low income AHC. (On a BHC measure, 2.1 million pensioners were in relative low income, unchanged from the previous year. This was around 17% of all pensioners.)
1.5 million pensioners were in absolute low income AHC in 2016/17, 100,000 fewer than the previous year. 13% of all pensioners were in absolute low income AHC. (On a BHC measure, the number in absolute low income fell by around 100,000 to 1.7 million, 15% of all pensioners.)
% of pensioners in absolute low incomeGreat Britain (1997/98-2001/02) and UK (2002/03-)
BHC
AHC
13 Poverty in the UK: statistics
2.4 Working-age adults There were 5.7 million working-age adults in relative low income BHC in 2016/17, 15% of all working-age adults. This was about the same as the previous year.
The likelihood of being in low income varies by family status. 16% of adults with dependent children (“working-age parents”) were in relative low income BHC, slightly lower than the previous year. The proportion of working-age adults without children in relative low income BHC remained about the same at 14%. Over the longer term, the trend in poverty rates for those with children has contrasted with the trend for those without children, as discussed below.
Based on incomes AHC, 8.2 million working-age adults were in relative low income in 2016/17. This was 200,000 more than the previous year.
21% of all working-age adults were in relative low income AHC. The rate was higher for working-age parents at 26%, compared to 19% for working-age adults without dependent children.
Note: figures for 1997/98 to 2001/02 are for Great Britain; figures for 2002/03 onwards are for the UK.
5.0 million working-age adults were in absolute low income BHC, 200,000 fewer than the previous year. This was 13% of all working-age adults. The rate was 14% for working-age parents and 12% for those without children.
On an AHC basis, the number of working-age adults in absolute low income fell by 100,000 from the previous year to 7.4 million. This was 19% of all working-age adults. The rate of absolute low income AHC was 22% for working-age parents and 17% for those without children.
As can be seen from the charts, over the past twenty years, poverty rates for working-age adults with children have followed a different trend to rates for those without children. Firstly, the likelihood of being in relative low income declined during the late 1990s and early 2000s for working-age adults with children, but increased for those without children. One reason for this is the contrast in state support for families with and without children under the 1997-2010 Labour government, as explained by the Institute for Fiscal Studies:
The increase in the generosity of state support for low-income families with children and pensioners stands in stark contrast to the lack of priority in this area attached to the childless working-age population. Indeed, direct tax and benefit reforms under
Note: figures for 1997/98 to 2001/02 are for Great Britain; figures for 2002/03 onwards are for the UK.
Labour had almost no net impact on poverty rates among that group. 7
Poverty trends for working-age parents and those without children diverged again after the 2008 recession. Unlike pensioners or families with children, there was no decrease in relative low income among working-age adults without children after 2007/08. People in this group tend to draw more of their income from earnings and less from benefits than pensioners or families with children, so were particularly affected by real terms falls in earnings following the recession:
Working-age non-parents were the only major demographic group not to see a fall in relative poverty between 2007–08 and 2012–13 (although there was a fall when looking just at the change between 2011–12 and 2012–13; however, this was not significant). This is a group who are, on average, more reliant on earnings and less reliant on benefits than children and pensioners, even when focusing only on low income groups. In 2012–13, benefits made up 88% of household income for the poorest 30% of pensioners, 62% for the poorest 30% of children and 38% for the poorest 30% of working-age non-parents. This helps to explain why they benefited less from the rise in benefits relative to earnings during the recession. In addition, working-age adults without dependent children are relatively likely to be young adults, and […] adults aged under 30 saw the largest falls in wages and employment rates during the recession. 8
More recently, between 2013/14 and 2014/15 the risk of relative low income increased among families with children but this was not the case for those without children. This can be attributed to families with children benefiting less from increases in full-time work than childless families, as well as the 1% uprating of some benefits.9
2.5 Under-reporting of benefit income is likely to inflate poverty estimates
Poverty levels may be somewhat lower that stated in the official statistics once we make adjustment for households under-reporting the amount they receive in benefits.
Estimates of relative and absolute low income are obtained from the Family Resources Survey, which surveys over 19,000 households in the UK each year. Although this is recognised as the best source of data on the distribution of household incomes in the UK, it does not perfectly record all income received by a household. In particular, the survey underestimates the total amount of benefit income received by households compared to administrative data on what the government actually pays out in benefits.
Analysis by the Resolution Foundation, a think tank, indicates that benefit income as recorded in the Family Resources Survey in 2016/17
7 R Joyce and L Sibieta (2013), An assessment of Labour’s record on income inequality
and poverty, Oxford Review of Economic Policy, vol. 29, pp. 178–202. 8 C Belfield et al, Living standards, poverty and inequality in the UK: 2014, IFS Report
96, 15 July 2014, p80 9 DWP, Households below average income: an analysis of the income distribution
only came to 82% of actual government expenditure on benefits for private households in the UK. This left an unexplained gap of £37 billion compared to government expenditure, or around 4% of total disposable income reported in the survey. The gap has increased from around 2% of total disposable income at the start of the 2000s.10
The under-reporting of benefit income is likely to have the greatest impact on income estimates for households at the lower end of the income distribution, since these households tend to draw a larger share of their total income from benefits. If this is indeed the case, then incomes across the bottom half of the distribution will be higher relative to median income than is reported in the Family Resources Survey. That would mean official estimates for the proportion of people in relative low income are overstated.
How do poverty estimates change when we factor in the missing benefit income? There is no easy way to correct the survey data so that it balances with the administrative data on benefit expenditure, because we cannot know which households in the survey are under-reporting their income from benefits. Nevertheless, estimates from the Resolution Foundation suggest that once we adjust for the ‘missing’ benefit income in the Family Resources Survey then 18% of people were in relative low income AHC in 2016/17, compared to an estimate of 22% based on the unadjusted survey data.11
After adjusting for the missing benefit income, poverty levels are estimated to be lower in every year since 1994/95. What is more, the adjusted data suggest that poverty levels fell more quickly during the 2000s than is indicated by the unadjusted data.
10 Adam Corlett et al, The Living Standards Audit 2018, Resolution Foundation Report,
24 July 2018, pp48-54 11 Ibid, p65
Headline estimate (unadjusted)
Estimate adjusted for missing benefit
income
All people 22% 18%
Children 30% 24%
Working-age adults 21% 18%
Pensioners 16% 11%
% of people in relative low income after housing costs, GB, 2016/17: Resolution Foundation estimates
Poverty levels are lower when we account for under-reporting of benefit income
Source: Resolution Foundation estimates, published in Adam Corlett et al, The Living Standards Audit 2018 , July 2018
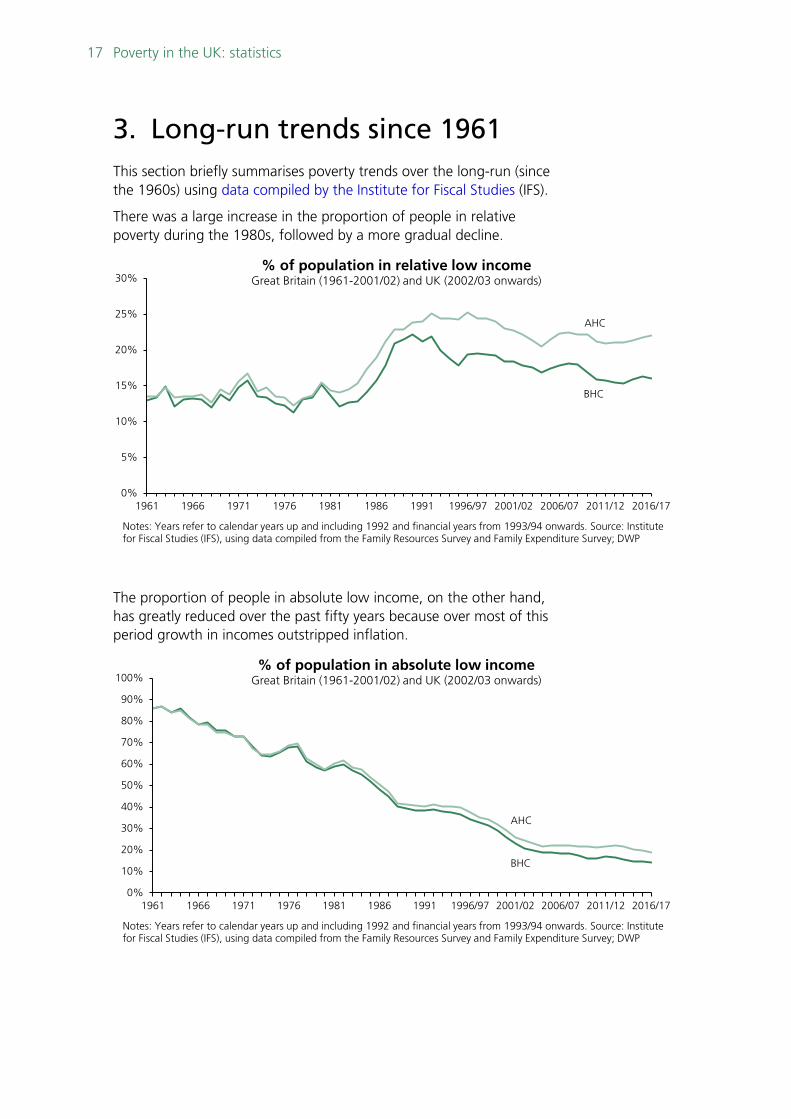
3. Long-run trends since 1961 This section briefly summarises poverty trends over the long-run (since the 1960s) using data compiled by the Institute for Fiscal Studies (IFS).
There was a large increase in the proportion of people in relative poverty during the 1980s, followed by a more gradual decline.
The proportion of people in absolute low income, on the other hand, has greatly reduced over the past fifty years because over most of this period growth in incomes outstripped inflation.
Notes: Years refer to calendar years up and including 1992 and financial years from 1993/94 onwards. Source: Institute for Fiscal Studies (IFS), using data compiled from the Family Resources Survey and Family Expenditure Survey; DWP
% of population in relative low incomeGreat Britain (1961-2001/02) and UK (2002/03 onwards)
Notes: Years refer to calendar years up and including 1992 and financial years from 1993/94 onwards. Source: Institute for Fiscal Studies (IFS), using data compiled from the Family Resources Survey and Family Expenditure Survey; DWP
% of population in absolute low incomeGreat Britain (1961-2001/02) and UK (2002/03 onwards)
These overall trends mask marked differences between groups. The proportion of pensioners in poverty is much lower now than during the 1960s, but poverty rates for children and working-age adults are higher than they were 50 years ago. Poverty rates for children, pensioners and working-age adults converged after the economic downturn in 2008 and are currently much closer than has historically been the case.
Notes: Years refer to calendar years up and including 1992 and financial years from 1993/94 onwards. Source: Institute for Fiscal Studies (IFS), using data compiled from the Family Resources Survey and Family Expenditure Survey; DWP
% of population in relative low income BHCGreat Britain (1961-2001/02) and UK (2002/03 onwards)
Pensioners
Children Working-age,with children
Working-age,without children
19 Poverty in the UK: statistics
4. Prospects for future years Projections produced by the Institute for Fiscal Studies (IFS) and published in November 2017 suggested that the share of children in relative low income will increase sharply between 2015/16 and 2021/22, assuming no change in government policy.12 These projections were prepared before the publication of the latest poverty estimates for 2016/17.
While the proportion of children in relative low income after housing costs is expected to be around 7% points higher by the end of the period, poverty rates for pensioners and working-age adults without dependent children are projected to remain about the same. The overall effect is that the share of the total population in relative low income is expected to increase by around 2% points to reach 24% in 2021/22, similar to the rate for 1999/00.
The share of the total population in absolute low income after housing costs is expected to remain broadly flat between 2015/16 and 2021/22, but again this hides marked differences between population groups as shown in the chart below. Although rates of absolute low income are expected to decrease slightly for pensioners and working-age adults without children, the rate for children is expected to increase by around 4% points.
The IFS analysis prefers to look at trends in poverty based on incomes after housing costs, for reasons outlined in Box 2.1 of their report. Nevertheless, the projected trends in absolute and relative low income are similar whether we use incomes before or after housing costs.
12 A Hood and T Waters, Living Standards, Poverty and Inequality in the UK: 2017-18
to 2021-22, IFS Report R136, 2 November 2017.
Solid lines are actual percentages of people in poverty, dashed lines are projections
The differences between the projected paths for child poverty and poverty among adults without dependent children reflect the main income sources for different groups. Projected trends for pensioners and adults without children largely depend on forecast earnings growth. Working-age adults without children draw a larger share of their income from earnings than families with children, while for pensioners, the current pensions ‘triple lock’ means that income from the state pension is expected to increase at least in line with average earnings growth. However, families with children draw a higher share of their income from benefits and tax credits and so are particularly affected by changes to the benefits system as discussed in the following section.
4.1 Children The proportion of children in relative low income is expected to increase sharply from 30% in 2015/16 to 37% in 2021/22 based on incomes after housing costs, or from 20% to 27% based on incomes before housing costs. That would put the share of children in relative low income after housing costs at its highest level for as far back as we have consistent data (the 1960s), or based on income before housing costs, at its highest level since 1993.
The proportion of children in absolute low income is projected to rise from 27% in 2015/16 to 31% in 2021/22 based on incomes after housing costs, and from 17% to 22% based on incomes before housing costs. In both cases, this would mean the share of children in absolute low income returns to 2007/08 levels.
The IFS identifies two main drivers of the expected increase in children in relative low income:
• Firstly, forecast earnings growth will benefit poorer households with children less than it does middle-income households. This is because poorer households receive a smaller share of their income from earnings and a larger share from benefits. But since the threshold for relative low income increases in line with median
Solid lines are actual percentages of people in poverty, dashed lines are projections
% of people in absolute low income, UK, 2007/08-2021/22After housing costs
Children
Pensioners
Working-agewithout children
21 Poverty in the UK: statistics
income, a higher share of poorer households with children will be left below the threshold. (This matters less for absolute low income, where the threshold moves in line with inflation.)
• The second factor driving the increase in relative low income – and the primary factor behind the projected increase in absolute low income – is planned benefit cuts. Planned tax and benefit reforms explain around two-fifths of the increase in the share of children in relative low income after housing costs, and around three-quarters of the increase in absolute low income.
In particular, the introduction of the two-child limit in tax credits and Universal Credit will have a substantial impact on incomes of poor households with three or more children. This reform is expected to increase the proportion of children in absolute low income after housing costs by around 2% points by 2019/20-2021/22.
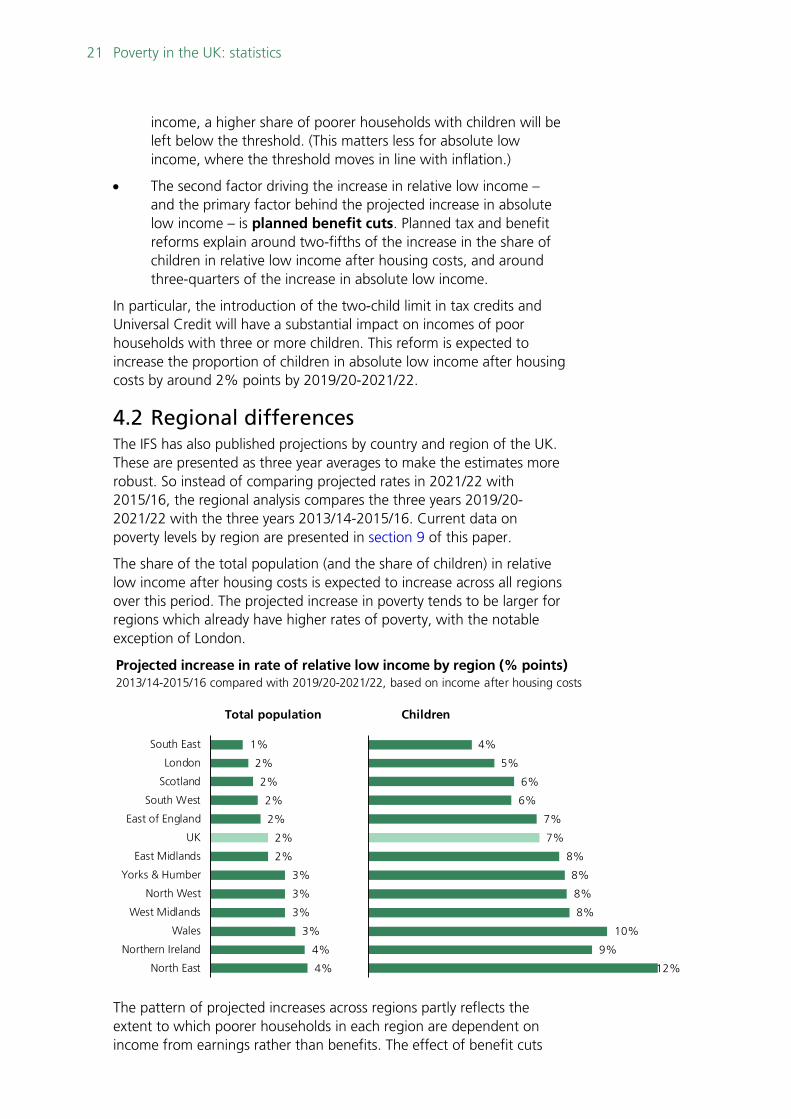
4.2 Regional differences The IFS has also published projections by country and region of the UK. These are presented as three year averages to make the estimates more robust. So instead of comparing projected rates in 2021/22 with 2015/16, the regional analysis compares the three years 2019/20-2021/22 with the three years 2013/14-2015/16. Current data on poverty levels by region are presented in section 9 of this paper.
The share of the total population (and the share of children) in relative low income after housing costs is expected to increase across all regions over this period. The projected increase in poverty tends to be larger for regions which already have higher rates of poverty, with the notable exception of London.
The pattern of projected increases across regions partly reflects the extent to which poorer households in each region are dependent on income from earnings rather than benefits. The effect of benefit cuts
Projected increase in rate of relative low income by region (% points)2013/14-2015/16 compared with 2019/20-2021/22, based on income after housing costs
ChildrenTotal population
4%
4%
3%
3%
3%
3%
2%
2%
2%
2%
2%
2%
1%
North East
Northern Ireland
Wales
West Midlands
North West
Yorks & Humber
East Midlands
UK
East of England
South West
Scotland
London
South East
12%
9%
10%
8%
8%
8%
8%
7%
7%
6%
6%
5%
4%
Number 7096, 31 August 2018 22
over this period will be more pronounced in regions where benefits tend to comprise a larger share of total income for poor households. But where poor households draw a larger share of their income from earnings, then these households will be more able to benefit from expected growth in real earnings.
In the absence of any official macroeconomic forecasts by region from the Office for Budget Responsibility, these regional projections assume average earnings and rents grow at the same pace across all regions over the relevant period. The IFS acknowledges this a simplistic assumption and is highly uncertain. Nevertheless, it represents a “broadly central expectation on the basis of recent historical patterns”.
4.3 Limitations In general, the projections obviously come with much uncertainty. They build on macroeconomic forecasts produced by the Office for Budget Responsibility (OBR) and demographic projections from the Office for National Statistics (ONS), which are themselves uncertain.
The projections were published on 2 November 2017 so do not take into account the latest poverty estimates for 2016/17 as published in the latest Households below average income release (22 March 2018). Nor do they account for more recent economic and demographic forecasts, including those made by the OBR at the time of the November 2017 Budget or March 2018 Spring Statement.
In particular, in November 2017 the OBR revised down its forecasts for productivity growth and average earnings growth. Weaker growth in earnings is likely to translate into slightly higher rates of absolute low income. Rates of relative low income across the population as a whole are less sensitive to variations in average earnings growth (although differences are somewhat more pronounced for families with children than for other population groups).13
Similarly the projections do not reflect possible impacts from more recent policy announcements. The IFS notes that “changing policies, and the speed at which benefit claimants are transitioned to universal credit differing from current forecasts, are major reasons why actual future poverty rates might diverge from our projections.” Instead, the projections offer an estimate of future poverty levels in a scenario where policy remains unchanged.
The projections do not account for possible behavioural responses to tax and benefit changes. If changes lead to some individuals entering employment or increasing their earnings, actual trends may be more favourable than the projections suggest.
13 Projections published in March 2017 projected rates of absolute and relative low
income based on three scenarios for average earnings growth. Rates of absolute low income were higher in the low earnings growth scenario compared to the central projection and high earnings growth scenario. See A Hood and T Waters, Living Standards, Poverty and Inequality in the UK: 2016-17 to 2021-22, IFS Report R127, 2 March 2017, p28
5. Poverty dynamics Households may move in and out of poverty from year to year. The figures presented earlier in this note are a snapshot of the number of people in poverty at one point in time and do not tell us how many people are entering or exiting poverty each year, or for how long someone experiences poverty. For information on the duration of poverty we need to turn to surveys which track individuals over a number of years.
5.1 Persistent poverty An individual is defined as being in persistent low income if they are in relative low income for at least three out of the past four years.14
Between 2012/13 and 2015/16, 9% of individuals were in persistent low income before housing costs (BHC) and 12% were in persistent low income after housing costs (AHC), based on data from the Understanding Society survey.15
• On an AHC basis, children were most likely and pensioners were least likely to experience persistent low income compared to other population groups, as shown in the table below.
• On a BHC basis, children were most likely and working-age adults were least likely to experience persistent low income. However, since most pensioners own their own homes, their housing costs tend to be lower than for other groups.
These statistics are classed as ‘experimental statistics’ meaning they are still in development. The figures are collected via the Understanding Society survey, which gives a slightly lower estimate for the proportion of people in relative low income in 2015/16 than the Family Resources Survey (the main source of statistics on relative and absolute low income). This is true both on a BHC and AHC basis, although the difference is larger AHC.
14 This was the definition used in the Child Poverty Act 2010, which set targets (later
removed by the Welfare Reform and Work Act 2016) for reducing child poverty as counted using four different poverty measures, including persistent low income.
15 Figures are published in DWP, Income Dynamics, 2010 to 2016, 22 March 2018
BHC AHC BHC AHC
All individuals 9% 12% 15% 18%
Children 11% 17% 19% 27%
Working-age adults 8% 11% 13% 17%
Pensioners 10% 7% 16% 12%
Source: DWP, Income dynamics , Tables 1 and M.9 (based on Understanding Society survey)
* These figures are not the official estimates for the proprotion of people in relative low income; rather they are provided here for comparative purposes only. Official estimates for relative low income are collected via the Family Resources Survey and are set out in section 2.
Persistent low incomeCompared to % of people in relative low income, 15/16*
% of people in persistent low income: UK, 2012/13 to 2015/16
Who experiences persistent low income? The likelihood that an individual is in persistent low income varied according to the employment status of the family and housing tenure, among other factors. Rates of persistent low income were particularly high for the following groups (based on people’s circumstances at the start of the four year period 2012/13 to 2015/16):16
• 19% of individuals living in families where no adults worked were in persistent low income BHC and 21% AHC.
• 19% of individuals in social rented accommodation were in persistent low income BHC and 31% AHC.
• Although the proportion of people in private rented accommodation in persistent low income BHC was slightly lower than average at 8%, the proportion increased to 20% based on incomes AHC.
• 18% of adults with no qualifications were in persistent low income BHC and 18% AHC.
• Levels of persistent low income were higher in households where the head of household was from a Black or Asian background: 20% of people from a Black background were in persistent low income BHC and 29% AHC. For people from an Asian background, the proportions were similar at 20% BHC and 27% AHC.
• 20% of children in lone parent families were in persistent low income BHC and 29% AHC.
• In families with three or more children, 19% of children were in persistent low income BHC and 25% AHC.
The rate of persistent low income for families with children and pensioners has decreased since the start of the 1990s. However, the rate has increased for single working-age people without children. This is similar to the trends in the proportion of people in relative low income in any one year, as discussed in section 2 of this briefing paper.17
Other estimates: EU-SILC survey The figures above are taken from DWP’s Income Dynamics publication, which is based on the Understanding Society survey. This survey has been running since 2009/10 and replaced the older British Household Panel Survey. Data from the older survey were formerly published in a DWP release, Low Income Dynamics.18
Current data on persistent low income is also collected through the European Union Statistics on Income and Living Conditions (EU-SILC) survey.19 This source similarly indicates around 9% of the UK
16 For some individuals, their circumstances will have changed over this period. For
example, the group of individuals living in families where no one was in work in 2012/13 will include individuals who were working in subsequent years.
17 DWP, Income Dynamics, 2010 to 2016, 22 March 2018, Table 2.1 and DWP, Low-Income Dynamics: 1991-2008 (Great Britain), September 2010, Table 8.1
18 The last release was published in September 2010 and provided statistics for four year periods from 1991-1994 up to 2005-2008.
19 Eurostat, Income and Living Conditions database, Persistent at-risk-of-poverty rate by sex and age - EU-SILC survey, Table ilc_li21. See also ONS, Persistent Poverty in the UK and EU: 2015, 27 June 2017.
population were in persistent low income BHC in 2016, although it defines income slightly differently to Understanding Society and uses a different definition for persistent low income. Specifically, the EU-SILC survey counts someone as in persistent low income if they are in relative low income in the current year and in at least two out of the three preceding years, based on household income before housing costs.20
5.2 How many people experience poverty? Data from the EU-SILC survey suggest that just under a third (31%) of the total population were in relative low income BHC in at least one of the four years from 2013 to 2016.21
Previous ONS analysis showed that people aged 65 and over were more likely than younger age groups to have been in relative low income in at least one of the four years 2011 to 2014. Single parent and single adult households were more likely to have experienced relative low income than households with two or more adults.22
5.3 Poverty entry and exit rates Understanding Society provides estimates of the proportion of people entering and exiting low income between one year and the next. It uses a strict definition of entry and exit so that the estimates “only include ‘clear’ transitions” into and out of low income. Thus only people who move from having an income above the relative low income threshold to having an income at least 10% below the threshold in the following year are counted as entering poverty. Similarly, for someone to be counted as exiting poverty, they must go from having an income below the threshold to having an income at least 10% above the following year’s threshold. Figures refer to income before housing costs.23
• On this basis, around a third of the population (33%) in relative low income in 2014/15 were no longer in relative low income the next year (the “exit rate”).
• Of those people not in relative low income in 2014/15, around 5% were in relative low income in 2015/16 (the “entry rate”).
The exit rate is calculated as a percentage of the population in relative low income while the entry rate is calculated as a percentage of the population not in relative low income. Since there are many fewer people in poverty than there are people not in poverty, the exit rate is much higher than the entry rate.
ONS analysis of the EU-SILC survey reports higher poverty entry and exit rates, in part because it does not use as strict a definition of entry and exit. Instead, if someone moves from below the relative low income threshold in one year to just above the threshold in the next, then that
20 In the Understanding Society figures, an individual may be counted as in persistent
low income even if they are not in relative low income in the current year. 21 Eurostat, Income and Living Conditions database, Distribution of population by
number of years spent in poverty within a four-year period, Table ilc_li51 22 ONS, Persistent Poverty in the UK and EU: 2014, 16 May 2016 23 DWP, Income Dynamics, 2010 to 2016, 22 March 2018
is counted as an exit and similarly for entries. Based on this source, between 2011 and 2014:24
• Around half of the population (50%) who were in relative low income in one year were no longer in relative low income the next year.
• Of those who were not in relative low income in the first year, around 7% were in relative low income in the next.
Figures refer to incomes BHC. Older data for the proportions of people entering and exiting poverty over the period 1991-2008 can be found in the DWP Low-Income Dynamics publication.
5.4 Factors associated with entering or exiting poverty
Several reports discuss the reasons or events associated with people entering or exiting poverty. These include:
• DWP, An evidence review of the drivers of child poverty for families in poverty now and for poor children growing up to be poor adults, January 2014 (discussed further below)
• DWP, Child poverty transitions: exploring the routes into and out of poverty 2009 to 2012, June 2015
• ONS, Poverty and employment transitions in the UK and EU: 2007-2012, March 2015
• J Nelson, K Martin and G Featherstone, What Works in Supporting Children and Young People to Overcome Persistent Poverty? A Review of UK and International Literature, Office of the First Minister and Deputy First Minister (OFMDFM) of Northern Ireland, May 2013
• DWP, Low-Income Dynamics: 1991-2008 (Great Britain), September 2010 (in particular see Tables 10.1 and 11.1)
In particular, the DWP Evidence Review investigated the extent to which different factors contribute to children’s chances of exiting or remaining in relative low income. The Review considered firstly the factors which make it harder for families currently in poverty to exit it in the short term, and secondly the factors which increase children’s chances of being in poverty as adults.
The relative importance of various factors were assessed by considering their (i) Certainty – does the factor have an effect; (ii) Strength – how big is the effect; (iii) Coverage – how many children are affected. These are summarised in the tables below, although individual factors are discussed in depth in Chapter 4 of the Review.25
The Review found that the most important factors standing in the way of families exiting poverty now were those factors contributing to a lack of sufficient income from parental employment:
24 ONS, Persistent Poverty in the UK and EU: 2014, 16 May 2016 25 HM Government, An evidence review of the drivers of child poverty for families in
poverty now and for poor children growing up to be poor adults, Cm 8781, January 2014, pp6-8
Although educational attainment does not have a bearing on poverty in the short term, it was identified as the main driver that causes poor children to become poor adults:
5.5 Government indicators of disadvantage affecting families and children
The Government set out various indicators to be used “to track progress in tackling the disadvantages that affect families’ and children’s lives” in an April 2017 policy paper, Improving Lives: Helping Workless Families.
The indicators fall into nine areas. Six parental indictor areas track worklessness and “associated disadvantages”:
• parental worklessness • parental conflict • poor parental mental health • drug and alcohol dependency • problem debt • homelessness
Three indicator areas look at outcomes for children and young people:
• early years • educational attainment • youth employment
Statutory “life chances” indicators relating to children in workless households in England and educational attainment of children at the end of Key Stage 4 in England, as introduced by the Welfare Reform and Work Act 2017, come under the parental worklessness and educational attainment indicator areas respectively.26
The latest data on each indicator is published as part of a DWP evidence base for the Improving Lives: Helping Workless Families publication. A detailed Analysis and Research Pack looks in depth at the characteristics and outcomes for children living in families where no parent is in work and for children experiencing the other kinds of disadvantage reflected in the indicators. It also provides a concise summary of research literature on the relevance of and associations between different indicators.27
26 For further background information on these statutory indicators, see the Library
briefing paper prepared for Second Reading of the Child Poverty in the UK (Target for Reduction) Bill, 2016-17 (1 February 2017).
27 DWP, Improving Lives: Helping Workless Families – Analysis and Research Pack, 4 April 2017
6. Poverty and employment People living in workless families are much more likely to be in poverty than people living in families where at least one person works. Around 38% of working-age adults living in workless families were in relative low income BHC in 2016/17, compared to 10% in families where at least one adult was in work.
Nevertheless, working-age adults living in families where at least one person is in work make up the majority (57%) of all working-age adults in relative low income. This reflects the fact there are many more working than workless households to begin with: 83% of working-age adults live in families where at least one person works.
The same holds true for child poverty: 50% of children in workless families were in relative low income BHC compared to 15% in families where at least one person works. But since there are many more working than workless families, children living in working families comprise the majority (66%) of children in relative low income.
The risk of relative low income for children in workless families is lower than at the end of the 1990s, as shown in the chart on the left below. Following the 2008 recession, there was a sharp reduction in the proportion of children in workless families in relative low income. Although real incomes from employment fell after the recession, benefit income (which is the most important income source for workless families) was more stable. However, the past three years have seen a clear break from the longer term trend as the proportion of children in workless families who are in relative low income increased from 38% in 2013/14 to 50% in 2016/17.
For families where at least one adult is in work (“working families”), the proportion of children in relative low income has remained broadly similar over the past twenty years.
By economic status of adults in the family: UK, 2016/17% of people (all ages) in relative low income
Before housing costs After housing costs
Single/couple all in full-time work
Couple, one full-time, one part-time
One or more full-time self-employed
Couple, one full-time, one not working
Workless, one or more aged 60+
No full-time, one or more part-time
Workless, other economically inactive
Workless, one or more unemployed
3%
6%
19%
19%
21%
23%
38%
62%
7%
10%
25%
29%
20%
33%
55%
75%
Number 7096, 31 August 2018 30
During this period, the total population of children living in working families has increased and the population living in workless families has decreased. As the total number of children living in workless families has decreased along with the risk of poverty for these children, children in working families have formed an increasing share of all children in poverty. This is shown in the chart on the right.
Looking at the working-age adult population, the share of individuals in poverty who live in working families has also increased over the past decade but changes are more muted than for children. The risk of poverty for individuals in both working and workless families remained fairly steady until the 2008 recession. After 2008, there was a reduction in the proportion of working-age adults in workless families who were in relative poverty.
Note: figures for 1994/95 to 2001/02 are for Great Britain; figures for 2002/03 onwards are for the UK
0
10
20
30
40
50
60
70
80
97/98 01/02 05/06 09/10 13/14
% of children in working/workless families who are in relative poverty BHC
Workless families
Working families
0
10
20
30
40
50
60
70
80
97/98 01/02 05/06 09/10 13/14
% of children in relative poverty BHC who live in working families
Note: figures for 1994/95 to 2001/02 are for Great Britain; figures for 2002/03 onwards are for the UK
0
10
20
30
40
50
60
70
80
97/98 01/02 05/06 09/10 13/14
% of working-age adults who are in relative poverty BHC
Workless families
Working families
0
10
20
30
40
50
60
70
80
97/98 01/02 05/06 09/10 13/14
% of working-age adults in relative poverty BHC who live in working families
31 Poverty in the UK: statistics
7. Poverty and housing tenure People living in social rented or private rented accommodation are more likely to be in relative low income after housing costs (AHC) than people who own their home. Around 47% of people in the social rented sector and 35% of people in the private rented sector were in relative low income AHC in 2016/17.
The lack of housing costs for people who own their homes outright means that fewer owner occupiers are counted as being in poverty based on incomes AHC than incomes before housing costs (BHC).28
Around half of children living in both the social and private rented sectors were in relative low income AHC in 2016/17.
Although the proportion of owner occupiers in relative low income AHC is much smaller than the proportion of private or social renters, people who own their own home still formed a third of people (and a quarter of all children) in relative low income AHC in 2016/17. This is because the overall population who are owner occupiers is larger than the population living in the private or social rented sectors.
The rate of relative low income within each sector is lower than it was at the end of the 1990s, as shown in the first of the charts below. However, over the same period the private rented sector has greatly increased in size, with the result that a higher share of all poor people are now living in the private rented sector. Around 12.9 million people
28 Housing costs include mortgage interest payments but exclude mortgage capital
repayments.
Before housing costs After housing costs
UK, 2016/17% of people (all ages) in relative low income, by housing tenure
Buying with mortgage
Owned outright
Private rented
Social rented
9%
18%
17%
27%
10%
13%
35%
47%
Before housing costs After housing costs
% of children in relative low income, by housing tenureUK, 2016/17
Buying with mortgage
Owned outright
Private rented
Social rented
12%
20%
23%
33%
13%
16%
48%
53%
Number 7096, 31 August 2018 32
in the UK were living in private rented housing in 2016/17, up from 5.0 million in 1997/98.29 This can be attributed to a fall in the proportion of households who own their own home, but also to reduced availability of social rented accommodation for poorer households.30 As the overall size of the private rented sector has grown, the number of people in relative low income AHC living in the private rented sector has increased from 2.1 million to 4.5 million.
Just under a third (32%) of all people in relative low income AHC lived in the private rented sector in 2016/17, similar to the proportion who were owner occupiers or in the social rented sector. This compares to 15% of people in relative low income AHC renting privately in 1997/98.
29 Estimates based on Households below average income microdata analysis. 30 Robert Joyce et al, The cost of housing for low-income renters, Institute for Fiscal
Studies report R132, 13 October 2017; see also Helen Barnard et al, UK Poverty 2017, Joseph Rowntree Foundation Analysis Unit, 4 December 2017, p46
The risk of poverty for different tenure types has decreased since the 1990s…
… but as the total private rented sector has grown, so has the number of poor people who are private renters% of people in relative low income AHC who live in different tenure types
Figures for 1994/95 to 2001/02 are for Great Britain; figures for 2002/03 onwards are for UK.
% of people (all ages) in relative low income AHC
Source: DWP Households below average income , 2016/17 release and microdata analysis
8. Poverty and disability Poverty rates are higher among families where at least one member is disabled, compared to families where no one is disabled. In 2016/17:
• The proportion of people in relative low income before housing costs (BHC) was 19% for families where someone is disabled, compared to 15% for people living in families where no one is disabled.
• The rate of relative low income after housing costs (AHC) was 26% for families where someone is disabled, compared to 20% for those where no one is disabled.
People living in families where someone is disabled comprised around 40% of the population in relative low income in 2016/17, both BHC and AHC. This compares to 34% of people across the total UK population living in families where someone is disabled.
However, these figures take no account of the additional living costs that people with disabilities might face. If we could take these costs into account then it is very likely that more disabled people would be counted as living in poverty, but this is complicated by the fact that costs vary widely both in nature and level. Nevertheless, the measure of income used to calculate the relative low income threshold does include benefits paid as a contribution towards the extra costs of disability: Disability Living Allowance (DLA), Attendance Allowance (AA) and Personal Independence Payment (PIP). Around 10% of the total UK population live in families in receipt of disability benefits. Excluding these benefits from income means more families with a disabled member are counted as being in relative low income:
Using this adjusted measure of income, then people living in families where someone is disabled made up around 46% of the total population in relative low income BHC and 45% AHC.
Poverty rates are higher for children living in families where someone is disabled than for the population as a whole. Based on income excluding disability benefits, the rate of relative low income for children living in families where someone is disabled was 25% BHC and 38% AHC. Children in families with a disabled member were more than twice as likely to experience low income and material deprivation (19%) than children in families where no one is disabled (8%). Section 11 provides further information on material deprivation measures.
Before housing costs After housing costs
* Excluding DLA, AA, PIP from household income; UK, 2016/17
% of people in relative low income*, by disabled people in family
No disabled people
1+ disabled person
14%
23%
19%
30%
Number 7096, 31 August 2018 34
9. Regional poverty data
9.1 Relative low income The proportion of individuals in relative low income BHC was highest in Wales (20%) over the three year period 2014/15 to 2016/17 and was lowest in the South East of England (12%). On an AHC basis, the proportion is highest in London (28%). Many more people in London are counted as being in poverty based on incomes AHC owing to the high cost of housing relative to other parts of the UK. Data on poverty trends by region are published alongside this briefing paper.
% of people (all ages) in relative low income by region, 2014/15 to 2016/17
After housing costsBefore housing costs
0% 10% 20% 30%
South East
South West
East of England
London
Scotland
UK
East Midlands
Northern Ireland
Yorks & Humber
North East
North West
West Midlands
Wales
0% 10% 20% 30%
South East
South West
East of England
Scotland
Northern Ireland
East Midlands
UK
Yorks & Humber
North East
North West
West Midlands
Wales
London
Individuals living in relative low income by regionThree year average for 2014/15 to 2016/17
BHC AHC BHC AHC BHC AHC BHC AHC
North East 0.5 0.6 19% 23% 0.1 0.2 24% 33%North West 1.3 1.6 19% 23% 0.4 0.5 23% 32%Yorkshire & Humber 1.0 1.2 19% 22% 0.3 0.3 23% 30%
East Midlands 0.8 1.0 18% 21% 0.2 0.3 22% 29%West Midlands 1.1 1.3 19% 24% 0.3 0.4 24% 34%East of England 0.8 1.1 14% 19% 0.2 0.3 16% 26%
London 1.2 2.4 14% 28% 0.3 0.7 17% 37%South East 1.1 1.6 12% 18% 0.3 0.5 15% 26%South West 0.7 1.0 13% 19% 0.2 0.3 15% 25%
Poverty estimates by country and region are subject to greater sampling variability than estimates for the UK as a whole, since the number of households surveyed is smaller. Therefore these regional estimates are presented as three year averages so that the figures are less volatile.
The Institute for Fiscal Studies has produced projections for the proportion of people in relative and absolute low income by region in the three years ending 2021/22. The projections are discussed in section 4.2 of this paper.31
9.2 Persistent low income The prevalence of persistent low income also varies by region. As discussed in section 5.1, someone is in persistent low income if they have been in relative low income for three out of the past four years.
On a BHC basis, Yorkshire and the Humber had the highest rate of persistent low income (14%) and the South East had the lowest rate (5%) during the period 2012/13 to 2015/16.
On an AHC basis, London had the highest rate (16%) and Scotland had the lowest rate (8%).32
31 A Hood and T Waters, Living Standards, Poverty and Inequality in the UK: 2017-18
to 2021-22, IFS Report R136, 2 November 2017 32 DWP, Income Dynamics, 2010 to 2016, 22 March 2018, Table 2.2
% of people (all ages) in persistent low income by region, 2012/13 to 2015/16
10. Constituency and local area data – child poverty
The official source for poverty statistics for the UK is the annual Households below average income (HBAI) report, published by the Department for Work and Pensions and based on data from the Family Resources Survey, but this only provides data at the national and regional level. Unofficial estimates for child poverty by local area have been published by HMRC and End Child Poverty, based on benefits and tax credits data, although neither source is comparable with the official HBAI figures.
Both the HMRC and End Child Poverty figures attempt to measure the proportion of children falling under an income threshold that is broadly analogous to the “relative low income” threshold in HBAI, although income is defined slightly differently. Both sets of estimates are derived from benefits data, although this approach is problematic in that it gives results inconsistent with the official statistics in HBAI. The End Child Poverty methodology makes some adjustment for this so that figures at least reconcile at the national level, before a further adjustment is made to reflect trends in numbers of working and workless households.
The latest End Child Poverty estimates have a reference date of July-September 2017 while the latest HMRC figures are for August 2015. HMRC presents estimates on a before housing costs (BHC) basis only, but End Child Poverty also reports estimates based on income after housing costs (AHC).
10.1 HMRC estimates The HMRC figures are derived from benefits and tax credits data. Specifically, they show the proportion of children living in families in receipt of out of work means-tested benefits, or living in families in receipt of tax credits with reported income less than 60% of the median.
However, at the national level the HMRC figures overestimate poverty in families in receipt of out-of-work benefits, since all of these families are assumed to be in poverty. Similarly, they underestimate poverty in families where someone is in work compared to the official figures from HBAI. Therefore depending on local circumstances it is possible that estimates for individual constituencies could be substantially different from the actual value.
The latest HMRC estimates are for August 2015. Contrary to the trend indicated in HBAI, these suggest the total number of children in low-income families in the UK fell between 2014 and 2015, from 2.7 million to 2.3 million. The fact the figures are moving in the opposite direction from the official HBAI figures gives further reason to think they may not be a reliable indicator for local areas.
Figures for August each year back to 2006 are available via the following links: 2014; 2013; 2012; 2011; 2010 and previous.
10.2 End Child Poverty estimates The End Child Poverty figures are calculated by academics at the Centre for Research in Social Policy at Loughborough University and build on the HMRC estimates. The starting point is again data on out-of-work benefits and tax credits, but some adjustment is made for the overestimation of poverty in workless families and underestimation of poverty in working families by scaling the HMRC figures so they sum to national estimates from HBAI. However, clearly this is a crude fix.
The End Child Poverty figures are also adjusted for more recent changes in the number of working and workless households at the national level, using data from the Office for National Statistics’ Labour Force Survey (up to July-September 2017). Figures are presented based on income both BHC and AHC, although the AHC figures are obtained by applying a fixed scaling factor to the BHC figures rather than incorporating any additional information about variations in housing costs.33
Estimates for July-September 2017 are published on the End Child Poverty website. An interactive map shows the estimated number and proportion of children in relative low income AHC by constituency.34
The table compares the latest End Child Poverty estimates with official estimates of children in relative low income by region from HBAI. Some of the difference between estimates likely reflects the adjustment for working and workless households in the End Child Poverty figures.
33 For more detail as to how the estimates are constructed, see: Donald Hirsch and
Laura Valadez, Local indicators of child poverty – developing a new technique for estimation, Centre for Research in Social Policy, Loughborough University, July 2014
34 www.endchildpoverty.org.uk/poverty-in-your-area-2018 [accessed 31 August 2018]
Comparison of End Child Poverty (ECP) and HBAI child poverty estimates
11. Material deprivation Poverty may be defined in other ways besides having a low household income. Another approach is to consider if a household is materially deprived, meaning they lack the ability to access key goods or services.
DWP’s Households below average income report includes data on children experiencing both low income and material deprivation, where ‘low income’ means a household income below 70% of the median. 35 Also included are figures for pensioners experiencing material deprivation, for either financial or non-financial reasons.
1.5 million children were in low income and material deprivation in 2016/17, 11% of children in the UK. The proportion has decreased from around 13% in 2014/15, having remained roughly the same between 2010/11 and 2014/15. Figures prior to 2010/11 were based on a different set of deprivation indicators and are not comparable.
The chart shows the proportion of all children (not just those with low household incomes) lacking key goods or services:
35 Library Research Paper 04/23, Poverty: Measures and Targets, provides background
information on the development of the combined low income and material deprivation measure.
Source: DWP, Households below average income, 2016/17 , Tables 4.7 and 4.8db
7%
8%
17%
20%
21%
27%
32%
38%
39%
1%
2%
2%
4%
4%
5%
6%
6%
7%
9%
15%
32%
0% 10% 20% 30% 40% 50%
Keep house warm
Keep up to date with bills
Money to decorate home
Replace broken electrical goods
Home contents insurance
Replace worn out furniture
Money to spend on self each week
Make savings of 10 pounds a month or more
One week's holiday away from home not with relatives
Have a warm winter coat
Celebrations on special occasions
Eat fresh fruit and/or vegetables every day
Go to a playgroup at least once a week
Go on school trip at least once a term
Leisure equipment, e.g. sports equipment or a bicycle
Hobby or leisure activity
Have friends round for tea or a snack once a fortnight
Outdoor space / facilities to play safely
Attend organised activity once a week
Bedrooms for every child aged 10+ of different gender
One week's holiday away from home with family
For
par
ents
For
child
ren
% of children whose parents want but cannot afford specific goods or services for their children or for themselves: UK, 2016/17
800,000 pensioners aged 65 and over experienced material deprivation (but not necessarily low income) in 2016/17, 7% of pensioners in the UK. This is about the same as the previous year but is down from 10% in 2009/10.
For pensioners, the material deprivation measure includes items lacking for non-financial reasons (for example, because of ill health).
Methodology
21 indicators are used to assess material deprivation among families with children, covering access to different goods and services. The indicators were selected using various analytical techniques to determine the best discriminators between those families that are deprived and those that are not. The Family Resources Survey asks respondents whether they have each item and, if not, whether this is because they do not want them or cannot afford them. The questions are reviewed regularly to ensure they remain relevant.
A different suite of 15 indicators is used to assess material deprivation for pensioners. In this case, material deprivation extends to items lacking for either financial or non-financial reasons; for example, respondents are asked whether they lack the item due to reasons such as health/disability, if it is too much trouble or tiring, or if they have no one to help them or do the activity with.
The deprivation indicators are attributed different weights and respondents are counted as in material deprivation when they score above a certain threshold. Further details of the methodology can be found in the HBAI Quality and Methodology Information Report.
Source: DWP Households below average income, 2016/17 , Table 6.11db
1%
1%
1%
2%
2%
3%
4%
5%
6%
8%
9%
9%
10%
20%
37%
0% 10% 20% 30% 40% 50%
At least one filling meal a day
Have a warm waterproof coat
Heating, electrics, plumbing and drains working
Able to pay regular bills
Home kept adequately warm
Home kept in a good state of repair
See friends or family at least once a month
Have a telephone to use, whenever needed
Have a damp-free home
Have hair done or cut regularly
Able to replace cooker if it broke down
Able to pay an unexpected expense of £200
Have access to a car or taxi, whenever needed
Go out socially at least once a month
Take a holiday away from home
% of pensioners who do not have access to specific goods or services: UK, 2016/17
12. Minimum Income Standards Another way of looking at poverty is to consider what income a family needs to meet some minimum acceptable standard of living, known as the “budget standards” approach. This obviously involves some judgement about what constitutes minimum needs. Successive governments have argued there is no single, objective way of determining what constitutes a minimum acceptable income for a particular person or family, although independent researchers have made a number of attempts. Section 2 of Library Research Paper 13/1, Welfare Benefits Uprating Bill, 2013, gives an overview of the debate.
One such attempt is a major annual research project funded by the Joseph Rowntree Foundation, which estimates Minimum Income Standards (MIS) for different household types in the UK. This involves in-depth consultation with members of the public, combined with expert knowledge, to identify the level of income required to meet a minimum acceptable standard of living: “having what you need in order to have the opportunities and choices necessary to participate in society.” The first findings were published in 2008 and are updated each year.36
For most household types, the MIS is well above the relative low income threshold. This suggests that even if someone is not counted as being in relative low income, their income may still be too low for them to have what is considered a minimum acceptable standard of living:
When income is measured BHC, the MIS is higher than the relative low income threshold (based on figures for 2016/17) for each of the four household types in the above table. Based on income AHC, the MIS is 36 A Davis, D Hirsch, M Padley and C Shepherd, A Minimum Income Standard for the
UK in 2018, Joseph Rowntree Foundation, 2 July 2018
Threshold for relative low income is 60% of median income
Single, Couple, Couple, Lone parent,working age pensioner 2 children 1 child
Before housing costs
Relative low income threshold £198 £296 £414 £258
MIS excluding childcare and council tax £288 £364 £544 £376
% difference 46% 23% 31% 46%
After housing costs
Relative low income threshold £148 £255 £357 £199
MIS excluding childcare, council tax, water rates, rent £191 £273 £444 £282
% difference 29% 7% 24% 42%
Source: A Davis, D Hirsch, M Padley and C Shepherd, A Minimum Income Standard for the UK 2008-2018 , 2 July 2018; DWP Households below average income, 2016/17 , Table 2.4ts
Minimum Income Standards (MIS) for 2018 compared with threshold for relative low income in 2016/17: UK, £ per week
Note: income figures are equivalised to take account of household needs, which means that the median is higher for larger households. The figures for families with children assume that all children are aged under 14 years.
similar to the relative low income threshold for pensioner couples, but is considerably higher for the other three household types in the table. The 2015 MIS report suggests that “the more meaningful comparison is between net MIS budgets and income after housing costs” given the difficulty in quantifying the ‘minimum’ cost of housing.
Number of people with income below the standard Around 18.9 million people had income below the MIS in 2015/16, up from 15.6 million in 2008/09. The share of the population with income below the MIS increased from 26% to 30%.37
More people also had an income substantially below the MIS (less than 75% of the MIS), up from 9 million in 2008/09 to 11 million in 2015/16.
Children are much more likely to have income bellows the MIS than older age groups: 44% of children lived in households with income below the MIS, compared to 29% of working-age adults and 15% of pensioners. For all groups, the likelihood of having income below the MIS has increased since 2008/09.
How has the standard changed over time? The increase in the number of people with income below the MIS occurred between 2008/09 and 2013/14, with the number falling back slightly in the following two years to 2015/16. The same was true of the number of people with income below 75% of the MIS. However, the proportion of people in relative low income has followed a different pattern, decreasing between 2008/09 and 2013/14 but then increasing again (both before and after housing costs).
These contrasting trends can be explained by the fact that the relative low income threshold is set with reference to median income, which is not the case for the MIS. After adjusting for inflation, median income was lower in 2013/14 than in 2008/09, which pushed down the threshold below which someone is counted as in relative low income. Meanwhile the income required to meet a minimum acceptable standard of living, as measured by the MIS, increased. So while fewer people were below the relative low income threshold, more people were below the MIS threshold. Since 2013/14, the situation has reversed as median incomes have increased faster than the MIS.38
The main reason why the MIS has increased faster than CPI inflation since 2008 is likely to be a rise in the prices of goods and services required for a minimum acceptable standard of living. (Some of the increase is also due to changes in what goods and services are included in the MIS calculation.) The CPI looks at average spending patterns across all households, but the MIS looks at the cost of a collection of more basic goods and services and does not include ‘luxury’ items. Thus the MIS puts more weight on certain items that have risen significantly faster than the overall CPI since 2008, including public transport,
37 M Padley, L Valadez-Martinez and D Hirsch, Households below a Minimum Income
Standard: 2008/09-2015/16, Joseph Rowntree Foundation, 16 November 2017 38 Ibid, section 3, pp14-18
domestic fuel and food. The relative low income threshold on the other hand does not bear any relation to prices.39
Another difference between the MIS and the relative low income measure is how they account for household size and composition. The proportion of people in relative low income is measured with reference to equivalised household incomes, in order to compare living standards between households of different sizes or compositions. The equivalisation process uses a standard scale to compare between households of different sizes. For the MIS, however, annual income requirements for each household type are calculated separately so there is no fixed ratio that relates the MIS for a single adult, say, to that for a couple household. The MIS calculation also distinguishes between pensioner and non-pensioner households. Compared to the MIS research, the standard equivalisation scales in the official statistics “underestimate the relative cost of each additional child and also underestimate the cost of a lone parent family compared to a couple family”.40
39 A Davis, D Hirsch, M Padley and C Shepherd, A Minimum Income Standard for the
UK in 2018, Joseph Rowntree Foundation, 2 July 2018, p41 40 Ibid, p43
The House of Commons Library research service provides MPs and their staff with the impartial briefing and evidence base they need to do their work in scrutinising Government, proposing legislation, and supporting constituents.
As well as providing MPs with a confidential service we publish open briefing papers, which are available on the Parliament website.
Every effort is made to ensure that the information contained in these publically available research briefings is correct at the time of publication. Readers should be aware however that briefings are not necessarily updated or otherwise amended to reflect subsequent changes.
If you have any comments on our briefings please email [email protected]. Authors are available to discuss the content of this briefing only with Members and their staff.
If you have any general questions about the work of the House of Commons you can email [email protected].
Disclaimer - This information is provided to Members of Parliament in support of their parliamentary duties. It is a general briefing only and should not be relied on as a substitute for specific advice. The House of Commons or the author(s) shall not be liable for any errors or omissions, or for any loss or damage of any kind arising from its use, and may remove, vary or amend any information at any time without prior notice.
The House of Commons accepts no responsibility for any references or links to, or the content of, information maintained by third parties. This information is provided subject to the conditions of the Open Parliament Licence.