Poverty Measurement in the Philippines 1 Lisa Grace S. Bersales Na;onal Sta;s;cian Philippine Sta;s;cs Authority 1 presented at the Side Event on Mul;dimensional Poverty Measurement, 46 th Session of the UN Sta;s;cal Commission
Transcript
Poverty Measurement in the Philippines1
Lisa Grace S. Bersales
Na;onal Sta;s;cian
Philippine Sta;s;cs Authority
1 presented at the Side Event on Mul;dimensional Poverty Measurement, 46th Session of the UN Sta;s;cal Commission
Official Poverty Sta;s;cs in the Philippines
• Highly an;cipated by many stakeholders • Income-‐based
• Compared with self-‐rated poverty sta;s;cs by a private group
• Need to capture other dimensions
• Technical CommiOee on Poverty Sta;s;cs provides guidance
23.4 22.9 22.3 19.1
57
48.5
53 50.5
0
10
20
30
40
50
60
1 2 3 4
poverty incide
nce(%)
Year
Poverty Incidence for Families Philippines
Official poverty incidence
self-‐rated poverty incidence
2006 2009 2012 2013
Study by Planning Minister
• Multidimensionality of poverty: No longer debatable “Multiple deprivations of different kinds… experienced simultaneously by the poor” “beyond growth much needs to be done to make development more inclusive “
• No one-for-one correspondence between income poverty & other deprivations • Increasing demand from policy makers • New methodologies exist • Alkire-Foster methodology>> dashboard of dimensions of poverty
Attainment dimensions
Attainment indicators
Deprivation matrix
Aggregate attainment
Multidimensional Poverty Index (MPI)
Headcount (H)
Intensity (A)
Poverty cut-off
Dimension weights
Deprivation cut-off
Methodology
Source: Balisacan(2014) What has really happened to poverty in the Philippines? and Edillon(2014), Mul;dimensional Poverty
DATASET YEARS AVAILABLE
National Demographic and Health Survey (NDHS) 1993, 1998, 2003, 2008
*Unit record data not yet available at the 2me of study
Nationally representative surveys
Source: Balisacan(2014) What has really happened to poverty in the Philippines? and Edillon(2014), Mul;dimensional Poverty
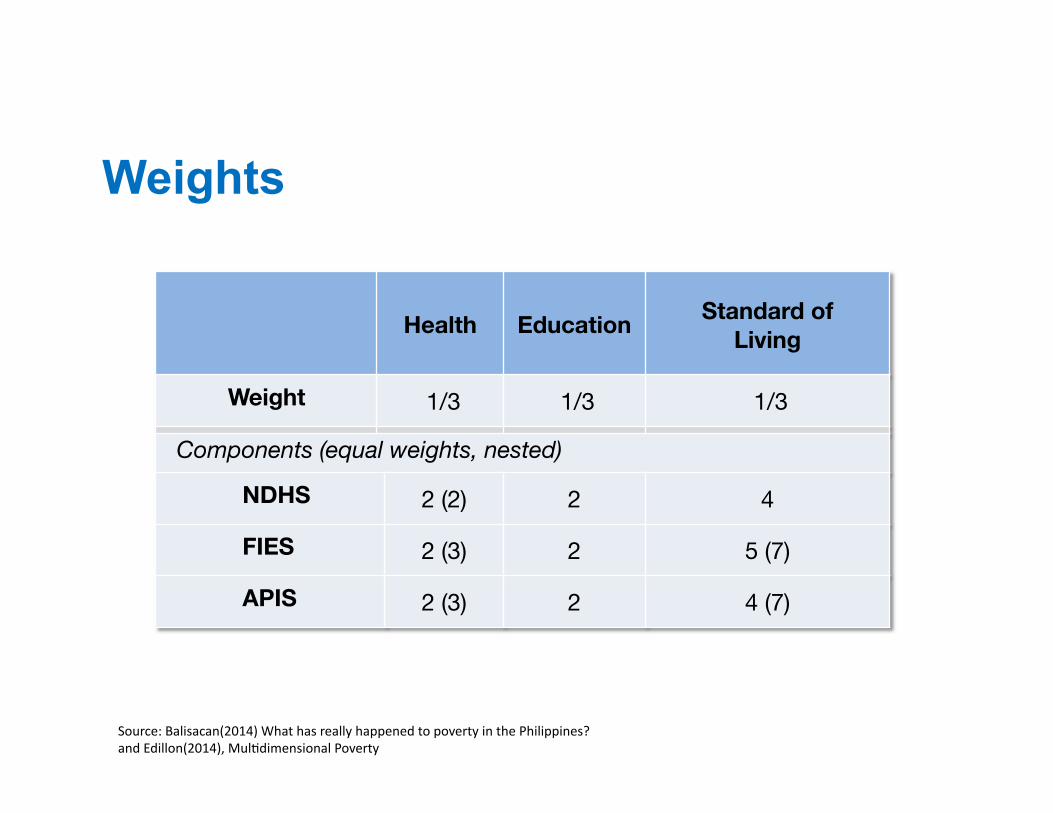
Health Education Standard of Living
Weight 1/3 1/3 1/3
Components (equal weights, nested)
NDHS 2 (2) 2 4
FIES 2 (3) 2 5 (7)
APIS 2 (3) 2 4 (7)
Weights
Source: Balisacan(2014) What has really happened to poverty in the Philippines? and Edillon(2014), Mul;dimensional Poverty
NDHS FIES APIS HEALTH Child Mortality ✓ Water ✓ ✓ Sanitation ✓ ✓ Nutrition Food poverty ✓a ✓ ✓ EDUCATION Years of Schooling ✓ ✓ ✓ Child School Attendance ✓ ✓ Potential Schooling ✓ STANDARD OF LIVING Electricity ✓ ✓ ✓ Shelter Flooring ✓ Roof ✓ ✓ Wall ✓ ✓ Mobility Access to motor vehicles ✓ ✓ Access to national roads ✓ Asset ownership Household Assets ✓ ✓ ✓ Transport ✓ House tenure ✓ Other sources of income ✓ ✓
Achievement (Deprivation) Dimensions
Source: Balisacan(2014) What has really happened to poverty in the Philippines? and Edillon(2014), Mul;dimensional Poverty
0.000
0.100
0.200
0.300
0.400
0.500
0.600
1985 1990 1995 2000 2005 2010 2015
Hea
dcou
nt ra
tio
Hm (FIES)** Hm (APIS) Hm (NDHS) Hy*
Multidimensional Headcount (Hm) vs. Income Headcount (Hy)
*Uses official per capita food poverty threshold for 2009 (among families). **Note: Line indicates that before 2000 the FIES-‐generated MPI uses a different defini2on of assets.
Source: Balisacan(2014) What has really happened to poverty in the Philippines? and Edillon(2014), Mul;dimensional Poverty
Percent contribution to
MPI, 2012
Percentage of population who are MPI poor and deprived in each indicator
14.9%
8.1%
13.7%
5.6%
16.0%
5.2%
2.6%
3.9%
2.8%
13.7%
13.5%
0% 5% 10% 15% 20% 25% 30% 35% 40% 45%
Water
Sanitation
Food poor
Years of schooling
Child school attendance
Electricity
Shelter (roof)
Shelter (walls)
Mobility
Income from other sources
Ownership of assets
Hea
lth
Educ
atio
n St
anda
rd o
f liv
ing
Percent of population FIES 2012 FIES 2000
Source: Balisacan(2014) What has really happened to poverty in the Philippines? and Edillon(2014), Mul;dimensional Poverty
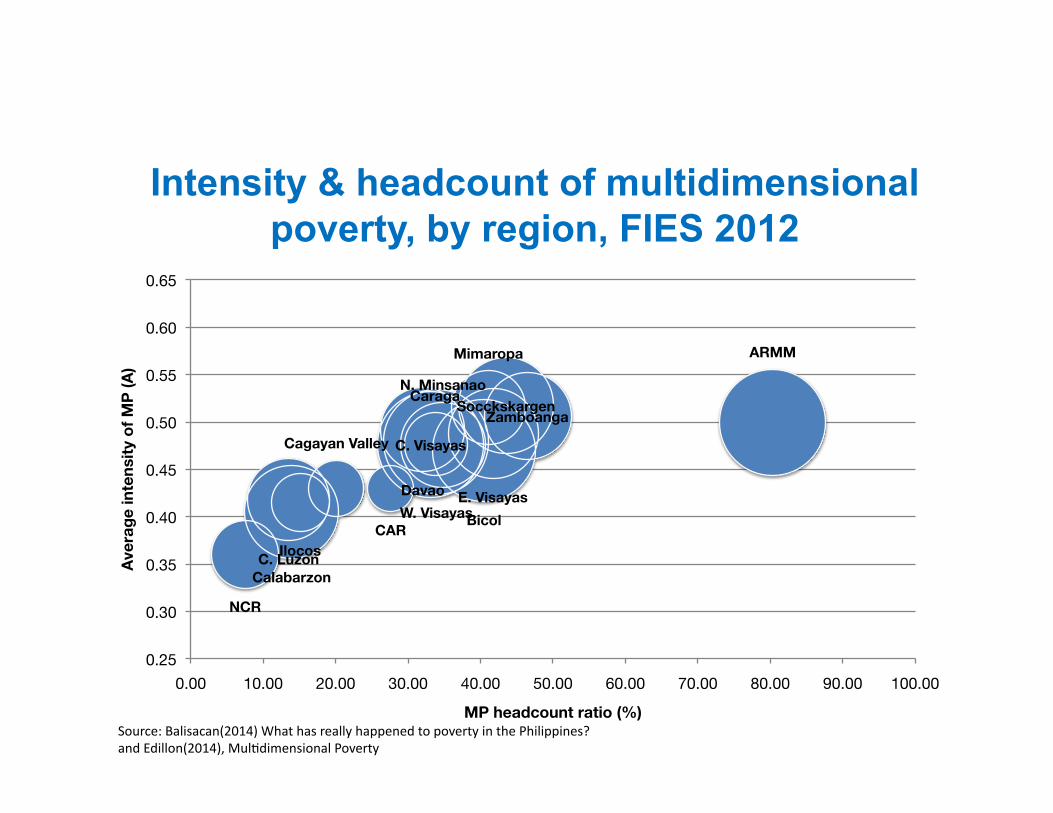
Intensity & headcount of multidimensional poverty, by region, FIES 2012
MP headcount ratio (%) Source: Balisacan(2014) What has really happened to poverty in the Philippines? and Edillon(2014), Mul;dimensional Poverty
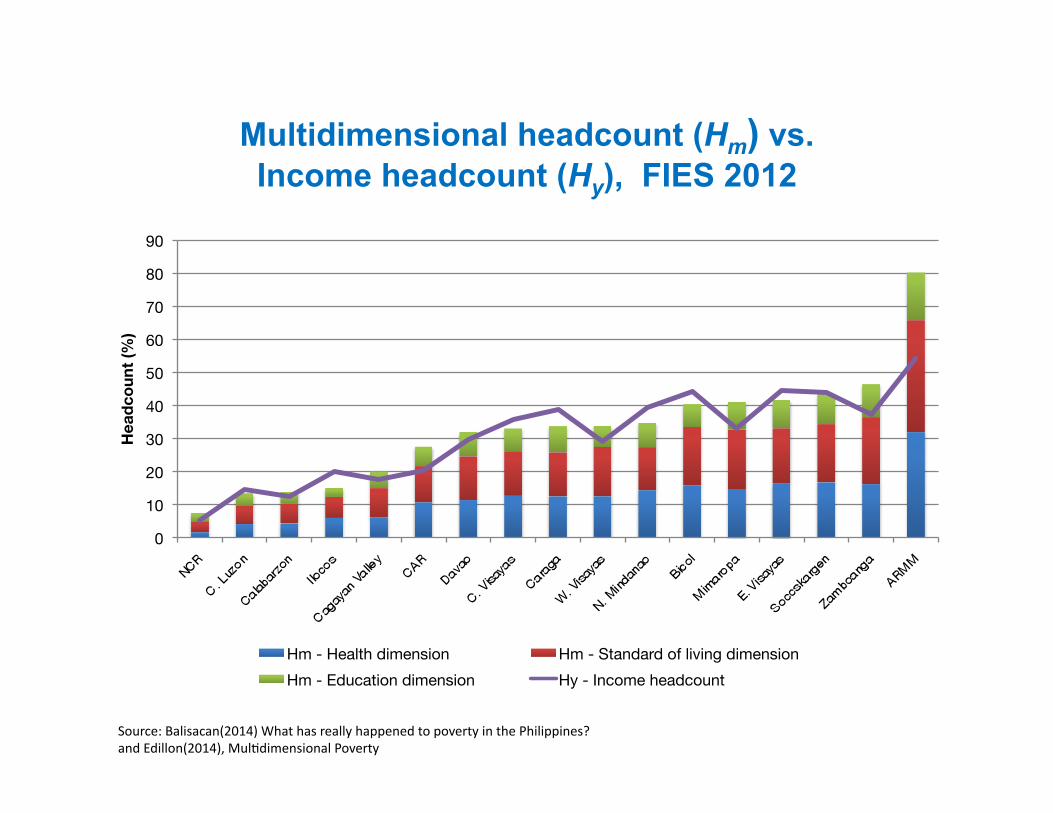
Multidimensional headcount (Hm) vs. Income headcount (Hy), FIES 2012
0
10
20
30
40
50
60
70
80
90
Hea
dcou
nt (%
)
Hm - Health dimension Hm - Standard of living dimension Hm - Education dimension Hy - Income headcount
Source: Balisacan(2014) What has really happened to poverty in the Philippines? and Edillon(2014), Mul;dimensional Poverty
Moving Forward
• Study to start in March 2015 on enhancing household surveys including development of an integrated household survey for a comprehensive framework for poverty measurement in the Philippines
• Need a communica;on plan for the comprehensive framework
• For review and endorsement of the technical commiOee