64
Power Consumption by Wireless Communication Lin Zhong ELEC518, Spring 2011

Power Consumption by Wireless Communication
Lin ZhongELEC518, Spring 2011
2
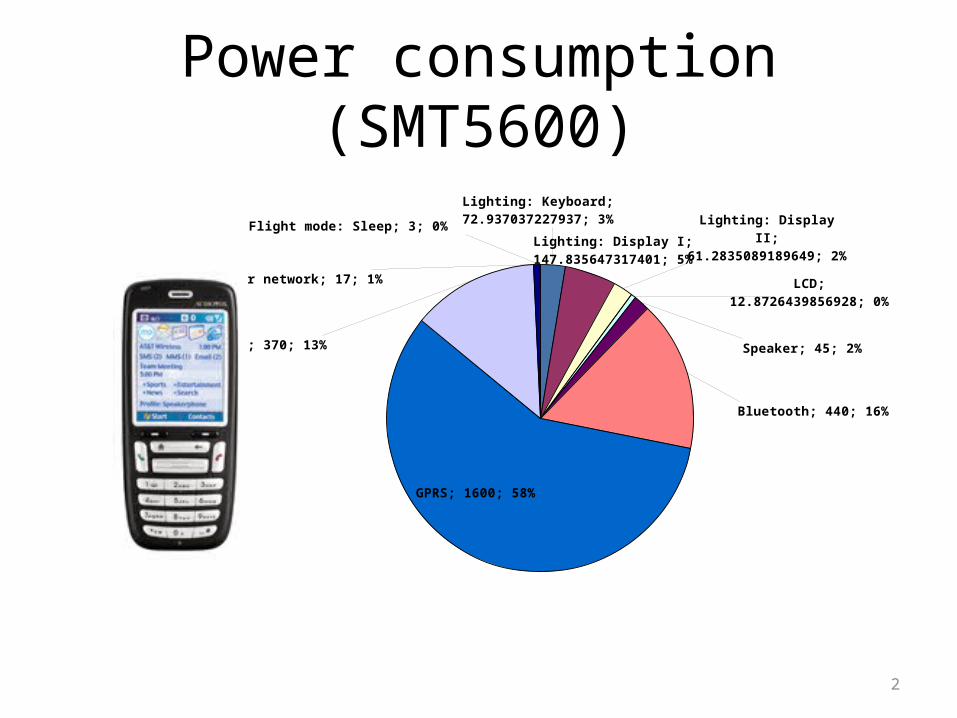
Power consumption (SMT5600)
Lighting: Keyboard; 72.937037227937; 3%
Lighting: Display I; 147.835647317401; 5%
Lighting: Display II; 61.2835089189649; 2%
LCD; 12.8726439856928; 0%
Speaker; 45; 2%
Bluetooth; 440; 16%
GPRS; 1600; 58%
Compute; 370; 13%
Cellular network; 17; 1%
Flight mode: Sleep; 3; 0%

3
Power consumption (T-Mobile)
IDLE
-Flight mode
Com
puting
LCD
LCD
lighting
Keyboard lighting
Speaker
Discoverable
Paging
Connected
Transmission
Connected
Transmission
Connected
Transmission
1
10
100
1000
10000
Pow
er (m
W)
Bluetooth Wi-Fi Cellular

4
Power consumption (Contd.)
• Theoretical limits– Receiving energy per bit > N * 10-0.159
• N: Noise spectral power level• Wideband communication
Distance: d
Propagation constant: a (1.81-5.22)
PRXPTX∝ PRX*da

5
Power consumption (Contd.)• What increases power consumption
– Government regulation (FCC)• Available spectrum band (Higher band, higher power)• Limited bandwidth• Limited transmission power
– Noise and reliability– Higher capacity
• Multiple access (CDMA, TDMA etc.)– Security– Addressability (TCP/IP)– More……

6
Wireless system architecture
Application
Transport
Network
Data link
Host computer
RF front ends
BasebandNetwork interface
Network protocol stack Hardware implementation
Physical

7
Power consumption (Contd.)
Baseband processorAntenna
interface
LNA
Low-noise amplifier
PA
Power amplifier
Intermediate Frequency (IF) signal processing
Local Oscillator (LO)
Physical Layer
IF/B
aseb
and
Conv
ersio
n
MAC Layer & above
>60% non-display power consumed in RF
RF technologies improve much slower than IC

8
Power consumption (Contd.)
67%
18%
8%
5%
1%
PAFSMixerLNABaseband
Source: Li et al, 2004
Components Power (mW)
Power amplifier (PA) 246
Frequency synthesizer (VCO/FS)
67.5
Mixer 30.3
LNA 20
Baseband processing 5

Low-noise amplifier (LNA)
• Bandwidth (same as the signal)• Gain (~20dB)• Linearity (IP3)• Noise figure (1dB)• Power consumption

10
Circuit power optimization
• Major power consumers
Baseband processorAntenna
interface
LNA
Low-noise amplifier
High duty cycle
PA
Power amplifier
High power consumption
Intermediate Frequency (IF) signal processing
Local Oscillator (LO)
Almost always on
Physical Layer
IF/B
aseb
and
Conv
ersio
n
MAC Layer & above
Huge dynamic range 105

11
Circuit power optimization (Contd.)
• Reduce supply voltage– Negatively impact amplifier linearity
• Higher integration– CMOS RF– SoC and SiP integration
• Power-saving modes

12
Circuit power optimization (Contd.)
• Power-saving modes– Complete power off
• (Circuit wake-up latency + network association latency) on the order of seconds
– Different power-saving modes• Less power saving but short wake-up latency

13
Power-saving modes
Baseband processorAntenna
interface
LNA
Low-noise amplifier
PA
Power amplifier
Intermediate Frequency (IF) signal processing
Local Oscillator (LO)
Physical Layer
IF/B
aseb
and
Conv
ersio
n
MAC Layer & above
Radio Deep Sleep Wake-up latency on the order of micro seconds

14
Power-saving modes (Contd.)
Baseband processorAntenna
interface
LNA
Low-noise amplifier
PA
Power amplifier
Intermediate Frequency (IF) signal processing
Local Oscillator (LO)
Physical Layer
IF/B
aseb
and
Conv
ersio
n
MAC Layer & above
Sleep Mode Wake-up latency on the order of milliseconds
Low-rate clock with saved network association information

15
Network power optimization
• Use power-saving modes– Example: 802.11 wireless LAN (WiFi)
• Infrastructure mode: Access points and mobile nodes– Example: Cellular networks

16
802.11 infrastructure mode• Mobile node sniffs based on a “Listen Interval”
– Listen Interval is multiple of the “beacon period”• Beacon period: typically 100ms
• During a Listen Interval– Access point
• buffers data for mobile node• sends out a traffic indication map (TIM), announcing buffered
data, every beacon period– Mobile node stays in power-saving mode
• After a Listen Interval– Mobile node checks TIM to see whether it gets buffered
data– If so, send “PS-Poll” asking for data

17
Buffering/sniffing in 802.11
Gast, 802.11 Wireless Network: The Definitive Guide
802.15.1/Bluetooth uses similar power-saving protocols: Hold and Sniff modes

Cellular networks
• Discontinuous transmission (DTX)• Discontinuous reception (DRX)

Wireless energy cost
• Connection– Establishment– Maintenance
• Transfer data– Transmit vs. receive
19

Energy per bit transfer
Oppermann et al., IEEE Comm. Mag. 200420

Wasteful wireless communication
21
TimeMicro power management
SpaceDirectional communication
SpectrumEfficiency-driven cognitive radio
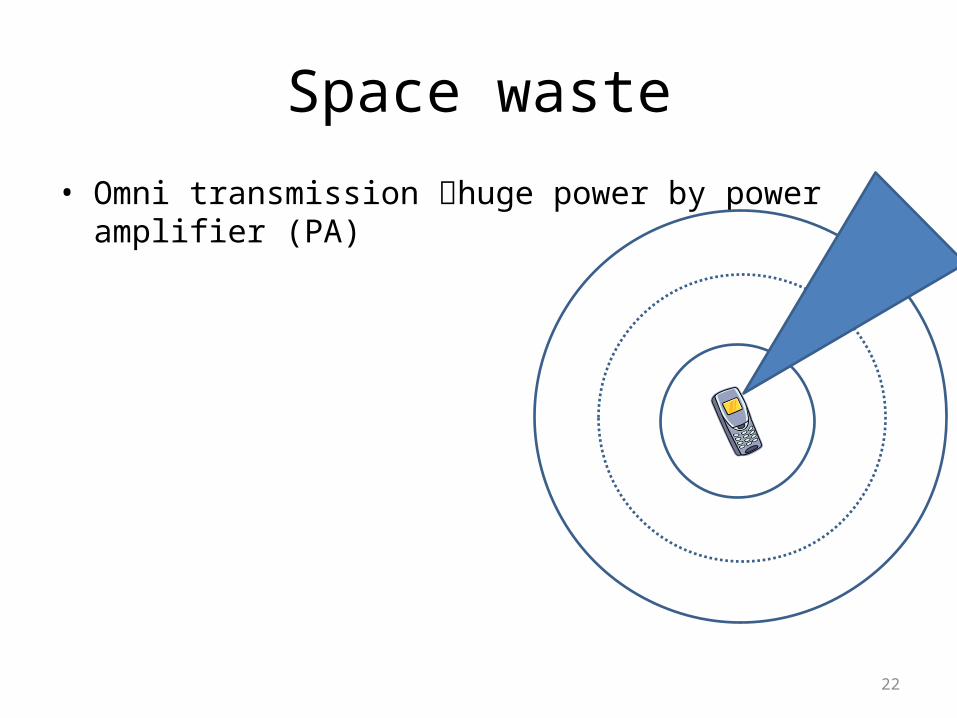
Space waste• Omni transmission huge power by power amplifier (PA)
22

Time waste• Network Bandwidth Under-Utilization
– Modest data rate required by applications• IE ~ 1Mbps, MSN video call ~ 3Mbps
– Bandwidth limit of wired link • 6Mbps DSL at home
23230 0.2 0.4 0.6 0.8 1
0
200
400
600
800
1000
1200
1400
Time (s)
Dat
a S
ize
(Byt
e)
0
20
40
60
80
100
Time Energy
Idle
inte
rval
s in
busy
tim
e (%
)
User1 User2 User3 User4

Spectrum waste
24

Observed from an 802.11g user
25
1E+02 1E+03 1E+04 1E+05 1E+06 1E+07Throughout (bps)
Energy per bitDistribution of observed 802.11g throughput

Temporal waste
26
0 0.2 0.4 0.6 0.8 10
1
Time(s)
Rad
io A
ctiv
ity
90% of time & 80% of energy spent in idle listeningFour 802.11g laptop users, one week

Fundamental problem with CSMA
• CSMA: Carrier Sense Multiple Access– Clients compete for air time
• Incoming packets are unpredictable
27

Fundamental problem with CSMA
28

Micro power management (µPM)• Sleep during idle listening• Wake up in time to catch retransmission• Monitor the traffic not to abuse it
• ~30% power reduction• No observed quality degradation
29J. Liu and L. Zhong, "Micro power management of active 802.11 interfaces," in Proc. MobiSys’08.

Directional waste
Ongoing project with Ashutosh Sabharwal
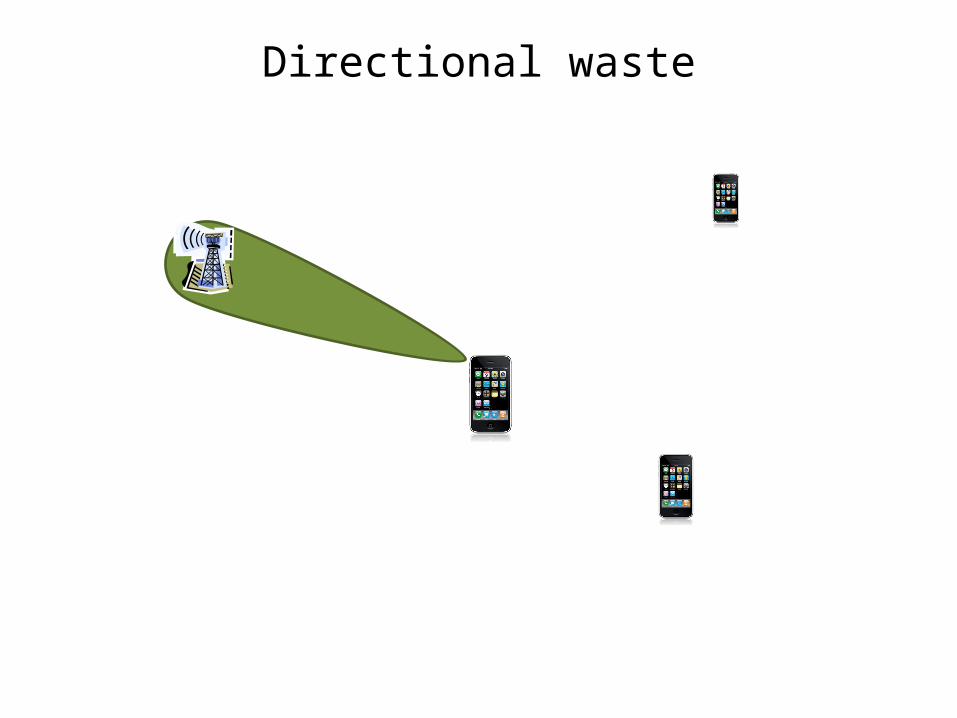
Directional waste

Two ways to realize directionality
• Passive directional antennas– Low cost– fixed beam patterns
• Digital beamforming– Flexible beam patterns– High cost
32Phased-array antenna system from Fidelity Comtech
Desclos, Mahe, Reed, 2001

Challenge I: Rotation!!!
33
Solution: Don’t get rid of the omni directional antennasUse multiple directional antennas
But can we select the right antenna in time?
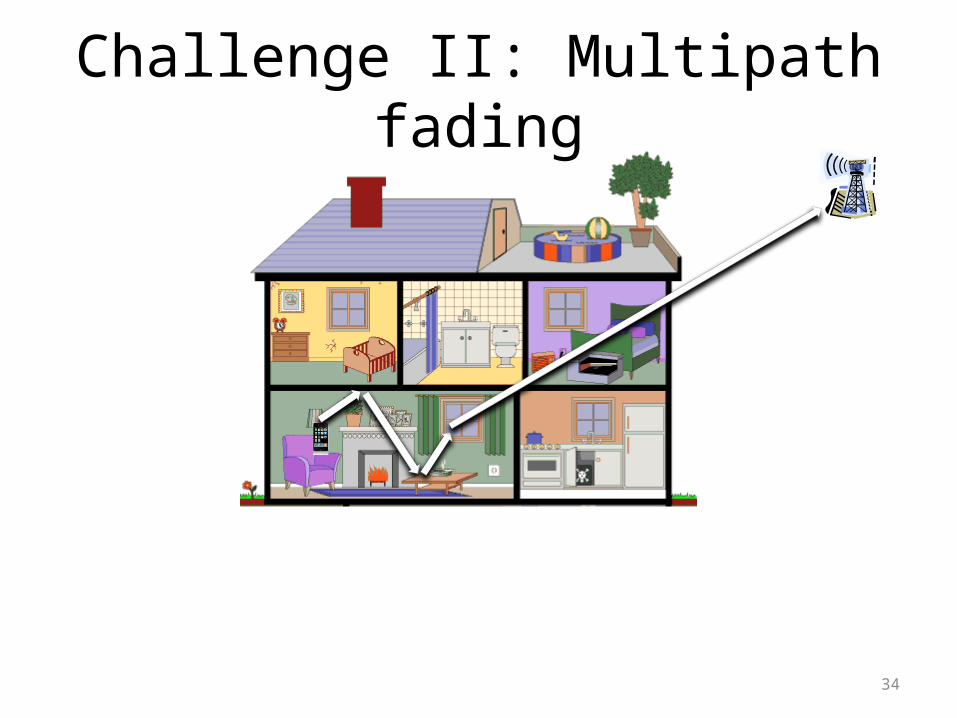
Challenge II: Multipath fading
34

Challenge III
• Can we do it without changing the infrastructure?
35

Characterizing smartphone rotation
• How much do they rotate?• How fast do they rotate?
• 11 HTC G1 users, each one week• Log accelerometer and compass readings
– 100Hz when wireless in use
36

Device orientation described by three Euler angles
• θ and φ based on tri-axis accelerometer • ψ based on tri-axis compass and θ and φ
37

Rotation is not that much
• <120° per second
10-4
10-3
10-2
10-1
100
101
102
1030
0.1
0.2
0.3
0.4
Rotational speed( /s)
100ms1s10s
10-4
10-3
10-2
10-1
100
101
102
1030
0.1
0.2
0.3
0.4
Rotational speed( /s)
100ms1s10s
10-4
10-3
10-2
10-1
100
101
102
1030
0.1
0.2
0.3
0.4
Rotational speed( /s)
100ms1s10s
38

Directionality indoor
39
5 dBi
8 dBi

8dBi antenna 5dBi antenna

Measurement setup• RSSI measured at both ends
41
Data packets
ACK packets

Directional channel still reciprocal
42
0 60 120 180 240 300 360
-60
-50
-40
-30
-20NLOS ind. / 5dBi antenna
Direction( )
RSS
(dB
m)
Dir-ClientDir-APOmni-ClientOmni-AP
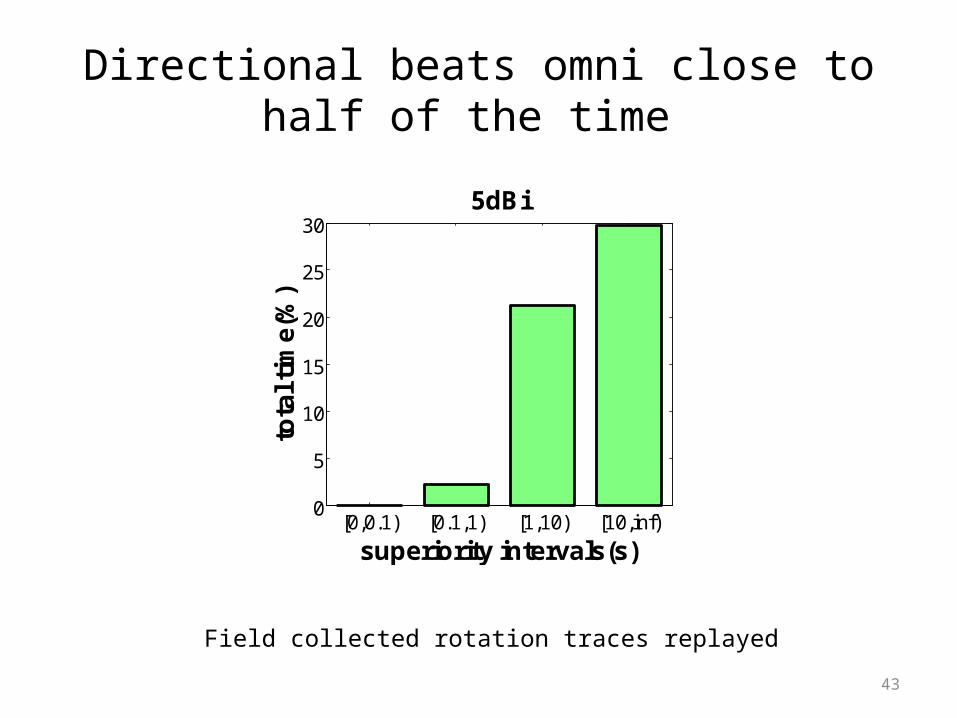
Directional beats omni close to half of the time
[0,0.1) [0.1,1) [1,10) [10,inf)0
5
10
15
20
25
30
tota
l tim
e(%
)
superiority intervals(s)
5dBi
43
Field collected rotation traces replayed

RSS is predictable (to about 100ms)
44
10ms 100ms 1s 10s
0.01
1
100
Prediction Intervals(s)
Erro
r(dB
)
5dBi
Zero order First order

Multi-directional antenna design (MiDAS)
• One RF chain, one omni antenna, multiple directional antennas
• Directional ant. only used for data transmit and ACK Reception– Standard compliance– Tradeoff between risk and benefit
45
Omni-directional antenna
Antenna switch
. . .
Directional antennas
Transceiver
Antenna selection
RSSI

Packet-based antenna selection
• Assess an antenna by receiving a packet with it– Leveraging channel reciprocity
• Continuously assess the selected antenna• Find out the best antenna by assessing them one
by one– Potential risk of missing packets
• Stay with omni antenna when RSS changes rapidly
• No change in 802.11 network infrastructure
46

Symbol-based antenna selection
• Assess all antennas through a series of PHY symbols– Similar to MIMO antenna selection
• Needs help from PHY layer
47
Antenna training packet
SEL
Regular packet
ACK

Trace based evaluation
• Rotation traces replayed on the motor• RSSI traces collected for all antennas• Algorithms evaluated on traces offline
0 5 10 15 20-60
-55
-50
-45
RSS
(dB
)
time(second)
Dir1 Dir
3
Dir 3
Omni
48

An early prototype
49
Controllable motor
3 directional antennas1 omni antenna
WARP
Laptop
Finalist of MobiCom’08 Best Student Demo

The busier the traffic, the better
10ms 100ms 1s 10s0
1
2
3
4
5
6
Average Packet Interval
Gai
n(dB
)
Upper bound Symbol-based Packet-based
50

Two 5dBi antennas enough
51
three two-opp two-adj one0
1
2
3
4
5
6
Antenna Configuration
Gai
n(dB
)
Upper bound Symbol-based Packet-based

Two 5dBi antennas enough
52
5dBi 8dBi0
1
2
3
4
5
6
Antenna Gain
Gai
n(dB
)
Upper bound Symbol-based Packet-based
0 60 120 180 240 300 360
-60
-50
-40
-30
-20NLOS ind. / 5dBi antenna
Direction( )
RSS
(dB
m)
Dir-ClientDir-APOmni-ClientOmni-AP
0 60 120 180 240 300 360
-60
-50
-40
-30
-20NLOS ind. / 8dBi antenna
Direction( )
RSS
(dB
m)
Dir-ClientDir-APOmni-ClientOmni-AP
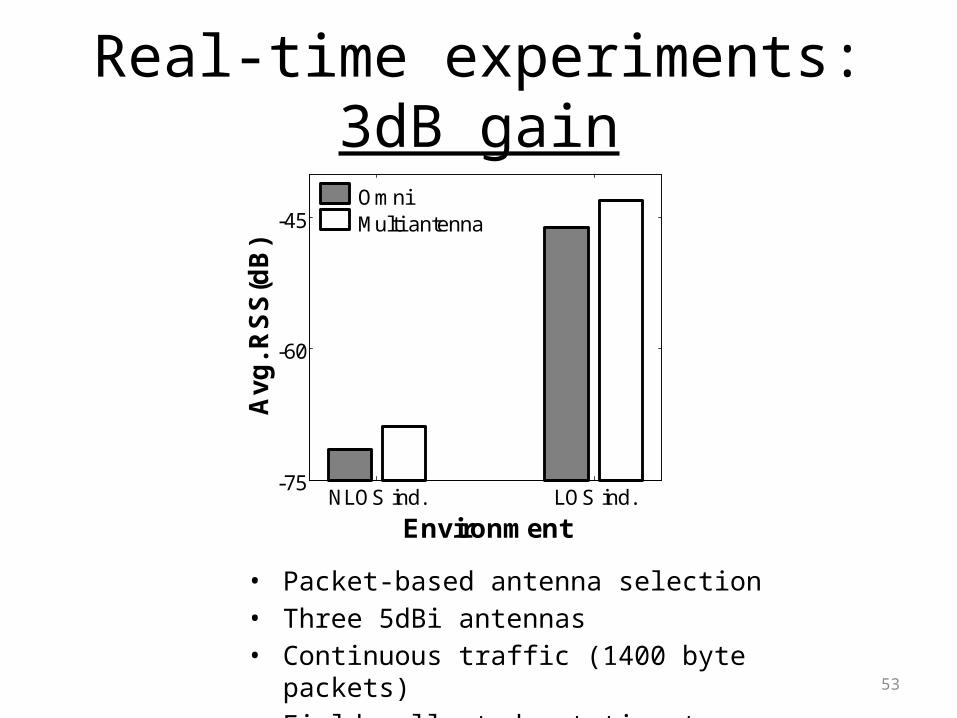
Real-time experiments: 3dB gain
• Packet-based antenna selection• Three 5dBi antennas• Continuous traffic (1400 byte packets)• Field collected rotation trace
NLOS ind. LOS ind.-75
-60
-45
Environment
Avg
. RSS
(dB
)
Omni Multi antenna
53

Throughput improvement
54
NLOS ind. LOS ind.0
1
2
3
4
Environment
Thro
ughp
ut(M
bps)
Omni Multi antenna
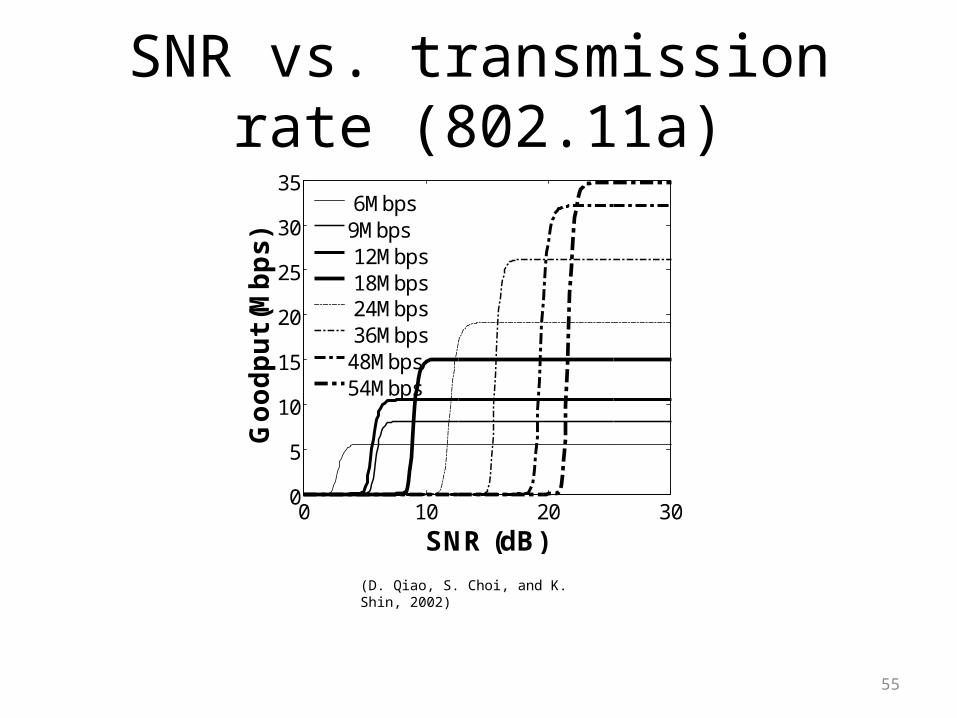
SNR vs. transmission rate (802.11a)
55
(D. Qiao, S. Choi, and K. Shin, 2002)
0 10 20 300
5
10
15
20
25
30
35
SNR (dB)
Goo
dput
(Mbp
s)
6Mbps9Mbps 12Mbps 18Mbps 24Mbps 36Mbps48Mbps54Mbps
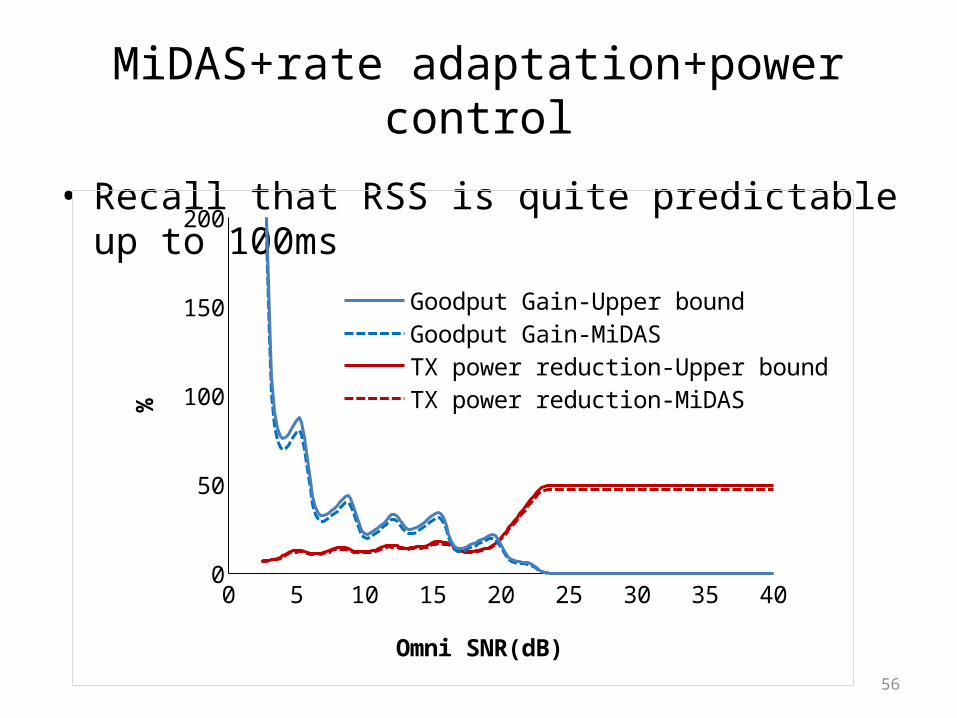
MiDAS+rate adaptation+power control
• Recall that RSS is quite predictable up to 100ms
56
0 5 10 15 20 25 30 35 400
50
100
150
200
Goodput Gain-Upper boundGoodput Gain-MiDASTX power reduction-Upper boundTX power reduction-MiDAS
Omni SNR(dB)
%

Protocol waste
Cellular network WLAN (Wi-Fi)
Connection
Transmission efficiency
Availability
58
How to combine the strength of both Wi-Fi and Cellular network?
Estimate Wi-Fi network condition WITHOUT powering on Wi-Fi interface
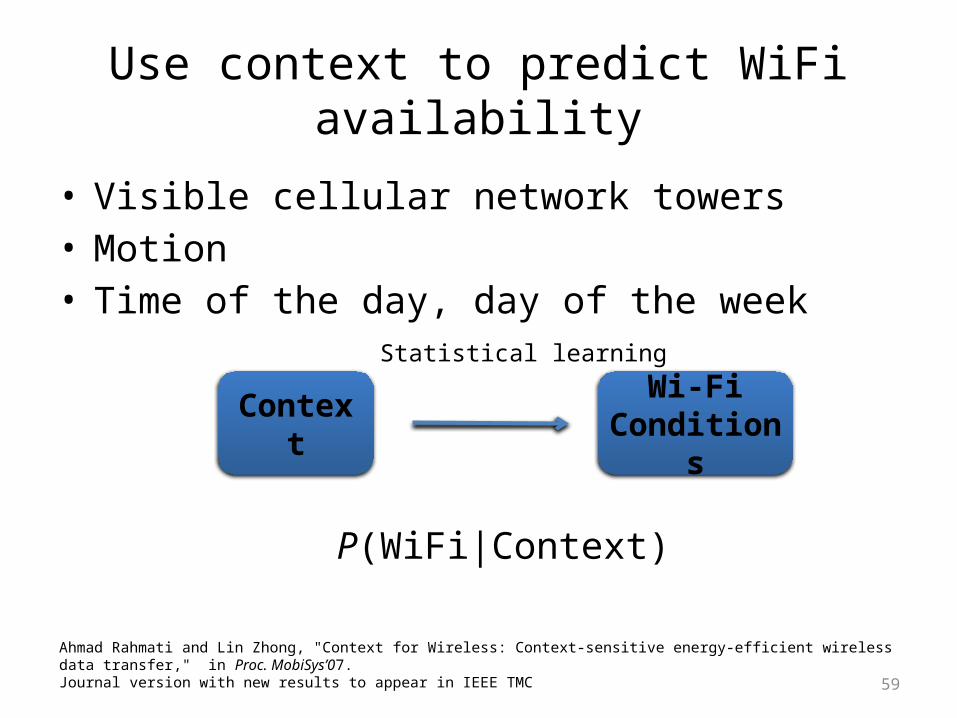
Use context to predict WiFi availability
• Visible cellular network towers• Motion• Time of the day, day of the week
59
Context Wi-Fi Conditions
Statistical learning
Ahmad Rahmati and Lin Zhong, "Context for Wireless: Context-sensitive energy-efficient wireless data transfer," in Proc. MobiSys’07.Journal version with new results to appear in IEEE TMC
P(WiFi|Context)
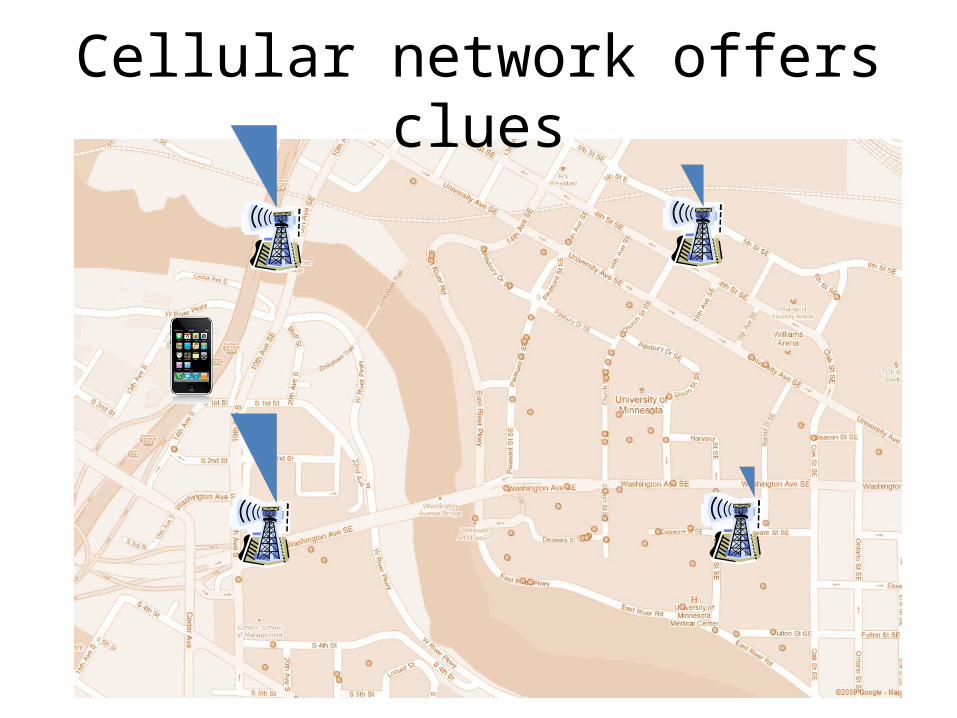
Cellular network offers clues

Cellular network offers clues

We don’t move that much
62
moving (1, 5] (5, 10] (10, 30] (30, 60] (60, 120] (120, inf)0%
10%
20%
30%
40%
50%
Length of motionless period (minute)
Shoehorned smartphone with accelerometer
Data collected from 2 smartphone users 2006

Our life is repetitive
63
0 1 2 3 40.5
0.6
0.7
0.8
0.9
1
Time (days)
Prob
abili
ty o
f sam
e W
i-Fi
avai
labi
lity
(nor
mal
ized
auto
corr
elet
aion
)
Data collected from 11 smartphone users

WiFi availability is HIGHLY predictable
64
• Application– Mobile EKG monitoring– 35% battery life improvement (12 to 17 hours)
0 120 240 360 480 6000.5
0.6
0.7
0.8
0.9
1
Time (minutes)
Pred
ictio
n ac
cura
cy o
f Wi-F
i av
aila
bilit
y


