Page 1
INT. J. BIOAUTOMATION, 2020, 24(4), 381-392 doi: 10.7546/ijba.2020.24.4.000802
381
Power-line Interference Removal
from High Sampled ECG Signals
Using Modified Version
of the Subtraction Procedure
Ivan Dotsinsky1,*, Todor Stoyanov1, Georgy Mihov2
1Institute of Biophysics and Biomedical Engineering
Bulgarian Academy of Sciences
Acad. Georgi Bonchev Str., Bl. 105, Sofia 1113, Bulgaria
E-mails: [email protected] , [email protected]
2Department of Electronics
Faculty of Electronic Engineering and Technologies
Technical University – Sofia
8 Kliment Ohridski Str., Sofia 1000, Bulgaria
E-mail: [email protected]
*Corresponding author
Received: January 07, 2020 Accepted: November 20, 2020
Published: December 31, 2020
Abstract: The acquired ECG signals are often contaminated by residual Power-line
Interference (PLI). A lot of methods, algorithms and techniques for PLI reduction have been
published over the last few decades. The so called subtraction procedure is known to
eliminate almost totally the interference without affecting the signal spectrum. The goal of
our research was to develop a heuristic version of the procedure intended for ECG signals
with high Sampling Rate (SR) up to 128 kHz. The PLI is extracted from the corrupted signal
by technique similar to second order band-pass filter but with practically zero phase error.
The sample number as well as the left and right parts outside the samples belonging to a
current sine wave, which is extracted from the contaminated signal, are counted and
measured. They are used to compensate the error arising with the shift between the moving
averaged free of PLI signal samples and their real position along the linear segments
(usually PQ and TP intervals having frequency band near to zero). The here calculated PLI
components are appropriately interpolated to ‘clean’ the dynamically changed in amplitude
and position contaminated samples within the non-linear segments (QRS complexes and high
T waves). The reported version of the subtraction procedure is tested with 5 and 128 kHz
sampled ECG signals. The maximum absolute error is about 20 μV except for the ends of the
recordings. Finally, an approach to PLI elimination from paced ECG signals is proposed.
It includes pace pulse extraction, signal re-sampling down to 4 kHz and subtraction
procedure implementation followed by adding back the removed pace pulses.
Keywords: Power-line interference, Subtraction procedure, High sampled ECG signals,
Paced ECG signals.
Introduction The acquired ECG signals are often contaminated by residual Power-line Interference (PLI)
that cannot be sufficiently suppressed despite the usually high common mode rejection ratio
of the contemporary instrumentation amplifiers. This is due to the leakage currents flowing
through the patient cable, the unequal electrode impedances and the body [10]. As a result,
this PLI is transferred into false differential signal superimposing the heart activity voltage by
sinusoidal noise with main frequency of 50 or 60 Hz, possibly accompanied by 3rd and 5th
Page 2
INT. J. BIOAUTOMATION, 2020, 24(4), 381-392 doi: 10.7546/ijba.2020.24.4.000802
382
harmonics. DC component and even harmonics are missing as the power generators are made
with precision half-wave symmetry.
Generally, the PLI amplitude and frequency are variable. The amplitude changes derive from
the spurious electrical circuits. The frequency deviation of the power supply is limited by the
standards within ±0.5 Hz. The fluctuations are slow but each difference toward the rated
frequency must be canceled immediately once the algorithm is started and currently
compensated both for short clinical records and Holter monitoring.
Enormous number of methods, algorithms and techniques for power-line interference
reduction has been published over the last few decades. Recently some cancellation
techniques were proposed, other were again discussed: traditional and sophisticated notch
filters, adaptive and Kalman filtering, Savitzky-Golay smoothing filter, Fast Fourier (FFT)
and Discrete Wavelet Transforms (DWT), Recurrent Neural Networks (RNN), modified time-
domain subtraction and regression subtraction methods [2-4, 12, 16, 20, 21].
The traditional notch filters affect the ECG spectrum usually defined from 0.3 through
125 Hz. Filter with narrow bandwidth results in lower signal distortions but cannot cope with
higher PLI frequency deviations. Kher [12] modified a second-order Finite Impulse Response
(FIR) filter introducing pair of complex-conjugated poles to obtain a more selective
bandwidth. However, the only figure presented shows reduced amplitudes of several high and
steep R waves.
Avendaño-Valencia et al. [2] proposed a tracking method based on Kalman filtering with
parameters optimized through genetic algorithms. A clean ECG signal is superimposed by
PLI with constant, as well as with variable amplitude and frequency. It is then subjected to the
proposed filtration. The results show higher performance compared to the estimation-
subtraction method and the non-linear adaptive estimator of non-stationary sinusoids.
Actually, a quantitative assessment cannot be made since the differences between the original
and the processed signals are not presented.
A trained model based on RNN is used to adapt the amplitude and the phase of a 50 Hz
sinusoid to the current PLI waveform [20]. The modified interference is then subtracted from
the ECG signal. The results obtained show a 10.5% improved Signal-to-Noise Ratio (SNR).
Bhoi1 et al. [4] published a comparative analysis of several filtering techniques applied to
60 Hz PLI suppression in ECG signals.
The statistical evaluation is based on SNR, Mean Square Error (MSE), Root MSE, Peak SNR
and peak to peak amplitude. The results suggest that the noise cancellation performance
obtained by DWT is better compared to the other techniques. Actually, the ECG analysis is
known to be time-amplitude. ECG waves are delineated; the amplitudes, widths, intervals and
relationships between them are measured and compared to statistically created sets of data to
classify the revealed morphology as normal or pathological heart activity. That is why SNR,
MSE and similar measures are not the adequate metrics for PLI suppression assessment.
Yu et al. [21] developed an improved adaptive coherent model, which is able to follow even
fast interference changes at the reference input. The algorithm tracks the actual PLI frequency
using partial FFT and then adjusts the sampling frequency of the ECG signal at the primary
input. The authors illustrate the method by one recording only. They do not discuss the error
committed.
Page 3
INT. J. BIOAUTOMATION, 2020, 24(4), 381-392 doi: 10.7546/ijba.2020.24.4.000802
383
The so called subtraction procedure has been developed some decades ago [5, 14]. It was
further improved over the years [8, 9, 15, 17-19] and implemented in thousands
ECG instruments and computer-aided systems [7, 6]. The subtraction procedure eliminates
almost totally the interference without affecting the ECG signal spectrum. Briefly, it consists
of the following steps:
(i) comb filter with first zero at 50 or 60 Hz is applied on linear segments (usually
PQ and TP intervals having frequency band near to zero);
(ii) the obtained free of interference values are used to compute phase locked
interference patterns, saved in a set of corrections;
(iii) they are subtracted from the corresponding samples of the corrupted ECG signal
in the adjacent non-linear segments (QRS complexes and high T waves).
The subtraction procedure have been tested carefully by comparing conditionally clean ECG
signals with processed contaminated signals, which are obtained by mixing the clean signals
with synthesized interference. The difference observed is usually in the limits of ±20 µV,
but the real error committed is lower since in fact the conditionally clean signals contain
inherent noise. The results obtained do not depend on whether the synthesized interference
consists of main frequency only or is mixed by its 3rd and 5th harmonics.
The procedure is extremely efficient even with changing PLI amplitude and frequency.
The amplitude variations are taken in consideration by more frequent updates of the
correction set using a less restrictive criterion for linear segment detection.
The frequency fluctuations are more difficult to overcome. The early solutions of the problem
included small adjustments of the inter-sample distances around their rated value. According
to an initial approach [8], each first sample of the PLI period is coupled to a given
PL voltage level using Schmidt trigger connected to a secondary winding, the other samples
being equally shifted at the rated inter-sample distances. The irregular distance between this
sample and the nth sample of the previous PLI period results in small additional error,
cancelled later on by an improved version: the length of each current period is measured and
used for an equal sample allocation during the next period. However, the hardware tracking of
the PLI frequency is not available both in battery supplied devices and computer-aided
ECG systems, where additionally the analogue-to-digital convertor cannot be ongoing
controlled.
A software approach dealing with the PLI frequency deviations was reported by Dotsinsky
and Stoyanov [9]. The contaminated signal is band-pass filtered with cut-offs at 48 and 52 Hz.
The cross point CP of the interference with the zero line is determined using homogenous
triangles defined by the samples located below and above the zero. The CP position on this
inter-sample distance is used to calculate the ongoing PLI fluctuation. The contaminated
samples are dynamically shifted to turn the variable interference frequency into the rated one.
Then, the PLI is removed. The processed samples are shifted back, thus restoring the original
timescale.
The PL frequency variation is a special case of the non-multiplicity between the frequency
and the Sampling Rate (SR) theoretically leading to not integer number of samples within a
rated PL period. As an example, some AHA [1] database recordings, which are digitized with
SR = 250 Hz, contain 60 Hz PLI residual components. The problem was overcome
Page 4
INT. J. BIOAUTOMATION, 2020, 24(4), 381-392 doi: 10.7546/ijba.2020.24.4.000802
384
generalizing the structure of the subtraction procedure [18, 19]. Three modules are
introduced: linear segment detection, PLI extraction and PLI temporal buffer. The basic
manipulations are formulated as filters. The linearity is evaluated by the so called D-filter.
A K-filter with zero in the PLI frequency (F) and unity gain in 0 Hz removes the PL
interference in the linear segments. A set of corrections is obtained by subtracting the filtered
samples from the corresponding corrupted samples. The procedure is denoted as (1-K)-filter.
The corrections are currently stored in the FIFO temporal buffer to be used in the following
non-linear segments. Another B-filter with linear phase response and unity gain in F is
introduced specifically for non-multiplicity cases. It extrapolates the stored FIFO values
before being used to compensate the amplitude errors introduced by the appeared phase
differences.
It is known that a 250 Hz SR would be acceptable for traditional ECG analysis [13].
However, some applications need higher SR. Bazhyna et al. [3] tested the efficiency of PLI
suppression methods applied to high resolution ECG recordings with 1 kHz SR and
100 nV/bit resolution.
When pacemaker’s pulses have to be detected, an over 5 kHz SR is required. It may reach
16 to 128 kHz [11]. In such cases the ratio SR/F becomes 320 to 2560 for F = 50 Hz that
slows down the implementation of the subtraction procedure. To cope with the problem,
Mihov [17] developed appropriate changes in the procedure main stages. The efficiency
achieved is manifested by ECG recordings with SR = 16 kHz.
The aim of the study is to create a heuristic version of the subtracted procedure intended for
ECG signals with SR up to 128 kHz, usually recorded for stimulated heartbeat analysis.
Materials and methods
Data set Recordings taken from the AHA database and re-sampled with 5 kHz, as well as paced
ECG signals available in the database PacedECGdb [11] were mixed by synthesized
interferences with 0.5 µV and 1 mV amplitude, respectively and variable frequency with rate
of 0.1 Hz/s. The mixed signals are used to develop and test the algorithm and the program
written in MATLAB environment. The chosen interference parameters exceed significantly
the values encountered in practice but in this way the potential of the subtraction procedure
can be better assessed.
Brief description of the method The PLI elimination from high sampled ECG signals is based on counting the samples within
the ongoing disturbing PLI sine waves. The key component of the method is the evaluations
of the two out-sample distances located at both ends of the sinusoidal curve. The sum of those
lengths is usually lower than the unity accepted as rated inter-sample distance. The obtained
fractional number of inter-sample distances/samples inside a wave is further used for ‘clean’
values calculation in the linear segments. The differences between the corrupted and the
‘clean’ values called corrections, which are related to the last sine wave, are taken in
consideration along the subsequent non-linear segments for denoising the samples according
to their dislocation towards the corrections.
The paced ECG signals require an additional approach to the problem. Since the lowest
amplitude and duration of pace pulses may reach 250 μV and 100 μs respectively, the pulses
Page 5
INT. J. BIOAUTOMATION, 2020, 24(4), 381-392 doi: 10.7546/ijba.2020.24.4.000802
385
have to be extracted and stored before the ECG signal is subjected to PLI elimination.
Then the pace pulses are added back to the processed signal.
Algorithm description Preprocessing
The PLI sine waves are extracted from the contaminated cardiac activity as follows.
The corrupted ECG recording (mixed signal) is processed by 1st order band-pass filter with
central frequency at 50 Hz and cut-offs at 48 and 52 Hz. The appeared phase shift is
compensated applying once more but backwards the filter that corresponds to a second order
band-pass filtered signal (BP signal) with practically zero phase error.
Linear segments
The ECG linear segments are investigated by means of the linearity criterion
D = abs{[mix( k + N ) – mix( k )] – [mix( k + 2N ) – mix( k + N )]} < M,
applied over two consecutive periods of F. Here k is the current sample of the mixed signal
mix, N is the rated number of samples within the period, while M stands for the threshold
defined as 100 µV.
The determination of the free of interference values is complicated by variable sample
numbers inside the PLI period and by not integer number of inter-sample distances.
Besides, the calculated central mean value may do not coincide with any sample position.
These problems were overcome as follows.
The border left lp and right rp inter-sample distances are investigated and computed (Fig. 1):
( )
( ) abs ( 1)
BPlp
BP BP
l
l l;
( )
.( 1) abs ( )
BP rrp
BP r BP r
Here l and r are current BP positions defining BP( l ) and BP( r ) as the leftmost and rightmost
BP samples, respectively. The total outside part is p = lp + rp, the other inter-sample distances
are equated to one, the sample number N inside the wave is equal to r – l.
Fig. 1 Determination of the leftmost and rightmost inter-sample distances
The mean total part pm = (pi + pi+1)/2 of two adjacent sinusoids i and i + 1 is used to average
their corresponding mix intervals in sequence. The filtered samples FS from the last half of
Page 6
INT. J. BIOAUTOMATION, 2020, 24(4), 381-392 doi: 10.7546/ijba.2020.24.4.000802
386
the first interval through the first half of the second one, are calculated dividing the
consecutive sums of N mix samples SN by N – 1 + pm instead of N. Thus, the error caused by
not integer number of inter-sample distances will be compensated. Since the filtered samples
FS = SN/(N – 1 + pm) are coupled with the middle of the averaged intervals mid, they are
additionally shifted to match real sample positions sp using the expression
FSc (i) = FS(i – 1) + [FS( i ) – FS(i – 1)]shift,
where shift = sp – mid is the difference between sp and the middle of the averaged interval
mid, determined as mid = (N/2) + 0.5 in case of integer inter-sample number and
mid = (N + pm)/2, otherwise.
The corresponding corrections are C(i) = mix(i) – FSc(i).
Further on, the two adjacent sinusoids in question are moved forward by one and subjected to
the same processing till the end of the linear segment, the set of corrections being each time
updated.
Non-linear segments
If the linearity criterion is not satisfied, the PLI elimination restarts with the already calculated
corrections coupled with the two leftmost BP samples C(i – j) and C(i – j + 1) of the last
processed interval (Fig. 2).
Fig. 2 PLI elimination in non-linear segments
The first new correction is
C(i) = C(i – j) + [C (i – j + 1) – C(i – j )(l– lref )],
where j is the distance between the current and the last processed interval, lref is the last
determined left outside part, l is the current one. Each next correction C(i + 1) is determined
by means of the already known C(i).
To avoid calculation errors when the C(i) position is near to the sine wave peak,
this correction must be specified through the expression
C(i) = 2[C(i – j) – C(i – j – 1)].
Page 7
INT. J. BIOAUTOMATION, 2020, 24(4), 381-392 doi: 10.7546/ijba.2020.24.4.000802
387
Similar formula is used for corrections with current number higher than N of the last
processed interval.
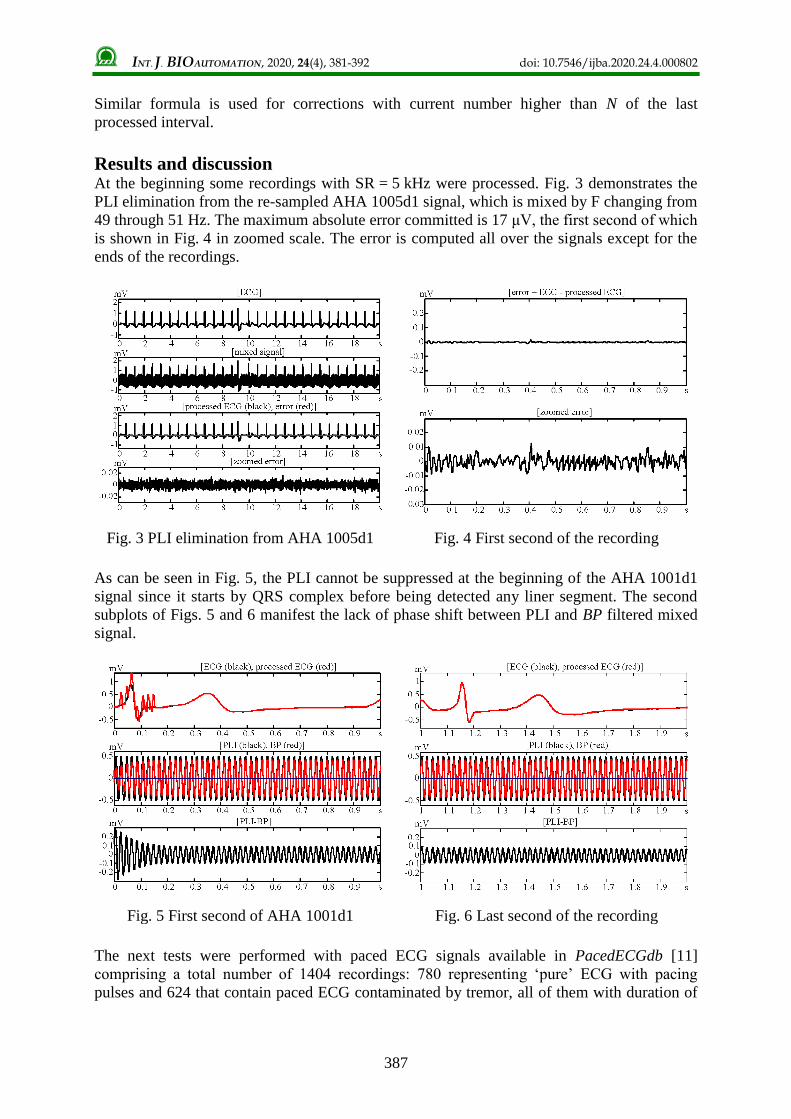
Results and discussion At the beginning some recordings with SR = 5 kHz were processed. Fig. 3 demonstrates the
PLI elimination from the re-sampled AHA 1005d1 signal, which is mixed by F changing from
49 through 51 Hz. The maximum absolute error committed is 17 μV, the first second of which
is shown in Fig. 4 in zoomed scale. The error is computed all over the signals except for the
ends of the recordings.
Fig. 3 PLI elimination from AHA 1005d1 Fig. 4 First second of the recording
As can be seen in Fig. 5, the PLI cannot be suppressed at the beginning of the AHA 1001d1
signal since it starts by QRS complex before being detected any liner segment. The second
subplots of Figs. 5 and 6 manifest the lack of phase shift between PLI and BP filtered mixed
signal.
Fig. 5 First second of AHA 1001d1 Fig. 6 Last second of the recording
The next tests were performed with paced ECG signals available in PacedECGdb [11]
comprising a total number of 1404 recordings: 780 representing ‘pure’ ECG with pacing
pulses and 624 that contain paced ECG contaminated by tremor, all of them with duration of
Page 8
INT. J. BIOAUTOMATION, 2020, 24(4), 381-392 doi: 10.7546/ijba.2020.24.4.000802
388
10 seconds. The pace pulses are with 7.8 to 102 μs rising edge duration and 102 to 2180 μs
pulse duration. The amplitude is usually between 250 μV and 2 mV.
The first subplot of Fig. 7 shows the ECG paced signal p09_16_PacePulse_03_Kp = 0.125
demonstrating fixed-rate ventricular pacing. The pulses, some of them not effective, are with
250 μV amplitude, 23.4 μs rising edge and 211 μs pulse durations The second subplot
represents synthesized PLI with SR = 128 kHz and variable PLI frequency F from
45.5 through 50.5 Hz for 5 s. Although the paced signal is announced as ‘pure’, one may
observe residual noise in the first subplot, probably some kind of tremor that can corrupt the
assessment of the PLI elimination from the mixed signal. Besides, the pace pulses are
invisible there but will be totally flatted by any filtering procedure.
Fig. 7. Contaminated paced ECG signal
Therefore, we proceeded as follows:
the pace pulses were subtracted from the mixed signal; the corresponding parts were
smoothed; the tremor was suppressed by comb filter with first zero at 35 Hz (third
subplot of Fig. 8);
the PLI was eliminated;
finally the pace pulses were added back.
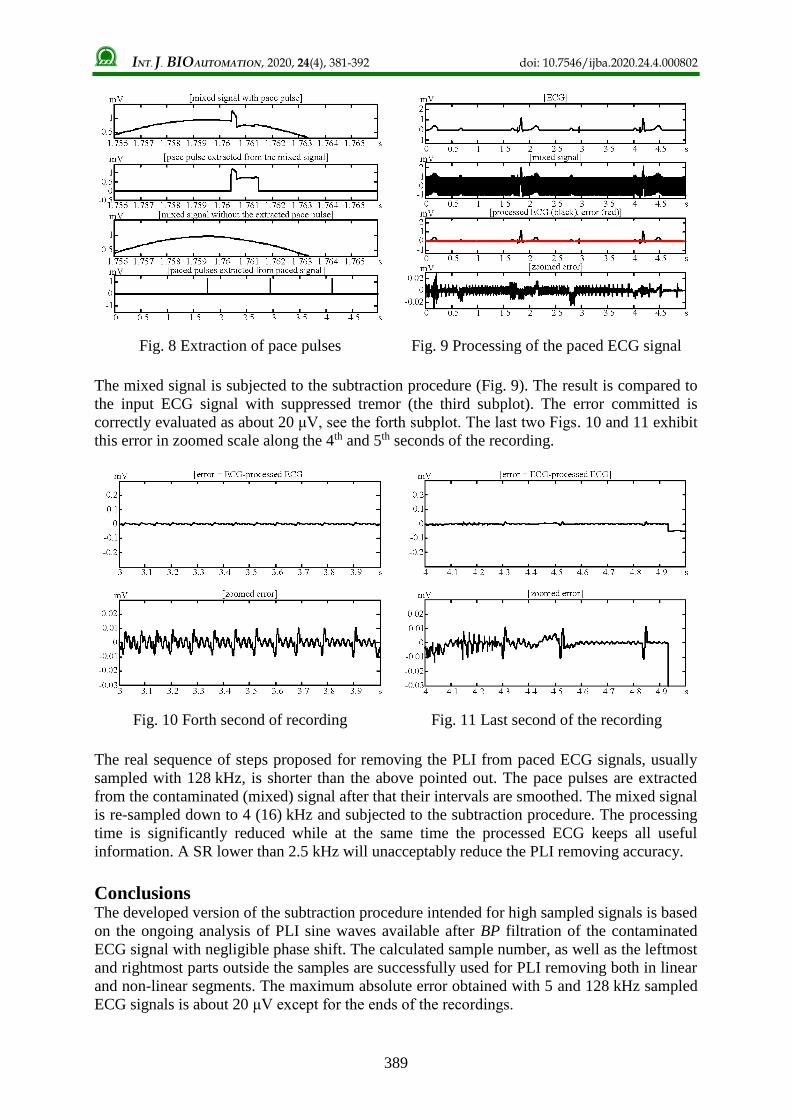
Some of these steps are illustrated in Figs. 8 and 9. A peak of pace pulse k is detected as
sample in the middle of the series of samples k – 3 < k – 2 < k – 1 < k > k + 1 > k + 2 > k + 3,
if k is higher by 200 μV towards k – 3 (this value is specified for the processed signal).
The pace pulse duration is defined by the sequence k – 5 through k + 128 (second subplot of
Fig. 8). The mixed signal is smoothed by linear interpolation between the leftmost k – 5 and
rightmost k + 128 samples, see the third subplot. All 3 extracted pace pulses of the analyzed
epoch are displayed at the bottom of the Fig. 8.
Page 9
INT. J. BIOAUTOMATION, 2020, 24(4), 381-392 doi: 10.7546/ijba.2020.24.4.000802
389
Fig. 8 Extraction of pace pulses Fig. 9 Processing of the paced ECG signal
The mixed signal is subjected to the subtraction procedure (Fig. 9). The result is compared to
the input ECG signal with suppressed tremor (the third subplot). The error committed is
correctly evaluated as about 20 μV, see the forth subplot. The last two Figs. 10 and 11 exhibit
this error in zoomed scale along the 4th and 5th seconds of the recording.
Fig. 10 Forth second of recording Fig. 11 Last second of the recording
The real sequence of steps proposed for removing the PLI from paced ECG signals, usually
sampled with 128 kHz, is shorter than the above pointed out. The pace pulses are extracted
from the contaminated (mixed) signal after that their intervals are smoothed. The mixed signal
is re-sampled down to 4 (16) kHz and subjected to the subtraction procedure. The processing
time is significantly reduced while at the same time the processed ECG keeps all useful
information. A SR lower than 2.5 kHz will unacceptably reduce the PLI removing accuracy.
Conclusions The developed version of the subtraction procedure intended for high sampled signals is based
on the ongoing analysis of PLI sine waves available after BP filtration of the contaminated
ECG signal with negligible phase shift. The calculated sample number, as well as the leftmost
and rightmost parts outside the samples are successfully used for PLI removing both in linear
and non-linear segments. The maximum absolute error obtained with 5 and 128 kHz sampled
ECG signals is about 20 μV except for the ends of the recordings.
Page 10
INT. J. BIOAUTOMATION, 2020, 24(4), 381-392 doi: 10.7546/ijba.2020.24.4.000802
390
The proposed approach to PLI elimination from paced ECG recordings (usually sampled with
128 kHz or at least 16 kHz) includes pace pulse elimination, signal re-sampling down to
4 kHz and implementation of the subtraction procedure, followed by adding back the pace
pulses.
References 1. AHA database, http://www.ecri.org/.
2. Avendaño-Valencia L., E. Avendaño, J. M. Ferrero, G. Castellanos-Domınguez (2007).
Improvement of an Extended L.D. Kalman Filter Power Line Interference Suppressor for
ECG Signals, Computers in Cardiology, 34, 553-556.
3. Bazhyna A., I. I. Christov, A. Gotchev, I. K. Daskalov, K. Egiazarian (2003). Powerline
Interference Suppression in High-resolution ECG, Computers in Cardiology, 30, 561-564.
4. Bhoi A. K., K. S. Sherpa, B. Khandelwal (2019). Comparative Analysis of Filters for
Cancellation of Power-line-interference of ECG Signal, Int J Bioautomation, 23(3),
259-282.
5. Christov I., I. A. Dotsinsky (1988). New Approach to the Digital Elimination of 50 Hz
Interference from the Electrocardiogram, Med Biol Eng Comput, 26, 431-434.
6. Daskalov I. K., I. A. Dotsinsky, I. I. Christov (1998). Developments in ECG Acquisition,
Preprocessing, Parameter Measurement and Recording, IEEE Eng Med Biol, 17, 50-58.
7. Dotsinsky I. A., I. I. Christov, C. L. Levkov, I. K. Daskalov (1985). A Microprocessor-
electrocardiograph, Med Biol Eng Comput, 23, 209-212.
8. Dotsinsky I. A., I. K. Daskalov (1996). Accuracy of the 50 Hz Interference Subtraction
from the Electrocardiogram, Med Biol Eng Comput, 34, 489-494.
9. Dotsinsky I., T. Stoyanov (2008). Power-line Interference Removal from ECG in Case of
Power-line Frequency Variations, Int J Bioautomation, 10, 88-96.
10. Huhta C., J. G. Webster (1973). 60 Hz Interference in Electrocardiography, IEEE Trans
Biomed Eng, 20, 91-100.
11. Jekova I., V. Tsibulko, I. Iliev (2014). ECG Database Applicable for Development and
Testing of Pace Detection Algorithms, Int J Bioautomation, 18(4), 377-388.
12. Kher R. (2019). Signal Processing Techniques for Removing Noise from ECG Signals,
J Biomed Eng, 11-19.
13. Kwon O., J. Jeong, H. B. Kim, I. H. Kwon, S. Y. Park, J. E. Kim, Y. Choi (2018).
Electrocardiogram Sampling Frequency Range Acceptable for Heart Rate Variability
Analysis, Health Inform Res, 24(3), 198-206.
14. Levkov C., G. Michov, R. Ivanov, I. Daskalov (1984). Subtraction of 50 Hz Interference
from the Electrocardiogram, Med Biol Eng Comput, 22, 371-373.
15. Levkov C., G. Michov, R. Ivanov, I. Daskalov, I. Christov, I. Dotsinsky (2005). Removal
of Power-line interference from the ECG: A Review of the Subtraction Procedure,
BioMed Eng OnLine, 4:50.
16. Li Q., C. Rajagopalan, G. D. Clifford (2014). A Machine Learning Approach to
Multi-level ECG Signal Quality Classification, Comput Methods Programs Biomed,
117(3), 435-447.
17. Mihov G. (2018). Subtraction Procedure for Power-line Interference Removal from ECG
Signals with High Sampling Rate, Int J Bioautomation, 22(2), 147-158.
18. Mihov G., I. Dotsinsky (2008). Power-line Interference Elimination from ECG in Case of
Non-multiplicity between the Sampling Rate and the Power-line Frequency, Biomedical
Signal Processing and Control, 3, 334-340.
19. Mihov G., I. Dotsinsky, Ts. Georgieva (2005). Subtraction Procedure for Power-line
interference Removing from ECG: Improvement for Non-multiple Sampling, J Med Eng
Technol, 29(5), 238-243.
Page 11
INT. J. BIOAUTOMATION, 2020, 24(4), 381-392 doi: 10.7546/ijba.2020.24.4.000802
391
20. Qiu Y., K. Huang, F. Xiao, H. Shen (2017). Power-line Interference Suppression in
Electrocardiogram Using Recurrent Neural Networks, 10th International Congress on
Image and Signal Processing, BioMedical Engineering and Informatics (CISP-BMEI),
Shanghai, 1-6, doi: 10.1109/CISP-BMEI.2017.8302231.
21. Yu Ch., G. Li, L. Lin, S. C.-Y. Lu (2005). The Realization of Tracking Power-line
Interference Adaptive Coherent Model Based on Part FFT, Journal of Physics:
Conference Series, 13, 7th International Symposium on Measurement Technology and
Intelligent Instruments, 274-279.
Prof. Ivan Dotsinsky, Ph.D., D.Sc.
E-mail: [email protected]
Ivan Dotsinsky obtained his M.Sc. degree from the Faculty of Electrical
Engineering, Technical University of Sofia. His Ph.D. thesis was on the
statistical assessment of the reliability of electrical and electronic
circuitry. In 1987 he obtained the Dr.Eng.Sc. degree on Instrumentation
of Electrocardiology. Since 1989, he has been a Professor in Biomedical
Engineering. Since 1994, he is a Professor with the Centre of
Biomedical Engineering and the Institute of Biophysics and Biomedical
Engineering, Bulgarian Academy of Sciences. His interests are mainly
in the field of acquisition, preprocessing, analysis and recording of
biomedical signals.
Sen. Assist. Prof. Todor Stoyanov, Ph.D.
E-mail: [email protected]
Todor Stoyanov graduated as M.Sc. from the Faculty of Electronics,
Technical University of Sofia, in 1999. Since then he is with the Centre
of Biomedical Engineering and the Institute of Biophysics and
Biomedical Engineering, Bulgarian Academy of Sciences. He is Senior
Assistant Professor since 2002. He obtained Ph.D. degree in 2005 on
computer aided processing and analysis of electrocardiograms. His
interests are in developing embedded systems for biomedical signal
analysis.
Page 12
INT. J. BIOAUTOMATION, 2020, 24(4), 381-392 doi: 10.7546/ijba.2020.24.4.000802
392
Prof. Georgy Mihov, Ph.D., D.Sc.
E-mail: [email protected]
Georgy Mihov obtained his M.Sc. degree from the Faculty of
Radioelectronics, Technical University of Sofia. His Ph.D. thesis (1983)
was on the programmable devices for treatment and visualization of
ECG. In 2013 he obtained D.Sc. degree on the subtraction procedure for
interferences removal from ECG. Since 2007 Georgy Mihov is a
Professor with the Technical University of Sofia. His interests are
mainly in the field of digital electronics, digital filtration,
microprocessor system applications and servicing. He is a
Corresponding Member of the Bulgarian Academy of Sciences since
2018.
© 2020 by the authors. Licensee Institute of Biophysics and Biomedical Engineering,
Bulgarian Academy of Sciences. This article is an open access article distributed under
the terms and conditions of the Creative Commons Attribution (CC BY) license
(http://creativecommons.org/licenses/by/4.0/).