Research Report Cycles designed to pedal of vehicle category L1e-B Vehicle structure integrity - ratio of auxiliary propulsion power and actual pedal power - 1 - Arbeitsbereich Mechanik I DR.- I NG. E. GROß Report-Speed-EPAC.doc POWER MEASUREMENT AND ROAD LOAD DATA ACQUISITION FOR SPEED EPACS Investigation regarding vehicle structure integrity for cycles designed to pedal of vehicle category L1e-B and ratio of auxiliary propulsion power and actual pedal power Refer to document COMMISSION DELEGATED REGULATION (EU) No 3/2014 of 24 October 2013 Figure 1 Metrology installed on a test vehicle to measure pedal power and auxiliary propulsion power Testing / Documentation Summer and Autumn 2014 / 16 - Mar - 2015 Dr.-Ing. Eric Groß
Transcript
Research Report Cycles designed to pedal of vehicle category L1e-B Vehicle structure integrity - ratio of auxiliary propulsion power and actual pedal power
- 1 -
Arbeitsbereich Mechanik I DR.- ING. E. GROß
Report-Speed-EPAC.doc
POWER MEASUREMENT AND ROAD LOAD DATA ACQUISITION FOR SPEED EPACS
Investigation regarding vehicle structure integrity for cycles designed to pedal
of vehicle category L1e-B and ratio of auxiliary propulsion power and actual pedal power
Refer to document COMMISSION DELEGATED REGULATION (EU) No 3/2014 of 24 October 2013
Figure 1 Metrology installed on a test vehicle to measure pedal power and auxiliary
propulsion power
Testing / Documentation Summer and A utumn 2014 / 16 - Mar - 2015
Dr.-Ing. Eric Groß
Research Report Cycles designed to pedal of vehicle category L1e-B Vehicle structure integrity - ratio of auxiliary propulsion power and actual pedal power
- 2 -
Arbeitsbereich Mechanik I DR.- ING. E. GROß
Report-Speed-EPAC.doc
Abstract In-field measurements have been performed on electrically power assisted cycles of vehicle category L1e-B according to Commission delegated regulation (EU) No 3/2014 of 24 October 2013 to investigate:
- the limitation to ‘four’ of the ratio of auxiliary propulsion power and actual pedal power
- conformity with prescriptions regarding strength and construction of front forks and frames as encompassed in standard EN 14764:2005, specifying safety and performance requirements for the design, assembly, and testing of bicycles and subassemblies intended for use on public roads
A limitation of the added auxiliary propulsion power dependent on the actual pedal power is imperative especially for starting in dense traffic, during cornering or for low speed cruising e.g. in residential streets. This is a safety issue as the investigation state. Without limitation of the ratio constant riding with speeds slower than approx. 15 km/h proved to be hardly possible as well as narrow turns as found on vehicles with manipulated electric motor control to give full auxiliary power independent of pedal power. Comparison have been made using different ratios of auxiliary propulsion power and pedal power showing that a limitation of ratio to “four” is very reasonable.
In many driving conditions this ratio will be lower (typically in the range of 1 to 2 during start up or uphill riding) due to the limited power of the auxiliary propulsion, for cruising at speeds between 30 to 40 km/h for the driver a pedal power requirement of 100 …150 W results from a ratio of four meaning no exhaustion for the driver so that prolonged touring is possible. This results in good handling and driving experience.
Regarding strength and construction the specifications according to standard EN 14764:2005 are not suitable. Already for EPACs, electrically power assisted cycles with a maximum continuous rated power of 250 W and a cut-off speed of 25 km/h, not covered in type approval regulations, the test loads are not appropriate and important tests like a frame fatigue test with horizontal loads is not defined. This has already been taken into account by the standardization and for these vehicles the standard EN 15194 “Cycles — Electrically power assisted cycles — EPAC Bicycles” with adopted loads and extensive tests for the electrical safety is adopted as draft. This standard will also be suitable for cycles of vehicle category L1e-A.
Due to the increased speeds up to 45 km/h the loads for cycles of vehicle category L1e-B are higher than for EPACs (250 W - 25 km/h), but tests carried out according to EN 15194 regarding strength and construction of safety for the relevant components front fork, frame, handlebar and seat post with adopted loads are applicative.
In normal driving conditions the loads are only moderately higher than found for EPACs, but the "bandwidth" of the loads is comparatively large depending on the driver ability. Measurements with drivers of 95. percentile male lead to explicitly higher damage ratios calculated for fork, frame and subassemblies. Since cycles of vehicle category L1e-B are expected to be used also in a more sporty way and will reach higher annual mileage (target group is commuters), these should be taken into account for structural testing and safety requirements. Suitable loads are given in this report.
Research Report Cycles designed to pedal of vehicle category L1e-B Vehicle structure integrity - ratio of auxiliary propulsion power and actual pedal power
2.1 E-bikes for the tests.............................................................................................5 2.2 Test conditions for measurement campaign .......................................................7
3 Test Configuration .....................................................................................................8
3.1 Selection of measuring points.............................................................................8 3.2 Metrology...........................................................................................................10 3.3 Calibration .........................................................................................................13 3.4 Test Tracks ........................................................................................................14 3.5 Test Drivers........................................................................................................16
4 Power Measurements .............................................................................................17
4.1 Test data analysis for comparison..................................................................... 17 4.2 Power requirement for constant speeds ...........................................................19 4.3 Special modifications for investigation ..............................................................20 4.4 Summary of results for a suitable ratio of auxiliary power.................................21
5.1 Estimation of loads for fatigue tests ..................................................................26 5.2 Static tests.........................................................................................................28 5.3 Analysis of data for handlebar and stem assembly fatigue test........................31 5.4 Aditional measurement points not used for the test proposal...........................33
6 Proposed Loads for Fatigue Tests ..........................................................................34
6.1 Handlebar and stem assembly..........................................................................34 6.2 Frame – Fatigue test with pedalling forces .......................................................36 6.3 Frame – Fatigue test with horizontal forces ......................................................37 6.4 Frame – Fatigue test with a vertical force .........................................................38 6.5 Front fork – Bending fatigue test .......................................................................40 6.6 Seat-post – Fatigue test ....................................................................................40 6.7 Summary of proposed test loads for fatigue and static tests for Speed EPAC.41
7 Literature .................................................................................................................43
8 List of Equipment ....................................................................................................44
Technische Universität Hamburg-Harburg Institut für Zuverlässigkeitstechnik
Research Report Cycles designed to pedal of vehicle category L1e-B Vehicle structure integrity - ratio of auxiliary propulsion power and actual pedal power
- 4 -
Arbeitsbereich Mechanik I DR.- ING. E. GROß
Report-Speed-EPAC.doc
1 Introduction Electric Power Assisted Cycles (EPAC) are cycles equipped with an auxiliary electric motor that cannot be exclusively propelled by that motor. In case that the electric power is cut off as the cycle reaches 45 km/h these vehicles are classified as conventional mopeds belonging to vehicle category L1e-B and have to be type-approved according to Regulation 168/2003/EU.
In Commission delegated regulation (EU) No 3/2014 of 24 October 2013, supplementing Regulation (EU) No 168/2013, it is stated (page L 7/2):
(11) The limitation to ‘four’ of the ratio of auxiliary propulsion power and actual pedal power for cycles designed to pedal set out in Annex XIX should be subject to further scientific research and assessment.
Upon availability of scientific data and statistics on vehicles placed on the market, the ratio ‘four’ referred to above may be revisited in a future revision of this Regulation.
Furthermore Annex XIX “Requirements regarding vehicle structure integrity” of the same regulation (page L 7/102) claims:
1.1.1. Vehicles of category L1e-A and cycles designed to pedal of vehicle category L1e-B shall be designed and constructed as to conform with all prescriptions regarding strength and construction of front forks and frames as encompassed in standard EN 14764:2005, specifying safety and performance requirements for the design, assembly, and testing of bicycles and subassemblies intended for use on public roads.
These both topics are covered by this report, prepared by the Institute for Reliability Engineering of Technische Universität Hamburg-Harburg (TUHH) during several student research projects, bachelor and master theses in cooperation with manufacturers from different countries and the Zweirad-Industrie-Verband e. V. (ZIV).
2 Task Description For the investigations regarding the ratio of auxiliary propulsion power and pedal power and for the requirements regarding the vehicle structure integrity in-field load data measurements have been performed.
During foregoing projects load data for conventional bicycles (City- and Trekking bicycles) /1/ and cycles with pedal assistance which are equipped with an auxiliary electric motor having a maximum continuous rated power of 0.25 kW, of which the output is progressively reduced and finally cut off as the vehicle reaches a speed of 25 km/h and for that Regulation 168/2003/EU does not apply, have been acquired /2/. So it is possible to compare the results for the cycles designed to pedal of vehicle category L1e-B with these data to check if standard EN 14764:2005 is appropriate.
Research Report Cycles designed to pedal of vehicle category L1e-B Vehicle structure integrity - ratio of auxiliary propulsion power and actual pedal power
- 5 -
Arbeitsbereich Mechanik I DR.- ING. E. GROß
Report-Speed-EPAC.doc
2.1 E-bikes for the tests
Extensive measurements have been performed using four different test vehicles of different categories. Three of the test vehicles are equipped with an auxiliary rear wheel drive (RWD) and one model is equipped with an electric motor in mid position. An overview of the test vehicles is given in Figure 2 to Figure 5.
Figure 2 Test vehicle 1 and details of installed metrology featuring strain gauges, current sensor, inductive speed sensors and data logger
Figure 3 Test vehicle 2 equipped with metrology for load data acquisition and power measurements
Test vehicle 2: Prototype (modified control)
• Type/category: Trekking bike
• 500W rear wheel hub motor (up to 45 km/h)
• Aluminum frame, suspension fork
• Hydraulic disc brakes
• Derailleur gears
• Mass incl. battery 28 kg
Test vehicle 1: (production condition)
• Type/category: City bike
• 500W rear wheel hub motor (up to 40 km/h)
• Aluminum frame, suspension fork
• Hydraulic rim brakes
• Derailleur gears
• Mass incl. battery 26 kg
Research Report Cycles designed to pedal of vehicle category L1e-B Vehicle structure integrity - ratio of auxiliary propulsion power and actual pedal power
- 6 -
Arbeitsbereich Mechanik I DR.- ING. E. GROß
Report-Speed-EPAC.doc
Figure 4 Test vehicle 3 equipped with metrology for load data acquisition and power measurements
Figure 5 Test vehicle 4 with modified motor control equipped with metrology for power measurements
The measurement equipment is accommodated either in a saddlebag, handlebar bag or bike frame bag as depicted.
For test bikes 1 and 3 (City-bike, Fun bike) the electric motor and control is kept in original condition, for test bike 2 (Trekking bike) the motor can be driven in bang-bang control to give maximum power independent of pedal power and for test bike 4 the motor control is modified by the manufacturer to give switchable fixed ratios of auxiliary propulsion power and actual pedal power.
Test vehicle 4: Prototype (modified control)
• Type/category: Trekking bike
• 350W bottom bracket motor (up to 45 km/h)
• Aluminum frame, hydraulic rim brakes
• Hub gear
• Mass incl. battery 26 kg
Test vehicle 3: (production condition)
• Type/category: Fun bike / commuter
• Back wheel hub motor (up to 45 km/h), no power specification from manufacturer
• Aluminum frame
• Hydraulic disc brakes
• Derailleur gears
• Mass incl. battery 23,8 kg
Research Report Cycles designed to pedal of vehicle category L1e-B Vehicle structure integrity - ratio of auxiliary propulsion power and actual pedal power
- 7 -
Arbeitsbereich Mechanik I DR.- ING. E. GROß
Report-Speed-EPAC.doc
2.2 Test conditions for measurement campaign
Annex V of commission delegated regulation (EU) No 3/2014 points out for endurance testing of functional safety:
ANNEX V Requirements applying to manufacturers’ declaration regarding endurance testing of functional safety critical systems, parts and equipment
1. Requirements for the approval of a type of vehicle with regard to endurance testing
1.1. For the purpose of the statement in conformity with Article 22(2) of, and Annex VIII to, Regulation (EU) No 168/2013:
Vehicles and their systems, parts and equipment critical for functional safety shall be capable of withstanding use under normal conditions and when serviced in accordance with the manufacturer’s recommendations, taking into account regular and scheduled maintenance and specific equipment adjustments carried out as per the clear and unambiguous instructions provided by the vehicle manufacturer in the instruction manual provided with the vehicle.
The normal use of a vehicle shall cover five years after first registration and a total distance travelled equal to 1.5 times the distance as specified in Annex VII to Regulation (EU) No 168/2013 in direct relation to the vehicle category in question and the emission stage (i.e. Euro level) according to which the vehicle is to be type-approved, however, the required distance shall not exceed 60 000 km for any vehicle category. Normal use does not include use under harsh conditions (e.g. extreme cold or heat) and road conditions inflicting damage to the vehicle due to its state of repair.
According to this requirements the design life for vehicles of category L1e-A is defined to 8 250 km (1.5 times 5 500 km) and for vehicles of category L1e-B 16 500 km (1.5 times 11 000 km) are obliged. Furthermore harsh conditions are excluded, so that normal riding is in main focus for the investigation. Nevertheless for the measurements a distinction between service loads and special events is made.
Service loads: Loads during normal use of the vehicle on typical tracks in combination with obtaining environmental conditions.
Special events: Events with a low number of appearances that are part of the normal use and in general can not be affected by the rider.
For the evaluation special events are taken into account like emergency braking, braking into potholes or hitting curbstones.
Research Report Cycles designed to pedal of vehicle category L1e-B Vehicle structure integrity - ratio of auxiliary propulsion power and actual pedal power
- 8 -
Arbeitsbereich Mechanik I DR.- ING. E. GROß
Report-Speed-EPAC.doc
3 Test Configuration
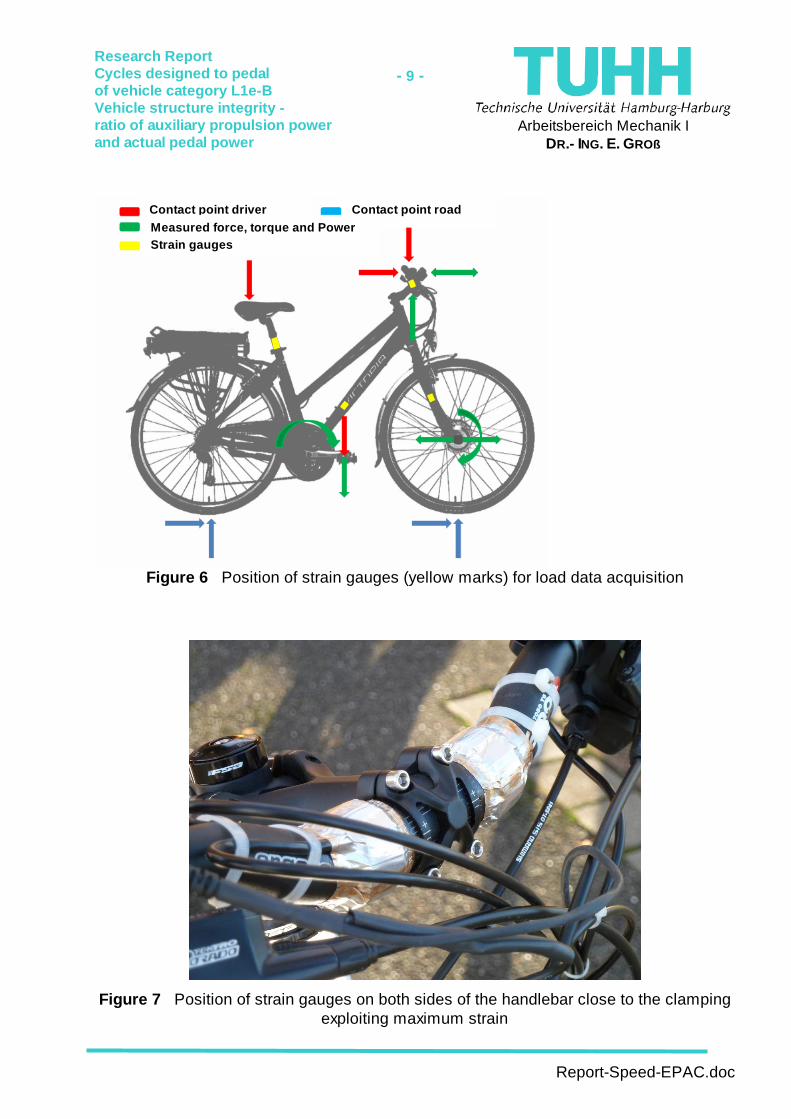
3.1 Selection of measuring points
The determination of the loads to be measured and acting on the safety relevant components of the vehicle structure is based on the points where loads are either incorporated by the driver or by reaction forces during riding.
The estimation of the forces on handlebar, seat post, pedals and frame and fork is performed by strain measurements at appropriate locations of the components.
The driver itself incorporates loads by his weight or muscular activities on the handlebar, the pedals and the saddle. Braking or acceleration maneuvers as well as changing forces in vertical direction induced by the roughness of the track surface generate alternating loads at the contact surfaces between the road and wheels.
The selection of the measuring points is based on well proven existing test standards for bicycles and EPAC bicycles (ISO 4210 and prEN 15194) and the tests performed here.
The loads on the following components are captured during service:
− Handlebar
− Frame – vertical forces induced by saddle and seat post
− Frame – pedalling forces induced by cranks
− Frame/fork –horizontal forces induced by the front fork
Besides this minimal set of measurement locations on some of the vehicles more measurements have been performed taken into account the loads from the brakes or the electric motor.
For all these measurements strain gauges are applied at positions where the induced loads lead to maximum strain of the components, so for example for the handlebar close to the clamping of the stem.
For the estimation of the pedal power besides the pedaling forces the rotational speed of the crank is needed, furthermore the speed of the vehicle must be recorded to identify and compare the driving maneuvers and to calculate the distance traveled during measurements for a lifetime prediction based on driving distances.
For the auxiliary power of the electric motor the input power is measured using voltage and current. The efficiency factor of both the electric motor and the driver (crank – chain – gearshift) is neglected and will not namable influence the estimation of the factor of the ratio of auxiliary propulsion power and pedal power. In general it can be assumed that for the electric motor the efficiency factor is about 90%, for an internal hub gear about 92% to 97% and for derailleur gears about 96% to 98%.
Research Report Cycles designed to pedal of vehicle category L1e-B Vehicle structure integrity - ratio of auxiliary propulsion power and actual pedal power
- 9 -
Arbeitsbereich Mechanik I DR.- ING. E. GROß
Report-Speed-EPAC.doc
Figure 6 Position of strain gauges (yellow marks) for load data acquisition
Figure 7 Position of strain gauges on both sides of the handlebar close to the clamping exploiting maximum strain
Contact point road Contact point driver Measured force, torque and Power Strain gauges
Research Report Cycles designed to pedal of vehicle category L1e-B Vehicle structure integrity - ratio of auxiliary propulsion power and actual pedal power
- 10 -
Arbeitsbereich Mechanik I DR.- ING. E. GROß
Report-Speed-EPAC.doc
3.2 Metrology
All loads are measured using strain gauges. To achieve maximum signal output and to compensate for temperature effects and interfering loads in general full Wheatstone bridges are used.
An example for the wiring of the strain gauges for measuring bending loads is given in Figure 8, the realization on the bike is depicted in Figure 9 showing a double grid strain gauge assuring exactly parallel positions of both measuring grids.
Figure 8 Example for strain gauges interconnected to a full Wheatstone bridge for measurement of bending loads
Figure 9 Application of strain gauges on a handlebar (left) and protective coating for outdoor use (right)
Upper side Wiring diagram of full Wheatstone bridge
Lower side
Research Report Cycles designed to pedal of vehicle category L1e-B Vehicle structure integrity - ratio of auxiliary propulsion power and actual pedal power
- 11 -
Arbeitsbereich Mechanik I DR.- ING. E. GROß
Report-Speed-EPAC.doc
For providing the supply voltage and the balancing of the bride and signal amplification compact strain gauge conditioning amplifiers are used (Figure 10). The appropriate amplification factor is iteratively determined by preliminary road tests ensuring a good signal to noise ratio without overload. Afterwards an individual calibration for each measuring point is conducted.
Figure 10 Compact two channel strain gauge amplifier with switchabe amplifications (left) and data logger (up to 16 analogue channels and 5 digital inputs, right)
Special investigations have been performed during a preliminary project to measure the actual pedal power of the driver because due to the auxiliary electric propulsion for some vehicles the use of a commercial power meter installed instead of the crank arms is not possible.
A general solution with very suitable results is found by utilization of the torsional loads induced into the frame close to the bottom bracket. By placing strain gauges on the down tube the pedaling forces can be measured reliable, a cross check was performed using a commercial power meter (Figure 11).
Research Report Cycles designed to pedal of vehicle category L1e-B Vehicle structure integrity - ratio of auxiliary propulsion power and actual pedal power
- 12 -
Arbeitsbereich Mechanik I DR.- ING. E. GROß
Report-Speed-EPAC.doc
Figure 11 Commercial power meter fitted to an EPAC for comparison to measurements deploying torsional strain on the down tube for torque estimation
The necessary information of the actual rotational speed of the cranks for calculating the pedal power is achieved using a standard commercial magnetic sensor. Besides this speed sensor in Figure 12 the sensor for measuring the electric current can be seen to compare the pedal power with the auxiliary electric power added to propel the vehicle.
Figure 12 Metrology installed on a test vehicle to measure pedal power and auxiliary propulsion power
Current sensor
Rpm crank
Strain gauges for pedalling forces
Strain gauges for pedalling forces
Research Report Cycles designed to pedal of vehicle category L1e-B Vehicle structure integrity - ratio of auxiliary propulsion power and actual pedal power
- 13 -
Arbeitsbereich Mechanik I DR.- ING. E. GROß
Report-Speed-EPAC.doc
For the test vehicle 1 for example the following signals are recorded /5/:
1. Load on the handlebar left side
2. Load on the handlebar right side
3. Fork bending load
4. Frame pedaling force
5. Frame horizontal load measured close to steering tube
6. Saddle/seat post
For test vehicle 3 the following signals are recorded /6/:
1. Load on the handlebar left side
2. Torsional load on the stem
3. Fork/frame horizontal load
4. Frame pedaling force
5. Frame torque on chain stay due to electric motor and disc brake
6. Saddle/seat post
Beside these loads the electric input to the motor is recorded and the rotational speed of the crank and the vehicle speed. All data are recorded using a data logger, the sampling frequency is set to 1 kHz enabling high resolution data acquisition even for transient pulses as they occur by driving through potholes or on cobblestone pavement.
Using either strain gauges on both sides of the handlebar (see Figure 7) or by measuring the loads induced to the handlebar on one side and the torsional loads in the stem a differentiation between in-phase and out-of-phase loads for the handlebar is feasible.
3.3 Calibration
For all loads a direct calibration has been performed by inducing known forces to the defined force application points according to test standards (ISO 4210, prEN 15194). Therefore adequate test loads can be directly derived from the field data collected during the measurement campaigns.
The loads are introduced using a calibrated precision force transducer tied to the appropriate force application point as depicted in Figure 13. The following positions are used according to test standards:
− Handlebar and stem: 50 mm from the free end of the handlebar
− Fork: horizontal to the front fork drop-outs
− Frame pedaling forces: mid of pedal, vertical downward force at a position approx. 150 mm from the centre-line of the frame
Research Report Cycles designed to pedal of vehicle category L1e-B Vehicle structure integrity - ratio of auxiliary propulsion power and actual pedal power
- 14 -
Arbeitsbereich Mechanik I DR.- ING. E. GROß
Report-Speed-EPAC.doc
− Saddle/seat post: vertical downward at a position 70 mm behind the intersection of the saddle surface and the axis of the seat post
The signal of the strain gauges and the calibrated force transducer are recorded simultaneously and the individual calibration factor is calculated. By scaling the strain gauge signal with this calibration factor compared to the force transducer a simple check of the calibration and the linearity of the complete measurement chain is possible as depicted in Figure 13 for a handlebar with strain gauges on both sides.
F
Figure 13 Calibration of strain gauges at the handlebar using a precision force transducer and comparison of signals (red and green: force transducer and
handlebar left side, blue and yellow: force transducer and handlebar right side)
3.4 Test Tracks
Different types of roads have been used for the measurement campaign including cobblestones and dirt tracks (Figure 14). Because normal use is in focus for the load data acquisition, most tracks have been driven with typical speed and normal care of the riders. Nevertheless to get information for maximum loads some special events are taken into account like emergency braking, braking into potholes or passing curbstones.
Time response
-4.000
199.00
50.00
100.00
150.00
0.00 14.00 4.000 8.000 12.00Time (seconds)
10 : 1X+ 10KMD
05-Jun-14 10:51:5
11 : 1X+ 11Lenker links
05-Jun-14 10:51:5
9 : 1X+ 9KMD
05-Jun-14 10:55:3
10 : 1X+ 10Lenker rechts
05-Jun-14 10:55:3
Research Report Cycles designed to pedal of vehicle category L1e-B Vehicle structure integrity - ratio of auxiliary propulsion power and actual pedal power
- 15 -
Arbeitsbereich Mechanik I DR.- ING. E. GROß
Report-Speed-EPAC.doc
Figure 14 Tracks for measurement campaign (examples)
For power measurements and road load data acquisition besides the different track surfaces streets with uphill and downhill gradients up to 12% are included in the investigations.
Figure 15 Extreme hill climbing on test track with a gradient of 12%
Cobblestone irregular (Belgian block) and moved reg ularly, dirt road
Asphalt road and inner city traffic, paved trail (c linker)
Research Report Cycles designed to pedal of vehicle category L1e-B Vehicle structure integrity - ratio of auxiliary propulsion power and actual pedal power
- 16 -
Arbeitsbereich Mechanik I DR.- ING. E. GROß
Report-Speed-EPAC.doc
35%
15%15%
10%
5%
10%
10%
Asphalt road, good conditionAsphalt road, damaged, potholesInner city trafficPaved trail (clinker)Belgian block
Cobblestones regularyDirt track
Figure 16 Distribution of tracks used for measurement campaign
The distribution of the tracks used for data acquisition is of course not exactly the same for all test vehicles because these have been driven individually by the different test drivers on different routes. This is done intentional to achieve more distributed data representing typical usage.
Nevertheless a rough estimation can be made regarding the tracks that have been used for the measurements. The approximately distribution that the collected data is based on respectively the load spectra calculation uses is depicted in Figure 16. A relativ high part of bad tracks (cobblestone, asphalt road with damages, dirt track) is included to cover harder driving conditions.
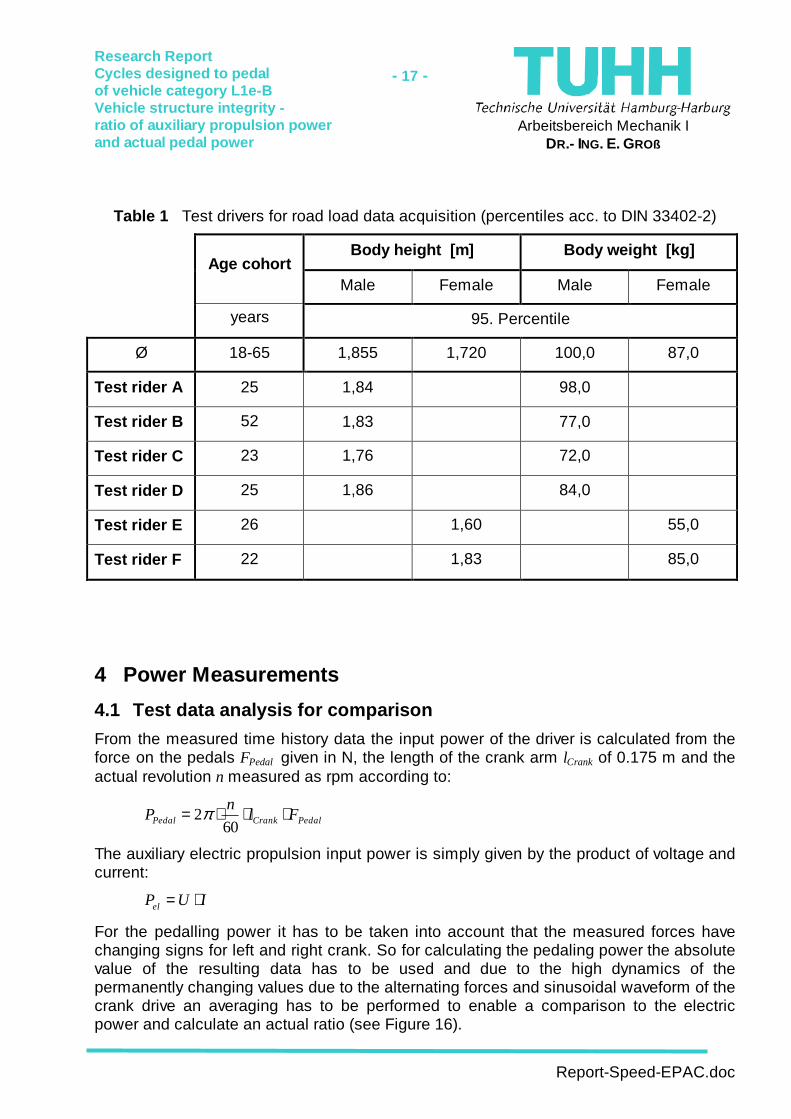
3.5 Test Drivers
Test drivers for this campaign should cover a greatest possible part of users / population (including 5th percentile female and 95th percentile male), so the following test drivers covering the given mass and size where riding the test vehicles to collect data on typical roads as described before.
As with the distribution of tracks for the test drivers special care has been taken to include 95th percentile female and male drivers to cover higher loads.
Research Report Cycles designed to pedal of vehicle category L1e-B Vehicle structure integrity - ratio of auxiliary propulsion power and actual pedal power
- 17 -
Arbeitsbereich Mechanik I DR.- ING. E. GROß
Report-Speed-EPAC.doc
Table 1 Test drivers for road load data acquisition (percentiles acc. to DIN 33402-2)
Body height [m] Body weight [kg] Age cohort
Male Female Male Female
years 95. Percentile
Ø 18-65 1,855 1,720 100,0 87,0
Test rider A 25 1,84 98,0
Test rider B 52 1,83 77,0
Test rider C 23 1,76 72,0
Test rider D 25 1,86 84,0
Test rider E 26 1,60 55,0
Test rider F 22 1,83 85,0
4 Power Measurements
4.1 Test data analysis for comparison
From the measured time history data the input power of the driver is calculated from the force on the pedals FPedal given in N, the length of the crank arm lCrank of 0.175 m and the actual revolution n measured as rpm according to:
PedalCrankPedal Fln
P ⋅⋅⋅=60
2π
The auxiliary electric propulsion input power is simply given by the product of voltage and current:
IUPel ⋅=
For the pedalling power it has to be taken into account that the measured forces have changing signs for left and right crank. So for calculating the pedaling power the absolute value of the resulting data has to be used and due to the high dynamics of the permanently changing values due to the alternating forces and sinusoidal waveform of the crank drive an averaging has to be performed to enable a comparison to the electric power and calculate an actual ratio (see Figure 16).
Research Report Cycles designed to pedal of vehicle category L1e-B Vehicle structure integrity - ratio of auxiliary propulsion power and actual pedal power
Figure 16 Measured data for rotation in min-1 and forces in N of the crank and calculated pedal power in W as raw data and averaged
With the averaged pedal power a comparison of the actual auxiliary electric power to the pedal power can be performed as depicted by the graph In Figure 17 by calculation the ratio Pel / PPedal.
As can be directly seen from this data applied on test vehicle 3 where no rated power is given from the manufacturer this vehicle has a maximum auxiliary elctric power of 370 W. Further in this short example of driving in normal traffic with multiple acceleration and deceleration maneuvers the overall ratio Pel / PPedal is nearly one meaning that driver and electric motor nearly due the same job.
During acceleration the pedalling (or human) power exceeds the auxiliary electric power, gving a ratio of Pel / PPedal of lesthanone, the maximum assistance ratio Pel / PPedal in this example is found to be close to two.
Research Report Cycles designed to pedal of vehicle category L1e-B Vehicle structure integrity - ratio of auxiliary propulsion power and actual pedal power
Figure 17 Comparison of actual pedal power (red curve) and auxiliary electric power (green) in W for test vehicle 3
For all test vehicles the claimed cut-off speed of 45 km/h respectively 40 km/h is verified by the measurements, none of the vehicles for the tests give auxiliary propulsion above this speed limit.
4.2 Power requirement for constant speeds
After application of power measurement tools it is quite simple to investigate the power requirement for constant speed to achieve a speed-power diagram. Measurements are made on a flat track without inclination and weather conditions with no wind.
Pedal Power Vehicle 3
electric Power Vehicle 3
Research Report Cycles designed to pedal of vehicle category L1e-B Vehicle structure integrity - ratio of auxiliary propulsion power and actual pedal power
- 20 -
Arbeitsbereich Mechanik I DR.- ING. E. GROß
Report-Speed-EPAC.doc
Power requirement for Speed EPAC(flat track, no wind)
0
100
200
300
400
500
600
700
800
900
1000
0 5 10 15 20 25 30 35 40 45 50
Speed [kph]
Pow
er [W
]
Power (measured)
3rd order regression
Figure 18 Power requirement of Speed EPACs measured on flat track
It can be seen that with 400 W nominal power a constant speed on flat track and normal seating position of approximately 35 km/h will be reached.
If the driver adds up to 100 W to 150 W a speed of 40 km/h is possible. Therefore, and also due to the limited battery capacity, Speed EPACs are not necessarily designed to drive at constant speed over longer distances at 45 km/h, but 35 km/h to 40 km/h, driven easily, are possible with quite comfortable effort for the driver.
Furthermore it can be seen from the diagram in Figure 18 that the proposed ratio of auxiliary propulsion power and actual pedal power of four will allow an average driver able to provide a pedalling power of 100 W to 150 W for longer distances to propel the vehicle at 35 km/h to 40 km/h.
4.3 Special modifications for investigation
As mentioned in chapter 2.1 two of the test vehicles have been modified by the manufacturer to further investigate the ratio of auxiliary propulsion power and pedal power.
Test vehicle 2
At test vehicle 2 it is possible to switch the motor control for the auxiliary propulsion into bang-bang mode meaning that full electric power is supplied independent of the pedal power as soon as a certain low threshold value is reached.
Furthermore the maximum electric current for this vehicle is set to 25 A so that a maximum input power fed to the electric motor from the 36 V battery of 900 W results.
Research Report Cycles designed to pedal of vehicle category L1e-B Vehicle structure integrity - ratio of auxiliary propulsion power and actual pedal power
- 21 -
Arbeitsbereich Mechanik I DR.- ING. E. GROß
Report-Speed-EPAC.doc
Test vehicle 4
For test vehicle 4 the manufacturer created a special software that is dependent on the mode supported. According to the requirements a fixed support ratio from electric power of the motor to pedalling power of the driver is regulated as follows:
- Eco: 2: 1
- Tour: 4: 1
- Sport: 5: 1
- Turbo: 6: 1
This ratio is adjusted up to 43 km/h, then it is linearly cut off within 2 km/h so that the legal speed limit is adhered to. The actual support ratio is displayed on the HMI in "range / range" in percent. In “Eco” mode, this value should therefore be permanently at 200, 400 in “Tour”, etc.
It has to be taken into account that the electric motor is limited in its maximum torque. So when the driver pushes correspondingly strong in the pedals, the predetermined ratio can not be met and drops. This will especially quickly occur in “Turbo” mode.
4.4 Summary of results for a suitable ratio of auxi liary power
Starting the analysis of the measurements performed with test vehicle 4 with the modified software it is found that the maximum power of the electric motor of 350 W of this vehicle in most driving conditions cuts of the desired support ratio from electric power to pedalling power. As mentioned above this is not only found especially in “Turbo” mode, but already in “Tour” mode. For driving at constant speed the following pedal power is measured:
Table 2: Pedal power for fixed ratios Pel to PPedal measured at test vehicle 4
Ratio Pel / PPed “Eco” 2 / 1 “Tour” 4 / 1 “Turbo” 6 / 1
Pedal power at 10 km/h 47 W 36 W 27 W
Pedal power at 20 km/h 93 W 70 W 56 W
Pedal power at 30 km/h 186 W 162 W 154 W
It can be seen that the pedal power does not fit to the predefined ratios for auxiliary propulsion power, and the reason is given by this fixed ratio: the electric motor is switched on and off especially at the lower speeds and higher ratios. This results in an uncomfortable riding experience.
For the ratio of 2 : 1 this effect is nearly not noticeable, up to the ratio of 4 : 1 this behavior is acceptable, at 6 : 1 it is irritating and annoying.
This effect is much more pronounced by the results that are derived from test vehicle 2 driven in bang-bang control. An example of data taken for speed, current of the electric motor and the pedal force is depicted in Figure 19. Clearly the “on-off” characteristics of
Research Report Cycles designed to pedal of vehicle category L1e-B Vehicle structure integrity - ratio of auxiliary propulsion power and actual pedal power
- 22 -
Arbeitsbereich Mechanik I DR.- ING. E. GROß
Report-Speed-EPAC.doc
the motor current is visible resulting in accelerating the vehicle always up to approximately 17 km/h to 18 km/h as lowest possible speed while pedalling. Driving a constant low speed is nearly impossible except by intermediate pedalling.
This combination of a simple control and a relativ powerful auxiliary propulsion prooves that a limitation of the ratio of auxiliary propulsion power and actual pedal power is necessary. For the investigated test vehicle problems especially occur besides constant slow speed driving for starting while cornering or for driving narrow turns. This is a real safety issue found during the investigation because handling under this condition proved to be quite difficult.
Time response
0.00
30.00
10.00
20.00
0.00 60.00 20.00 40.00Zeit 1X+
24 : 1X+ 24
Time response
-10.00
30.00
0.00
10.00
20.00
0.00 60.00 20.00 40.00Zeit 1X+
25 : 1X+ 25
Time response
-710.00
770.00
-400.00
0.00
400.00
0.00 60.00 20.00 40.00Zeit 1X+
26 : 1X+ 26
Figure 19 Power measurement at test vehicle 2 in bang-bang control mode resulting in permanently switching of motor current at lower speeds
Test vehicle 1 and 3 remained in original software condition resulting in a much more comfortable riding experience. Especially the software permanently adopted the ratio depending on the pedaling forces. This can be clearly seen in the example of measured data of test vehicle 1 equipped with a electric motor of nominal 500 W continuous rated power and some headroom left for accelerating or uphill. Under this condition 650 W are supplied to the auxiliary propulsion as depicted by the green graph in Figure 20.
For riding at constant speeds a certain ratio is regulated that typically is in the range of 1.2 to 2.0 (Figure 21).
Research Report Cycles designed to pedal of vehicle category L1e-B Vehicle structure integrity - ratio of auxiliary propulsion power and actual pedal power
- 23 -
Arbeitsbereich Mechanik I DR.- ING. E. GROß
Report-Speed-EPAC.doc
Time response
0.00
800.00
200.00
400.00
600.00
30.00 110.00 40.00 60.00 80.00Time (seconds)
14 : 1X+ 14human power crankS-Pedelec Sparta
21 : 1X+ 21el. power motor
S-Pedelec Sparta
22 : 1X+ 22Speed km/h
S-Pedelec Sparta
Figure 20 Power measurements of test vehicle 1
Time response
0.00
800.00
200.00
400.00
600.00
10.00 80.00 20.00 40.00 60.00Time (seconds)
14 : 1X+ 14human power crankS-Pedelec Sparta
15 : 1X+ 15el. power motor
S-Pedelec Sparta
18 : 1X+ 18Speed km/h
S-Pedelec Sparta
Figure 21 Assistance ratio Pel / PPedal of test vehicle 1 at constant speed
Figure 22 gives an impression of the control dynamics of test vehicle 1 and it can be seen, that for normal riding the auxiliary electric power plotted in green overshoots the pedal power of the rider plotted in red. Nevertheless a ratio of “four” is never exceeded as can directly be seen from Figure 23 showing data taken for a normal start up of the vehicle.
Continous rated power
Research Report Cycles designed to pedal of vehicle category L1e-B Vehicle structure integrity - ratio of auxiliary propulsion power and actual pedal power
- 24 -
Arbeitsbereich Mechanik I DR.- ING. E. GROß
Report-Speed-EPAC.doc
Time response
0.00
800.00
200.00
400.00
600.00
200.00 410.00 250.00 300.00 350.00Time (seconds)
14 : 1X+ 14human power crankS-Pedelec Sparta
21 : 1X+ 21el. power motor
S-Pedelec Sparta
22 : 1X+ 22Speed km/h
S-Pedelec Sparta
Figure 22 Pedalling power (red) and auxiliary electric propulsion power (green) of test vehicle 1 for mixed service (blue: speed in km/h)
Figure 23 Speed, pedalling power, electric power and assistance ratio Pel / PPedal of test vehicle 1 for starting and driving at constant speed on flat track
Research Report Cycles designed to pedal of vehicle category L1e-B Vehicle structure integrity - ratio of auxiliary propulsion power and actual pedal power
- 25 -
Arbeitsbereich Mechanik I DR.- ING. E. GROß
Report-Speed-EPAC.doc
A comparable control algorithm is found for test vehicle 3 despite the fact that the electric motor is only capable to provide 370 W as maximum power as already depicted in Figure 17. According to the lower auxiliary power a ratio of “four” is not reached.
By evaluation of the measurements performed on the test vehicles and regarding the power requirements the following shall be subsumed:
• A limitation of the ratio of the added auxiliary propulsion power dependent on the actual pedal power is necessary to provide a safe handling for starting, during cornering or for low speed cruising. This proved to be a safety issue found during test drives with manipulated control for the electric motor. Without a limitation dangerous driving situations may occur due to too hard unintentional acceleration or the impossibility for slow speed riding.
• For the investigated Speed EPACs where the motor control is kept in original condition a maximum assistance in auxiliary propulsion power by factor of approx. 3.5 is found
• In many driving conditions, especially riding at constant speed, this factor (electric power / human power) is identified by measurements within the range of 1 to 2.
• These factors (maximum of 4, typically at 2) result in good handling and driving experience.
• For speeds between 30 to 40 km/h (cruise speed) for the driver a power requirement of 100 …150 W results – meaning no exhaustion for the driver for longer periods.
• A limitation to a factor of 4 for the auxiliary power by electric assistance as scheduled in regulation (EU) No 3/2014 proved to be very reasonable.
Research Report Cycles designed to pedal of vehicle category L1e-B Vehicle structure integrity - ratio of auxiliary propulsion power and actual pedal power
- 26 -
Arbeitsbereich Mechanik I DR.- ING. E. GROß
Report-Speed-EPAC.doc
5 Load Data
5.1 Estimation of loads for fatigue tests
All loads are recorded as time history data and according to the random character for analysis (see Figure 24 as an example) this data has to be reworked.
The load histories applied to the different components like handlebar, frame or fork are irregular in nature, whereas materials data for cyclic loading are usually obtained from constant amplitude tests.
In order to use test data for fatigue analysis of irregular load histories, the cycles must be extracted. Several methods to extract cycles exist, best proven are counting techniques that take into account that for fatigue hysteresis effects are essential and therefore cycles between the highest peak and lowest valley in the spectrum are combined. The most commonly used methods are range-mean-pair and rainflow counting, which produce equivalent results if done properly.
Rainflow counting is a two dimensional counting technique because for every range-pair (maximum-minimum) an associated mean value is extracted. For the fatigue analysis in this case mean stress correction models should be used. For the measured loads on bicycle components in this project this is neglected because either the loads are predominately nearly symmetrically changing or swelling from zero to maximum as for example found for the seat post.
From the recorded time histories (load-time data) load spectra can be determined giving the number of fully reversed cycles for certain loads to compare these data with a S-N-curve (Woehler curve). This will allow a service life calculation, based on the determination of appropriate test loads.
The approach used here does this service life calculation based on a fictitious S-N-curve with a Woehler coefficient of k = 6.2 that has been derived from tests of several aluminium components of bicycles. This S-N-curve is used to perform a damage calculation according to Miner´s rule. The S-N-curve is moved in vertical axis to a point of a proposed test force for a dynamic test with 100 000 load cycles as it is common for fatigue tests for bicycle parts in all standards (ISO 4210, prEN 15194, EN 14764, EN 14766).
Figure 25 gives an example for “Frame – Fatigue test with pedalling forces”. The Rainflow counting gives the load spectrum as plotted in blue diamonds in the graph. This is the distribution of loads and number of cycles for the driving distance for that the data is collected. This data is multiplied to the desired service life (in kilometres) for the vehicle, resulting in the number of occurences as depicted by the red squares in the graph.
Afterwards for each load step and appropriate number of cycles the partly damage ratio is calculated compared to the S-N-curve for 100 000 cycles at the claimed test force, in this example 1 000 N for the fatigue test with pedalling forces, and this partly ratios are cumulated to the total damage ratio. As far as this cumulative damage ratio is less than “one”, the test load will assure the desired service life defined as the scheduled driving distance.
Research Report Cycles designed to pedal of vehicle category L1e-B Vehicle structure integrity - ratio of auxiliary propulsion power and actual pedal power
- 27 -
Arbeitsbereich Mechanik I DR.- ING. E. GROß
Report-Speed-EPAC.doc
Time response
-1350.00
1080.00
-1000.00
-500.00
0.00
500.00
0.00 3280.00 1000.00 2000.00Time (seconds) 1X+
12 : 1X+ 12
Time response
-430.00
510.00
-200.00
0.00
200.00
400.00
0.00 3280.00 1000.00 2000.00Time (seconds) 1X+
13 : 1X+ 13
Time response
-90.00
130.00
-50.00
0.00
50.00
100.00
0.00 3280.00 1000.00 2000.00Time (seconds) 1X+
14 : 1X+ 14
Time response
-210.00
160.00
-100.00
0.00
100.00
0.00 3280.00 1000.00 2000.00Time (seconds) 1X+
15 : 1X+ 15
Time response
-290.00
1500.00
0.00
500.00
1000.00
0.00 3280.00 1000.00 2000.00Time (seconds) 1X+
16 : 1X+ 16
Time response
-1610.00
1480.00
-1000.00
0.00
1000.00
0.00 3280.00 1000.00 2000.00Time (seconds) 1X+
17 : 1X+ 17
Time response
-20.00
10.00
-10.00
0.00
0.00 3280.00 1000.00 2000.00Time (seconds) 1X+
18 : 1X+ 18
Time response
0.00
50.00
10.00
20.00
30.00
40.00
0.00 3280.00 1000.00 2000.00Time (seconds) 1X+
19 : 1X+ 19
Time response
0.00
30.00
10.00
20.00
0.00 3280.00 1000.00 2000.00Time (seconds) 1X+
21 : 1X+ 21
Figure 24 Time history data of forces on front fork, handlebar left, torque on stem and at chainstay, forces at seat post, pedalling forces, motor current, speed and resulting driving
distance of test drives taken from test vehicle 3
Research Report Cycles designed to pedal of vehicle category L1e-B Vehicle structure integrity - ratio of auxiliary propulsion power and actual pedal power
- 28 -
Arbeitsbereich Mechanik I DR.- ING. E. GROß
Report-Speed-EPAC.doc
Kollektiv Kurbelkraft max. Belastung Messstrecke 17,7 km und extrapoliert auf 1 000 km
Figure 25 Calculation of test forces for fatigue test with 100 000 load cycles based on measured loads (blue: measured data, red: extrapolation to scheduled design life and
calculation of damage ratio referring to fictitious Woehler curve)
For test vehicles 1, 2 and 3 data is recorded for more than 20 km driving distance each, test vehicle 4 with its modified software for the motor control is mainly used for power measurements which have been reduced to a shorter distance because of limited information resulting from the modification.
As already pointed out in chapter 2.2 vehicles of category L1e-B shall cover a minimum service life of 16 500 km under normal driving conditions, harsh conditions are excluded.
To assure this predefined running distance the calculation of appropriate test loads is based on an extrapolation of the measured data to a minimum of 20 000 km. So for the calculation of the fatigue test loads the resulting number of cycles is typically multiplied by a factor of 1 000 for a provided service life of 20 000 km.
5.2 Static tests
As found in the standards for bicycles and EPACs (ISO 4210 / prEN 15194) for many components static tests and fatigue tests are defined. Following these standards for Speed EPACs the same test setups shall be used, therefore static tests for the following components have to be defined:
Load spectrum pedalling forces
Number of cycles
Force [N]
Measured data
Extrapolation to design limit
Research Report Cycles designed to pedal of vehicle category L1e-B Vehicle structure integrity - ratio of auxiliary propulsion power and actual pedal power
- 29 -
Arbeitsbereich Mechanik I DR.- ING. E. GROß
Report-Speed-EPAC.doc
• Handlebar and stem assembly – Lateral bending test
• Front fork – Static bending test
• Seat post – Static strength test
In opposite to the bicycles standards a permanent deformation after performing the static tests shall be admissible, the criteria to pass the tests shall only be no fracture or cracks.
Appropriate test forces directly can be derived from the measured load data by looking at the maximum values found during service. For service loads at the handlebar during normal use maximum values of 510 N have been recorded (see Figure 24), for special events the maximum is found by crossing a curbstone with 18 km/h, what can be rated as incorrect use, reaching up to 700 N (Figure 26).
Time response
-350.00
750.00
0.00
400.00
5.000 75.00 20.00 40.00 60.00Time (seconds)
4 : 1X+ 4Handlebar left
Curbstone
5 : 1X+ 5Handlebar right
Curbstone
Figure 26 Time history data of forces on handlebar left and right, incorrect use by hitting a curbstone with 18 km/h without driver activity (maximum values for handlebar)
By taking into account a certain safety margin a test load of 800 N for the static test of handlebar and stem assembly is applicable. This value is similar to the test in prEN 15194.
For the horizontal forces acting on the front fork during normal use maximum values of 1300 N have been recorded as can be seen from Figure 24, for special events again the maximum value is found by hitting a curbstone with 18 km/h, rated as incorrect use or misuse. This value is found to go up to 2000 N as plotted in Figure 27, even by taking into account the steering angle of the front fork of 71° to 73° because the test is defined with a test force perpendicular to the front fork axis the maximum value still results in approximately 1900 N. This is beyond the demands even for Mountain bicycles although this manoeuvre will give similar values for bicycles without electric assistance.
Research Report Cycles designed to pedal of vehicle category L1e-B Vehicle structure integrity - ratio of auxiliary propulsion power and actual pedal power
- 30 -
Arbeitsbereich Mechanik I DR.- ING. E. GROß
Report-Speed-EPAC.doc
Rating this event as misuse the static value as defined for Mountain bicycles shall be used for a static test with a force of 1500 N.
A detailed view to these measurements shows that from the transient pulse of hitting the curb an oscillation of the front fork results (Figure 28). This leads to an extreme peak-to-peak range of nearly double value leading to very high damage ratio. Cause of this behaviour is a vibration mode of the front fork /3/.
Time response
-2000.00
2100.00
-1000.00
0.00
1000.00
5.000 75.00 20.00 40.00 60.00Time (seconds)
1 : 1X+ 1Fork hor. Force
25-Nov-14 10:51:08 Figure 27 Time history data of horizontal forces on front fork, incorrect use by hitting a
curbstone with 18 km/h without driver activity (maximum value for fork)
Time response
-2000.00
2100.00
-1000.00
0.00
1000.00
32.80 33.80 33.00 33.20 33.40 33.60Time (seconds)
1 : 1X+ 1Fork hor. Force
25-Nov-14 10:51:08
4 : 1X+ 4Handlebar left
Curbstone
5 : 1X+ 5Handlebar right
Curbstone Figure 28 Time history data, detailed view of data according to Figure 26 and 27,
oscillating load of front fork (red), loads on handlebar (green and blue)
Research Report Cycles designed to pedal of vehicle category L1e-B Vehicle structure integrity - ratio of auxiliary propulsion power and actual pedal power
- 31 -
Arbeitsbereich Mechanik I DR.- ING. E. GROß
Report-Speed-EPAC.doc
Figure 29 Damaged rim after driving tests hitting a curbstone to obtain maximum loads
For the seat post maximum forces of 1500 N are measured during service, so the test force of 2000 N used for all bicycle types and EPACs is well suited.
5.3 Analysis of data for handlebar and stem assembl y fatigue test
For the handlebar a stem assembly a two stage test is well proven for bicycle components taken into account that in-phase and out-of-phase loads are attached. In-phase loads appear from road roughness acting on the front wheel, out-of-phase loads are attached from the driver during pedalling out of saddle.
Therefore a diversification into in-phase and out-of-phase loads has to be derived from the measured data. This can be done by either application of strain gauges on both side of the handelbar or by measuring the loads on one side of the handlebar and the torque at the stem. Following the analysis for an application of strain gauges on both sides of the handlebar is explained.
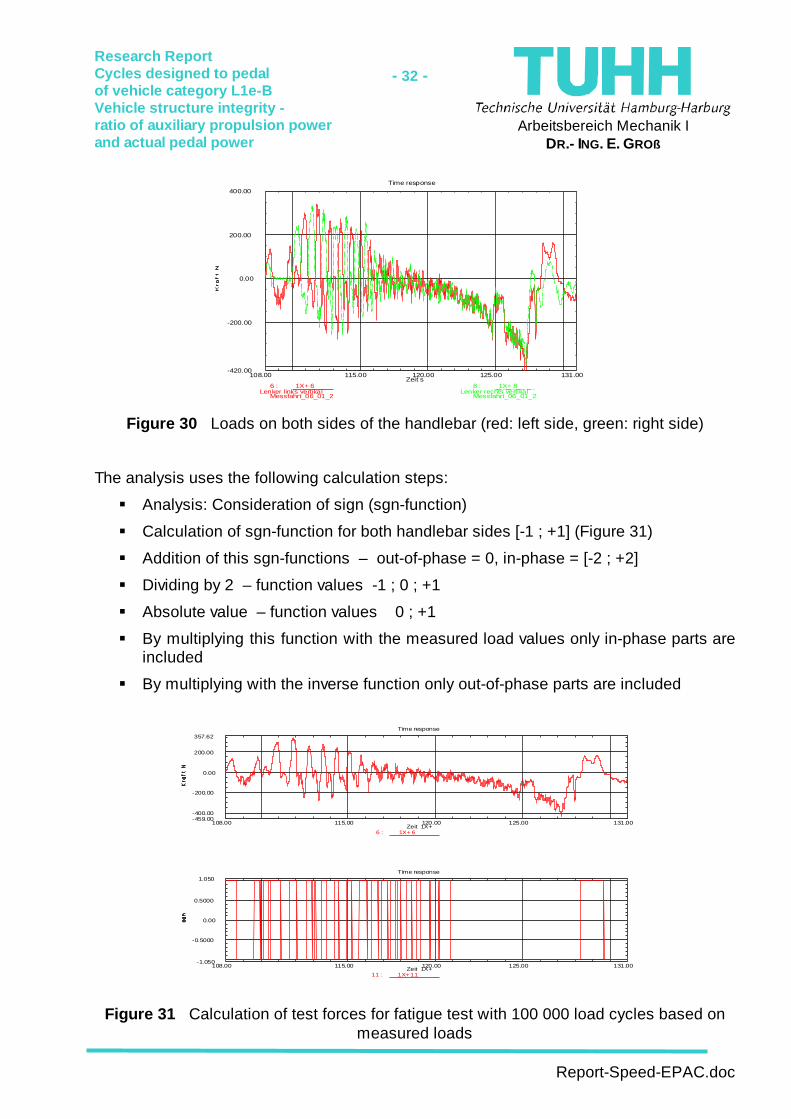
Figure 30 depicts a short time window for the measured forces at the left side (red curve) and the right side (green curve) of the handlebar. At the beginning of this time window clearly out-of-phase loads appear with alternating loads, at the end of this time window a bump appears resulting in an in-phase load for both sides of the handlebar.
Research Report Cycles designed to pedal of vehicle category L1e-B Vehicle structure integrity - ratio of auxiliary propulsion power and actual pedal power
- 32 -
Arbeitsbereich Mechanik I DR.- ING. E. GROß
Report-Speed-EPAC.doc
Time response
-420.00
400.00
-200.00
0.00
200.00
108.00 131.00 115.00 120.00 125.00Zeit s
6 : 1X+ 6Lenker links vertikal
Messfahrt_06_01_2
8 : 1X+ 8Lenker rechts vertikal
Messfahrt_06_01_2
Figure 30 Loads on both sides of the handlebar (red: left side, green: right side)
The analysis uses the following calculation steps:
� Analysis: Consideration of sign (sgn-function)
� Calculation of sgn-function for both handlebar sides [-1 ; +1] (Figure 31)
� Addition of this sgn-functions – out-of-phase = 0, in-phase = [-2 ; +2]
� Dividing by 2 – function values -1 ; 0 ; +1
� Absolute value – function values 0 ; +1
� By multiplying this function with the measured load values only in-phase parts are included
� By multiplying with the inverse function only out-of-phase parts are included
Time response
-459.00
357.62
-400.00
-200.00
0.00
200.00
108.00 131.00 115.00 120.00 125.00Zeit 1X+
6 : 1X+ 6
Time response
-1.050
1.050
-0.5000
0.00
0.5000
108.00 131.00 115.00 120.00 125.00Zeit 1X+
11 : 1X+ 11
Figure 31 Calculation of test forces for fatigue test with 100 000 load cycles based on measured loads
Research Report Cycles designed to pedal of vehicle category L1e-B Vehicle structure integrity - ratio of auxiliary propulsion power and actual pedal power
- 33 -
Arbeitsbereich Mechanik I DR.- ING. E. GROß
Report-Speed-EPAC.doc
The resulting time histories of this example are plotted in Figure 32. These data then are analyzed using the Rainflow counting method.
Time response
-501.15
406.16
-400.00
-200.00
0.00
200.00
108.00 131.00 115.00 120.00 125.00Zeit s
15 : 1X+ 15Lenker rechts vertikal
gleichphasig
18 : 1X+ 18Lenker rechts vertikal
gegenphasig
Figure 32 Dividing of loads in out-of-phase parts (green curve) and in-phase loads (red curve)
5.4 Aditional measurement points not used for the t est proposal
Besides the measurements necessary to obtain data for the test methods used for bicycles and EPACs additional meassurement points have been aplicated as listed in Chapter 3.2. So for the test vehicle 1 an additional signal is recorded at the frame to measure the horizontal load close to the steering tube because this vehicle is designed using a single tube between steering tube and bottom bracket.
The loads in the single tube frame proved to be fully covered by the strain gauges applicated to the front fork, seat post and at the bottom bracket measuring the pedalling forces. A very high coherence is found compared to the loads measured at the front fork, so this data is not explicity analyzed any further.
For test vehicle 2 and 3 as additional signal the torque on the chain stay due to electric motor and disc brake has been recorded. Maximum torques of approximately 160 Nm acting on the chain stay have been recorded. For a typical back frame no critical stresses will result from the torque support of hub motor or disc brake and no additional test for back wheel hub motors is necessary.
Test vehicle 4 is supplied with a reduced number of strain gauges for load measurements because this vehicle is mainly used to investigate the characteristics of auxiliary propulsion power and therefore equiped withn a special control software, furthermore this prototype model utilizes a special non suspended rigid frame to measure shock and vibration loads at the electric components used in another project /7) and will not provide typical load data for fork, frame and subassemblies.
Research Report Cycles designed to pedal of vehicle category L1e-B Vehicle structure integrity - ratio of auxiliary propulsion power and actual pedal power
- 34 -
Arbeitsbereich Mechanik I DR.- ING. E. GROß
Report-Speed-EPAC.doc
6 Proposed Loads for Fatigue Tests Following fatigue test forces are proposed based on the load spectra achieved by Rainflow counting and compared to a single stage fatigue test with 100 000 load cycles (fully reversed cycles) for each safety relevant component.
6.1 Handlebar and stem assembly
Figure 33 shows an overview of the loads on the handlebar before dividing the data into in-phase and out-of-phase forces. For test vehicles 2 and 3 (trekking bike and fun bike) that both are driven in a sporty way and predominately by drivers of 95. percentile male the data has been extracted to 20 000 km, for test vehicle 1 (city bike) driven by 50. percentile drivers the data has been extracted to 50 000 km. For these load spectra the calculated damage ratio is approximately the same and the proposed test forces are based on these values.
Load spectrum handlebar vertical forces extrapolate t to >20 000 km
Figure 33 Load spectra of forces on handlebar for test vehicles 1 to 3
After calculation of the in-phase and out-of-phase loads spectra as depicted in Figure 34 and 35 results and for a total damage of approximately 0.5 for each load case the test loads according to Figure 36 are proposed.
As can be seen by the different total running distances of test vehicles 2 and 3 compared to test vehicle 1 with a more upright position of the driver the loads in upright driving position are noticeable lower than for the sporty position and the straight handlebar.
Research Report Cycles designed to pedal of vehicle category L1e-B Vehicle structure integrity - ratio of auxiliary propulsion power and actual pedal power
- 35 -
Arbeitsbereich Mechanik I DR.- ING. E. GROß
Report-Speed-EPAC.doc
Especially the maximum forces are lower, nevertheless only one proposed test level shall be given for all kinds of Speed EPAC.
Load spectrum handlebar out-of-phase forces extrapolatet to >20 000 km
Figure 35 Load spectra of in-phase forces on handlebar
Research Report Cycles designed to pedal of vehicle category L1e-B Vehicle structure integrity - ratio of auxiliary propulsion power and actual pedal power
- 36 -
Arbeitsbereich Mechanik I DR.- ING. E. GROß
Report-Speed-EPAC.doc
270 N
270 N
270 N
270 N
370 N
370 N 370 N
370 N
Figure 36 Proposed loads for handlebar and stem assembly fatigue tests with out-of-phase loads (left) and in-phase loads (right)
6.2 Frame – Fatigue test with pedalling forces
As already found out during measurement campaigns for EPAC according to prEN 15194 (25 km/h – 250 W) the pedalling forces do not increase for cycles with an auxiliary propulsion. Exactly the same is found in this investigation, contrary the loads on the pedals are even reduced because the driver gets some extra power provided by the electrical drive system. So the muscular force loads on the cranks decrease in motor assisted operation and the fatigue test as descried in the standard prEN 15194 can be used.
Load spectrum pedalling forces extrapolatet to >20 000 km
Figure 37 Load spectra of pedalling forces for test vehicles 1 to 3
Research Report Cycles designed to pedal of vehicle category L1e-B Vehicle structure integrity - ratio of auxiliary propulsion power and actual pedal power
- 37 -
Arbeitsbereich Mechanik I DR.- ING. E. GROß
Report-Speed-EPAC.doc
Figure 38 Proposed load for Frame – Fatigue test with pedalling forces according to prEN 15194 / EN 14764 / ISO 4210
6.3 Frame – Fatigue test with horizontal forces
Especially this test – not included in EN 14764:2005 but adopted in prEN 15194 with increased loads compared to ISO 4210 Part 6 – is critical for Speed EPAC due to higher speeds inducing higher forces by shocks from potholes, cobblestones or any irregularities from roads. The higher speed does not necessary influence the maximum forces during breaking because the brake performance is the same as found on normal bicycles or EPAC – but the braking distances get longer at higher speeds and therefore the time exposure under braking forces increases resulting in more load cycles due to changing forces caused by road roughness during breaking and more braking incidents occur due to higher speeds.
As already pointed out in Chapter 5.2 for the horizontal forces acting on the front fork during normal use maximum values of 1300 N have been recorded, load spectra for the test vehicles is plotted in Figure 39.
If for example the data from test vehicle 3 (fun bike) is used and a dynamic test load of ±800 N is assumed for 100 000 load cycles a damage ratio of D = 1.03 results for a service life of 16 500 km as stated as the minimum requirement according to Regulation (EU) No 168/2013. For a test load of ±850 N and a service life of 20 000 km this value calculates to D = 0.85 leaving a certain safety margin. Of course it has to be taken into account that these measurements have been performed using a 95. percentile male rider.
The proposed load for a frame fatigue test with horizontal forces therefore is set to ±850 N, unlike the test for Mountain bicycles according to ISO 4210 Part 6 a symmetrical load is proposed because mean loads are found to be comparatively low and the asymmetry for the Mountain bicycles seem to be resulting of including jumps into the load data. The proposed demand for the Speed EPACs is comparable with the requested fatigue test according to ISO 4210 Part 6 for Mountain bicycles because in ISO for the Mountain bicycles the number of cycles for this frame test is reduced to 50 000.
1000 N
Research Report Cycles designed to pedal of vehicle category L1e-B Vehicle structure integrity - ratio of auxiliary propulsion power and actual pedal power
- 38 -
Arbeitsbereich Mechanik I DR.- ING. E. GROß
Report-Speed-EPAC.doc
Load spectrum front fork horizontal forces extrapol atet to >20 000 km
Figure 39 Load spectra of forces on front fork for test vehicles 1 to 3
Figure 40 Proposed load for Frame – Fatigue test with horizontal forces test set up according to prEN 15194 / ISO 4210 with increased forces
6.4 Frame – Fatigue test with a vertical force
Due to higher speeds the loads acting via the saddle onto the frame in vertical direction are increased caused by road shocks and accordingly the reaction forces by the driver are higher. As can be seen from Figure 41 for test vehicle 1 (city bike) with a suspension seat post the forces are remarkable lower. Nevertheless the test demand for the frame shall
+850 N -850 N
Research Report Cycles designed to pedal of vehicle category L1e-B Vehicle structure integrity - ratio of auxiliary propulsion power and actual pedal power
- 39 -
Arbeitsbereich Mechanik I DR.- ING. E. GROß
Report-Speed-EPAC.doc
be defined for non suspended seat posts. The same test values shall be used as in prEN 15194 (Figure 42).
Load spectrum forces on seat post extrapolatet to > 20 000 km
Figure 41 Load spectra of vertical forces acting on the seat post for test vehicles 1 to 3
Figure 42 Proposed load for Frame – Fatigue test with a vertical force according to prEN 15194
1100 N
Research Report Cycles designed to pedal of vehicle category L1e-B Vehicle structure integrity - ratio of auxiliary propulsion power and actual pedal power
- 40 -
Arbeitsbereich Mechanik I DR.- ING. E. GROß
Report-Speed-EPAC.doc
6.5 Front fork – Bending fatigue test
In the standards for bicycles a discrepancy exists by comparing the fatigue tests for the frame with horizontal forces and the bending fatigue test for the single front fork. At least the test as described here in Chapter 6.3 shall be performed with the supplied fork and a separate test for the front fork should not be necessary.
Nevertheless a separate test is defined in the standards with no conform loads compared to the frame fatigue test. For example in ISO 4210 Part 6 the fork shall be tested with ±650 N which is not comparable to the demand of 1200 N forward / 600 N backward for the frame fatigue test.
It is proposed to perform the Frame – Fatigue test with horizontal forces using the supplied front fork and therefore a separate test for the fork shall be dropped.
6.6 Seat-post – Fatigue test
The demands for the seat post are similar to the Frame – Fatigue test with a vertical force and therefore as before for the front fork the frame test shall be performed using the seat post supplied. Otherwise the test forces are the same for a separate fatigue test.
For the seat post a static test as for bicycles or EPACs with a load of 2 000 N is suitable.
Research Report Cycles designed to pedal of vehicle category L1e-B Vehicle structure integrity - ratio of auxiliary propulsion power and actual pedal power
- 41 -
Arbeitsbereich Mechanik I DR.- ING. E. GROß
Report-Speed-EPAC.doc
6.7 Summary of proposed test loads for fatigue and static tests for Speed EPAC
Table 3: Loads for dynamic (100 000 cycles) and static tests of safety relevant components
Speed EPAC
(L1e-B)
(45 km/h)
prEN 15194
EPAC
(25 km/h)
ISO 4210
Mountain
bicycles
[EN 14766] 2)
ISO 4210
City &
Trekking
bicycles
[EN 14764] 2)
Handlebar and stem assembly– Fatigue test
out of phase
in phase
±270 N 1)
±370 N
±220 N
±280 N
±270 N [±270 N]
±450 N [±450 N]
±200 N [±200 N]
±250 N [±250 N]
Handlebar and stem assembly – Lateral bending test (static test)
800 N
800 N
1000 N [1000 N]
600 N [600 N]
Frame – Fatigue test with pedalling forces
0 N to 1000 N 0 N to 1000 N 0 N to 1200 N [0 N to 1200 N]
0 N to 1000 N [0 N to 1000 N]
Frame – Fatigue test with a vertical force
0 N to 1100 N 0 N to 1100 N 0 N to 1200 N [0 N to 1200 N]
0 N to 1000 N [0 N to 1000 N]
Frame – Fatigue test with horizontal forces
±850 N ±500 N
±600 N (with front motor)
1200 N forward 600 N rearward (50 000 cycles) [same for EN]
±450 N
[n.a.]
Front fork – Bending fatigue test
Shall be covered by
Frame – Fatigue test with
horizontal forces
±500 N ±650 N [±650 N] ±450 N [±450 N]
Front fork – Static bending test
1500 N 1500 N 1500 N [1500 N] 1000 N [1000 N]
Seat-post – Fatigue test 0 N to 1100 N 0 N to 1000 N 0 N to 1200 N [0 N to 1200 N]
0 N to 1000 N [0 N to 1000 N]
Seat-post – Static strength test
2000 N 2000 N 2000 N [n.a.]
2000 N [n.a.]
1) Changes compared to prEN 15194 printed in bold 2) Values for standards EN 14766 resp. EN 14764 given in square brackets
Research Report Cycles designed to pedal of vehicle category L1e-B Vehicle structure integrity - ratio of auxiliary propulsion power and actual pedal power
- 42 -
Arbeitsbereich Mechanik I DR.- ING. E. GROß
Report-Speed-EPAC.doc
As a resume it can be stated that for driving on intermixed route profiles (mostly asphalt roads, cobblestones, rough road) the loads measured at Speed EPACs are partly below or in some cases similar to that of mountain bicycles, so parts that are suitable for MTB as encompassed in standard ISO 4210 are sufficiently dimensioned for Speed EPAC.
To conclude the measurements and data analysis:
• Due to increased speeds the loads caused by road excitation (surface roughness, potholes, cobblestones) in service for Speed EPACs are higher than for EPACs (250 W - 25 km / h).
• Test methods according to prEN 15194 with adopted loads are suitable.
• In normal driving conditions, loads are found only slightly higher than found for EPACs, but the "bandwidth" of loads is quite large influenced by the driver. Based on a sporty driving style of a driver of 95. percentile male the measurements lead to higher damage ratios most notably for front fork, handle bar and seat post.
• Since Speed EPACs are expected to a more frequent use (commuters) and longer driving distances, these should be taken into account for structural testing.
• For an intermixed route profile (mostly asphalt roads, partly cobblestones and rough or unpaved roads) the loads are below or comparable to that of mountain bicycles, so parts that are suitable for mountain bicycles are sufficiently dimensioned for Speed EPACs.
As result of this investigation Annex XIX “Requirements regarding vehicle structure integrity” of Commission delegated regulation (EU) No 3/2014 of 24 October 2013 can be worded as following:
1.1.1. Vehicles of category L1e-A and cycles designed to pedal of vehicle category L1e-B shall be designed and constructed as to conform with all prescriptions regarding strength and construction of front forks, frames, steering and saddle and seat posts as encompassed in standard EN 15194:2015 specifying safety and performance requirements for the design, assembly, and testing of EPAC bicycles and subassemblies intended for use on public roads.
For cycles designed to pedal of vehicle category L1e-B due to higher speeds adopted test loads compared to the values given in EN 15194:2015 shall be used for handlebar and stem assembly – fatigue test, frame – fatigue test with a vertical force, frame – fatigue test with horizontal forces, front fork – bending fatigue test and seat-post – fatigue test.
The loads can be listed like in Table 3 of this document using the columns for Speed EPAC (L1e-B) and EPAC (prEN 15194).
Research Report Cycles designed to pedal of vehicle category L1e-B Vehicle structure integrity - ratio of auxiliary propulsion power and actual pedal power
- 43 -
Arbeitsbereich Mechanik I DR.- ING. E. GROß
Report-Speed-EPAC.doc
7 Literature
/1/ Ermittlung der Betriebslasten an Fahrrädern des öffentlichen Straßenverkehrs (Ausrüstung gemäß StVZO); Bericht zum Forschungsprojekt / Projekt-Nr. 2.9556 der Bundesanstalt für Straßenwesen, Projekt-Nr. 1106 des VFM, Hamburg 1997
/2/ Betriebslastenermittlung an Pedelec Fahrrädern Johannes Koch, Master Thesis TUHH, Hamburg 2010
/3/ The difference between tuning forks and bicycle forks – and why bicycle frames suffer from that Eric Gross, Second International Conference on Material and Component Performance under Variable Amplitude Loading, DVM, Darmstadt 2009
/4/ Ermittlung der maximalen Betriebslasten bei einem S-Pedelec Kathrin Lewerenz, Projektarbeit TUHH, Hamburg 2012
/5/ Ermittlung der Betriebslasten und Leistungsmessungen an einem S-Pedelc als Grundlage der künftigen EG Typenzulassung (Determination of operating loads and performance measurements on a Speed EPAC as the basis of future EG type approval) Jorrid Lund, Bachelorarbeit TUHH, Hamburg 2014
/6/ Ermittlung der Betriebslasten an einem S-Pedelec Christoph Petershagen, Projektarbeit TUHH, Hamburg 2014
/7/ Ermittlung der Belastungen zur Herleitung einer Schwingungs- und Stoßprüfung für Pedelecs und S-Pedelecs im Rahmen einer genormten Umweltprüfung von Elektro-Fahrrädern Anne Schröder, Bachelorarbeit TUHH, Hamburg 2014
Referenced standards
EN 14764:2005 City and trekking bicycles – Safety requirements and test methods (withdrawn)
EN 14766:2005 Mountain-bicycles – Safety requirements and test methods (withdrawn)
ISO 4210:2015 Cycles – Safety requirements for bicycles – Part 1 to Part 9 (substitutes EN 14764:2005, EN 14766:2005 and EN 14781:2005)
Research Report Cycles designed to pedal of vehicle category L1e-B Vehicle structure integrity - ratio of auxiliary propulsion power and actual pedal power
- 44 -
Arbeitsbereich Mechanik I DR.- ING. E. GROß
Report-Speed-EPAC.doc
8 List of Equipment
Data logger Tellert CFDL1 (16 channel analog input, 5 channel digital input, compact flash memory 8 GB)
Strain gauge DC bridge amplifier Tellert DCBA 2M
Current sensor converter Tellert CS 2M
Speed sensor Sigma
Strain gauges Measurements Group, 350 Ohm, Series CEA, EA