International Journal of Engineering Sciences & Emerging Technologies, Dec. 2013.
ISSN: 2231 – 6604 Volume 6, Issue 3, pp: 267-286 ©IJESET
267
POWER, PERFORMANCE AND ENERGY GENERATION
ANALYSIS OF HORIZONTAL AXIS WIND TURBINES
T.Shanmuga vadivel1, N.Mohan doss Gandhi2, P.Balashanmugam3 1Professor, Department of Mechanical Engg., Annamalai University, Chidambaram, India.
2Principal, Kalaignar Karunanidhi Institute of Technology, Coimbatore, India 3Assistant Professor, Department of Mechanical Engineering,
Annamalai University, Chidambaram, India.
ABSTRACT The year 1973 has awakened the entire world from the energy crisis. Since then the entire focus of all
developing countries turned towards non-conventional sources of energy. Of all the non-conventional energy
sources wind energy is an inexhaustible, non-polluting, freely available energy. Enormous potential is
associated with the kinetic energy of the wind. Previously the KE of the wind was utilized to drive wind turbines
mostly for pumping water and grinding corns. The first wind turbine was employed for generation electricity in
Denmark in 1890.India has started its power generation through (WEGs) from 1986. Later on number of wind
electric generators (WEGs) has been installed every year. The next generation of wind turbines, developed by
U.S.Dept. Of Energy, has to produce power at 25% lesser energy costs. In Tamil Nadu, Muppanthal is a place
situated in the coastal region of Kanyakumari District. It is highly noted for its large number of wind turbines.
Herein we have selected three different wind energy generators viz. NEPC, WINCO & TTG each of 250 kW
capacities and undergone the power performance studies for each system and for different wind speed
conditions. The density of air, total energy available in the wind, the energy actually converted by WEGs into
electric power (Power co-efficient) are calculated and tabulated as per the wind energy standards IEC – 61400
–12. The characteristic curves such as wind velocity Vs power output (power curve), wind velocity Vs efficiency
are plotted. The energy generation, technical availability, real availability, plant load factor, energy generation
per square metre of rotor area and energy generation per kW installed capacity also calculated and the results
are tabulated.
KEYWORDS : Blade Design, Horizontal, and Vertical axis wind turbines, wind rotor, wind turbine
I. INTRODUCTION
Renewable energy is expected a curable man impact in the production of electricity. Wind Power is
globally the fastest growing energy source. Energy needs of man vary with life style, seasons,
industrial progress etc.Rural man of today requires lower energy man the urban man. Urban man is
dependent on electric energy. The renewable are available free of cost. Hence, consumption if
renewable should be maximized. Wind electric generators (WEG is) harnessing the power of wind
energy the clean natural power for India. In Muppanthal and Kayathar wind farm, several wind
electric generator ranges from 80 Kw to 1250 Kw are installed. New Renewable Sources of Energy
(NRSE) schemes under ministry of non-conventional energy, India has planned by 9th plan (1998 –
2003) 2000 Mw wind farms. Wind speed between 7 m/s and 25 m/s are favorable for the wind turbine
generator.
Wind energy to electrical energy has become economically competitive in areas of favorable wind
(e.g.) south zone of Tamil Nadu (Kayathar and Muppanthal) and wind electric energy systems are
now in the forefront of renewable energy utilization projects sponsored by the Department of Non
Conventional Renewable Branch (DNRB). In Muppanthal large wind turbine generators cover a wide
International Journal of Engineering Sciences & Emerging Technologies, Dec. 2013.
ISSN: 2231 – 6604 Volume 6, Issue 3, pp: 267-286 ©IJESET
268
ranges from 80 Kw to 1250 Kw. Wind energy is considered to be a very clear, cheap important
renewable energy source particularly rural areas, remote on shore and off shore installation away from
main electrical grid. Wind turbine generators ranges from 80 – 1250 Kw with 3 blades, horizontal
shaft design mounted on a tower are being manufactured on commercial scale in several countries in
the world. Such generators are commercially very successful initial technical snags have now been
removed and reliable designed are in operations.
1.1. Wind power
Wind power is the conversion of wind energy into a useful form of energy, such as using wind
turbines to make electrical power, windmills for mechanical power, wind pumps for water pumping or
drainage, or sails to propel ships. Large wind farms consist of hundreds of individual wind turbines,
which are connected to the electric power transmission network. For new constructions, onshore wind
is an inexpensive source of electricity, competitive with or in many places cheaper than fossil fuel
plants. Small onshore wind farms provide electricity to isolated locations. Utility companies
increasingly buy surplus electricity produced by small domestic wind turbines. Offshore wind is
steadier and stronger than on land, and offshore farms have less visual impact, but construction and
maintenance costs are considerably higher. Wind power, as an alternative to fossil fuels, is plentiful,
renewable, widely distributed, clean, produces no greenhouse gas emissions during operation and uses
little land. The effects on the environment are generally less problematic than those from other power
sources. As of 2011, Denmark is generating more than a quarter of its electricity from wind and 83
countries around the world are using wind power to supply the electricity grid. In 2010 wind energy,
production was over 2.5% of total worldwide electricity usage, and growing rapidly at more than 25%
per annum.Wind power is very consistent from year to year but has significant variation over shorter
time scales. The intermittency of wind seldom creates problems when used to supply up to 20% of
total electricity demand, but as the proportion increases, a need to upgrade the grid, and a lowered
ability to supplant conventional production can occur. Power management techniques such as having
excess capacity storage, geographically distributed turbines, dispatchable backing sources, storage
such as pumped-storage hydroelectricity, exporting and importing power to neighboring areas or
reducing demand when wind production is low, can greatly mitigate these problems. In addition,
weather forecasting permits the electricity network to be readied for the predictable variations in
production that occur.
1.2. Wind energy
Wind energy is the kinetic energy of air in motion, also called wind. Total wind energy flowing
through an imaginary area A during the time t is:
Where ρ is the density of air; v is the wind speed; Avt is the volume of air passing through A (which is
considered perpendicular to the direction of the wind); Avtρ is therefore the mass m passing per unit
time. Note that ½ ρv2 is the kinetic energy of the moving air per unit volume.Power is energy per unit
time, so the wind power incident on A (e.g. equal to the rotor area of a wind turbine) is:
Wind power in an open-air stream is thus proportional to the third power of the wind speed; the
available power increases eightfold when the wind speed doubles. Wind turbines for grid electricity
therefore need to be especially efficient at greater wind speeds. Wind is the movement of air across
the surface of the Earth, affected by areas of high pressure and of low pressure. The surface of the
Earth is heated unevenly by the Sun, depending on factors such as the angle of incidence of the sun's
rays at the surface (which differs with latitude and time of day) and whether the land is open or
covered with vegetation. Also, large bodies of water, such as the oceans, heat up and cool down
slower than the land. The heat energy absorbed at the Earth's surface is transferred to the air directly
above it and, as warmer air is less dense than cooler air, it rises above the cool air to form areas of
International Journal of Engineering Sciences & Emerging Technologies, Dec. 2013.
ISSN: 2231 – 6604 Volume 6, Issue 3, pp: 267-286 ©IJESET
269
high pressure and thus pressure differentials. The rotation of the Earth drags the atmosphere around
with it causing turbulence. These effects combine to cause a constantly varying pattern of winds
across the surface of the Earth. The total amount of economically extractable power available from
the wind is considerably more than present human power use from all sources. Axel Kleidon of the
Max Planck Institute in Germany, carried out a "top down" calculation on how much wind energy
there is, starting with the incoming solar radiation that drives the winds by creating temperature
differences in the atmosphere. He concluded that somewhere between 18 TW and 68 TW could be
extracted. Cristina Archer and Mark Z. Jacobson presented a "bottom-up" estimate, which unlike
Kleidon's are based on actual measurements of wind speeds, and found that there is 1700 TW of wind
power at an altitude of 100 metres over land and sea. Of this, "between 72 and 170 TW could be
extracted in a practical and cost-competitive manner". They later estimated 80 TW. However,
research at University estimates 1 Watt/m2 on average and 2–10 MW/km2 capacity for large-scale
wind farms, suggesting that these estimates of total global wind resources are too high by a factor of
about 4.
II. PREVIOUS WORK
Adigun et al (2010), in their project, carried out a study on the generation of electricity using a wind
turbine. An analysis was carried out on a horizontal axis wind turbine designed for the environmental
conditions of the University of Port Harcourt, Nigeria. The maximum power achievable was 322W at
a wind speed of 10m/s from the result of analysis. This shows that a vertical axis wind turbine is more
suitable for regions with low wind speed like Nigeria since it can attain a power range of 322W at a
lower wind speed (5m/s to 6m/s).
Javier (2011), in his project, designed a small-scale vertical axis wind turbine rotor with solid wood
as a construction material. "The aerodynamic analysis is performed implementing a momentum based
model on a mathematical computer program. The results obtained indicate that wood is a suitable
material for rotor construction and a further development of the computer algorithm is needed in order
to improve the flow conditions simulation". The blade aerodynamic analysis is a very important
aspect of a wind turbines performance and should always be carried out before any design of a wind
turbine system.
Sina and Mahyar (2011), in their paper studied maximum power control of wind turbine using
permanent magnet synchronous generator connected with two back to back voltage source converters
to grid. In this paper; "The machine currents are controlled by indirect vector control method. In this
method, generator side converter controls the maximum excitation (air gap flux) by machine's d-axis
current and controls generator torque by machine's q-axis current. Permanent magnet synchronous
generator speed is controlled by tip speed ratio upon the wind speed variations to generate the
maximum output power. Grid side converter regulates the DC link voltage and injective active power
by d-axis current and regulates the injective reactive power by q-axis current using simple control
method". The P-Q Simulation results in the paper depicts that the proposed method operates properly.
The control of a wind turbine working with varying speed using a converter model is very important
when connecting the turbine to a grid. It should have a maximum power point tracking (MPPT)
functionality to extract more power from wind.
Thomsen and Srensen (1999), analyzed the wind power plants installed in the early 1980s suffered
structural failures chiefly because of incomplete understanding of the wind forces (especially the
turbulence component) acting on these large structures and in some cases because of poor quality in
manufacture. Failure of the rotor blades was one of the principal and most serious structural failures.
An investigation was performed by De-Goeij et al. (1999), for the implementation of bending-torsion
coupling of a composite wind turbine rotor blade to provide passive pitch-control. Limited passive
torsion deformation is realized with a structural coupling between flap wise bending and elastic twist
of a constant speed rotor-blade. The blade and skin laminate configuration are analyzed with a FEM
program, in which a complete blade with spar webs is modeled.A probabilistic model for analysis of
the safety of a wind-turbine rotor blade against failure in ultimate loading is presented by Ronold and
Larsen (2000). Failure in ultimate loading of wind-turbine rotor blades exposed to wind and gravity
loading is a failure mode that needs to be considered when the rotor blades are designed.
International Journal of Engineering Sciences & Emerging Technologies, Dec. 2013.
ISSN: 2231 – 6604 Volume 6, Issue 3, pp: 267-286 ©IJESET
270
Maalawi and Negm (2002), worked on the optimization strategy of maximizing the system natural
frequencies, which are the true measure of the overall level of the stiffness-to-mass ratio. Higher
natural frequencies are favorable for reducing both the steady state and transient responses of the
structure being excited. The behavior of these frequencies and their variation with the selected
optimization variables are investigated in detail. It is shown that global optimality can be attained
from the developed structural model and a new concept for the exact placement of the system
frequencies is also presented.
A rod model given by Baumgart (2002), for slender, tapered, closed structures is presented and
applied to a wind turbine blade. The mathematical model is solved as an eigenvalue problem and the
results are compared with an experimental modal analysis. Even though the general model
characteristics (position of nodal points, direction of motion) match quite well, the chord rotation for
some mode shapes is significantly underestimated. The question remains as to what assumptions in
the modeling process are the main sources of these differences (e.g., parameter uncertainties,
unisotropic material, geometry, order of Taylor series expansion in x and y).
Ahmed et al. (2010), was to design 700 kw wind turbine hub. The conventional hub used so far
is of circular type but problem with such hub is that many casting defects arise; so it was
decided to use straight beams of standard cross sections and fabricate them to make skeleton
of hub. Initially the simplest triangular hub was designed but due to space problem it was
decided to select hexagonal hub. The concept of this hexagonal hub is totally new and was
never used earlier. All the loads caused by wind and inertia on the blades are transferred to
the hub, so mechanical strength of hub becomes very vital in the wind turbine design. The
design has been done according to type’s approval provision scheme. The mechanical as well
as other safety considerations have been considered in this design. The analysis involves use of
modeling and simulation software. The stress and deflection were also calculated in this study. This is
a static analysis and preliminary stage of design, so many more improvement can be incorporated in
future.
This work of Tao et al. (1997), reports a progressive study of aerodynamic behavior of HAWT rotor
blades (airfoil), focusing on modeling the stall-and post-stall characteristics as applied to the
prediction of rotor performance under various field conditions. The methodology developed here may
be generalized to provide a procedure used in the computer analysis.
There exist significant differences in airfoil aerodynamic characteristics between wind tunnel test data
(Two Dimensional flow) and field test data (Three Dimensional flow). Through the Combined
Experiment Program (CEP), efforts have been made to investigate proper approaches to analyze such
differences so that it enables us to incorporate the results into wind turbine rotor performance codes to
assist in optimal design of a horizontal axis wind turbine.
This study of Ebert and Wood (1997), describes measurements in the wake of a small horizontal-
axis wind turbine. The turbine had two constant-chords, constant-pitch blades which drove a hydraulic
pump against a known load to extract power from the wind. This power was measured using a
specially constructed dynamometer. The main limitation of the experiment was the high blockage so
measurements were confined to the first two chord lengths downstream of the blades.
This study considered firstly the conventional mean velocities in the axial and circumferential
direction for tip speed ratios of 2, 4 and 6. The axial velocity was nearly uniform at the operating
condition closest to that giving maximum power as was the circulation determined from the
circumferential velocity. Because of the small amount of wake expansion the bound circulation must
also be nearly constant. To introduce the three-dimensional measurements, the downstream
development of the circumferential profiles of the mean velocities and turbulent energy were
presented for tip speed ratios of 2 and 4. These measurements were obtained in the region away from
the tip and hub vortices and so are dominated, in terms of turbulence, by the wakes of the blades.
A variable-speed, fixed-pitch wind turbine control strategy was investigated by Muljadi et al.
(2000), to evaluate the feasibility of constraining rotor speed and power output without the benefit of
active aerodynamic control devices. A strategy was postulated to control rotational speed by
specifying the demanded generator torque. By controlling rotor speed in relation to wind speed, the
aerodynamic power extracted by the blades from the wind was manipulated. Specifically, the blades
were caused to stall in high winds. In low and moderate winds, the demanded generator torque and the
International Journal of Engineering Sciences & Emerging Technologies, Dec. 2013.
ISSN: 2231 – 6604 Volume 6, Issue 3, pp: 267-286 ©IJESET
271
resulting rotor speed were controlled and the wind turbine operated near maximum efficiency.
Turbine models were developed and simulations of operation in turbulent winds were conducted.
Results indicated that rotor speed and power output were well regulated.
The rotational speed of the wind blades can be increased using steering aerofoil surrounding the
blades. The blade profiles are designed using the theory of aerodynamics. The steering airfoils are
fixed surrounding the wind blades at an optimum distance. The number of the airfoils and the angle of
inclination (tilt) of the foils can be changed. In the experiment performed by Varol and Varol
(2001), the ambient conditions are held constant. Because of the optimum adjustment of the distance
and angle of the airfoils the rotational speed of the blades can be increased by 32% on the
experimental device.
A method for determining the optimum design parameters for horizontal axis wind turbines was
developed and tested by Collecutt and Flay (1996). These design parameters were the rotor diameter,
rated power and tower height. The optimum values were found to be dependent on site wind regime.
The results of the study indicated that it was, however, only the optimization of the relative
combination of rotor diameter and rated power with respect to site mean annual wind speedthat
afforded significant reductions in energy production cost. This optimization confirmed that presently
available wind turbines were optimized for mean annual wind speeds in the range 6-8 m sec-1 and
suggested that for windier sites the energy production cost may be reduced by up to 10% through the
optimization of machine rated wind speed to suit such sites.
III. WIND TURBINE-ENERGY GENERATION
As the wind speed is fluctuating throughout the year, the energy generation readings of three WEGs
namely NEPC, TTG and WINCON are taken for one year (May 2003 – April 2004) and the technical
availability, real availability, plant load factor, generation in KWh / m2 rotor area and generation is
kWh/kW installed capacity are calculated on monthly basis, the values are tabulated in the tables and
also plotted on graphs. The performance of WEGs is also measured in terms of technical availability,
real availability and plant load factor. Technical availability is the fraction of time the WEG is ready
for use except maintenance hours in a particular duration.
Total hours-Maint. Hours
Technical Availability =
Total hours
Real availability is the fraction of time in a particular duration, the WEG is actually working.
Total hours-total stoppage hours
Real availability =
Total hours
Plant load factor is the ratio of actual energy generated by a WEG in a particular duration to the
maximum energy that can be generated at rated power.
Actual generation
Plant load factor =
Max. generation at rated power
3.1. Horizontal wind turbine or horizontal axis wind turbine
A horizontal wind turbine or horizontal axis wind turbine has been modernized from the traditional
windmill designs that have been around us for centuries. A nacelle installed perpendicular to the
tower and horizontal with respect to the ground justifies the name of the turbine. Most common
models for drawing energy from wind, the horizontal wind turbines offer a number of advantages. The
main parts of a horizontal wind turbine are as mentioned below:
Main rotor shaft
Electrical generator
Gearbox to boost the rotation speed of the blades.
Turbine blades, having great stiffness to prevent them from being pushed into the post
A wind vane is used to point the small turbines, whereas, a wind sensor is used for a big horizontal
wind turbine.
International Journal of Engineering Sciences & Emerging Technologies, Dec. 2013.
ISSN: 2231 – 6604 Volume 6, Issue 3, pp: 267-286 ©IJESET
272
3.2. Types of Generators
Based on the types of generators, there are two varieties of horizontal wind turbines. The first one
makes use of asynchronous generator in which the turbine is directly connected to the electric grid.
The second variety of horizontal wind turbine has synchronous generator. In this, the turbine has a
varying output, which needs to be passed through a rectifier and an inverter before being fed into the
electric grid.
3.3. Types of Horizontal Wind Turbines
While tracing the history of horizontal axis wind turbine, you will come across its three types, used in
different eras:
A 12th century horizontal wind turbine consisted of four blades, and were used to grid grain
and pump water. Most recently, this type of wind turbine was installed in the Netherlands to
generate electricity.
The 19th century horizontal windmill was used to pump water, fill railroad tanks and to
generate power in the rural areas. These wind turbines consisted of multiple number of
blades. One can still find these wind turbines used in areas where commercial power
generation is expensive.
Motor wind turbines are the modern form of horizontal wind turbine and are used to produce
electricity at commercial level. These are generally 3-blade turbines and use computer-
monitored motors for operation.
3.4. Advantages of Horizontal Wind Turbines
Variable pitch of blades used for horizontal wind turbine allows it to collect maximum
amount of energy form wind.
Higher efficiency is offered by a horizontal wind turbine as it has blades in perpendicular to
the direction of wind and hence receives more power for rotation.
The traditional designs allow easy installation and easy maintenance as well.
From home usage to application in hybrid systems, the horizontal wind turbines are popular
options as sources of energy.
3.5. Wind Blades
Constant improvement in the design of wind blades has differentiated modern wind turbines to the
traditional windmills. As a result, the new wind turbines are more compact, quieter and are capable of
generating more power from less wind. Here is a complete discussion on various features of wind
blades and how they contribute towards wind turbine efficiency.Figure 1 shows the differentiated
modern wind turbines.
Figure 1wind blade
3.6. Material for Wind Blades
International Journal of Engineering Sciences & Emerging Technologies, Dec. 2013.
ISSN: 2231 – 6604 Volume 6, Issue 3, pp: 267-286 ©IJESET
273
In earlier times, reed, cloth and wood were the materials employed for manufacturing wind blades.
PVC pipes gained popularity as the manufacturing material for these blades in the beginning of
modern era. Today, different experiments are conducted over different materials to support the energy
extraction capability of turbines. Fiberglass, fiberglass enforced polymers, carbon enforced fibers and
epoxy-based composites are some of the modern day options. Aluminum is popular for manufacturing
household wind generator blade.
3.7. Number of Blades
The number of wind blades used in a wind turbine can decide a number of factors like aerodynamic
efficiency. The modern wind turbines consist of two or three blades. The wind turbine with three
blades has three percent better aerodynamic efficiency than those with two blades. However,
increasing the number of blades further can lead to the sacrifice of blade stiffness. Noise and wear are
generally lower in case of three-wind blade design.
3.8. Blades for Horizontal and Vertical Wind Turbines
A 3-blade design is preferred for horizontal wind turbines, as better rotor speed and stability balance
are some of the advantages offered by it. For vertical wind turbine, the wind blades make use of wind
drag and wind lift principles that arrange for good number of rotations for the turbines. Moreover, the
blades for vertical wind turbines can rotate irrespective of the wind’s direction and thus, have
advantage over horizontal designs.
3.9. Other Factors Associated with Wind Blades The shape of wind blades is another contributing factor towards the overall performance of the
turbine. The position of blades upwind or downwind can affect the noise emission of a wind turbine.
Another factor associated with wind blade design is the weight carried by them. Tip speed ratio,
which is the ration between wind’s speed and the speed of wind blades, is another factor that decides
the efficiency of a wind turbine.
As you can see, the wind blades have among the most important roles to make a wind turbine work as
per the expectations. The innovations for designing wind turbine blade have not stopped here, as new
formulas and designs are being considered to improve their performance.
3.10.Wind Turbine Design
A successful wind turbine design is based upon a number of calculations and considerations. From
load considerations to the development of control systems, many specifications can decide the
efficiency of the final wind turbine design. The following discussion should help you learn about
every aspect associated with the design of a wind turbine.
3.11. Load Calculations
A wind turbine design is based upon the consideration of the turbine’s strength to withstand extreme
winds and high-speed winds. The design of wind blades contribute significantly towards this. Long
and narrow blades are considered for modern day turbine designs. Moreover, the number of blades is
limited to two or three, as more number of blades can lead to larger force exerted on turbine.
3.12. Structural Dynamics
A wind turbine is subject to fluctuating winds and thus, varying amount of forces is applied on it.
Thus, an important consideration for wind turbine design is to analyze the forces that would be
responsible for bending and stretching various components of the turbine. In addition, the individual
as well as joint vibrations of different components need to be calculated in advance. All these things
are studied as the structural dynamics for a turbine.
3.13. Power Control
Power control is important for a wind turbine design to protect a turbine against damage during wind
blows at higher than rated speed. Stall control and pitch control are two useful methods in this
direction.
International Journal of Engineering Sciences & Emerging Technologies, Dec. 2013.
ISSN: 2231 – 6604 Volume 6, Issue 3, pp: 267-286 ©IJESET
274
3.14. Wind Blade Design
The design of blades attached with the rotor also contributes towards an effective wind turbine design.
Apart from the shape and weight of these blades, it is also important to consider the material used for
manufacturing them. As far as number of blades is concerned, two or three-blade wind turbines are
the most popular ones in the industry.
3.15. Temperature Considerations
The wind turbine design has an important consideration in the form of temperature operating limits. It
is an important aspect to consider, especially when the machine is to be installed in a low temperature
area. For example, in cold climatic conditions, internal heaters are integrated with turbines to protect
them against low temperature and snow.
3.16. Control Systems
Yaw control system is an important part of the wind turbine design, as it helps in minimizing non-
symmetrical loads and increasing power output. Electrical braking and mechanical braking are other
control systems to perform various tasks.Certification and testing of wind turbines is done before their
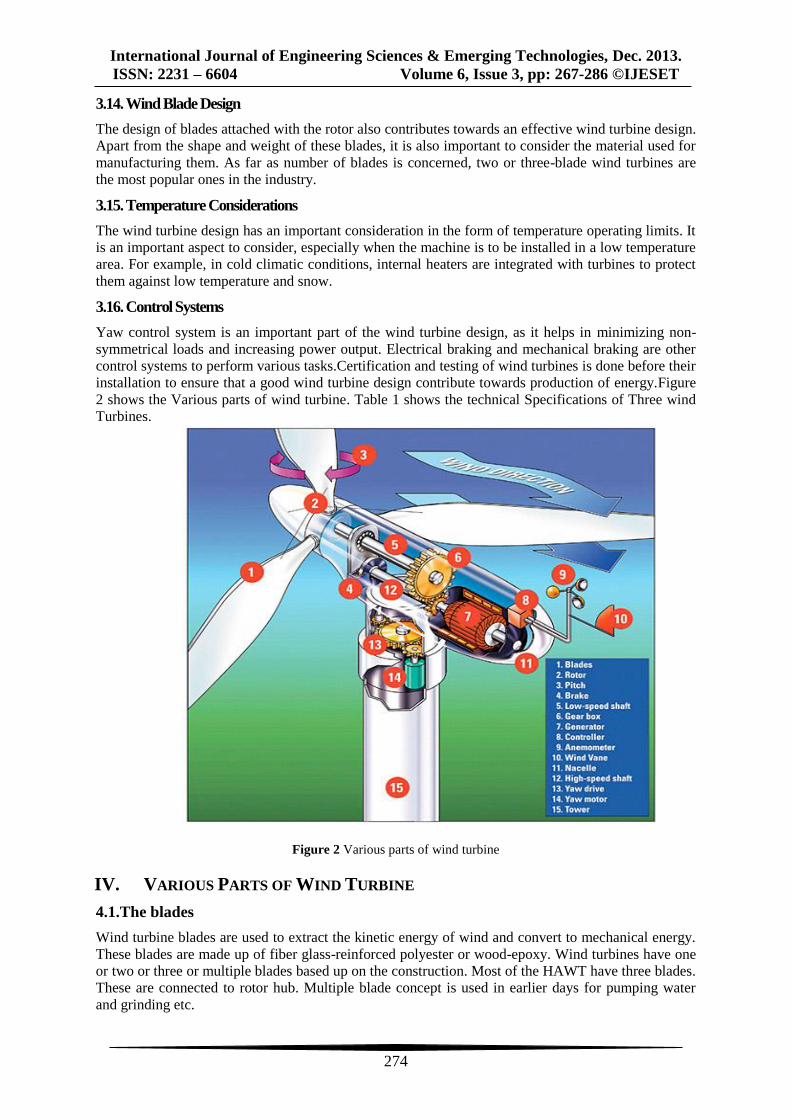
installation to ensure that a good wind turbine design contribute towards production of energy.Figure
2 shows the Various parts of wind turbine. Table 1 shows the technical Specifications of Three wind
Turbines.
Figure 2 Various parts of wind turbine
IV. VARIOUS PARTS OF WIND TURBINE
4.1.The blades
Wind turbine blades are used to extract the kinetic energy of wind and convert to mechanical energy.
These blades are made up of fiber glass-reinforced polyester or wood-epoxy. Wind turbines have one
or two or three or multiple blades based up on the construction. Most of the HAWT have three blades.
These are connected to rotor hub. Multiple blade concept is used in earlier days for pumping water
and grinding etc.
International Journal of Engineering Sciences & Emerging Technologies, Dec. 2013.
ISSN: 2231 – 6604 Volume 6, Issue 3, pp: 267-286 ©IJESET
275
4.2.The nacelle
The nacelle houses a generator and gearbox. The spinning blades are attached to the generator through
a series of gears. The gears increase the rotational speed of the blades to the generator speed of over
1,500 RPM. As the generator spins, electricity is produced. Generators can be either variable or fixed
speed. Variable speed generators produce electricity at a varying frequency, which must be corrected
to 60 cycles per second before it is fed onto the grid. Fixed speed generators do not need to be
corrected, but are not as able to take advantage of fluctuations in wind speed. A housing, which
contains all the components, which is essential to operate the turbine efficiently is called a nacelle. It
is fitted at the top of a tower and includes the gearbox, low- and high-speed shafts, generator,
controller, and brakes. A wind speed anemometer and a wind vane are mounted on the nacelle.
4.3.Gearbox
Gear box used in wind energy systems to change low speed high toque power coming from a rotor
blade to high speed low torque power which is used for generator. It is connected in between main
shaft and generator shaft to increase rotational speeds from about 30 to 60 rotations per minute (rpm)
to about 1000 to 1800 rpm. Gearboxes used for wind turbine are made from superior quality
aluminum alloys, stainless steel, cast iron etc.
The various gearboxes used in wind turbines are
1. Planetary Gearbox
2. Helical Gearbox
3. Worm Gearbox
4.4.Anemometers
Wind speed is the most important factor for determining the power content in the wind. The power
content in the wind is directly proportional to cube of the wind velocity. Measuring wind speed is
important for site selection. The device which is used for measuring wind speed is called anemometer.
These are usually located on top of the nacelle.
4.5.Yaw Mechanism
yaw mechanism turns the rotor into the upwind direction as the wind direction changes. Electric
motors and gear boxes are used to keep the turbine yawed against wind. This can be also used as
controlling mechanism during high wind speeds.
4.6.Rotor
The part of the wind turbine that collects energy from the wind is called the rotor. The rotor usually
consists of two or more wooden, fiberglass or metal blades which rotate about an axis (horizontal or
vertical) at a rate determined by the wind speed and the shape of the blades. The blades are attached to
the hub, which in turn is attached to the main shaft.
4.7.Drag Design
Blade designs operate on either the principle of drag or lift. For the drag design, the wind literally
pushes the blades out of the way. Drag powered wind turbines are characterized by slower rotational
speeds and high torque capabilities. They are useful for the pumping, sawing or grinding work that
Dutch, farm and similar "work-horse" windmills perform. For example, a farm-type windmill must
develop high torque at start-up in order to pump, or lift, water from a deep well.
4.8.Lift Design
The lift blade design employs the same principle that enables airplanes, kites and birds to fly. The
blade is essentially an airfoil, or wing. When air flows past the blade, a wind speed and pressure
differential is created between the upper and lower blade surfaces. The pressure at the lower surface is
greater and thus acts to "lift" the blade. When blades are attached to a central axis, like a wind turbine
rotor, the lift is translated into rotational motion.
International Journal of Engineering Sciences & Emerging Technologies, Dec. 2013.
ISSN: 2231 – 6604 Volume 6, Issue 3, pp: 267-286 ©IJESET
276
4.9.Tip Speed Ratio
The tip-speed is the ratio of the rotational speed of the blade to the wind speed. The larger this ratio,
the faster the rotation of the wind turbine rotor at a given wind speed. Electricity generation requires
high rotational speeds. Lift-type wind turbines have maximum tip-speed ratios of around 10, while
drag-type ratios are approximately 1. Given the high rotational speed requirements of electrical
generators, it is clear that the lift-type wind turbine is most practical for this application.
4.10.A Generator
The generator is what converts the turning motion of a wind turbine's blades into electricity. Inside
this component, coils of wire are rotated in a magnetic field to produce electricity. Different generator
designs produce either alternating current (AC) or direct current (DC), and they are available in a
large range of output power ratings. The generator's rating, or size, is dependent on the length of the
wind turbine's blades because more energy is captured by longer blades.It is important to select the
right type of generator to match your intended use. Most home and office appliances operate on 120
volt (or 240 volt), 60 cycle AC. Some appliances can operate on either AC or DC, such as light bulbs
and resistance heaters, and many others can be adapted to run on DC.
4.11.Transmission
The number of revolutions per minute (rpm) of a wind turbine rotor can range between 40 rpm and
400 rpm, depending on the model and the wind speed. Generators typically require rpm's of 1,200 to
1,800. As a result, most wind turbines require a gear-box transmission to increase the rotation of the
generator to the speeds necessary for efficient electricity production. Some DC-type wind turbines do
not use transmissions. Instead, they have a direct link between the rotor and generator. These are
known as direct drive systems. Without a transmission, wind turbine complexity and maintenance
requirements are reduced, but a much larger generator is required to deliver the same power output as
the AC-type wind turbines.
4.12.Towers
A tower that supports the nacelle and rotor hub at its top. These are made from tubular steel, concrete,
or steel lattice. Height of the tower is an important in design of HWAT. Because wind speed increases
with height, taller towers enable turbines to capture more energy and generate more electricity.
Generally output power of the wind system increase with increase in height and reduces the
turbulence in wind. The tower on which a wind turbine is mounted is not just a support structure. It
also raises the wind turbine so that its blades safely clear the ground and so it can reach the stronger
winds at higher elevations. Maximum tower height is optional in most cases, except where zoning
restrictions apply. The decision of what height tower to use will be based on the cost of taller towers
versus the value of the increase in energy production resulting from their use. Studies have shown that
the added cost of increasing tower height is often justified by the added power generated from the
stronger winds. Larger wind turbines are usually mounted on towers ranging from 40 to 70 meters
tall. Towers for small wind systems are generally "guyed" designs. This means that there are guy
wires anchored to the ground on three or four sides of the tower to hold it erect. These towers cost less
than freestanding towers, but require more land area to anchor the guy wires. Some of these guyed
towers are erected by tilting them up. This operation can be quickly accomplished using only a winch,
with the turbine already mounted to the tower top.
Table 1.Technical Specifications of Three wind Turbines
WINCON NEPC
TTG
GENERAL DATA
Nominal power
Rotor diameter
Swept area
250 KW
29.0 m
661 m2
250 KW
27.6 m
598 m2
250 KW
25.0 m
491 m2
International Journal of Engineering Sciences & Emerging Technologies, Dec. 2013.
ISSN: 2231 – 6604 Volume 6, Issue 3, pp: 267-286 ©IJESET
277
OPERATIONAL DATA
Cut-in, wind speed
Nominal power, wind speed
Cut-out, wind speed
Survival, wind speed
4.5 m/s
18.0 m/s
25.0 m/s
>52.0 m/s
4 m/s
16.5 m/s
25 m/s
>60.0 m/s
3.5 m/s
16.0 m/s
25.0 m/s
>49.0 m/s
ROTOR
No. of blades
Rotor position
Rotor speed
Tip-speed blade
Power output regulation
Weight-rotor
3
upwind
38.5 rpm
57.7 m/s
3,900 kg
3
upwind
41.5 rpm
56.5 m/s
4290 kg
3
upwind
41.5 rpm
28 m/s
2520 kg
ROTOR BLADE
Type
Profile data
Length
Material
Weight
LM 13.4
NACA 63.4 XXY
FFA.W3
13.4m
fibre glass reinforced
polyester
750 kg
LM 13.4
NACA 63.4 XXY
FFA.W3
11.5m
polyester reinforced
fibre glass
---
LM fibre glass
-
11.5 m
---
GEAR BOX
Type
Ratio
Lubrication method
Oil volume
Weight
3 step, helical
01:39.5
splash
87 lts
2,000 kg
2 step, helical
01:36.5
splash
87 lts
2,000 kg
2 step with parallel shaft
01:24.1
electric oil pressure
80 lts
3300 kg
GENERATOR
Type
Nominal power
Voltage
Frequency
synchronous speed
Insulaion class
4-pole
asynchronous/induction
250 KW
400V
50 Hz
1500 rpm
F
4-pole
asynchronous/3phase
250 KW
400V
52 Hz
1500 rpm
F
Asynchronous,
IP54, 6-pole
250 KW
415V
50 Hz
1000 rpm
F
YAW SYSTEM
Type
Yaw brake
Yas drives
Controller
ball bearing
el. Motors and
permanent friction
brake
2 el. Motors, planetary
worm gear
Wind vane
slewing system
with gear
motors
yawing
-
International Journal of Engineering Sciences & Emerging Technologies, Dec. 2013.
ISSN: 2231 – 6604 Volume 6, Issue 3, pp: 267-286 ©IJESET
278
MONITORING
Power quality
RPM
Temperature
Others
Voltage, current
frequency, power
factor, power output
Rotor, generator
Generator shaft and
windings, thyristors,
gear box
Wind speed and
direction
-
-
-
-
-
-
TOWER
Type
Height
Lightning protection
Tubular, conical (30 m)
Lattice tower (50 m)
30 m
In accordance with IEC
-
-
-
-
WEIGHT
Nacelle
Rotor
Tower
Total
12,500 kg
3,700 kg
16,000 kg
32,200 kg
8,000 kg
4,290 kg
13,500 kg
25,790 kg
6,700 kg
4,500 kg
14,500 kg
25,700 kg
V. RESULTS AND DISCUSSION
The average efficiency of the WEGs varies for different type of systems. The studies show that the
TTG machine operates at maximum efficiency of 58% at 6 m/s wind velocity. As compared to
Wincon and NEPC machines, the TTG machine reaches maximum efficiency at lesser wind velocity
of 6 m/s. As well as the cut-in wind speed is also very low for TTG machines. It implies that if the
machine is designed for maximum efficiency at low wind velocities, the total energy generation,
generation per m2 rotor area and generation per kW capacity will be increased. As the wind turbines
operates on low cut-in wind speed and low rated wind speed, the lull hours will be reduced which
makes the plant to run at higher capacity factor. The technical availability of the TTG machine is
comparatively higher. If the blade diameter of the rotor increases, the power generation also
increases. Similarly if the tower height is increased by one unit around five percentage increases in
generation is achieved. Figure 3 shows the Comparison of generation/Kw installed capacity during
may2003-april2004.Figure 4 shows the comparison of generation/m2 rotor area during may2003-
april2004.
Figure 5.Comparison of Generation/Kw installed capacity during may2003-april2004
0
50
100
150
200
250
300
350
400
Ma
y
Jun
e
July
Au
gust
Se
pte
mb
er
Octo
ber
Novem
ber
Decem
ber
Jan
uary
Fe
bru
ary
Ma
rch
Ap
ril
Ge
ne
rati
on
/ K
W in
stal
led
ca
pac
ity
(Kw
h/K
w)
MONTHS
Wincon NEPC TTG
International Journal of Engineering Sciences & Emerging Technologies, Dec. 2013.
ISSN: 2231 – 6604 Volume 6, Issue 3, pp: 267-286 ©IJESET
279
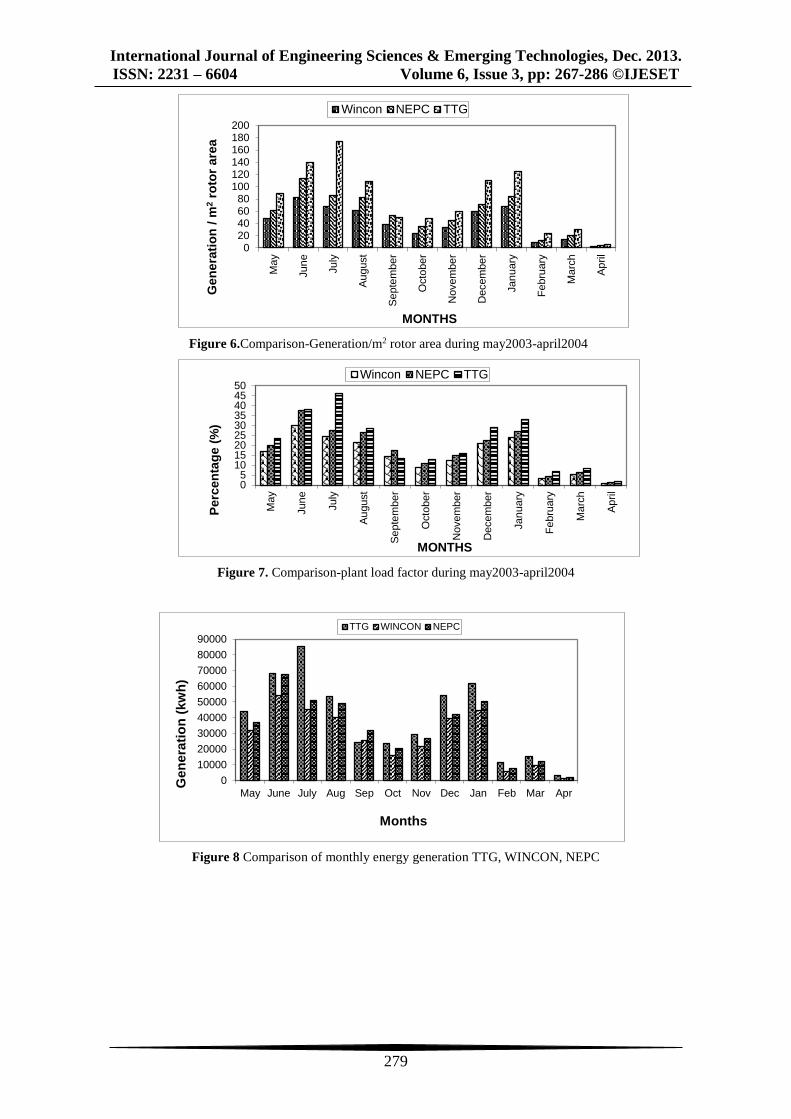
Figure 6.Comparison-Generation/m2 rotor area during may2003-april2004
Figure 7. Comparison-plant load factor during may2003-april2004
Figure 8 Comparison of monthly energy generation TTG, WINCON, NEPC
020406080
100120140160180200
Ma
y
Jun
e
July
Au
gust
Se
pte
mb
er
Octo
ber
Novem
ber
Decem
ber
Jan
uary
Fe
bru
ary
Ma
rch
Ap
ril
Gen
era
tio
n /
m2
roto
r are
a
MONTHS
Wincon NEPC TTG
05
101520253035404550
May
Jun
e
July
Au
gust
Se
pte
mb
er
Octo
ber
Novem
ber
Decem
ber
Jan
uary
Fe
bru
ary
Ma
rch
Ap
ril
Perc
en
tag
e (
%)
MONTHS
Wincon NEPC TTG
0
10000
20000
30000
40000
50000
60000
70000
80000
90000
May June July Aug Sep Oct Nov Dec Jan Feb Mar Apr
Gen
era
tio
n (
kw
h)
Months
TTG WINCON NEPC
International Journal of Engineering Sciences & Emerging Technologies, Dec. 2013.
ISSN: 2231 – 6604 Volume 6, Issue 3, pp: 267-286 ©IJESET
280
Figure 9 Power generation in kwh/kw installed capacity-NEPC during may 2003-april 2004
The calculated value of the performance studies of WINCON, NEPC, and TTG has been shown in
table2.Figure 10 shows the comparison of plant load factor during may2003-april2004. Figure 11
shows the comparison of monthly energy generation TTG, WINCON, NEPC during may2003-
april2004.Figure 12 shows the power generation in kwh/kw installed capacity of NEPC during may
2003-april 2004.
Figure 13 Power generation in kwh/unit rotor swept area-TTG during may2003-april2004
The technical availability also plays an important role in energy generation. It is found that the
technical availability of the machine is around 97 – 98 % during the high windy months. By
increasing the technical availability such that preventing the possibilities of breakdown maintenance
in high windy seasons.
Table 2. Calculated values of WINCON, NEPC, and TTG
S.No Description WINCON NEPC TTG
1. Average Efficiency (%) 24.06 30.85 36.01
2. Cut-in wind speed (m/s) 3.5 3 3
3. Rated wind speed (m/s) 17 16.5 16
4. Max. Efficiency (%) 42.08 57.14 58.21
5. Wind speed at nmax (m/s) 8 7 6
6. Tip-speed ratio at nmax 7.9 8.25 8.29
7. Annual Generation (kWh) 334984 397696 472198
8. Breakdown hrs 232 60 232
9. Lull hrs (annual) 2674 2450 2134
0
50
100
150
200
250
300
May June July Aug Sep Oct Nov Dec Jan Feb Mar Apr
Po
we
r G
en
era
tio
n /
kw
(kw
h /
kw
)
Months
0
20
40
60
80
100
120
140
160
180
200
May June July Aug Sep Oct Nov Dec Jan Feb Mar AprPo
we
r G
en
era
tio
n /
un
it r
oto
r sw
ep
t ar
ea
(kw
h/m
2)
Months
International Journal of Engineering Sciences & Emerging Technologies, Dec. 2013.
ISSN: 2231 – 6604 Volume 6, Issue 3, pp: 267-286 ©IJESET
281
10. Teach. Availability (%) 97.34 99.315 98.82
11. Real availability (%) 63.08 66.30 69.48
12. Plant load factor (%) 15.17 18.02 21.37
13. Generation in kWh/m2 42.22 55.42 80.13
14. Generation in kWh/kW 111.59 132.56 157.39
Figure 14 shows the power generation in kwh/unit rotor swept area of TTG during may2003-april
2004. Figure 15shows the analysis of technical availability, real availability and plant load factor for
WINCON during may 2003-april 2004.Similarly figure 16 shows the comparison of Generation/kw
installed capacity during may 2003-april 2004. Figure 17 shows the comparison of Generation/m2
rotor area during may2003-april2004.Figure 18 shows the comparison of plant load factor during may
2003-april 2004.
Figure 19.Analysis of technical availability, real availability, plant load factor for WINCON during may2003-
april2004
Figure 20Comparison of Generation/kw installed capacity during may2003-april2004
0
20
40
60
80
100
120
May June July Aug Sep Oct Nov Dec Jan Feb Mar Apr
Pe
rce
nta
ge (
%)
Months
Technical Availability Real Availability Plant load factor
0
50
100
150
200
250
300
350
400
Ma
y
Jun
e
July
Au
gust
Se
pte
mber
Octo
ber
Novem
ber
Decem
ber
Jan
uary
Fe
bru
ary
Ma
rch
Ap
ril
Gen
era
tio
n /
KW
in
sta
lled
cap
acit
y (
Kw
h/K
w)
MONTHS
Wincon NEPC TTG
International Journal of Engineering Sciences & Emerging Technologies, Dec. 2013.
ISSN: 2231 – 6604 Volume 6, Issue 3, pp: 267-286 ©IJESET
282
Figure 21 Comparison of Generation/m2 rotor area during may2003-april2004
Figure 22 Comparison of plant load factor during may2003-april2004
Figure 23.Comparison of monthly energy generation for TTG,WINCON,NEPC
020406080
100120140160180200
Ma
y
Jun
e
July
Au
gust
Se
pte
mb
er
Octo
ber
Novem
ber
Decem
ber
Jan
uary
Fe
bru
ary
Ma
rch
Ap
ril
Ge
ne
rati
on
/ m
2ro
tor
are
a
MONTHS
Wincon NEPC TTG
0
5
10
15
20
25
30
35
40
45
50
Ma
y
Jun
e
July
Au
gust
Se
pte
mb
er
Octo
ber
Novem
ber
Decem
ber
Jan
uary
Fe
bru
ary
Ma
rch
Ap
ril
Perc
en
tag
e (
%)
MONTHS
Wincon NEPC TTG
0
10000
20000
30000
40000
50000
60000
70000
80000
90000
May June July Aug Sep Oct Nov Dec Jan Feb Mar Apr
Ge
ne
rati
on
(kw
h)
Months
TTG WINCON NEPC
International Journal of Engineering Sciences & Emerging Technologies, Dec. 2013.
ISSN: 2231 – 6604 Volume 6, Issue 3, pp: 267-286 ©IJESET
283
Figure 24.Monthly energy generation of TTG during may2003-april2004
Figure 25.Monthly energy generation of NEPC during may2003-april2004
Figure 26 Tip ratio Vs efficiency(NEPC)
0
10000
20000
30000
40000
50000
60000
70000
80000
90000
May June July Aug Sep Oct Nov Dec Jan Feb Mar April
Ge
ne
rati
on
(k
wh
)
Months
0
10000
20000
30000
40000
50000
60000
70000
80000
May June July Aug Sep Oct Nov Dec Jan Feb Mar April
Gen
era
tio
n (
kw
h)
Months
0
10
20
30
40
50
60
3.4 3.61 3.85 4.12 4.44 4.81 5.25 5.78 6.42 7.22 8.25 9.6311.5614.0916.118.78
Eff
icie
ncy
(h
)
Tip speed ratio (l)
International Journal of Engineering Sciences & Emerging Technologies, Dec. 2013.
ISSN: 2231 – 6604 Volume 6, Issue 3, pp: 267-286 ©IJESET
284
Figure 27 Wind velocity Vs power output (TTG)
Figure 28 Tip ratio Vs efficiency (WINCON)
By increasing the rotor blade diameter and tower hub height of the WEGs, the energy can be
generated at 25% lower cost in near future. If the WEGs can be manufactured to last 25-30 years due
to research and developments, the energy cost as well as the payback period of the wind turbine
generators becomes low. Figure 29shows the comparison of monthly energy generation for TTG,
WINCON, and NEPC. Figure 30shows the monthly energy generation of TTG during may2003-
april2004. Figure 31shows the monthly energy generation of NEPC during may2003-april2004.
Figure 32 shows the Tip ratio Vs efficiency (NEPC). Figure 33 shows the Wind velocity Vs power
output (TTG). Figure 34 shows the Tip ratio Vs efficiency (WINCON).
VI. CONCLUSION
From the power performance studies carried out so far, we have been under the inference that still
enormous potential in the wind remains untapped. By suitable developed technologies in blade
design, material features, the life span of the system can be well improved and thereby the cost of
energy generation can still be minimized. The outstanding constraint in the wind-power generation is
the initial investment cost, which can be very well minimized by suitable planning of the generator
capacity and improved design features of the WEGs.
0
50
100
150
200
250
300
2.5 3 4 5 6 7 8 9 10 11 12 13 14 15 16 17
Po
wer
ou
tpu
t (k
W)
Wind velocity (m/s)
0
5
10
15
20
25
30
35
40
45
0 3.7 4 4.3 4.5 4.9 5.3 5.8 6.3 7 7.9 9 10.5 12.5 15.6 17.8
Effi
cie
ncy
(h
)
Tip speed ratio (l)
International Journal of Engineering Sciences & Emerging Technologies, Dec. 2013.
ISSN: 2231 – 6604 Volume 6, Issue 3, pp: 267-286 ©IJESET
285
The feature prevailing in the decrease of technical availability is the poor maintenance schedule
followed. Hence preventive maintenance procedure could be adapted to avoid breakdowns and
thereby increase the technical availability. Proper training and suitable incentives can improve the
labour quality so that the WEGs can be successfully launched in the sustainable future.
REFERENCES
[1] Ahmad M., Mazen A., M. and Tharwat (2006):Vertical axis wind turbine modeling and performance with
axial flux permanent magnet synchronous generator for battery charging applications. Retrieved
September 14.
[2] Heier S. (1998): Grid Integration of Wind Energy Conversion Systems. John Wiley & Sons Ltd.
[3] Ming Y., Gengyin L., Ming Z., and Chengyong Z. (2007): Modeling of the Wind Turbine with a Permanent
Magnet Synchronous Generator for Integration.
[4] Pranamita B., and Aiswarya H. (2009): Power System Stability Studies using Matlab. A Project Report,
Department of Electrical Engineering, National Institute of Technology, Rourkela.
[5] Rolan A., Alvaro L., Gerardo V., and Daniel A. (2009): Modelling of a Variable Speed Wind Turbine with a
Permanent Magnet Synchronous Generator.
[6] SaifurR., and ManisaP. (2010): Modeling and Simulation of a Distributed Generation-Integrated Intelligent
Microgrid, SERDP Project SI-1650.
[7] Simulink (2009): Modelling Process. Simulink Getting Started Guide. The MathWorks, Inc.
[8] Sina L. and Mahyar S. (2011): Modeling and Application of Permanent Magnet Synchronous Generator
Based Variable Speed Wind Generation System. Department of Electrical Engineering, Ahar Branch,
Islamic Azad University, Ahar, Iran.
[9] Ahmed, S., N. Diwakar, S. Ganesan and V.K. Sethi.(2009). Mathematical simulation and energy estimation
of 10 kw horizontal axis wind turbine rotor at hilly site of RGPV, Bhopal, (Case Study). Curr. World
Environ. 4: 255-262.
[10] Collecutt, G.R. and R.G.J. Flay, (1996). The economic optimization of horizontal axis wind turbine design.
J. Wind Eng. Ind. Aerodynamics, 61: 87-97
[11] De-Goeij, W.C., M.J.L. Van-Tooren and A. Beukers, (1999). Implementation of bending-torsion coupling
in the design of a wind-turbine rotor-blade. Applied Energy, 63: 191-207.
[12] Maalawi, K.Y. and H.M. Negm,( 2002). Optimal frequency design of wind turbine blades. J. Wind Eng.
Ind. Aerodynamics, 90: 961-986.
[13]Maalawi, K.Y., (2007). A model for yawing dynamic optimization of a wind turbine structure. Int. J.
Mechanical Sci., 49: 1130-1138.
[14]Ronold, K.O. J. Wedel-Heinen and C.J. Christensen, (1999). Reliability-based fatigue design of wind-
turbine rotor blades. Eng. Struct., 21: 1101-1114.
[15] Ronold, K.O. and C.J. Christensen, (2001). Optimization of a design code for wind-turbine rotor blades in
fatigue. Eng. Struct., 23: 993-1004.
[16] Ronold, K.O. and G.C. Larsen, (2000). Reliability-based design of wind-turbine rotor blades against
failure in ultimate loading. Eng. Struct., 22: 565-574
[17] Wood, D.H., (1997). Some effect of compressibility on small horizontal axis wind turbines. Rnewable
Energy, 10: 11-17.
[18] Ackermann, T. and Söder, L. (2002), An overview of wind-energy status 2002, Renewable and
Sustainable Energy Reviews, No 6, pp 67-128.
[19] Boston, G. (2000), Development of a Novel Wind Turbine, Undergraduate BE (Mechanical)
Thesis, University of Wollongong.
[20] A course in power plant Engineering. Arora. S.Domkudwar.
[21].A Hand Book of Solar Radiation, New Delhi: 1980 by Mani.
[22].Energy Tech. & Conversion system by Merlin H.Lkeribach Carlton E. Salvagin.
[23].Non Conventional Energy Wilsey Eastern – 1990 by Ashok V & Desai.
[24].Power plant Technology M.M. El-Wakil Mc Graw Hill International Edition
[25].Principles of Energy Conversion (Second Ed). Archie W.Culp Jr. Ph.D Mc Graw Hill. Inc.
[26].Principles of power systems –V.K. Mehta, S. Chand and Company Ltd. 1998.
[27].Renewable Energy Sources Elsevier Seren 1998 by Laughton M.A.Ed.
[28].Renewable Energy Sources Tata MC Graw Hill Publishers – 1990 by Bausal N.K. & others
[29].Solar Energy Principles of Thermal collection and storage (Second Edition) Suhus P. Sukhatme.
[30].The Generation of Electricity by Wind Power – E & FN SPON Ltd: 1980 by E.W. Golding.
[31].Wind Electric Generators – a pamphlet from M/s. Pioneer Wincon Ltd., Aralvoimozhy.
[32].Wind energy conversion edited by Peter Musgrove
[33].Wind Energy Systems. Prentice Hall, Inc. Englewood Cliffs, New Jersey, 1985,by Gary L. Johnson.
International Journal of Engineering Sciences & Emerging Technologies, Dec. 2013.
ISSN: 2231 – 6604 Volume 6, Issue 3, pp: 267-286 ©IJESET
286
[34].Wind mill manual by NEPC Ltd. India.
[35].Wind Power by V. Daniel Hunt.
[36].www.windpower.org - Guided Tour on Wind Energy.
AUTHORS
T. Shanmugavadivel received B.E(Mech) Degree in 1982 from Annamalai University and
M.E degree in Thermal Power from Annamalai University in 1992. He did his Ph.D degree
in IC Engines from Annamalai University in 2009. He is in the teaching profession for the
past 34 years and his areas of interest are I.C. Engines, Alternative fuels, Alternative fuels
and Emission Control on SI Engines. He published 26 papers in International journals and
conferences.
P. Balashammugam received B.E(Mech) Degree in 1998 from Annamalai University and
M.E degree in Energy Engineering and Management from Annamalai University in 2007.
He is currently research scholar under the guidance of Dr .M. Ramajayam, Professor in the
Department of Mechanical Engineering Annamalai University. His research interests
includes Automobile emission, Noise pollution ,Air pollution and Refrigeration and
Airconditioning.