POWER PULSE MEASUREMENT AND ANALYSIS FOR A TRIGA REACTOR
byPrachaks Jinamornphongs
A Thesis Submitted to the Faculty of theDEPARTMENT OF NUCLEAR ENGINEERING
In Partial Fulfillment of the Requirements For the Degree ofMASTER OF SCIENCE
In the Graduate CollegeTHE UNIVERSITY. OF ARIZONA
1 9 7 3
STATEMENT BY AUTHOR
This thesis has been submitted in partial fulfillment of requirements for an advanced degree at The University of Arizona and is deposited in the University Library to be made available to borrowers under rules of. the Libraryo
without special permission, provided that accurate acknowledgment of source is made. Requests for permission for extended quotation from or reproduction of this, manuscript in whole or in part may be granted by the head of the major department or the Dean of the Graduate College when in his judgment the proposed use of the material is in the interests of scholarship. In all other instances, however, permission must be obtained from the author.
This thesis has been approved on the date shown below:
Brief quotations from this thesis are allowable
SIGNED:a
APPROVAL BY THESIS DIRECTOR
• As :learDate
Engineering
ACKNOWLEDGMENTS
The author wishes to express his sincere appreciation to his thesis director, Dr. Rocco A„ Fazzolare, for his guidance and assistance throughout this study f which has made this work possible.
To the courtesies extended to him by many individuals, especially Dr. David L. Hetrick and Dr. George W. Nelson, the author offers sincere thanks.
TABLE OF CONTENTS
PageLIST OF ILLUSTRATIONS . . . . . . . . . . . . . . . . vLIST OF TABLES . viAl3 SO? !R o o ' o e e e o o e o o o o o o o e e o ' e o o o 3-1CHAPTER
1. INTRODUCTION 120 . TEMPERATURE POWER CHARACTERISTIC . . . . . . . . 3
6. Fuel temperature as a function of time.. . . . . 26i\l. VCO circuit . . 0 . . . . O . . . . . . . . . . 2 9A2. Number of pulses vs. input voltage at
various gains for the VCO circuit . . . . . . . 30Bl. The connection diagram of the pulse
reactor power measurement system . . . . . . . 35
v
LIST OF TABLES
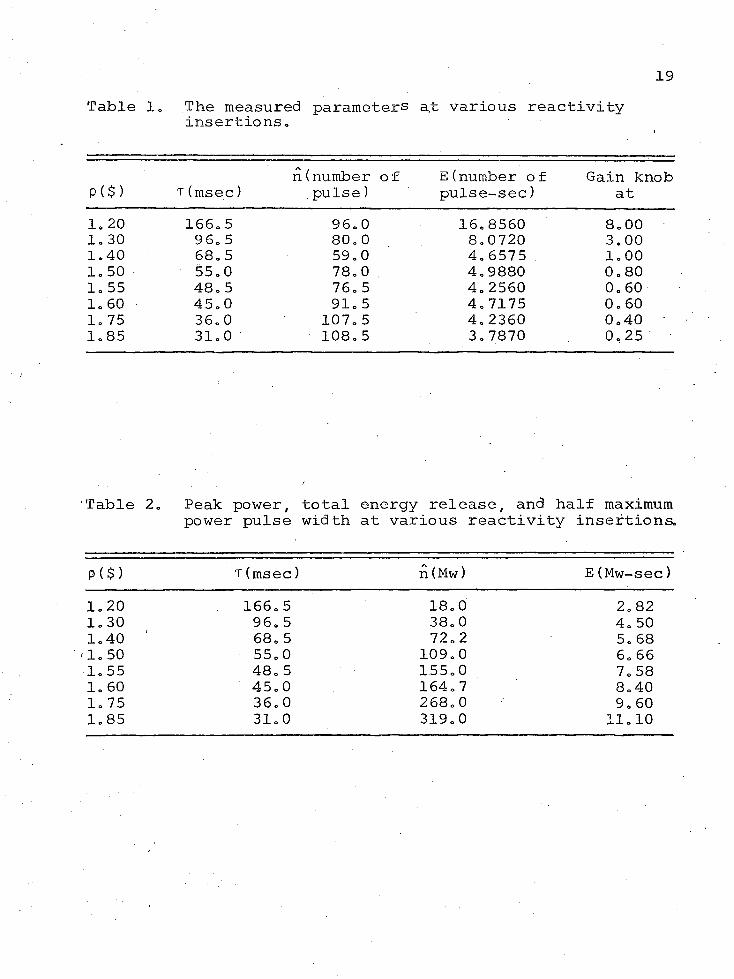
Table Page1. The measured parameters at various
reactivity insertions . 192„ Peak power, total energy release, and
half maximum power pulse width atvarious reactivity insertions 19
&3o w and at various reactivities . . « , » . . . 214. Experimentally determined parameters for
the TRIGA Mark I reactor . . 245. Parts list of the VCO circuit „ „ . „ „ «, . . . 33
vi
ABSTRACT
An electronic system to measure the TRIGA reactor power pulse excursion is described. A Voltage Controlled Oscillator was constructed and used with a multi-channel analyzer operated in multi-scaler mode for the measurement. The output voltage of the ion chamber amplifier is converted to a pulse rate, which varies proportionally to the reactor power.
Step reactivity insertion ranging from 1.2 to 1.85 dollars were used in these experiments. The pulse data were analyzed and the following reactor parameters were determined: '.
1. The reciprocal reactor period, W.2. The prompt neutron life time, j£/|3.3. The energy coefficient of feedback reactivity,
OCKTT°
vii
CHAPTER 1
INTRODUCTION
The TRIGA Mark I reactor (1) of the Nuclear Engineering Department at The University of Arizona is used for training, research, and isotope production. The reactor has recently been refueled and modified with a new control system to permit both steady state and pulse mode operation. The maximum continuous power is now limited to 100 Kw and a reactivity insertion up to $2.00 is permitted in the pulsing mode.
The reactor core contains a solid, homogeneous uranium fuel and zirconium-hydride moderator (U-ZrH^ ^).This fuel-moderator element has an inherent property of a prompt negative temperature coefficient of reactivity. The negative reactivity feedback will increase when the fuel temperature is increased. Thus, the power will rise after a large reactivity step is introduced into the. core, and will then fall to a low level due to the large temperature coefficient. This gives rise to a characteristic power pulse. The maximum power of the pulse and its duration depend on the magnitude of reactivity inserted, e.g., $1.2 of reactivity results in 18 Mw at maximum power with half maximum power width of 166.5 msec, $1.85 yields 319 Mw for
31 msec. The inherent safety of the TRIGA fuel is demonstrated by the Advance TRIGA Prototype Reactor (ATPR) with stainless steel clad fuel (U-ZrH^ ^ ) which has been pulsed with $7.00 worth of reactivity (2). A peak power of 27,900 Mw was reached with a total energy 115 Mw-sec releasedo The half maximum power width was 0.93 msec.
It is the object of this research to measure and analyze the pulse shape produced at The University of Arizona reactor. An analysis of this type, for various reactivity insertions, provides information related to the dynamic characteristics and behavior of this reactor system.
In Chapter 2, a theoretical description of the pulsing behavior of TRIGA is presented. Chapter 3 discusses the experimental equipment and electronics used. Some sample measurements and analyses are shown in Chapter 4.
CHAPTER 2
TEMPERATURE POWER CHARACTERISTIC
2.1 Zirconium Hydride Model The structure of zirconium hydride consists of a
face-centered cubic lattice of zirconium atoms with interstitial hydrogen atoms forming a second cube half the size of the zirconium cube and centered inside that lattice (3). Each hydrogen atom is equidistant from the four nearest zirconium neighbors. Since it is bound isotropically, it acts like a harmonic oscillator in a potential well. This oscillator has discrete possible energy states given by
En = (n + 3/2) hV (1)
whereh = Planck's constant,
_ ? 7= 6.62x10 (erg-sec)__2v = the oscillator frequency (sec )
n = an integer.The characteristic energy, hv = 0.14 ev.
ZrH^ alone is quite ineffective in thermal!zing aneutron below 0.14 ev. For neutrons of energy above 0.14 ev,ZrH can moderate at least as well as free hydrogen with nenergy losses in multiples of 0.14 ev. It is possible for a neutron to gain one or more quanta, hv, in one or several
3
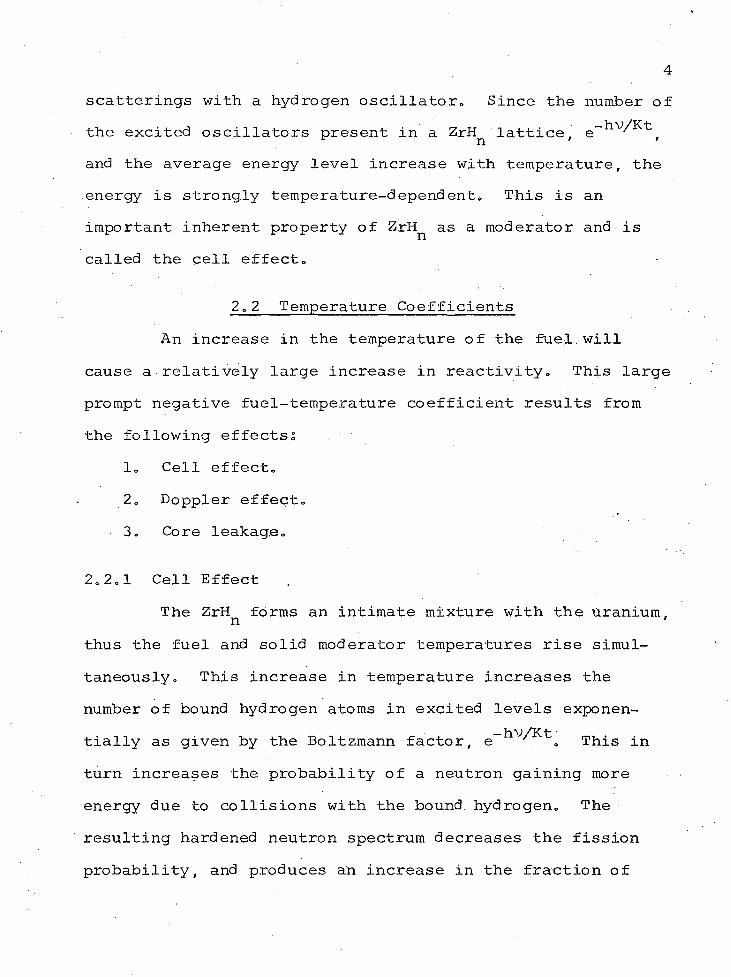
scatterings with a hydrogen oscillator. Since the number of the excited oscillators present in a ZrH^ lattice, ^-hu/Kt^ and the average energy level increase with temperature, the energy is strongly temperature-dependent. This is an important inherent property of ZrH^ as a moderator and is called the cell effect.
2.2 Temperature Coefficients An increase in the temperature of the fuel will
cause a relatively large increase in reactivity. This large prompt negative fuel-temperature coefficient results from the following effects:
1. Cell effect.2. Doppler effect.3. Core leakage.
2.2.1 Cell EffectThe ZrH forms an intimate mixture with the uranium, n '
thus the fuel and solid moderator temperatures rise simultaneously. This increase in temperature increases the number of bound hydrogen atoms in excited levels exponentially as given by the Boltzmann factor, e-hv/Kt^ This in turn increases the probability of a neutron gaining more energy due to collisions with the bound, hydrogen. The resulting hardened neutron spectrum decreases the fission probability, and produces an increase in the fraction of
neutron leakage from the fuel element and the capture in the surrounding water.
2.2.2 Doppler EffectThere is another small contributing effect to the
prompt negative temperature coefficient associated with theneutron spectrum. This is the Doppler broadening of the 238U absorption resonances. The uranium in the fuel
O C p o oelements is approximately 20% U and 80% U. . Theincrease in temperature of the fuel element increases the
238absorption cross section of U. As a result, there is a decrease in the resonance escape.
2.2.3 Core LeakageWhen the core heats up, the cell effect increases
the escape of neutrons from the core which are captured by tihe surrounding reflector.
The components of the temperature coefficient for stainless steel clad (ZrH^ ^ ) core (2) are
1. Cell 8.2 x 10™5 (65%) per °C2. Doppler 1.8 x 10⁻⁵ (15%) per °C3. Core leakage 2.1 x 10-^ (20%) per °C
2.3 Pulse Power Excursion Behavior An inherent characteristic of the TRIGA reactor is
its self-limiting property caused by the prompt negative temperature coefficient of the fuel-moderator element. For
a large insertion of reactivity, the rate of change of the power is large compared to the production of delayed neutrons and extraneous neutrons from a source. Therefore, the production of delayed neutrons and the extraneous neutron sources can be neglected. The negative temperature feedback is almost instantaneous and the sequence of events occur within a very short period of time. Therefore, it can be assumed that.there is no heat transfer (adiabatic change). According to these assumptions, the insertion of a large amount of reactivity can be best described analytically by the Fuchs-Nordheim model (4).
From the point reactor equations, the rate of change of power is given by
|n = .Plt)_E=_P n(t) + -sx c + q(t). (2)i
Neglecting neutron sources and redefining p to be reactivity in $, this equation reduces to
i f = p(5 / 3™ 1 n(t) (3)
wheren(t) = reactor power (watt) t = time (sec)P = effective delayed neutron fraction
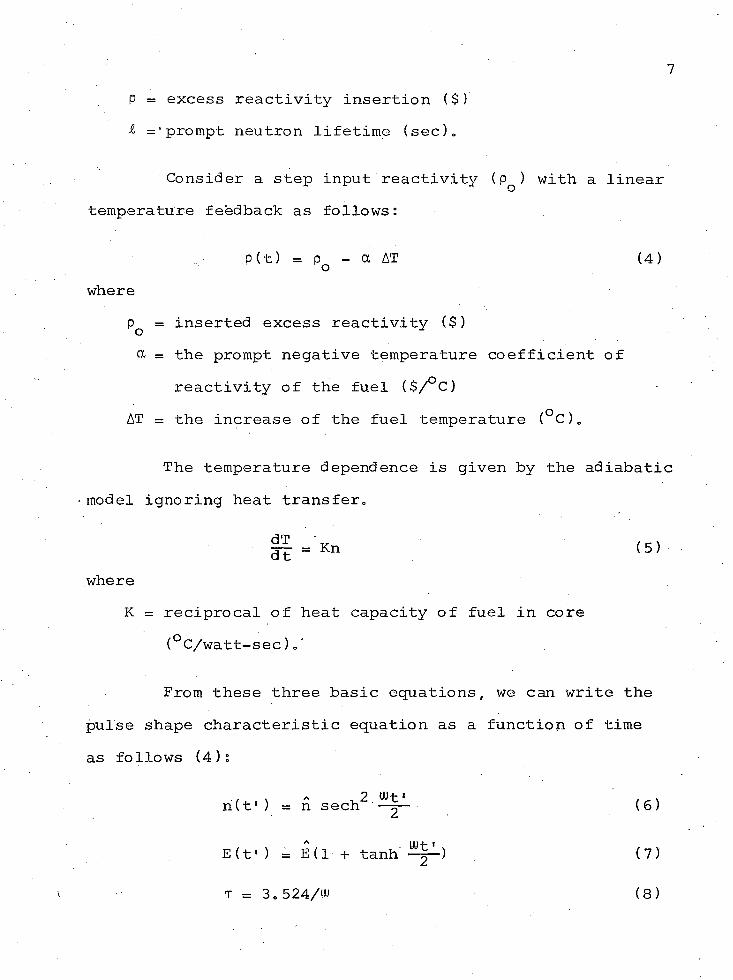
Consider a step input reactivity (Pq ) with a lineartemperature feedback as follows:
p(t) = pQ - a AT (4)where
Pq = inserted excess reactivity ($) ot = the prompt negative temperature coefficient of
reactivity of the fuel ($/°C)AT = the increase of the fuel temperature (°C)„
The temperature dependence is given by the adiabatic model ignoring heat transfer.
= Kn (5)where
K = reciprocal of heat capacity of fuel in core (°C/watt-sec) .’
From these three basic equations, we can write the pulse shape characteristic equation as a function of time as follows (4):
h(t') = n sech^ — (6)
E(t' ) = E(1 + tanh (7)
r = 3. 524/UJ (8)
8where
n = peak power (watt)= ( £uj2 )/(2ol K) (9 )
U) = p ( Pq -1 )/^ is the reciprocal reactor period(sec- 1 ) (10)
E(t') = energy release as a function of time (watt-sec)
A (Pq — 1 )E = - — y-g- is the energy release at peak power(watt-sec)
t 1 = t . - t (sec) i otQ = the time at peak power (sec) t^ = the power excursion time (sec)
In Figure 1 the Nordheim-Fuchs model is compared with the shape of a real pulse„
Initially the pulse rises exponentially for small values of t. When the temperature has not changed ,Equation (3) is
dn _ ( P — 1) z . \dt ~ V P
which has a solution
n(t) = noea)t. (11)
This is then consistent with Equation (6) when t ' is large and negative, then
n(t1) = 4ne . (12)
Powe
r
9
n
Fuchs-Ilordheira Model
Real pulse
Delayed Neutron tailt ti o
Time
Figure 1. Power vs. time of a pulse power excursion behavior.
10The power does not fall to zero immediately as
predicted by the Fuchs-Nordheim model but falls to a level limited by the delayed neutron production which was neglected„
CHAPTER 3
. EXPERIMENTAL METHOD
A reliable method to measure the power as a function of time during a short (= 500 msec) transient has been developed as a segment of this thesis work and will be described here.
3.1 Measurement SystemA simplified diagram of the measurement system used
is shown in Figure 2.The neutron flux, which is proportional to the
power of the reactor, is converted to the current flow at the anode end of the uncompensated ion chamber. The current is transformed to a proportional voltage by a linear current amplifier. The output voltage is then converted to a proportional pulse rate by the Voltage Controlled Oscillator (VCO).
The transient pulse has a short duration time of less than .5 sec. A multi-channel analyzer in a multiscaling operating mode was used to store the pulse train.The multi-scaler stores information with respect to time in multi-channel analyzer memory. One msec of counting time per channel was used for this measurement. The stored
11
Neutron Uncompensated ion chamber
High Power "Ready"voltage supply push button
current
Linear current amplifier
voltage Voltage pulse_ControlledOscillator
Digital Oscillovoltmeter scope
Multi- ' scaler
pulse Multichannel analyzer
digitaloutput
Printer or punch tape
Figure 2. Measurement system*
H
information is read out by a printer or punched on paper tape suitable for computer processing,
3,2 Electronic Instruments
3.2.1 Uncompensated Ion ChamberA neutron-sensitive ion chamber is used to determine
the neutron flux information. An uncompensated ion chamber has a single nitrogen-filled, boron-coated detecting volume, and is sensitive to both neutron and gamma radiation. If the neutron produced chamber current is large in comparison with gamma-produced current, it is not necessary to separate the gamma-produced current from neutron-produced current as in a compensated ion chamber. Neutrons interact with a boron coating on the detector walls according to the ■ . . following equation:
1°B + Jn -- > ^Li + 2He + Q.
This alpha particle ionizes the nitrogen gas in the chamber and produces electrons which then flow to the anode of the chamber. This current is proportional to the impinging neutron flux.
3.2.2 Linear Current AmplifierThe linear current amplifier (2) is a dc current
measuring component of the TRIGA control panel. It converts
14the dc current from the uncompensated chamber to a proportional voltage,
3,2,3 Voltage Controlled OscillatorA Voltage Controlled Oscillator (VCO) has a pulse
frequency output which is proportional to the voltage input. The pulse height can be varied, the frequency remains linear to the voltage input over a maximum range of approximately 2 volts, A smaller voltage range can be observed by amplifier adjustment.
The frequency varies linearly with the input voltage in the range 0-100 KHz with about a ,2% error, A flow diagram is shown in Figure 3 and a detail description of circuit is contained in Appendix A,
The voltage output from the linear current amplifier is amplified by the linear amplifier before it enters the integrator. The output of the integrator is initially set at 0 by the offset voltage at the input of ,0P1# which results in a Schmitt trigger output of -12 volts. When a positive voltage is received zat the amplifier input, the integrator is charged negatively until it reaches -7 volts, and this causes the Schmitt trigger to fire and produces an output of +2 volts, and turns on an n-channel field effect transistor, Q^, The capacitor of the integrator starts to discharge and clamps the input of the integrator at -7 volts, which causes the integrator to deliver a positive-going ramp
Multi-channel- 1 Sesa'analyzer
Linear Schmitttriggercurrent amp.
Linear.amplifier Integrator
Switch
Figure 3. Block diagram of VCO circuit.
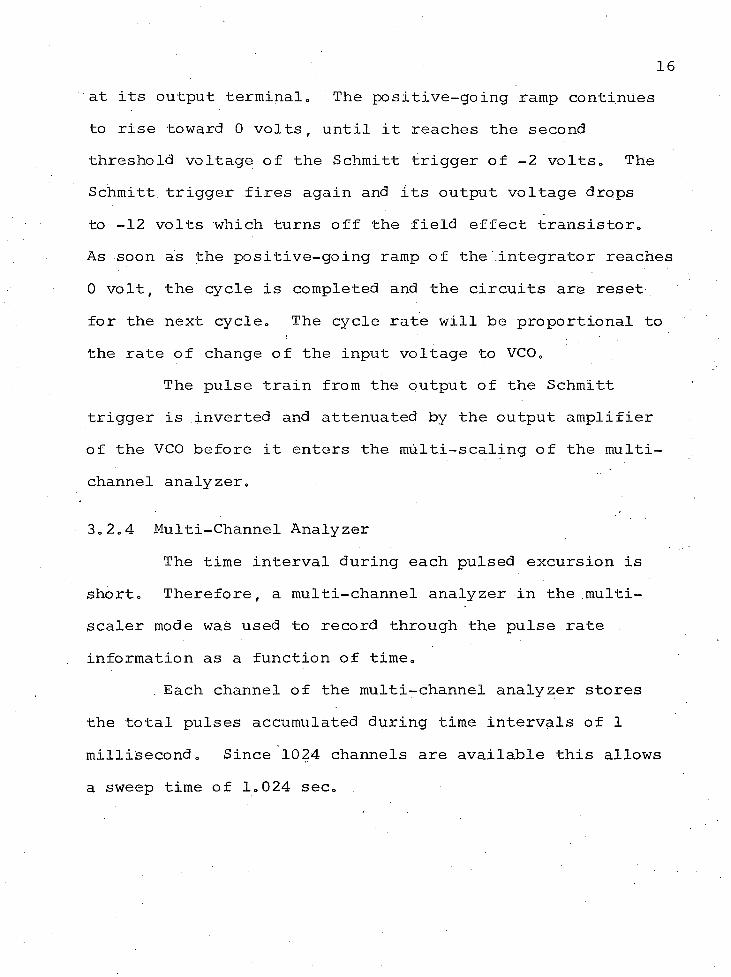
16at its output terminal. The positive-going ramp continues to rise toward 0 volts, until it reaches the second threshold voltage of the Schmitt trigger of -2 volts. The Schmitt trigger fires again and its output voltage drops to -12 volts which turns off the field effect transistor.As soon as the positive-going ramp of the integrator reaches 0 volt, the cycle is completed and the circuits are reset for the next cycle. The cycle rate will be proportional to the rate of change of the input voltage to VCO.
The pulse train from the output of the Schmitt trigger is inverted and attenuated by the output amplifier of the VCO before it enters the multi-scaling of the multichannel analyzer.
3.2.4 Multi-Channel AnalyzerThe time interval during each pulsed excursion is
short. Therefore, a multi-channel analyzer in the multiscaler mode was used to record through the pulse rate information as a function of time.
. Each channel of the multi-channel analyzer stores the total pulses accumulated during time intervals of 1 millisecond. Since 1024 channels are available this allows a sweep time of 1.024 sec.
CHAPTER 4
MEASUREMENT AND ANALYSIS
4.1 Pulse MeasurementThe reactor is brought to a power of 500 watts and
set for pulsing. The operate-test switch on the front panel of the VCO plugin unit is switched to operate and the offset voltage is adjusted so that there is no pulse at the output terminals.
The "Ready" push button on the reactor control panel is pressed to initiate the pulse which starts the multiscaler trigger circuit and initiates the multi-channel analyzer to store information. The sweep is set at 1 msec per channel.
After one sweep all 1024 channels of analyzer are stored. The stored data are then read out and printed on a paper tape.
4.2 Data AnalysisThe measured data for various reactivities plotted
on a linear graph are shown in Figure 4. The pulse peak power, half maximum power width, and total energy released are shown in Table 1.
The peak powers and total energies released shown in Table 2 were experimentally obtained with this system. The
17
200 "
OJB
100
4003002001000Time (msec)
Figure 4. Power vs. time at various reactivity insertions^ oo
19Table 1. The measured parameters at various reactivity
20data were collected instantaneously and integrated with a 1024 channel analyzer. The number of pulses was converted to volts and volt-sec by comparing with the calibration curve. Figure A2, These voltages were then converted to megawatts and megawatt-secs, using the fact known from the reactor control circuit calibration that the linear current amplifier gives 4,64 volts at the reactor power of 2000 Mw„
From Equation (5),o mh(t. ) = n sech -~-(t - t . ), i 2 o i
The parameter u> is determined by a least square fit of one unknown (5), we may write
, T.2 w. . .d . = n. - n sech -=-(t - t . ) x i 2 o x
where n^ and t^ are the measured values of power and time.Setting
- £ d? = Jr— £ [n.-n sech^ t -t. ) ]6tui " "i - ^ 2 ' o" x
we obtain
2 n £ [n.-n sech^ t -t. ) ]sech^ ■ ■(t -t. ) tanh - (t -t. ) ^ L x 2 o x 2 o x 2 o x
(t -t.) = 0 (13)O X
which is solved for uu by iteration, the computed values are shown in Table 3.
21Table 3. W and at various.reactivities.
p($) t (msec) n (Mw) E(Mw-sec) tti (sec) "T, .-jjtsec)
-g- can then be computed from the reactivities and&computed value of w. The computed is shown in Table 3.
The mean value plus the standard deviation is
•g- = . 0079 j- .0004 sec.
From Equation (9), we obtain that
22
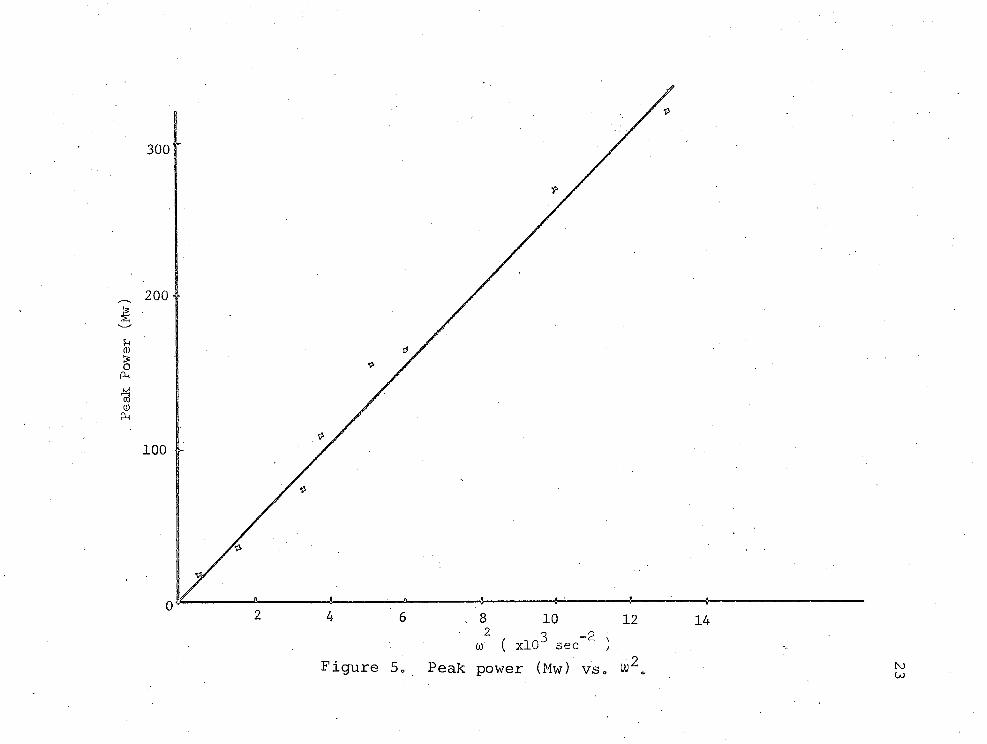
2 2 _ (1 5 )^2 - 2a K " 2A graph of n versus uu is shown in Figure 5„ A
least square analysis yields the slope ^ („ 0258+. 0012)a k ^from which — can be computed0
. Peak
Power
(Mw)
300"
200 ■ ■
100
4 6 .8 102 . 3 -2 xw ( xlO sec . )
Figure 5o Peak power (Mw) vs. W
12
CHAPTER 5
CONCLUSION AND FUTURE WORK
5.1 Conclusion In this study it was demonstrated that the Voltage
Control Oscillator can satisfactorily process the detector ' voltage output during the pulse type excursion of the TRIGA reactor. The analog information is converted to computable pulses for analysis and stored in a multi-channel analyzer. The VCO, as designed, can suitably measure data over a wide range of power from 1 to 319 Mw as can be expected in
. pulsing with reactivity insertion of $1 to $1.85.In addition to demonstrating the feasibility of the
data processing and storage, the experiment information was analyzed to determine some basic reactor parameters. These are summarized in Table 4.
Table 4. Experimentally determined parameters for the TRIGA Mark I reactor
Fuel elementV P(sec)
V20.K (Mw-sec )
CCK/I3 (Mw-sec)“type number clad
UZrH1.7 87 ss .0079+.0004 .0258+.0012 .154+. 011
24
255.2 Future Work
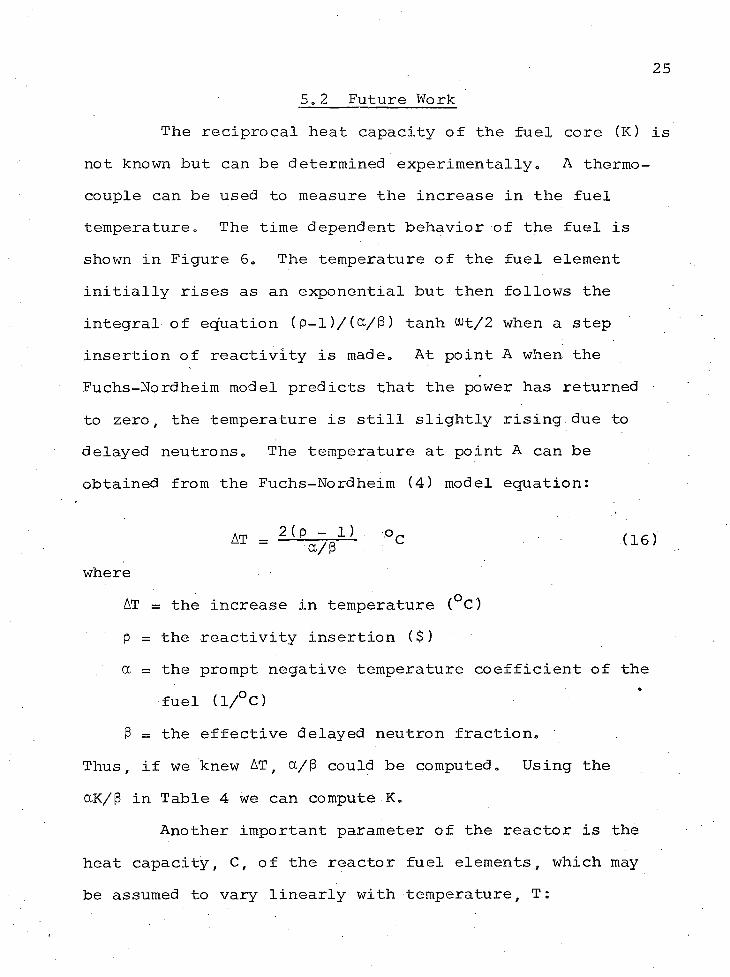
The reciprocal heat capacity of the fuel core (K) is not known but can be determined experimentally. A thermocouple can be used to measure the increase in the fuel temperature. The time dependent behavior of the fuel is shown in Figure 6. The temperature of the fuel element initially rises as an exponential but then follows the integral of equation (P-l)/ (&/£$ ) tanh wt/2 when a step insertion of reactivity is made. At point A when the Fuchs-Nordheim model predicts that the power has returned to zero, the temperature is still slightly rising due to delayed neutrons. The temperature at point A can be obtained from the Fuchs-Nordheim (4) model equation:
AT = 2-( Pa/p'1 ") °c (16)where
AT = the increase in temperature (°C) p = the reactivity insertion ($)a = the prompt negative temperature coefficient of the
fuel (1/°C)3 = the effective delayed neutron fraction.
Thus, if we knew AT, co/3 could be computed. Using the ccK/3 in Table 4 we can compute K„
Another important parameter of the reactor is the heat capacity, C, of the reactor fuel elements, which may be assumed to vary linearly with temperature, T:
26
Real curveDelayedneutrontail
Fuchs-NordheimModel
Time
gure 6. Fuel temperature as a function of time.
27
C = C + C T - a- t~-SeC (17)° 1 °C
where Cq and are coefficients and T = the temperature of fuel, °C„
We can derive new equations for power and energy after replacing 1/K by (C = Cq + C^T)„ Then Cq and can be determined by' analysis of data (4, 6)»
APPENDIX A
VOLTAGE CONTROL OSCILLATOR
The VCO circuit used to measure the power of the pulse reactor power excursion in this experiment is comprised of eight parts as follows:
1. A linear amplifier.2. An integrator.3. A Schmitt trigger.4. A reference voltage.5. An inverted amplifier.6. A test voltage.7. A voltage regulator.8. A multi-scaler trigger circuit
The circuit diagram of this VCO circuit is shown in Figure Al. Calibration curves for the voltage versus pulse output at different gains are shown in Figure A2„
The linear amplifier contains a dual operational amplifier. The gain knob is on the front panel, is connected between the input and output of OP 2. This makes it possible for the linear amplifier to be operated at various input voltage.
The integrator uses 1/2 of another dual operational amplifier, it converts the positive voltage from the linear amplifier to a negative-going ramp at its output terminal.
28
+16 v
CIO MS CllR18R19
+16 v2*13VWv--
rM7, M6 C12 T* R2 7on OP2
OP3-12 vOP4
M6Ml-12 *D5 +12 ■16 v
Voltage reguratorMl Cl*Multl-ecaler •tart programM4
"Beady" puah buttOhMO B31M3
n r R30DAD6
Multl-ecsler trigger circuit
Figure Al. VCO circuit.
Number
of pu
lses
Gain at 0.25.
ko\
Calibration: 4,64V 2000 Mw
0.1 0.2Input voltage '
Figure A2„ Number of pulses vs, input voltage at various gains for the VCO circuit.
1
31The Schmitt trigger is built with the other half of
the operational amplifier (OP 4). Its threshold levels are determined by the resistors R4 and R5 and by the -6,2 volts reference voltage attached to R4,
The reference network provides a common input bias compensation for the OP 3 and supplies the threshold voltage for the OP 4, The diodes D1 and D2 and resistor R6 stabilize the -7 volts threshold voltage for any unstability of -12 volts supply.
The inverted amplifier is a common amplifier using a NPN transistor, Q2 and a potentio-resistor, R35, where the output pulse train is inverted and attenuated to be a . negative pulse train with a maximum voltage of -0,5 volts.
The test voltage is accomplished with two resistors R22, R23 and a potentio-resistor R35, The series resistors are connected between a reference voltage of +2 volts and ground, This voltage is used to calibrate the VCO,
The regulated voltage is built with a PNP transistor Q4 and a NPN transistor Q3, The collectors of both transistors are connected with the Hh 24 volts power supply of the NIM BIN, The zener diodes D 7 , D8 give reference voltages to the bases of both transistors, so that, the emitters of both transistors have the regulated voltages of + 16 volts. These regulated voltages are used for the power supply of the VCO,
32Multi-scaler trigger circuit is accomplished with
two resistors R29, R30, a capacitor, C14 and a voltage source of +9 volts. The purpose of this circuit is to give a start pulse to trigger the multi-scaling as soon as the ready pulse is pressed and prohibit the second trigger pulse from the rod drop from triggering the multiscaling mode. Table 5 gives a parts listing for the VCO circuit.
The connection and operation of the pulse reactor power measurement system will be discussed in this appendix. In Figure B1 is shown a connection diagram of this system,
1, The system connection. The input of the VCO is connected to the right safety channel amp output.The output of the VCO is connected to the input of an oscilloscope and the "amp. in."of the MCS. The start program of the MCS is connected to a multiscaler trigger circuit which is connected, to the MCS Triggering of the reactor control circuit.
2. The system operation. The Multi-channel Analyzer is reset and switched to count. The At of the MCS is at .001 sec, the coarse and fine gain are at 2 and .5 respectively. Initially the Operate-Test switch is at Test, The Gain knob of the VCO is set at the position which will give 100 pulses per msec at peak power. When the reactor is at pulse-low mode, the Operate-Test switch will be switched to Operate, then the VCO is offset by a pot. resistor (R34) as shown in Figure B1 until there is no pulse on the
Figure Bl. The connection diagram of the pulse reactor power measurement system
36screen of the Oscilloscope. In case the VCO can not be offset with R34, it can be accomplished by turning R31 until it is completely reset. When the VCO is offset, it is ready to measure the pulse reactor power.The calibration of VCO. The calibration of VCO can be done by switching the Operate-Test switch to Test. The Gain is set at the calibrated position and is offset in the same way as 2 above. At this position the input voltage of VCO is given by the built-in test voltage. The input voltage can be measured by a digital volt-meter when its input is connected to the input voltage outlet of VCO and the number of pulses is read out on the paper tape. The calibrated value of VCO is shown in Figure Bl.
REFERENCES
TRIGA Reactor Description. San Diego, California: General Atomic, 1958.
Mikesell, R. E. Instrumentation Manual for the Torrey Pines TRIGA Reactor. San Diego, California: Gulf General Atomic Inc., GA-7275, 1966.
Young, J. C., Young, J. A .# Houghton, G. H . , Trimble,G . D . t and Beyster, J. R. "Neutron Thermalization in Zirconium Hydride," Nuclear Science and Engineering. 19:230-241, 1964.
Hetrick, D . L. "The Nordheim-Fuchs Model," Dynamic of Nuclear Reactors. Chicago: The University of Chicago Press, 1971.
Young, H. H. "Least Squares with Several Unknowns," Statistical Treatment of Experimental Data. New York: McGraw-Hill Company, 1962.
Scaletter, R. The Fuchs-Nordheim Model with Variable Heat Capacity. San Diego, California: General Dynamics, Gulf General Atomic Inc., GA-3416, 1962.