Page 1
DSpace Institution
DSpace Repository http://dspace.org
Power Systems Engineering Thesis
2020
POWER QUALITY PROBLEMS IN
INDUSTRIAL ENTERPRISES AND
THEIR MITIGATION TECHNIQUES
(CASE STUDY IN AMHARA PLASTIC
PIPE FACTORY)
TSEGAYE, FIREW
http://hdl.handle.net/123456789/11695
Downloaded from DSpace Repository, DSpace Institution's institutional repository
Page 2
BAHIR DAR UNIVERSITY
BAHIR DAR INSTITUTE OF TECHNOLOGY (BiT)
SCHOOL OF RESEARCH AND POSTGRADUATE STUDIES
FACULTY OF ELECTRICAL AND COMPUTER ENGINEERING
POWER QUALITY PROBLEMS IN INDUSTRIAL ENTERPRISES
AND THEIR MITIGATION TECHNIQUES
(CASE STUDY IN AMHARA PLASTIC PIPE FACTORY)
By
FIREW TSEGAYE SISAY
ADVISOR: DR.-ING. BELACHEW BANTYIRGA
Bahir Dar, Ethiopia
July 21, 2020
Page 3
POWER QUALITY PROBLEMS IN INDUSTRIAL ENTERPRISES AND THEIR
MITIGATION TECHNIQUES
BY
FIREW TSEGAYE SISAY
A thesis submitted to the school of Research and Graduate Studies of Bahir Dar Institute
of Technology, BDU in partial fulfillment of the requirements for the degree of master in
the power system engineering in the faculty of electrical and computer engineering
Advisor:
Dr.-Ing. BELACHEW BANTYIRGA
Bahir Dar, Ethiopia
July 21, 2020
Page 4
POWER QUALITY PROBLEMS IN INDUSTRIAL ENTERPRISES AND THEIR MITIGATION TECHNIQUES
MSc. Thesis By Firew Tsegaye/Power System Engineering/BIT/BDU Page i
DECLARATION
I, the undersigned, declare that the thesis comprises my own work. In compliance
with internationally accepted practices, I have acknowledged and refereed all
materials used in this work. I understand that non-adherence to the principles of
academic honesty and integrity, misrepresentation/ fabrication of any
idea/data/fact/source will constitute sufficient ground for disciplinary action by the
University and can also evoke penal action from the sources which have not been
properly cited or acknowledged.
Name of the student: Firew Tsegaye Sisay
Signature
Date of submission: July 21, 2020
Place: Bahir Dar
This thesis has been submitted for examination with my approval as a university
advisor.
Advisor’s Name: Dr.-Ing. Belachew Bantyirga
Advisor’s Signature:
Page 5
POWER QUALITY PROBLEMS IN INDUSTRIAL ENTERPRISES AND THEIR MITIGATION TECHNIQUES
MSc. Thesis By Firew Tsegaye/Power System Engineering/BIT/BDU Page ii
© July 21, 2020
FIREW TSEGAYE SISAY
POWER QUALITY PROBLEMS IN INDUSTERIAL ENTERPRISES AND THEIR
MITIGATION TECHNIQUES
CASE STUDY IN AMHARA PLASTIC PIPE FACTORY
ALL RIGHTS RESERVED
Page 6
POWER QUALITY PROBLEMS IN INDUSTRIAL ENTERPRISES AND THEIR MITIGATION TECHNIQUES
MSc. Thesis By Firew Tsegaye/Power System Engineering/BIT/BDU Page iii
Page 7
POWER QUALITY PROBLEMS IN INDUSTRIAL ENTERPRISES AND THEIR MITIGATION TECHNIQUES
MSc. Thesis By Firew Tsegaye/Power System Engineering/BIT/BDU Page iv
ACKNOWLEDGEMENTS
First and foremost, I thank the Almighty God for his mercy and grace, and strength and
persistent to finalize this thesis work. I would like to express my deepest thanks to my
advisor Dr. Ing. Belachew Bantyirga his diligent and valuable guidance, unreserved
support and encouragement throughout the thesis work. Thank you very much for clear
guidance, critical suggestions, constructive comments and interesting discussion from the
beginning to the end of the entire thesis work.
I am thankful for amhara plastic pipe factory management teams and staff for allowing
me to do my study in their reputed factory. My specials thanks to Mr. Abraraw Addis for
his kind support in providing the resources and information and help me in collecting
data for this study. Finally, I would like to express my deepest thanks to my family for
their marvelous support and encouragement throughout this thesis work. Last, but not
least thanks my friends and all my staff members for their help and encouragement.
Page 8
POWER QUALITY PROBLEMS IN INDUSTRIAL ENTERPRISES AND THEIR MITIGATION TECHNIQUES
MSc. Thesis By Firew Tsegaye/Power System Engineering/BIT/BDU Page v
ABSTRACT
Electric energy is essential for real world. Electric power system is the integration of
generation, transmission and distribution stations. It is a network of electrical components
deployed to supply, transfer, and use of electrical power. In order to use the utmost
benefit from the entire electrical power system, a proper electric power quality should be
maintained. There are several PQ problems that can significantly affect the performance
of electric equipment in the industries and affect the day-to-day activities of individual
consumers. Hence, industries should give high priority for mitigation measures in case
PQ problems occur by various factors. The present study was carried out with the main
objective to assess the PQ problems of industrial enterprises and evaluate the PQ problem
mitigation techniques taking APPF as a case. The data collected were analyzed based on
acceptable values set by IEEE 519-1992 standard that is suitable for developing
mitigation power quality problem models. Modeling was done using DVR and SAPF
models. MATLAB software was employed to analyze the data and run the models. The
Simulation of factory power distribution system with and without PQ problem mitigation
techniques were carried out using MATLAB/SIMULINK. Result analysis was also done
by comparisons of factory power distribution system with and without mitigation
techniques, which considered cost and IEEE standard. Moreover, the PQ problems were
evaluated based on IEEE standard. Results reveal that the three phases to ground fault is
occurred at distribution line and the voltage sage occurred around 65.78% rms, which
was unacceptable voltage according to the IEEE standard. But when DVR is connected,
injected missing voltage around 34% rms, the voltage variation is solved and acceptable
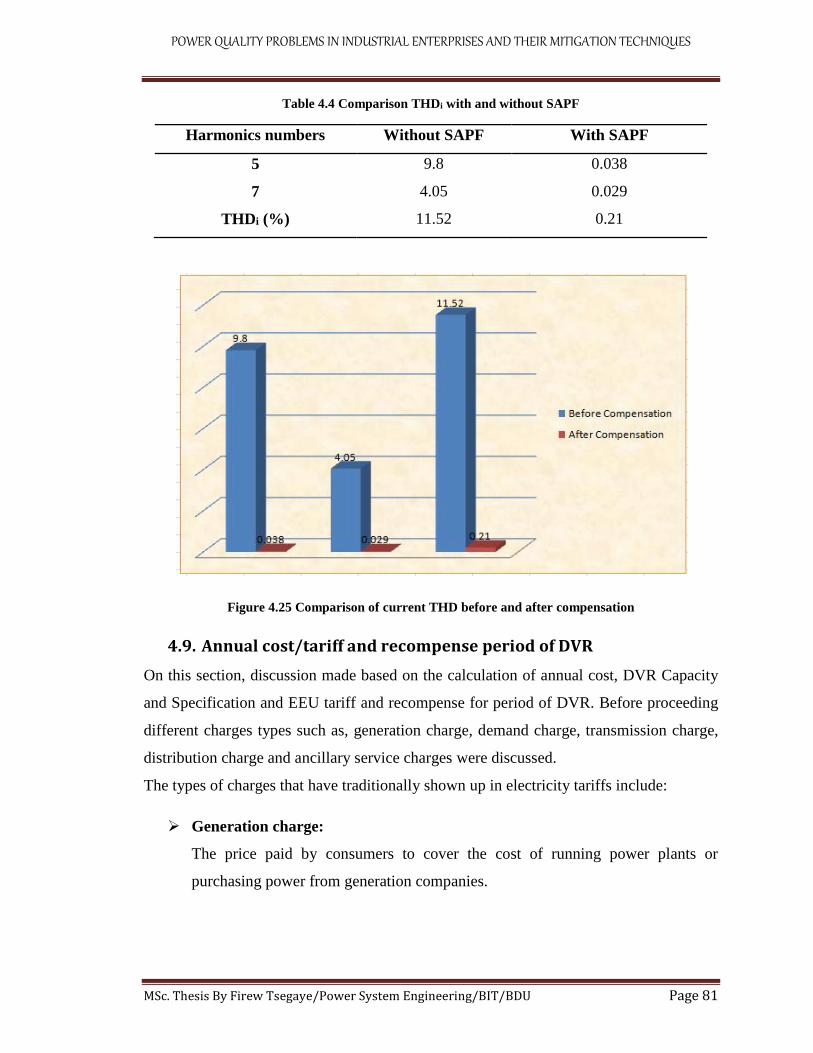
by IEEE standard. Results also show that the THD of the factory is 11.52% indicating it
is beyond the IEEE standard (i.e. 5%). However, when SAPF is connected, the THD
reduced from 11.52% to 0.21% implying it fits the acceptable IEEE standard. The
simulation result of this thesis depicts that DVR provides better response to protect
voltage sage problem occurs on sensitive loads. The cost and recompense period of DVR
results confirm that DVR has relatively low cost, small in size and fast dynamic response
time. Based on the results found of this thesis, it is recommended that the factory should
consider using both the DVR and SAPF effective PQ mitigation techniques.
Keywords: Active power filter, dynamic voltage restorer, mitigation technique.
Page 9
POWER QUALITY PROBLEMS IN INDUSTRIAL ENTERPRISES AND THEIR MITIGATION TECHNIQUES
MSc. Thesis By Firew Tsegaye/Power System Engineering/BIT/BDU Page vi
TABLE OF CONTENTS
Contents Page No
DECLARATION ................................................................................................................. i
ACKNOWLEDGEMENTs................................................................................................ iv
Abstract ............................................................................................................................... v
LIST OF FIGURES ............................................................................................................ x
LIST OF TABLES ........................................................................................................... xiii
LIST OF ACRONYMS ................................................................................................... xiv
LIST OF SYMBOLS ........................................................................................................... i
CHAPTER ONE ................................................................................................................. 1
1. INTRODUCTION .......................................................................................................... 1
1.1. Background .............................................................................................................. 1
1.2. Background of the study area ................................................................................... 2
1.3. Motivation ................................................................................................................ 5
1.4. Statement of the problem ......................................................................................... 5
1.5. Objective of the thesis .............................................................................................. 6
1.5.1. General Objective ............................................................................................... 6
1.5.2. Specific Objective .............................................................................................. 6
1.6. Research Methodology ............................................................................................. 6
1.7. Scope of the Study .................................................................................................... 7
1.8. Significance of the study .......................................................................................... 7
1.9. Organization of the Thesis ....................................................................................... 8
CHAPTER TWO ................................................................................................................ 9
2. LITERATURE REVIEW AND THEORETICAL BACKGROUND OF STUDY ....... 9
2.1. Power quality issues in electrical power system .................................................... 13
Page 10
POWER QUALITY PROBLEMS IN INDUSTRIAL ENTERPRISES AND THEIR MITIGATION TECHNIQUES
MSc. Thesis By Firew Tsegaye/Power System Engineering/BIT/BDU Page vii
2.1.1. Interruptions ..................................................................................................... 14
2.1.2. Waveform distortion ......................................................................................... 14
2.1.3. Frequency variations ........................................................................................ 15
2.1.4. Transients ......................................................................................................... 15
2.1.5. Short Duration Voltage Variation .................................................................... 15
2.1.6. Long Duration Voltage Variation ..................................................................... 15
2.1.7. Voltage Sage ..................................................................................................... 16
2.1.8. Voltage swell .................................................................................................... 17
2.1.9. Voltage unbalance ............................................................................................ 18
2.1.10. Voltage fluctuation ........................................................................................ 18
2.1.11. Flicker ............................................................................................................ 19
2.1.12. Harmonics ...................................................................................................... 19
2.1.13. Electrical line noise ....................................................................................... 21
2.2. Voltage disturbance IEEE standard ........................................................................ 21
2.3. Dynamic Voltage Restorer (DVR) and Active Power Filter (APF) ....................... 24
2.3.1. Theoretical background of FACTS devices ........................................................ 24
2.3.2. Dynamic Voltage Restorer (DVR) ................................................................... 25
2.3.2.1. Series injection transformer/booster transformer ......................................... 26
2.3.2.2. Harmonic filter ............................................................................................. 27
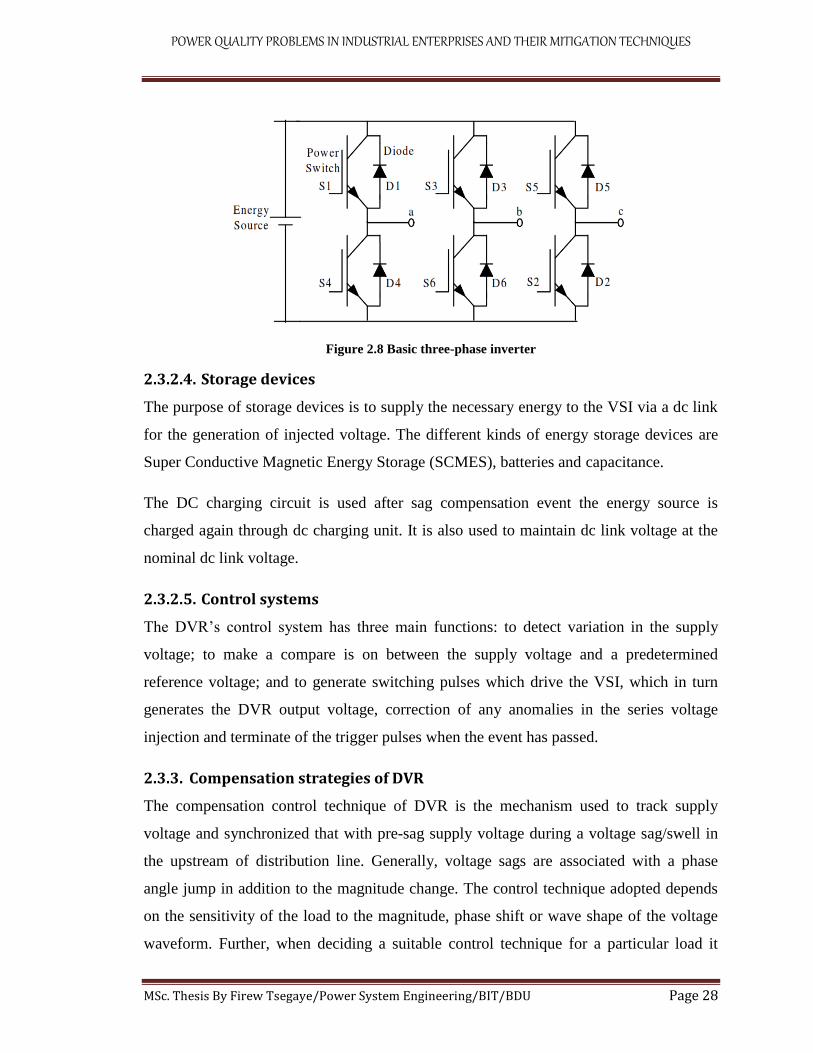
2.3.2.3. Voltage source inverter ................................................................................. 27
2.3.2.4. Storage devices ............................................................................................. 28
2.3.2.5. Control systems ............................................................................................ 28
2.3.3. Compensation strategies of DVR ........................................................................ 28
2.3.3.1. Pre-sag compensation ................................................................................... 29
2.3.3.2. In-phase compensation ................................................................................. 30
Page 11
POWER QUALITY PROBLEMS IN INDUSTRIAL ENTERPRISES AND THEIR MITIGATION TECHNIQUES
MSc. Thesis By Firew Tsegaye/Power System Engineering/BIT/BDU Page viii
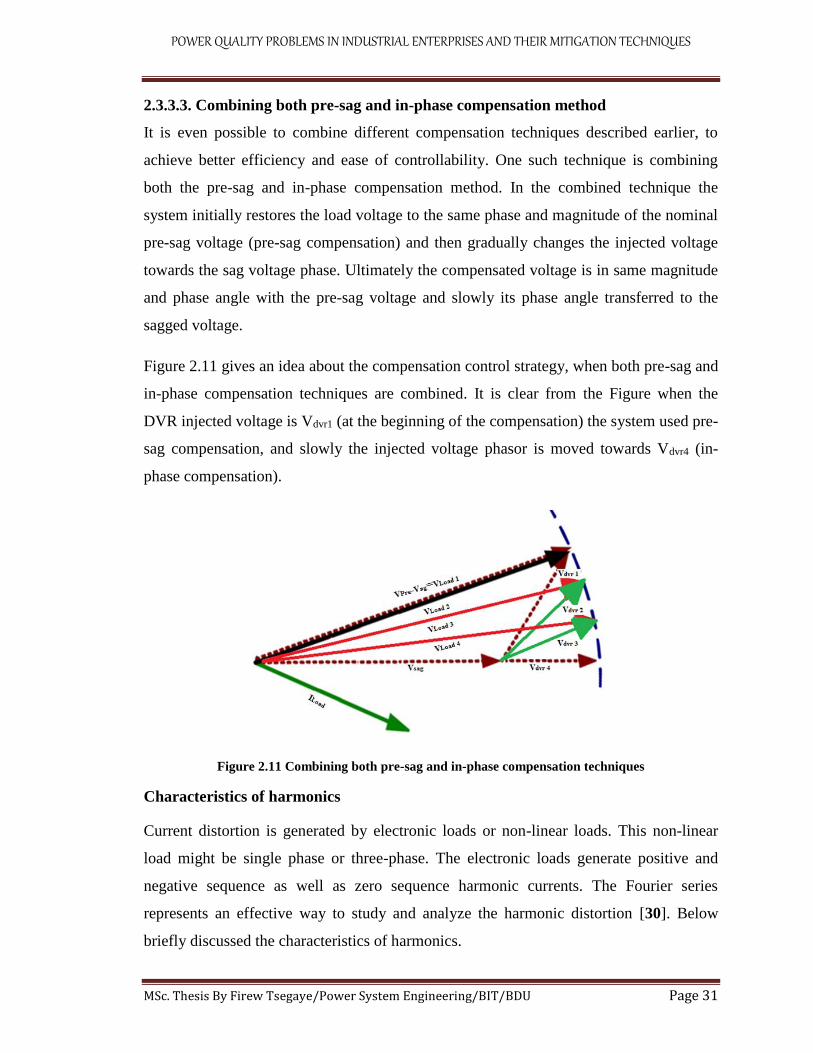
2.3.3.3. Combining both pre-sag and in-phase compensation method ...................... 31
2.4. Harmonics Distortion ............................................................................................. 33
2.4.1. Total Harmonic Distortion (THD) ................................................................... 34
2.4.2. Sources of Harmonics ...................................................................................... 34
2.4.3. Effects of Harmonics ....................................................................................... 35
2.4.4. Types of Harmonic filter .................................................................................. 36
CHAPTER THREE .......................................................................................................... 40
3. POWER QUALITY PROBLEMS IN THE TEST SYSTEM SITE AND PROPOSED
MITIGATION METHOD ................................................................................................ 40
3.1. Mitigation of voltage sag using Dynamic Voltage Restorer .................................. 40
3.1.1. Equivalent circuit of DVR ................................................................................ 40
3.1.2. Mathematical modeling for voltage injection by DVR system ........................ 41
3.1.3. Control system for dynamic voltage restorer ................................................... 42
3.1.4. Injection Transformer ....................................................................................... 44
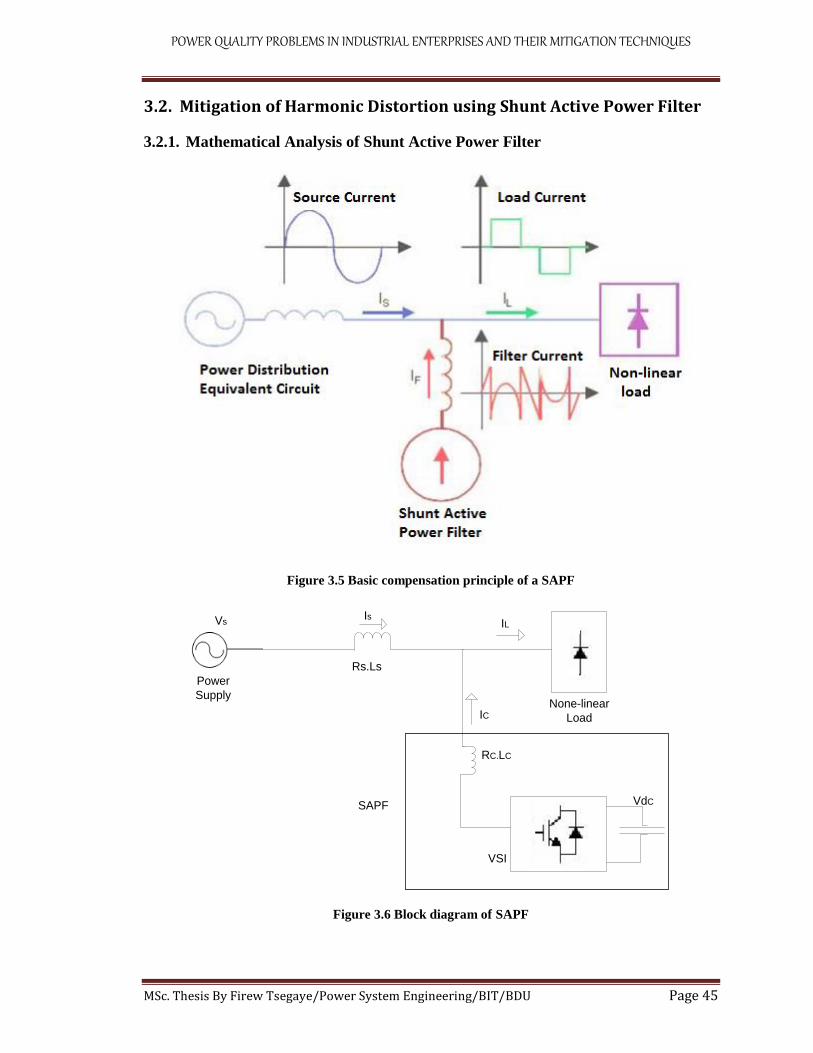
3.2. Mitigation of Harmonic Distortion using Shunt Active Power Filter .................... 45
3.2.1. Mathematical Analysis of Shunt Active Power Filter ...................................... 45
3.2.2. Voltage source inverter of shunt active power filter ........................................ 50
3.2.3. Selection of DC side capacitor ......................................................................... 51
3.2.4. Selection of DC voltage reference .................................................................... 52
3.2.5. Selection of Filter inductance ........................................................................... 53
3.2.6. Harmonic Current Extraction Methods ............................................................ 54
3.2.7. Instantaneous Real and Reactive Power Theory (p-q method) ........................ 54
3.2.8. PI controller for Shunt Active Power Filter ..................................................... 61
3.2.9. Hysteresis band current control ........................................................................ 63
Page 12
POWER QUALITY PROBLEMS IN INDUSTRIAL ENTERPRISES AND THEIR MITIGATION TECHNIQUES
MSc. Thesis By Firew Tsegaye/Power System Engineering/BIT/BDU Page ix
CHAPTER FOUR ............................................................................................................. 65
4. SIMULATION RESULTS AND DISCUSSION ......................................................... 65
4.1. Mitigation of Voltage sag problem ........................................................................ 65
4.1.1. Three phase fault occur on factory distribution system ................................... 66
4.2. Simulink model of multistage voltage sage without DVR ..................................... 66
4.2.1. Multistage faults ............................................................................................... 67
4.3. Performance solution of factory voltage sage power quality problem ................... 67
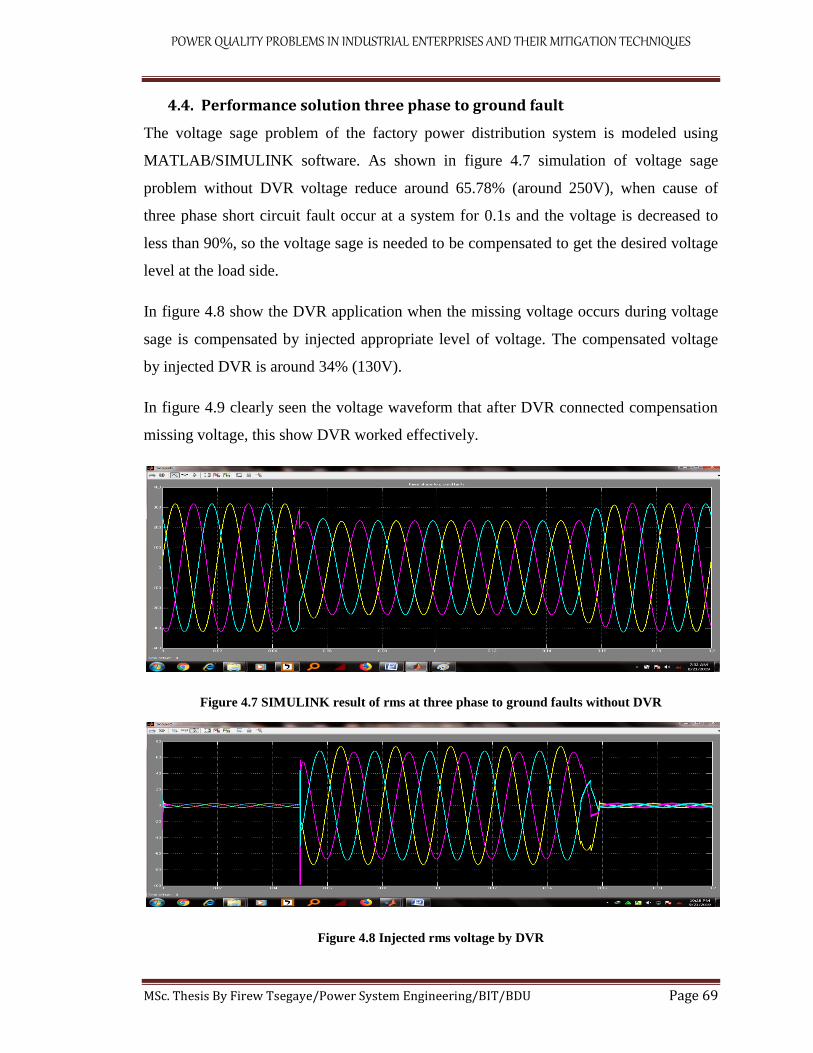
4.4. Performance solution three phase to ground fault .................................................. 69
4.5. SIMULINK model of Multistage Voltage Sage with DVR ................................... 70
4.6. Mitigation of Harmonic distortion ......................................................................... 73
4.7. Performance solution for Harmonic Distortion ...................................................... 76
4.8. Result analysis and comparison of before and after SAPF implement .................. 78
4.9. Annual cost/tariff and recompense period of DVR ................................................ 81
CHAPTER FIVE .............................................................................................................. 85
5. CONCLUSIONS AND RECOMMENDATIONS ....................................................... 85
5.1. Conclusions ............................................................................................................ 85
5.2. Recommendations .................................................................................................. 86
6.3. Future Work ........................................................................................................... 86
Reference .......................................................................................................................... 87
APPENDIX ....................................................................................................................... 92
APPENDIX A: Factory single line Load flow analysis diagram .................................. 92
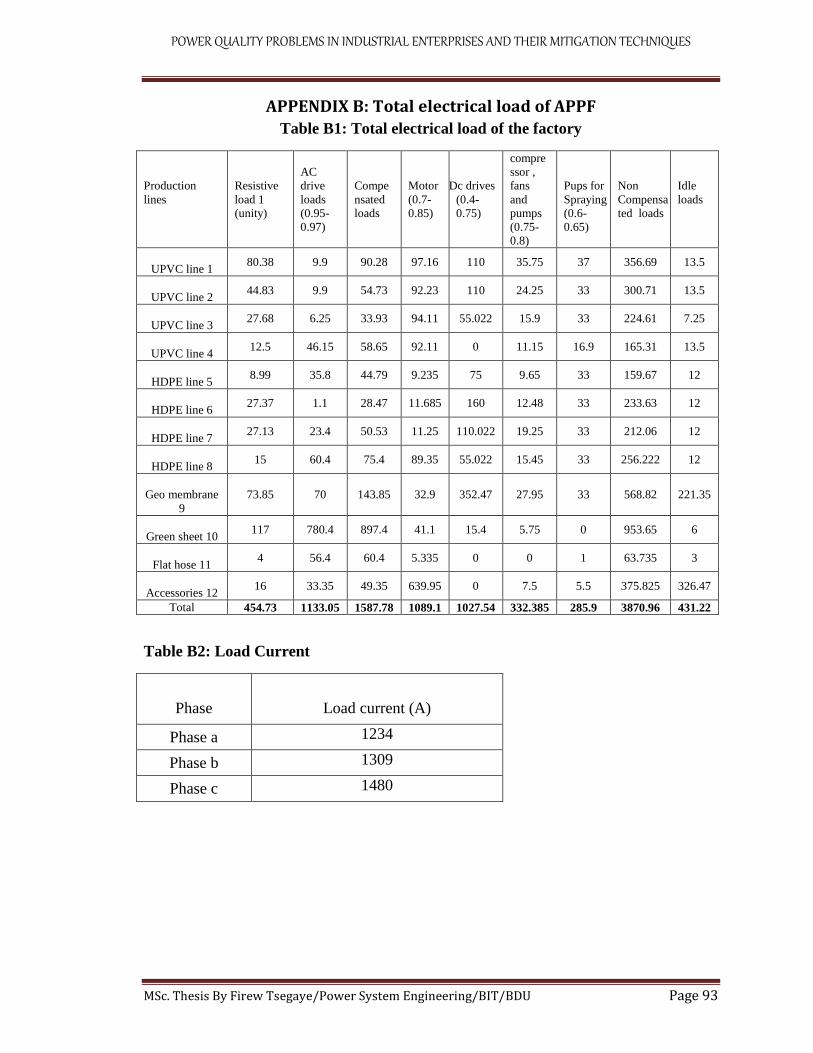
APPENDIX B: Total electrical load of APPF .............................................................. 93
APPENDIX C: Electricity tariff category ................................................................... 110
Page 13
POWER QUALITY PROBLEMS IN INDUSTRIAL ENTERPRISES AND THEIR MITIGATION TECHNIQUES
MSc. Thesis By Firew Tsegaye/Power System Engineering/BIT/BDU Page x
LIST OF FIGURES
Figure 1.1 Partially parts of APPF ...................................................................................... 3
Figure 1.2 Single line diagram of amhara plastic pipe factory distribution system ........... 4
Figure 2.1 Voltage signal with long interruption .............................................................. 16
Figure 2.2 Voltage sag ...................................................................................................... 16
Figure 2.3 Voltage swell ................................................................................................... 18
Figure 2.4 Voltage fluctuations......................................................................................... 18
Figure 2.5 Flicker waveform............................................................................................. 19
Figure 2.6 DVR voltage waveforms ................................................................................. 26
Figure 2.7 Schematic diagram of DVR............................................................................. 26
Figure 2.8 Basic three-phase inverter ............................................................................... 28
Figure 2.9 Vector diagram for pre-sag compensation technique ...................................... 30
Figure 2.10 Vector diagram for in-phase compensation technique .................................. 30
Figure 2.11 Combining both pre-sag and in-phase compensation techniques .................. 31
Figure 2.12 Periodic distorted waveforms ........................................................................ 33
Figure 2.13 (a) Low pass filter (b) High pass filter .......................................................... 37
Figure 2.14 Active filter .................................................................................................... 37
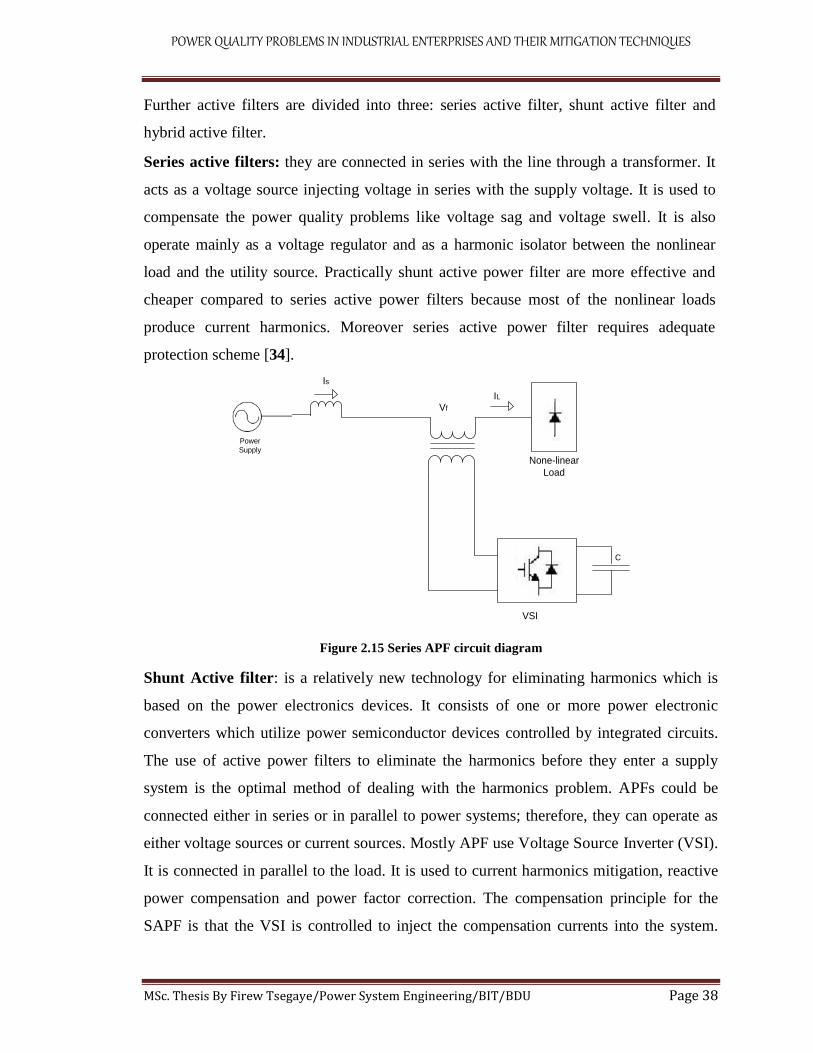
Figure 2.15 Series APF circuit diagram ............................................................................ 38
Figure 2.16 Shunt active power filter circuit diagram ...................................................... 39
Figure 2.17 UPQC circuit diagram ................................................................................... 39
Figure 3.1 Equivalent circuit of DVR ............................................................................... 40
Page 14
POWER QUALITY PROBLEMS IN INDUSTRIAL ENTERPRISES AND THEIR MITIGATION TECHNIQUES
MSc. Thesis By Firew Tsegaye/Power System Engineering/BIT/BDU Page xi
Figure 3.2 DVR voltage injection schematic diagram ..................................................... 41
Figure 3.3 Flow chart of feed forward control technique for dynamic voltage restorer
based on dqo transformation ............................................................................................. 43
Figure 3.4 Converter with an open star/star transformer connection................................ 44
Figure 3.5 Basic compensation principle of a SAPF ........................................................ 45
Figure 3.6 Block diagram of SAPF................................................................................... 45
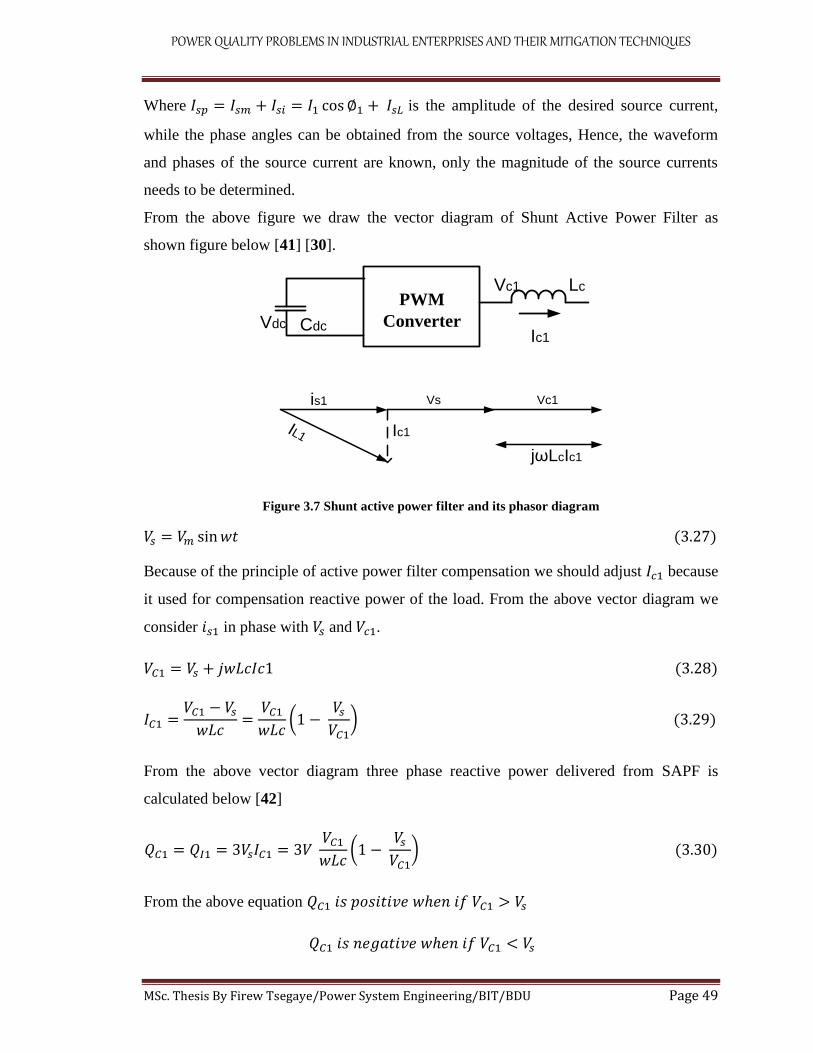
Figure 3.7 Shunt active power filter and its phasor diagram ............................................ 49
Figure 3.8 Voltage source converter for shunt active power filters .................................. 50
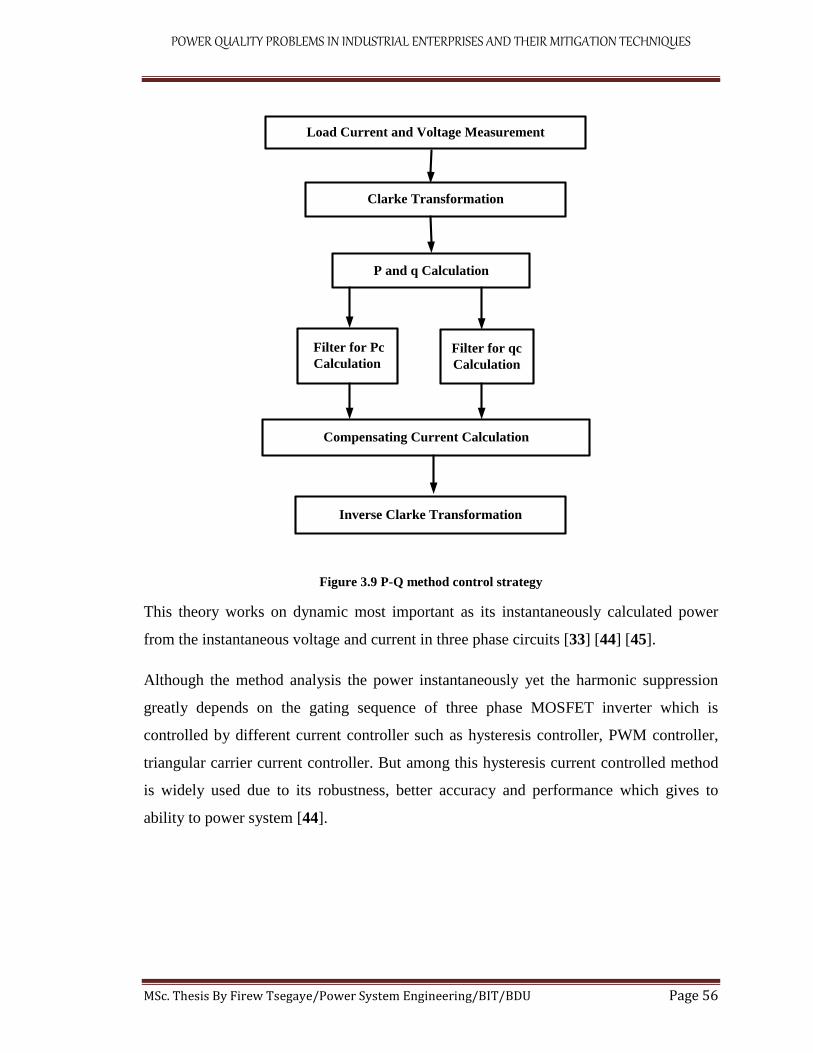
Figure 3.9 P-Q method control strategy ............................................................................ 56
Figure 3.10 LPF with feed-forward effect ........................................................................ 59
Figure 3.11 Principle of instantaneous active and reactive power theory ........................ 60
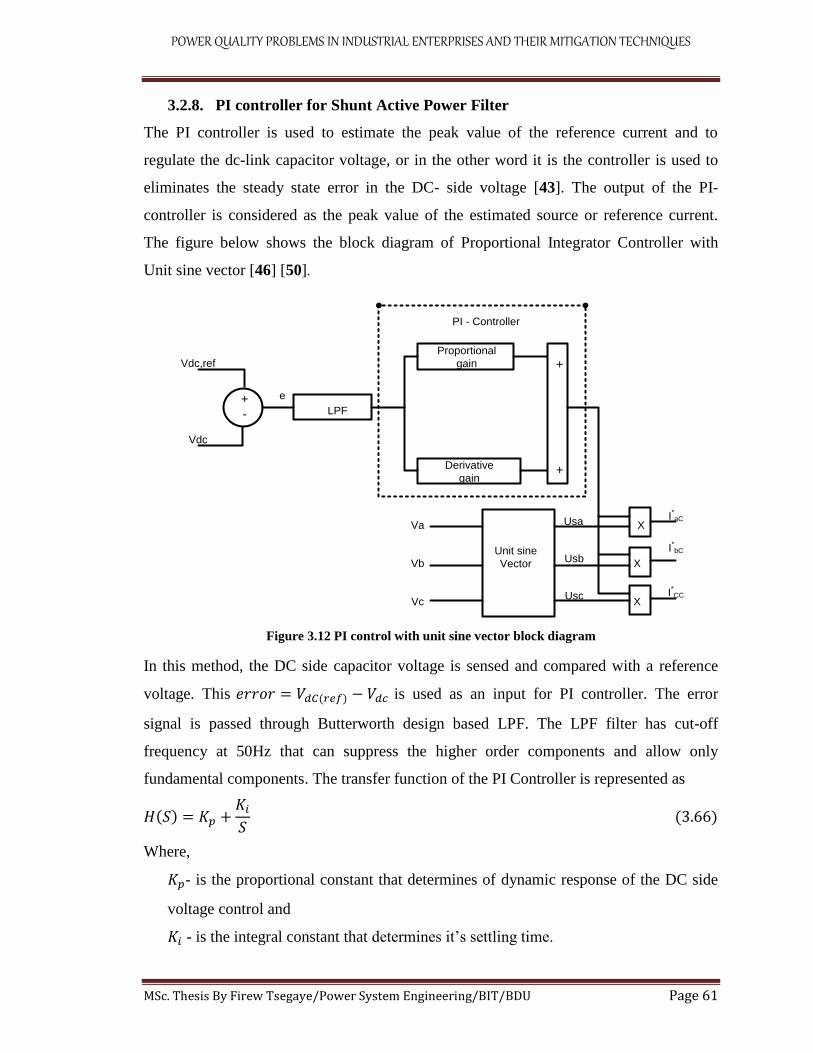
Figure 3.12 PI control with unit sine vector block diagram ............................................. 61
Figure 3.13 Hysteresis band current controller block ....................................................... 63
Figure 3.14 Hysteresis band current controller graph ....................................................... 64
Figure 3.15 Demonstration of hysteresis band current controller using MATLAB/
SIMULINK ....................................................................................................................... 64
Figure 4.1 Simmulink model of factory with three phases to ground fault without using
DVR .................................................................................................................................. 65
Figure 4.2 SINULINK result of rms value at three phases to ground faults .................... 66
Figure 4.3 Simmulink model of factory with multistage voltage sage faults without
dynamic voltage restorer ................................................................................................... 66
Figure 4.4 Simulink result rms voltage of multistage faults without DVR ...................... 67
Figure 4.5 Simmulink model of factory with three phase sag with DVR ......................... 68
Figure 4.6 Simulink model of DVR .................................................................................. 68
Page 15
POWER QUALITY PROBLEMS IN INDUSTRIAL ENTERPRISES AND THEIR MITIGATION TECHNIQUES
MSc. Thesis By Firew Tsegaye/Power System Engineering/BIT/BDU Page xii
Figure 4.7 SIMULINK result of rms at three phase to ground faults without DVR ........ 69
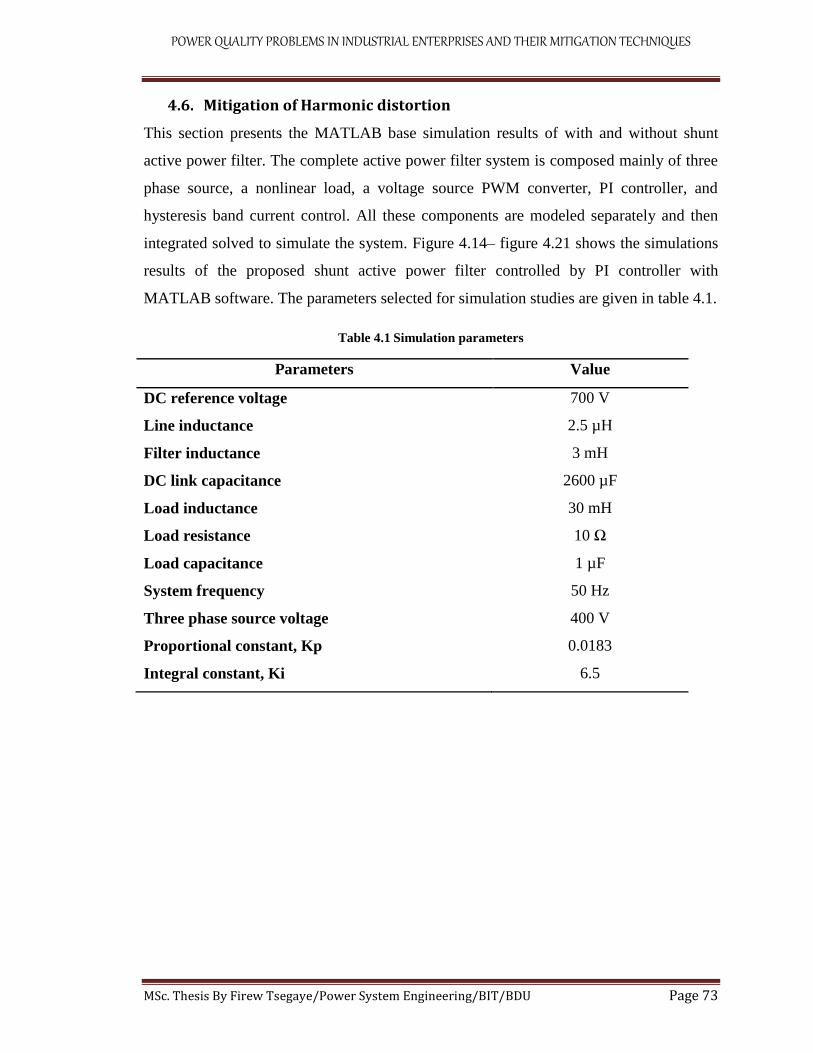
Figure 4.8 Injected rms voltage by DVR .......................................................................... 69
Figure 4.9 Simulink result of rms voltage at three phases to ground fault with DVR...... 70
Figure 4.10 SIMULINK model of factory multistage voltage sage with DVR ................ 71
Figure 4.11 Simulink result of rms at multistage faults without DVR ............................. 71
Figure 4.12 Injected rms voltage by DVR for multistage faults ....................................... 72
Figure 4.13 Simulink result of rms voltage multistage fault with DVR ........................... 72
Figure 4.14 Simulink model of amhara plastic pipe factory before filter ......................... 74
Figure 4.15 Source voltage waveform of phase ‘a’ without SAPF .................................. 74
Figure 4.16 Source current waveform of phase ‘a’ without SAPF ................................... 75
Figure 4.17 Load current waveform of phase ‘a’ without SAPF ...................................... 75
Figure 4.18 Simulink model of shunt active power filter for APPF ................................. 76
Figure 4.19 Source voltage waveform of phase ‘a’ with filter ......................................... 76
Figure 4.20 Source current waveform of phase ‘a’ with filter .......................................... 77
Figure 4.21 Load current waveform of phase ‘a’ with filter ............................................. 77
Figure 4.22 FFT analysis of source current waveform after compensation ..................... 80
Figure 4.23 Harmonics spectrum ...................................................................................... 78
Figure 4.24 FFT analysis of source current waveform before filtering ............................ 79
Figure 4.25 Comparison of current THD before and after compensation ........................ 81
Page 16
POWER QUALITY PROBLEMS IN INDUSTRIAL ENTERPRISES AND THEIR MITIGATION TECHNIQUES
MSc. Thesis By Firew Tsegaye/Power System Engineering/BIT/BDU Page xiii
LIST OF TABLES
Table 2.1 Definition of voltage disturbance ..................................................................... 22
Table 2.2 IEEE 519-1992 Current harmonics limits (69kV) .......................................... 23
Table 2.3 IEEE 519-1992 Current harmonics limits (69-169kV)..................................... 23
Table 2.4 IEEE 519-1992 Current harmonics limits (161kV) ........................................ 23
Table 2.5 IEEE 519-1992 voltage harmonics limits ......................................................... 23
Table 4.1 Simulation parameters ...................................................................................... 73
Table 4.2 Current harmonic distortion after compensation .............................................. 80
Table 4.3 Current harmonic distortion before compensation ........................................... 79
Table 4.4 Comparison THDi with and without SAPF ...................................................... 81
Page 17
POWER QUALITY PROBLEMS IN INDUSTRIAL ENTERPRISES AND THEIR MITIGATION TECHNIQUES
MSc. Thesis By Firew Tsegaye/Power System Engineering/BIT/BDU Page xiv
LIST OF ACRONYMS
AF
APPF
ASD
ATS
CBEMA
CPD
CSI
DB
DFT
DigSILENT
DVR
EM
EPQ
FACTS
HBCC
IEEE
IGBT
KVA
KVAR
KW
PI
PL
PLC
PQ
THD
UPQC
Active Filter
Amhara Plastic Pipe Factory
Adjustable Speed Drives
Automatic Transfer Switch
Computer and Business Equipment Manufacturers' Association
Custom Power Devices
Current Source Inverter
Distribution Board
Discrete Fourier Transfer
DIgital SImuLation and Electrical Network calculation
Dynamic Voltage Restorer
Energy Meter
Electrical Power Quality
Flexible Alternating Current Transmission System
Hysteresis Band Current Control
Institute of Electrical and Electronics Engineers
Insulated Gate Bio-polar Transistor
Kilo-Volt-Ampere
Kilo-Volt-Ampere-Reactive
Kilowatt
Proportional Integration
Production line
Programmable Logic Control
Power Quality
Total Harmonic Distortion
Unified Power Quality Conditioner
Page 18
POWER QUALITY PROBLEMS IN INDUSTRIAL ENTERPRISES AND THEIR MITIGATION TECHNIQUES
MSc. Thesis By Firew Tsegaye/Power System Engineering/BIT/BDU Page i
LIST OF SYMBOLS
𝐼𝑠𝑐 Short Circuit Current
𝑉𝑙𝑜𝑎𝑑 Load voltage
𝐼ℎ Harmonics Current
𝑇𝐻𝐷𝑉 Total Harmonic Distortion voltage
𝑇𝐻𝐷𝑖 Total Harmonic Distortion current
𝐼𝐿 Load Current
𝑉𝑝𝑟𝑒_𝑠𝑎𝑔 Pre-sag voltage
𝑉𝑠𝑎𝑔 Voltage sag
𝑉𝐷𝑉𝑅 DVR injected voltage
𝑉𝑝𝑐𝑐 Point of common coupling voltage
𝑉ℎ ℎ𝑡ℎHarmonic peak voltage
𝜑ℎ ℎ𝑡ℎHarmonic current phase
𝜃ℎ ℎ𝑡ℎHarmonic voltage phase
𝜔 Angular Frequency
𝑓 Fundamental frequency
𝑍𝑙𝑖𝑛𝑒 Line impendence
𝑉𝑠𝑜𝑢𝑟𝑐𝑒 System voltage during any fault condition
𝑆𝐷𝑉𝑅 Apparent power voltage to the load voltage
𝑉𝑟𝑒𝑓 Reference voltage
𝑝𝑓 Fundamental real power
𝑝𝑟 Fundamental reactive power
𝑝ℎ Harmonic power drawn by the load
𝑝𝑐 Ideal power compensation
Page 19
POWER QUALITY PROBLEMS IN INDUSTRIAL ENTERPRISES AND THEIR MITIGATION TECHNIQUES
MSc. Thesis By Firew Tsegaye/Power System Engineering/BIT/BDU Page ii
𝑖𝑠𝑎∗ Source current after compensation
𝐼𝑠𝑝 Desired source current
𝐶𝐷𝐶 DC side capacitor
𝐸𝑚𝑎𝑥 Maximum Energy
𝑉𝐷𝐶,𝑝_𝑝𝑚𝑎𝑥 Peak to peak voltage ripple
𝑉𝑝𝑝 Peak to peak voltage
𝑚𝑠 Modulation ratio of PWM converter
𝑘𝑝 Derivation gain
𝑘𝑖 Integral gain
𝑤𝑛 Natural frequency
𝐼𝑎𝑏𝑐∗ Reference current
𝐼𝑓𝑎𝑏𝑐 Actual filter current
𝐼𝑒 Error current
Page 20
POWER QUALITY PROBLEMS IN INDUSTRIAL ENTERPRISES AND THEIR MITIGATION TECHNIQUES
MSc. Thesis By Firew Tsegaye/Power System Engineering/BIT/BDU Page 1
CHAPTER ONE
1. INTRODUCTION
1.1. Background
Electric power quality, or simply power quality, can be described as the electrical limits
which permit the equipment to operate in an intended way without making any major loss
in its way of working or in the longevity [1]. Power quality is described as the variation
of voltage, current and frequency in a power system [2]. It refers to a wide variety of
electromagnetic phenomena that characterize the voltage and current at a given time and
at a given location in the power system.
Power quality involves voltage, frequency, and waveform. In general, it is useful to
consider power quality as the compatibility between what comes out of an electric outlet
and the load that is plugged into it. Good power quality can be defined as a steady supply
voltage that stays within the prescribed range. It is the overall result of the integration of
the generation, transitional and distribution stations. Hence, the power quality has to be
checked and appropriate mitigation measures should be applied for efficient use of
electric power.
There are several power quality problems. The most common power quality problems
include short duration variations (sags, swells and interruption), long duration variations
(under voltages and over voltages), voltage imbalance, waveform distortion (harmonics,
notching, and noise), voltage fluctuations and power frequency variations and transients
[3]. Power quality problems can significantly affect the performance of electric
equipment in the industries and affect the day-to-day activities of individual consumers.
Power quality issues are of vital concern in most industries today, because of the increase
in the number of loads sensitive to power disturbances. The power quality is an index to
quality of current and voltage available to industrial, commercial and customers. These
power quality problems may cause abnormal operations of facilities or even trip
protection devices. It can significantly contribute to the fail information technology
equipment like microprocessor-based control system Personal Computer (PC),
Programmable Logic Controls (PLCs), Adjustable Speed Drives (ASDs) etc. These
Page 21
POWER QUALITY PROBLEMS IN INDUSTRIAL ENTERPRISES AND THEIR MITIGATION TECHNIQUES
MSc. Thesis By Firew Tsegaye/Power System Engineering/BIT/BDU Page 2
eventually may lead to a process stoppage, trip contactors and electromechanical relays
and then disconnection and loss of efficiency in electrical rotating machines, motors
burnout and cable insulation damage [4]. Hence, industries should give high priority for
mitigation measures in case power quality problems occur by various factors.
As power quality problems relates to the non-standard voltage, current or frequency
deviation that results in failure or mis-operation of end-user equipment, the mitigation
measures to control the quality problems should mainly address to use the power as per
the recommend standard. In order to mitigate the power quality problems, the literature
describes the use of two main tools. These are Active Power Filters (APF) and Custom
Power Devices (CPDs). APF are filters that can perform the job of harmonic elimination.
CPDs are the new generation of power electronics-based equipment aimed at enhancing
the reliability and quality of power flows in low-voltage distribution networks. CPDs
include Dynamic Voltage Restorer (DVR), Distribution Static Compensator
(DSTATCOM) and Unified Power Quality Conditioner (UPQC) [2].
1.2. Background of the study area
Amhara plastic pipe factory was established in 2003 E.C in Bahir Dar town, which is
located about 565 km north to Addis Ababa. APPF is the biggest among the factories that
produce plastic products in Ethiopia. It is mainly manufacturing and supplying products
that will be used in the projects related with water sector development and construction
sectors. It produces high quality products of UPVC, HDPE, and geomembrane. It
constantly strives to meet customer needs and expectations, enhancing its market share
all over the region and to be preferred company in domestic and export markets.
Page 22
POWER QUALITY PROBLEMS IN INDUSTRIAL ENTERPRISES AND THEIR MITIGATION TECHNIQUES
MSc. Thesis By Firew Tsegaye/Power System Engineering/BIT/BDU Page 3
Figure 1.1 Partially parts of APPF
The factory power distribution system consists of three existing distribution transformers
of capacity two 800 kVA and one 1250 kVA. The factory has one diesel generator of
capacity 1500 kVA in the factory, which is used as emergency power supply for some
critical loads.
As shown in figure 1.2 single line diagram of APPF distribution System figure, this
factory has a power consumption of 2.85 MVA from two 800 kVA and one 1250 kVA
step down transformers for UPVC, HDPE and geo membrane sheet machines and 1.6
MVA from two 800 kVA step down transformers (for new expansion plan) for green
sheet and recycle machines. Totally 4.45 MVA power is delivered by north west district
EEU from the high voltage side 15 kV main air force distribution feeder.
Based on investigation around 95% of APPF machineries are work micro-processor-
based control systems devices, which are expensive and sensitive nonlinear loads. Thus,
eventually affect the normal operation of these devices. These power quality problems
can be addressed using various mitigation measures.
The present study was carried out on the use of the power quality problems mitigation
measures in the factories. To this purpose, this study is devoted to assessing the power
problems and evaluates the application of mitigation measures/techniques in factories,
taking amhara plastic and pipe factory as a case.
Page 23
POWER QUALITY PROBLEMS IN INDUSTRIAL ENTERPRISES AND THEIR MITIGATION TECHNIQUES
MSc. Thesis By Firew Tsegaye/Power System Engineering/BIT/BDU Page 4
Air force feeder distribution line 15 kV
T4
T515 kV/0.4 kV 15 kV/0.4 kV
800 kVA 800 kVA
0.4 KV
954 KW 64 KW 370 KW
15 KV
T1T2 T3
1250 kVA
1000 kW
619.7 kVAR
800 kVA
640 kW
396.6 kVAR
800 kVA
640 kW
396.6 kVAR
15 kV/0.4 kV15 kV/0.4 kV 15 kV/0.4 kV
0.4 kv
0.4 kV
PL 1 PL 2 PL 3 PL 4 PL 5 PL 6 PL 7 PL 8 PL 9
357 KW 300 KW 225 KW 165 KW 160 KW 234 KW 212 KW 256 KW 569 KW
New Expansion line
ATS
Automatic
Transfer
Switch
EM
EM EM
AC stand by
Generator
1500 kVA
DB 1
DR 2
PL 12PL 11PL 10
Figure 1.2 Single line diagram of amhara plastic pipe factory distribution system
Page 24
POWER QUALITY PROBLEMS IN INDUSTRIAL ENTERPRISES AND THEIR MITIGATION TECHNIQUES
MSc. Thesis By Firew Tsegaye/Power System Engineering/BIT/BDU Page 5
1.3. Motivation
The main objective of the Ethiopia growth and transformation plan (GTPII) is to serve as
a springboard towards realizing the national vision of becoming a low middle-income
country by 2025. Industry development is one key strategy that can contribute to achieve
the objective of the GTP. The Ethiopia industrial development strategic plan (2013-2025)
provides the overall framework in terms of the vision, goal, strategies and programs that
need to be implemented in the coming thirteen years in order to support the country’s
progress towards becoming a middle-income country by the year 2025. To achieve the
ultimate objective of the country in general and the industry sector in particular, the
electric power is the key input.
However, the supply of electric power to industries is by far below the actual demand.
One reason is from the electric power system of the country as the system is not effective
in generation of electric power, transmission and distribution of power to industries and
individual customers. This results in power shortage problem. The power shortage
created a situation that strained production process of different activities including
industrial activities.
Besides the electric power system, power quality problems can also significantly affect
the industries performance. These power quality problems may cause abnormal
operations of facilities or even trip protection devices. It was reported in earlier literature
that power quality problem affects Ethiopian industries.
1.4. Statement of the problem
In context of economical activities electrical demand of Ethiopia increasing day-to-day.
Especially government begins to strategy implementation growth and transformation
plans (GTPI), because government of Ethiopia establishes new industry parks different
regions to accelerate and sustain this transformation. APPF establish early to start
industry parks in Ethiopia but the factory faced different power quality problem during
production process. Like voltage sage and harmonic distortion. To solve these power
quality problems dynamic voltage restorers and shunt active power filter is the best
mitigation techniques. This thesis focuses on power quality problems industrial
enterprises and their mitigation techniques.
Page 25
POWER QUALITY PROBLEMS IN INDUSTRIAL ENTERPRISES AND THEIR MITIGATION TECHNIQUES
MSc. Thesis By Firew Tsegaye/Power System Engineering/BIT/BDU Page 6
1.5. Objective of the thesis
1.5.1. General Objective
The general objective of this thesis is to improve the power quality of industrial
enterprises by using power quality problem mitigation techniques.
1.5.2. Specific Objective
The specific objectives of the thesis are:
To compare harmonic distortion and voltage sage disturbance level with IEEE 519-
1992 acceptable standard.
To model DVR to mitigate voltage sag
To develop Active filters for mitigation of harmonic distortion.
To analyze the level of power quality enhancement with and without power quality
problem mitigation techniques.
1.6. Research Methodology
The present study was consulted both primary and secondary data. The primary data were
collected from the factory; whereas secondary data were gathered from various
documents through desk/literature review.
Literature review:
Various literatures was consulted/reviewed and systematically compiled in order to
understand the power supply system, power quality problems in industrial enterprises and
their mitigation techniques. The information was accessed from scientific journals,
project documents, reports, white papers, progress reports and relevant websites.
Data collection
Required data for amhara plastic pipe factory collected from factory technicians and from
head of process control manager.
Data Analysis
The data collected were analyzed based on acceptable values set by IEEE standards, and
to make suitable for developing mitigation power quality problem models.
Page 26
POWER QUALITY PROBLEMS IN INDUSTRIAL ENTERPRISES AND THEIR MITIGATION TECHNIQUES
MSc. Thesis By Firew Tsegaye/Power System Engineering/BIT/BDU Page 7
Modeling
Modeling was done using dynamic voltage restorer and harmonic filters models
MATLAB software was employed to analyze the data and run the models.
Simulation
The simulation of factory power distribution system with and without power quality
problem mitigation techniques can be carried out in MATLAB/SIMULINK.
Result Analysis
Result analysis was done by comparisons of factory power distribution system with and
without mitigation techniques, which considered to cost and IEEE standard.
1.7. Scope of the Study
This thesis covered the use of DVR device and applied SAPF for harmonics filters to
mitigate power quality problem in industrial enterprises. These techniques used as they
considered commonly used techniques in industries. However, there are other techniques
that may consider for power quality problem mitigation measures. Hence, the scope of
this thesis is limited to the study of power quality problems in industrial enterprises and
their mitigation techniques by using DVR device and harmonics filters.
1.8. Significance of the study
This thesis identified the power quality problems and their mitigation techniques taking
amhara plastic pipe factory as a case. The results and recommendations of this thesis
have significant implication for other industries too. The main significances of this thesis:
Industries can revise the techniques for mitigation techniques of PQ problem
Industries design strategy and actions to eliminate PQ problem of their industries
Industries can maximize the life span of the equipment, and increase the
efficiency and performance of equipment
Industries can increase their productivity and overall performance
It helps managers to make good decision to address the power quality problem
It gives inputs for further reference for researchers and practitioners
Page 27
POWER QUALITY PROBLEMS IN INDUSTRIAL ENTERPRISES AND THEIR MITIGATION TECHNIQUES
MSc. Thesis By Firew Tsegaye/Power System Engineering/BIT/BDU Page 8
1.9. Organization of the Thesis
The thesis is organized into five chapters. The first chapter discusses the introduction
part, which consists of the background, motivation, statement of the problem,
objectives, research methodology, scope of the study, and significance of the study. The
background of study is also included in chapter. Chapter two discusses power quality
problems, the power quality categories as per IEEE standard1159-1995, and their causes
and undesirable effects. Literature review is also included in chapter. In chapter three,
the thesis describes the power quality problems in the test system site and proposed
mitigation method. It also discusses about modeling power quality problem in
industrial enterprises and their mitigation techniques. Chapter four presents simulation
results and discussion. Chapter five presents the conclusions of the study with possible
recommendations and suggests some areas for future works.
Page 28
POWER QUALITY PROBLEMS IN INDUSTRIAL ENTERPRISES AND THEIR MITIGATION TECHNIQUES
MSc. Thesis By Firew Tsegaye/Power System Engineering/BIT/BDU Page 9
CHAPTER TWO
2. LITERATURE REVIEW AND THEORETICAL
BACKGROUND OF STUDY
Various researchers have been done in the area of power quality problem and their
mitigation techniques. Basically, they focused elimination of voltage sage/voltage swell
and harmonic distortion power quality problems by using different mitigation techniques.
There are a lot of power quality problem occurred in industrial enterprises. The common
power quality problem occurred in the industrial enterprises are voltage sags, voltage
swells and harmonics distortion. This problem could affect the performance, productivity,
profitability of industrial enterprises. Therefore, it is needed to come out with the solution
to reduce this variety of disturbances/problems.
Prior studies show that several researchers have been devoted their time to define and
explain the concept of power quality problems and their mitigations. Researchers also
tried to understand the main causes of power problems and the possible mitigation
techniques to address the power quality problems in industrial enterprises. The followings
present a brief review of the work undertaken so far.
In 2017 S. Khan, et.al [5], provided various definitions of power quality. According to
IEEE 519-1992, power quality can be described as “the concept of powering and
grounding electronic equipment in manner that is suitable to the operation of that
equipment and compatible with the premise wiring system and other connected
equipment”. Another definition is “power quality can be prescribe as the electrical limits
which permit the equipment to operate in an intended way without making any major loss
in its way of working or in the longevity.” From this definition it is understood that
power quality problem explains in the form of power transmission system and it can
affect the production process of the industries.
In July 2011 A. Bangar [6], explained why the power quality is a big issue in the
industry. He mentioned that power quality has serious economic implications for
consumers, utilities and electrical equipment manufacturers. Modernization and
Page 29
POWER QUALITY PROBLEMS IN INDUSTRIAL ENTERPRISES AND THEIR MITIGATION TECHNIQUES
MSc. Thesis By Firew Tsegaye/Power System Engineering/BIT/BDU Page 10
automation of industry involves increasing use of computers, microprocessor and power
electronics systems such as Adjustable Speed Drives (ASDs). The impact of power
quality problems is increasingly felt by customers, industrial, commercial and even
residential. He also explained power quality problem mitigation techniques are necessary
for all industry. However, he did not properly address the possible mitigation techniques.
In 2001 A. ElMofty and K. Youssef [7] also tried to discuss the effect of power quality
on the performance of industries. They explained the increased the power quality
problem has resulted in measuring power quality variations and characteristic
disturbances for different industrial categories. The devices and equipment used in
industry include microprocessor-based controls and electric devices that are sensitive to
many types of electrical disturbances besides to actual interruptions. For mitigate power
quality problem, they noted the use of Autotransformer method.
In 2008 F.A.L. Jowder [8], described four different system topologies for DVR have
been analyzed and tested with focus on the method used to acquire the necessary energy
during voltage sags. These topologies are: (i) DVR with no storage and supply-side
connected shunt converter, (ii) DVR with no storage and load-side-connected shunt
converter, (iii) DVR with energy storage with variable dc-link-voltage, and (iv) DVR
with energy storage and with constant-dc link voltage. The first two topologies take
energy from the grid and the other two topologies take energy from the energy storage
devices during the voltage sag. He also discussed about DFT approach. For this approach,
the three-phase supply distorted voltage is measured and passed to the SIMULINK block
designated as discrete Fourier.
In 2014 P. P. Kaur and S. Gupta [9], discussed about DVR as one of the custom power
devices which can improve power quality, especially voltage sags and voltage swells. As
there are more and more concerns for the quality of supply as a result of more sensitive
loads in the system conditions, better understanding of the devices for mitigating power
quality problems is important.
In April 2014 P. R. Asabe et.al, [10], presented a solution for reducing the losses
because of produced harmonics and increasing the quality of power at the consumers’
Page 30
POWER QUALITY PROBLEMS IN INDUSTRIAL ENTERPRISES AND THEIR MITIGATION TECHNIQUES
MSc. Thesis By Firew Tsegaye/Power System Engineering/BIT/BDU Page 11
side. They argued that there is no one mitigation technique that will suitable for every
application. They recommended the best way to avoid power quality problem is by
ensuring that all equipment to be installed in the industrial plants are compatible with
power quality in power system.
In April 2017 I.A. Adejumobi et.al [11], discussed the consequence of harmonics
problem like overheating of motor, generators, transformers, and insulation familiarity.
The focused on series and parallel resonance harmonics filter, but it needs additional cost
for parallel resonance filter connect with series to capacitor bank. The explained that
series resonance filter is used to maintain power factors within the acceptable value.
In November 2016 J. Kaiwart et.al [12] explained on the journal liner reactor
harmonics problem mitigation techniques. It is the simplest means of attenuating
harmonics. The paper is also connected in series with an individual non-linear load. The
main drawback of this paper was voltage drop and increase system losses. Authors tried
to show different harmonics problem mitigation techniques such as low pass harmonic
filters, which includes one or more series elements with a set of tuned elements. The
series elements increase the input circuit effective impedance to reduce overall harmonic
and to de-tune the shunt element relative to supply and load ends. It has gained popularity
due to ability to attenuate all harmonic frequencies and achieve low level of residual
harmonic distortion. The limitation of this technique is that it has to connect in series with
the load and it can only be used with nonlinear loads, because it can cause increased
heating effect and lower life expectancy for linear loads. The technique also experiences
low leading power factor at light loads due to occurrence of voltage boosting because of
presence of shunt capacitor and reactor.
In July 2015, M. Abid et.al [13], this paper explained the harmonics mitigation
techniques by using phase shifting techniques by MATLAB simulation. The mitigation of
harmonics by employing phases shifting transformer, the mechanism of harmonics
filtering is to connect the primary winding side of the transformer. The drawback of this
harmonic filter technique is not significant value for sensitive microprocessor based
device.
Page 31
POWER QUALITY PROBLEMS IN INDUSTRIAL ENTERPRISES AND THEIR MITIGATION TECHNIQUES
MSc. Thesis By Firew Tsegaye/Power System Engineering/BIT/BDU Page 12
In 2012 T.K. Abdel-Galil, [14] discussed about the sources of harmonics distortion
stand from the characteristic behavior of non-linear load. These sources draw a distorted
current waveform even though the supply voltage is sinusoidal. Most equipment only
produces odd harmonics. The current distortion, for each device, changes due to the
consumption of active power, background voltage distortion and changes in the source
impendence. An overview for the most common types of single and three phase non-
linear loads for residential and industrial use is provided in this paper. However, the
paper did not explain the mitigation technique 3ht and 5th harmonics problem manly occur
on rotary machineries.
In 2017 L. Ciufu, et.al, [15] discussed about the performance of different harmonics
mitigation techniques and select hybrid filter with a 99% THD mitigation performance.
However, this mitigation technique can be used only for low voltage non-linear power
source.
In 2016 K. P. Kota, [16], explained the way of mitigation harmonic distortion by using
passive filter. Passive filter has its own drawbacks such as it is bulky, it is designed for
specific purpose, it has limited compensation, and it may cause resonance if it not
designed properly.
In 2014 S. Mukherjee, N. Saxena, and A.K. Sharma, [17], showed harmonic reduction
using shunt active filter. Active filters solve the problem of harmonics in industrial area
as well as utility power distribution. The active power filter working performance is
based on the techniques used for the generation of reference current. With the
development various technologies, it resulted in the lowering of harmonics below 5% as
specified by IEEE.
In general, the literature review above concerned on harmonic problem mitigate
techniques use passive filter, autotransformer, and hybrid filter. To sum up, their
drawbacks include they are bulky, increase power loss designed for specific purpose and
limited compensation. These techniques means passive filter, autotransformer, and hybrid
filter are causes of resonance if they are not designed properly that means not significant
value for microprocessor based device. Further, the review hybrid filter use with a 99%
Page 32
POWER QUALITY PROBLEMS IN INDUSTRIAL ENTERPRISES AND THEIR MITIGATION TECHNIQUES
MSc. Thesis By Firew Tsegaye/Power System Engineering/BIT/BDU Page 13
THD mitigation performance but this mitigation technique can be used only for low
voltage non-linear power source. This thesis used APF for mitigation of harmonics
problem. Active filter is most important for sensitive non-linear loads. It can easily
monitor load current, filter out the fundamental frequency current and analysis the
frequency and magnitude content of the remainder parameters. Further, it reduces THD
by using additional elements PI controller, filter hysteresis current control loop and dc
link capacitor. This thesis focuses on power quality improvement of APPF by using
different power quality problem mitigation techniques.
2.1. Power quality issues in electrical power system
The electric power system has rapidly grown in size and complexity with a huge number
of interconnections to meet the increase in the electric power demand. Power quality is
one of the major issues in the power system. The Institute of Electrical and Electronic
Engineers (IEEE) Standard IEEE1100 defines power quality as “the concept of powering
and grounding sensitive electronic equipment in a manner suitable for the equipment”.
Generally, Power Quality is ultimately a consumer driven issue defined as: “Any power
problem manifested in voltage, current or frequency deviation those results in failure or
main-operation of consumers’ equipment” [18].
The fulfillments of the industrial goals were possible only because the modern industries
were able to find innovative technologies that have successfully become technological
developments. Continuous production throughout the period is ensured only when the
final objective is to optimize the production while achieving maximum profit sand
achieving minimized production costs.
Modern manufacturing and process equipments demand high quality un-interruptible
power. Because of the modern manufacturing and process equipments that operate at high
efficiency require stable and defect free power supply for the successful operation of their
machines. Machines, sensitive to power supply variations are to be designed more
precisely. For instance, some instruments like adjustable speed drives, automation
devices, power electronic components etc. fall into the above category.
Page 33
POWER QUALITY PROBLEMS IN INDUSTRIAL ENTERPRISES AND THEIR MITIGATION TECHNIQUES
MSc. Thesis By Firew Tsegaye/Power System Engineering/BIT/BDU Page 14
All electrical devices are level to failure or malfunction when exposed to one or more PQ
problems. The electrical device might be an electric motor, a transformer, a generator, a
computer, a printer, communication equipment, or a house hold appliance. All of these
devices react adversely to PQ issues, depending on the severity of problems. PQ can be
roughly broken into categories as follows:
2.1.1. Interruptions
It is the failure in the continuity of supply for a period. Here the supply signal (voltage
or current) may be close to zero. This is defined by IEC (International Electrical
technical Committee) as “lower than 1% of the declare value” and the IEEE (IEEE
Stad.1159:1995) as decrease in the voltage supply level to less than 10% of nominal for
up to one minute duration.
2.1.2. Waveform distortion
The power system network tries to generate and transmit sinusoidal voltage and current
signals. But the sinusoidal nature is not maintained and distortions occur in the signal.
The cause of wave form distortions are:
DC Offset: The DC voltage which is presented in the signal is known as DC
offset.
Due to the presence of DC offset, the signal shifts by certain level from its actual
reference level.
Harmonics: These are voltage and current signals at frequencies which are
integral multiples of the fundamental frequency. These are caused due to the
presence of non-linear load offense the power system network.
Inter Harmonics: These are the harmonics at frequencies which are not the
integral multiples of fundamental frequency.
Notching: This is a periodic disturbance caused by the transfer of current from
one phase to another during the commutation of a power electronic device.
Noise: This is caused by the presence of unwanted signals. Noise is caused due
to interference with communication networks.
Page 34
POWER QUALITY PROBLEMS IN INDUSTRIAL ENTERPRISES AND THEIR MITIGATION TECHNIQUES
MSc. Thesis By Firew Tsegaye/Power System Engineering/BIT/BDU Page 15
2.1.3. Frequency variations
The electric power network is designed to operate at a specified value (50Hz) of
frequency. The frequency of the frame work is identified with the rotational rate of the
generators in the system. The frequency variations are caused if there is any imbalance
in the supply and demand. Large variations in the frequency are caused due to the
failure of a generator or sudden switching of loads.
2.1.4. Transients
The transients are the momentary changes in voltage and current signals in the power
system over a short period of time. These transients are categorized in to two types-
impulsive, oscillatory. The impulsive transients are unidirectional where as the
oscillatory transients have swings with rapid change of polarity.
There are many causes due to which transients are produced in the power system. They
are arcing between the contacts of the switches, sudden switching on heavy or reactive
equipments such as motors, transformers, motor drives, poor or loose connections and
lightening strokes.
The consequence of transient power quality problem electronics devices are show wrong
results, motors run with higher temperature, and gradually reduce the efficiency and
lifetime of equipment.
2.1.5. Short Duration Voltage Variation
If the duration for which the interruption occurs is of few milliseconds, then it is called
as short interruption. Most of the time causes of these interruptions are opening of an
automatic re-closure and lightening stroke or insulation flashover. The consequences are
the data storage system may be affected and there may be malfunction of sensitive
devices like PLC’s and ASD’s
2.1.6. Long Duration Voltage Variation
If the duration for which the interruption occur is large ranging from few milliseconds
to several seconds then it is noticed long interruption. The voltage signal during this
type of interruption is shown in figure 2.1.
The causes of these interruptions are faults in power system network and improper
functioning of protective equipment. The consequence of this type of interruption leads to
Page 35
POWER QUALITY PROBLEMS IN INDUSTRIAL ENTERPRISES AND THEIR MITIGATION TECHNIQUES
MSc. Thesis By Firew Tsegaye/Power System Engineering/BIT/BDU Page 16
the stoppage of power completely for a period until the fault is cleared.
Figure 2.1 Voltage signal with long interruption [18]
2.1.7. Voltage Sage
It is a short duration disturbance. During voltage sag, RMS voltage falls to a very low
level for short period of time. It is a reduction in RMS voltage over a range of 0.1–0.9 pu
for duration greater than 10ms but less than 1s, or can be define on the following way.
It is as the dip in the voltage level by 10% to 90% for a period of half cycle or more. The
voltage signal with voltage sag is shown in figure 2.2.
The causes of voltage sags are starting of an electric motor, which draws more current,
faults in the power system and sudden increase in the load connected to the system.
The main consequences this type of disturbance are failure of contactors and switchgear
and malfunction of Adjustable Speed Drives (ASD’s) [18].
Figure 2.2 Voltage sag
Page 36
POWER QUALITY PROBLEMS IN INDUSTRIAL ENTERPRISES AND THEIR MITIGATION TECHNIQUES
MSc. Thesis By Firew Tsegaye/Power System Engineering/BIT/BDU Page 17
2.1.7.1. Multi phase sags and single phase sags
Based on the number of phase voltage sags are divided in to three types, they are briefly
discussed below:
1. Single phase sags
The most common voltage sags, over 70%, are single phase events which are typically
due to a phase to ground fault occurring somewhere on the system. This phase to ground
fault appears as single phase voltage sag on other feeders from the same substation.
Typical causes are lightning strikes, tree branches, and animal contacted. It is not
uncommon to see single phase voltage sag up to 30% of nominal voltage or even lower in
industrial plants.
2. Phase to phase sags
Two Phase, phase to phase sags may be caused by tree branches, adverse weather,
animals or vehicle collision with utility poles. The two phase voltage sag will typically
appear on other feeders from the same substation.
3. Three phase sags
Symmetrical three phase sags account for less than 20% of all sag events and are caused
either by switching or tripping of a three phase circuit breaker, switch or re-closer which
will create three phase voltage sag on other lines fed from the same substation. Three
phase sags will also be caused by starting large motors but this type of event typically
causes voltage sags to approximately 80% of nominal voltage and is usually confined to
an industrial plant or its immediate neighbor. As well as sudden change load current
switching of large capacitor banks and lightning the cause of occur voltage sags [19].
2.1.8. Voltage swell
Voltage swell is defined as the rise in the voltage beyond the normal value by 10% to
90% for a period of half cycle or more. The voltage signal with swell is shown in figure
2.3.
The main causes of de-energization of large load and abrupt interruption of current. The
consequences of this type of power quality problem are electronic parts get damaged
due to over voltage, insulation breakdown and Overheating.
Page 37
POWER QUALITY PROBLEMS IN INDUSTRIAL ENTERPRISES AND THEIR MITIGATION TECHNIQUES
MSc. Thesis By Firew Tsegaye/Power System Engineering/BIT/BDU Page 18
Figure 2.3 Voltage swell [18]
2.1.9. Voltage unbalance
The unbalance in the voltage is defined as the situation where the magnitudes and phase
angles between the voltage signals of different phases are not equal.
The cause of voltage unbalance is presence of large single-phase loads and faults arising
in the system. The consequences are presence of harmonics, reduced efficiency of the
system, increased power losses and reduce the life time of the equipment.
2.1.10. Voltage fluctuation
These are a series of a random voltage changes that exist within the specified voltage
ranges. Figure 2.4 shows the voltage fluctuations that occur in a power system.
These are caused by the frequency starts/stops of electric ballasts, oscillating loads and
electric arc furnaces. Flickering of lights and unsteadiness in the visuals are the main
consequences of voltage fluctuation.
Figure 2.4 Voltage fluctuations [18]
Page 38
POWER QUALITY PROBLEMS IN INDUSTRIAL ENTERPRISES AND THEIR MITIGATION TECHNIQUES
MSc. Thesis By Firew Tsegaye/Power System Engineering/BIT/BDU Page 19
2.1.11. Flicker
Flicker is commonly variation of system frequency. The voltage variations resulting from
flicker are often within the normal service voltage range, but the changes are sufficiently
rapid to be affecting certain end users. Flicker can be separated in to two types: cyclic and
non-cyclic. Cyclic flicker is a result of periodic voltage fluctuations on the system, while
non-cyclic is a result of occasional voltage fluctuations.
The usual method for expressing flicker is like that of percent voltage modulation. It is
usually expressed as a percent of the total change in voltage with respect to the average
voltage over a certain period of time. The figure 2.5 shows a typical flicker waveform
[20].
Figure 2.5 Flicker waveform
2.1.12. Harmonics
Harmonics are sinusoidal voltages or current shaping frequencies that are integer
multiples of the frequency at which the supply system is designed to operate (termed the
fundamental frequency; usually 50 or 60Hz). Periodically distorted wave forms can be
decomposed in to a sum of the fundamental frequency and the harmonics. Harmonic
distortion originates due to the non linear characteristics of devices and loads on the
power system. Harmonics are classified as integer harmonics, sub harmonics and inter
harmonics. Integer harmonics have frequencies which are integer multiple of
fundamental frequency, sub harmonics have frequencies which are smaller than
fundamental frequency and inter harmonics have frequencies which are greater than
fundamental frequencies. Sometimes harmonics are classified as time harmonics and
special (space) harmonics. Monitoring of harmonics with respect to fundamental is
important consideration in power system application [20].
Page 39
POWER QUALITY PROBLEMS IN INDUSTRIAL ENTERPRISES AND THEIR MITIGATION TECHNIQUES
MSc. Thesis By Firew Tsegaye/Power System Engineering/BIT/BDU Page 20
Further Harmonics refers to both current and voltage harmonics. Harmonic voltages
occur as a result of current harmonics, which are created by non linear electronic loads.
These nonlinear loads will draw a distorted current waveform from the supply system.
Loads like electric arc furnaces, discharge lighting (such as fluorescent lamps), magnetic
cores, such as transformer and rotating machines that require third harmonic current to
excite the iron, adjustable speed drives used in fans, blowers, pumps, and process drives
can cause harmonic distortion. The effect of harmonics in the power system includes the
corruption and loss of data, overheating or damage to sensitive equipment and
overloading of capacitor banks. The high frequency harmonics may also cause
interference to nearby telecommunication system.
Using the Fourier series expansion, we can represent a distorted periodic wave shape by
its fundamental and harmonics [10].
𝑢(𝑡) = 𝑈𝑑𝑐 + ∑(𝑈(𝑛)𝑠 𝑠𝑖𝑛 (𝑛𝑤𝑡) + 𝑈(𝑛)𝑐cos (𝑛𝑤𝑡))
𝑛=1
(2.1)
The coefficients are obtained as follows:
𝑈(𝑛)𝑠 =1
𝜋∫ 𝑢(𝑡)
2𝜋
0
sin(𝑛𝑤𝑡) 𝑑𝑤𝑡 (2.2)
𝑈(𝑛)𝑐 =1
𝜋∫ 𝑢(𝑡)
2𝜋
0
cos(𝑛𝑤𝑡)𝑑𝑤𝑡 (2.3)
Where n is an integer and 𝑤 =2𝜋
𝑇.
T is the fundamental period time.
It is also common to use a single quantity, the Total Harmonic Distortion (THD), as a
measure of the effective value of harmonic distortion. Mathematically, THD values of
voltage and current, THDV and THDI, respectively, are given as follows:
𝑇𝐻𝐷𝑉 =√∑ 𝑉(𝑛)
2𝑛=2
𝑉(1)𝑥100 (2.4)
𝑇𝐻𝐷𝐼 =
√∑ 𝐼(𝑛)2
𝑛=2
𝐼(1)𝑥100 (2.5)
Page 40
POWER QUALITY PROBLEMS IN INDUSTRIAL ENTERPRISES AND THEIR MITIGATION TECHNIQUES
MSc. Thesis By Firew Tsegaye/Power System Engineering/BIT/BDU Page 21
IEEE Standard 519-1992 defines by another term, the Total Demand Distortion (TDD).
The main difference of TDD from THD is the distortion is expressed as a percent of some
rated load current rather than as a percent of the fundamental current magnitude at the
instant of measurement [21].
𝑇𝐷𝐷 =√∑ 𝐼ℎ
2ℎ=2
𝐼𝐿𝑥100 (2.6)
Where, Ih is the harmonic currents
IL is the rated load-current
2.1.13. Electrical line noise
Electrical line noises are radio frequency interference and electromagnetic interferences
(RFI and EMI). They cause unwanted effects in computer systems. These interferences
can be caused by motor control devices, broadcast transmissions, microwave radiation,
and electrical storms. RFI and EMI can cause equipment lock-up, or data error or loss
[22].
2.2. Voltage disturbance IEEE standard
On this section try discus the relation between IEEE standards with voltage sag power
quality disturbance level. Standards associated with voltage sags are intended to be used
as reference documents describing single components and systems in a power system.
Both the manufacturers and the buyers use these standards to meet better power quality
requirements. Manufactures develop products meeting requirements of a standard, and
buyers demand from the manufactures that the product comply with the standard.
The most common standards dealing with power quality are the ones issued by IEEE,
IEC, CBEMA, and SEMI. For this thesis, IEEE standard was used.
IEEE1159-1995, “IEEE recommended practice for monitoring electric power quality”
The purpose of this standard is to describe how to interpret and monitor electromagnetic
phenomena properly. It provides unique definitions for each type of disturbance.
IEEE 1250-1995, “IEEE guide for service to equipment sensitive to momentary voltage
disturbances”
Page 41
POWER QUALITY PROBLEMS IN INDUSTRIAL ENTERPRISES AND THEIR MITIGATION TECHNIQUES
MSc. Thesis By Firew Tsegaye/Power System Engineering/BIT/BDU Page 22
This standard describes the effect of voltage sags on computers and sensitive equipment
using solid-state power conversion. The primary purpose is to help identify potential
problems. It also aims to suggest methods for voltage sag sensitive devices to operate
safely during disturbances. It tries to categorize the voltage-related problems that can be
fixed by the utility and those which have to be addressed by the user or equipment
designer.
The second goal is to help designers o f equipment to better understand the environment
in which their device swills operate [23].
Table 2.1 Definition of voltage disturbance
IEEE standards for Harmonics distortions
On this section try discus the relation between IEEE Std 519-1992 standards with current
harmonic distortion level. Industries used harmonics standard, these standards have been
developed by IEEE industry applications society and the IEEE power engineering
society. This harmonic standard is IEEE Std 519-1992. This standard has been used
limits on the harmonic currents that a user can induce back into the utility power system
and also specifies the quality of the voltage that the utility should supply the user.
Table below shows the harmonic current limits based on the size of the load with respect
to the size of the power to which is connected. The ratio Isc/IL is the ratio of the short-
Page 42
POWER QUALITY PROBLEMS IN INDUSTRIAL ENTERPRISES AND THEIR MITIGATION TECHNIQUES
MSc. Thesis By Firew Tsegaye/Power System Engineering/BIT/BDU Page 23
circuit current available at the point of common coupling to the maximum fundamental
load current.
Table 2.2 IEEE 519-1992 Current harmonics limits (69kV) [24]
Isc/IL h11 11h17 17h23 23h35 35h THD
20 4.0 2.0 1.5 0.6 0.3 5.0
2050 7.0 3.5 2.5 1.0 0.5 8.0
50100 10.0 4.5 4.0 1.5 0.7 12.0
1001000 12.0 5.5 5.0 2.0 1.0 15.0
1000 15.0 7.0 6.0 2.5 1.4 20.0
Table 2.3 IEEE 519-1992 Current harmonics limits (69-169kV) [25]
Isc/IL h11 11h17 17h23 23h35 35h THD
20 2.0 1.0 0.75 0.3 0.15 2.5
2050 3.5 1.75 1.25 0.5 0.25 4.0
50100 5.0 2.25 2.0 0.75 0.35 6.0
1001000 6.0 2.75 2.5 1.0 0.5 7.5
1000 7.5 3.5 3.0 1.25 0.7 10.0
Table 2.4 IEEE 519-1992 Current harmonics limits (161kV) [26]
Isc/IL h11 11h17 17h23 23h35 35h THD
50 2.0 1.0 0.75 0.3 0.15 2.5
50 3.0 1.5 1.15 0.45 0.22 3.75
Table 2.5 IEEE 519-1992 voltage harmonics limits [26]
Bus Voltage at PCC Individual Voltage
Distortion (%)
Total Voltage Distortion
THD (%)
Below 69 kV 3.0 5.0
69 kV to 161 kV 1.5 2.5
161 kV and above 1.0 1.5
Page 43
POWER QUALITY PROBLEMS IN INDUSTRIAL ENTERPRISES AND THEIR MITIGATION TECHNIQUES
MSc. Thesis By Firew Tsegaye/Power System Engineering/BIT/BDU Page 24
2.3. Dynamic Voltage Restorer (DVR) and Active Power Filter (APF)
2.3.1. Theoretical background of FACTS devices
In recent year, high power semiconductor device has stimulated the development a new
application in power system is known as Flexible AC Transmission Systems (FACTS).
FACTS are power electronic devices used to control and improve power quality. These
FACTS devices based on connection can be divided in to four [27] [28], they are:
1) Series Controller - Some examples of the series FACTS devices are Thyristor
Switched Series Capacitor (TSSC), Thyristor-Controlled Series Capacitor (TCSC),
Thyristor-Switched Series Reactor (TSSR), Static Synchronous Series Compensator
(SSSC) and Dynamic Voltage Restorer (DVR).
2) Shunt Controller- Some examples of the shunt connected FACTS devices are Static
VAR Compensator (SVC), Static Synchronous Generator (SSG), Thyristor-
Controller Reactor (TCR), Thyristor- Switched Capacitor (TSC) and the Static
Synchronous Compensator (STATCOM).
3) Combined series/series Controller- This configuration provides autonomous series
reactive power compensation for each line but also transfers real power among the
lines via power link. The presence of power link between series controllers names
this configuration as “Unified Series-Series Controller”.
4) Combined series/shunt Controller- Some example of series/shunt connected
FACTS devices is Unified Power Flow Controller (UPFC), and Unified Power
Quality Conditioner (UPQC).
Further this FACTS devices have own advantage and drawback, for instance,
STATCOM is an advanced type of SVC (Static Var Compensator), the
application area of STATCOM is in transmission network. Transmission network
is fast regulation of voltage at a load or an intermediate bus. But this FACTS
dives only use for transmission system.
D-statcom (Distribution static compensator) is the other FACTS dives, it located
at load side in the distribution system, which can to eliminating or overcome the
Page 44
POWER QUALITY PROBLEMS IN INDUSTRIAL ENTERPRISES AND THEIR MITIGATION TECHNIQUES
MSc. Thesis By Firew Tsegaye/Power System Engineering/BIT/BDU Page 25
problems of source side like voltage sag and interruption etc. Computing from
others the drawback of this devices high cost and complexes to operate.
Another FACTS devise is UPQC, it is the integration of series-active and shunt-
active power filters to mitigate any type of voltage and current fluctuations and
power factor correction in a power distribution network. The complexity and
costly is the drawback of this devices.
Based on the above points selected DVR because, it is smaller size, simple to
design, fast dynamic response to the disturbance, and cost effective solution for
the protection of sensitive loads from voltage sags and swells.
2.3.2. Dynamic Voltage Restorer (DVR)
The Dynamic Voltage Restorer (DVR) is a custom power device that is installed in a
distribution system between the supply and the critical load. It is used in power
distribution networks to mitigate voltage disturbances in the power system; it also
compensates for line voltage harmonics and reduces transients in voltage and fault
current. The main components of the DVR consist of Series injection transformer,
Harmonic filter, storage devices, voltage source inverter, DC charging unit and Control
system.
Below Figure shows a simplified system of the DVR. On the supply side, the DVR
injects a compensating voltage(𝑉𝐷𝑉𝑅)through the series injection transformer when there
is a voltage dip detected. This allows the critical load to receive an uninterrupted and
balanced voltage.
Page 45
POWER QUALITY PROBLEMS IN INDUSTRIAL ENTERPRISES AND THEIR MITIGATION TECHNIQUES
MSc. Thesis By Firew Tsegaye/Power System Engineering/BIT/BDU Page 26
DVR
Voltage
Sensitive
Load
Figure 2.6 DVR voltage waveforms
Impedance Impedance
Filter
Control
System
Load
VDVR
Vs VLSupply
VSI
Figure 2.7 Schematic diagram of DVR
2.3.2.1. Series injection transformer/booster transformer [29]
The Injection/Booster transformer is one of the main components of DVR. It is
connecting the DVR to the distribution network via the HV-winding transforms and
couples the injected compensating voltages generated by the voltage source converters to
the incoming supply voltage.
In addition, the Injection/Booster transformer serves the purpose of isolating the load
from the system (VSI and control mechanism).
Page 46
POWER QUALITY PROBLEMS IN INDUSTRIAL ENTERPRISES AND THEIR MITIGATION TECHNIQUES
MSc. Thesis By Firew Tsegaye/Power System Engineering/BIT/BDU Page 27
There are two types of connections in the three-phase system - a single three-phase
transformer connects in series to the supply, or three single-phase transformers connect to
each supply phase. This method can limit the coupling noise from the primary side to the
secondary side. The injection transformer in the DVR system connects the system to the
supply and the load, and injects the compensating voltages generated by the voltage
source inverters. It also separates the load from the power filters and the control
mechanisms.
2.3.2.2. Harmonic filter
The harmonic filter limits the harmonics generated by the VSI and can be placed in the
high or low voltage side ending of the transformer. It is usually connected on the
secondary winding side of the injection transformer because it will prevent harmonics
entering the load supply.
2.3.2.3. Voltage source inverter
The voltage source inverter is power electronics includes a storage device and switching
devices that can generate a sinusoidal voltage at any required frequency, magnitude, and
Phase Angle. The VSI supplies voltage to the load in replacement of the mains supply.
There are four main types of switching devices: Metal Oxide Semiconductor Field Effect
Transistors (MOSFET), Gate Commutated Thysistors (GTO), Insulated Gate Bio-polar
Transistor (IGBT), and Insulated Gate Commutated Thysistors (IGCT). Each type has its
own benefits and drawbacks. For this thesis used IGBT.
These voltage source inverters are widely used in low and high power applications such
as motor drives, UPS and bi-directional AC-DC converters.
In the voltage source inverter, the values of output voltage variations are relatively low
due to capacitor but it is difficult to limit current because of capacitor. The inverters are
then connected in series to the distribution line through a set of three single-phase
injection transformers. The most common voltage source inverter type is three-phase
bridge inverters, below in figure 2.8, show three-phase bridge inverters [29].
Page 47
POWER QUALITY PROBLEMS IN INDUSTRIAL ENTERPRISES AND THEIR MITIGATION TECHNIQUES
MSc. Thesis By Firew Tsegaye/Power System Engineering/BIT/BDU Page 28
Figure 2.8 Basic three-phase inverter
2.3.2.4. Storage devices
The purpose of storage devices is to supply the necessary energy to the VSI via a dc link
for the generation of injected voltage. The different kinds of energy storage devices are
Super Conductive Magnetic Energy Storage (SCMES), batteries and capacitance.
The DC charging circuit is used after sag compensation event the energy source is
charged again through dc charging unit. It is also used to maintain dc link voltage at the
nominal dc link voltage.
2.3.2.5. Control systems
The DVR’s control system has three main functions: to detect variation in the supply
voltage; to make a compare is on between the supply voltage and a predetermined
reference voltage; and to generate switching pulses which drive the VSI, which in turn
generates the DVR output voltage, correction of any anomalies in the series voltage
injection and terminate of the trigger pulses when the event has passed.
2.3.3. Compensation strategies of DVR
The compensation control technique of DVR is the mechanism used to track supply
voltage and synchronized that with pre-sag supply voltage during a voltage sag/swell in
the upstream of distribution line. Generally, voltage sags are associated with a phase
angle jump in addition to the magnitude change. The control technique adopted depends
on the sensitivity of the load to the magnitude, phase shift or wave shape of the voltage
waveform. Further, when deciding a suitable control technique for a particular load it
Page 48
POWER QUALITY PROBLEMS IN INDUSTRIAL ENTERPRISES AND THEIR MITIGATION TECHNIQUES
MSc. Thesis By Firew Tsegaye/Power System Engineering/BIT/BDU Page 29
should be considered the limitations of the voltage injection capability (i.e. the rating of
the inverter and the transformer) and the size of the energy storage device.
When the system is in its normal condition, the supply voltage (Vs) is identified as pre-
sag voltage and denoted by 𝑉𝑝𝑟𝑒_𝑆𝑎𝑔. In such situation, since the DVR is not injecting any
voltage to the system, the load voltage(𝑉𝑙𝑜𝑎𝑑) and supply voltage (Vs) will be the same.
During voltage sag, the magnitude and the phase angle of the supply voltage can be
changed and it is denoted by 𝑉𝑆𝑎𝑔. The DVR is inoperative in this case and the voltage
injected will be𝑉𝑑𝑣𝑟. If the voltage sag is fully compensated by the DVR, the load voltage
during the voltage sag will be 𝑉𝑝𝑟𝑒_𝑆𝑎𝑔. Several control techniques have been proposed
for compensation.
2.3.3.1. Pre-sag compensation
This technique compensates the difference between the sagged and the pre-sag voltages
by restoring the instantaneous voltages to the same phase and magnitude as the nominal
pre sag voltage, so this technique is recommended for the non-linear loads such as
thyristor-controlled loads which use the supply voltage and its phase angle as a set point
are sensitive to phase jumps. This technique needs a higher rated energy storage device
and voltage injection transformers because there is no control on injected active power.
Fig 2.9 shows the vector diagram for the pre-fault control strategy for a voltage sag event.
This method is best suited to loads sensitive to phase angle jumps as it compensates for
both the magnitude and phase angle. In this diagram,𝑉𝑝𝑟𝑒_𝑆𝑎𝑔 and 𝑉𝑆𝑎𝑔 are voltage at the
point of common coupling (PCC), respectively before and during the sag. In this case
VDVR is the voltage injected by the DVR, which can be obtained as [2].
𝐕𝐃𝐕𝐑 = √(𝐕𝐩𝐫𝐞−𝐬𝐚𝐠𝟐 + 𝐕𝐒𝐚𝐠
𝟐 − 𝟐𝐕𝐩𝐫𝐞−𝐬𝐚𝐠𝐕𝐒𝐚𝐠𝐜𝐨𝐬𝛅) (𝟐. 𝟕)
And the required angle of injection θDVR is calculated as:
Page 49
POWER QUALITY PROBLEMS IN INDUSTRIAL ENTERPRISES AND THEIR MITIGATION TECHNIQUES
MSc. Thesis By Firew Tsegaye/Power System Engineering/BIT/BDU Page 30
𝜃𝐷𝑉𝑅 = 𝑡𝑎𝑛−1 𝑉𝑆𝑎𝑔𝑠𝑖𝑛 𝜃
𝑉𝑆𝑎𝑔𝑐𝑜𝑠𝜃−𝑉𝑝𝑟𝑒−𝑠𝑎𝑔 (2.8)
Figure 2.9 Vector diagram for pre-sag compensation technique
2.3.3.2. In-phase compensation
In this technique the compensated voltage is in-phase with the sagged voltage and only
compensating for the voltage magnitude. Therefore this technique minimizes the voltage
injected by the DVR. Hence it is recommended for the linear loads, which need not to be
compensated for the phase angle.
As shown in fig 2.10, the phase angles of the pre-sag and load voltage are different but
the most important criteria for power quality that is the constant magnitude of load
voltage is satisfied.
𝑉𝐷𝑉𝑅 = 𝑉𝑝𝑟𝑒−𝑠𝑎𝑔 − 𝑉𝑠𝑎𝑔 (2.9)
Figure 2.10 Vector diagram for in-phase compensation technique
It should be noted that the techniques mentioned in figure 2.9 and figure 2.10 need both
the real and reactive power for the compensation and the DVR is supported by an energy
storage device.
Page 50
POWER QUALITY PROBLEMS IN INDUSTRIAL ENTERPRISES AND THEIR MITIGATION TECHNIQUES
MSc. Thesis By Firew Tsegaye/Power System Engineering/BIT/BDU Page 31
2.3.3.3. Combining both pre-sag and in-phase compensation method
It is even possible to combine different compensation techniques described earlier, to
achieve better efficiency and ease of controllability. One such technique is combining
both the pre-sag and in-phase compensation method. In the combined technique the
system initially restores the load voltage to the same phase and magnitude of the nominal
pre-sag voltage (pre-sag compensation) and then gradually changes the injected voltage
towards the sag voltage phase. Ultimately the compensated voltage is in same magnitude
and phase angle with the pre-sag voltage and slowly its phase angle transferred to the
sagged voltage.
Figure 2.11 gives an idea about the compensation control strategy, when both pre-sag and
in-phase compensation techniques are combined. It is clear from the Figure when the
DVR injected voltage is Vdvr1 (at the beginning of the compensation) the system used pre-
sag compensation, and slowly the injected voltage phasor is moved towards Vdvr4 (in-
phase compensation).
Figure 2.11 Combining both pre-sag and in-phase compensation techniques
Characteristics of harmonics
Current distortion is generated by electronic loads or non-linear loads. This non-linear
load might be single phase or three-phase. The electronic loads generate positive and
negative sequence as well as zero sequence harmonic currents. The Fourier series
represents an effective way to study and analyze the harmonic distortion [30]. Below
briefly discussed the characteristics of harmonics.
Page 51
POWER QUALITY PROBLEMS IN INDUSTRIAL ENTERPRISES AND THEIR MITIGATION TECHNIQUES
MSc. Thesis By Firew Tsegaye/Power System Engineering/BIT/BDU Page 32
𝑓(𝑡) = 𝑎0 + ∑[𝑎ℎ cos(ℎ𝑤𝑡) + 𝑏ℎ sin(ℎ𝑤𝑡)]
∞
ℎ=1
= 𝑎0 + ∑ 𝑐ℎ sin(ℎ𝑤𝑡) + 𝜓ℎ
∞
ℎ=1
Where, 𝑓(𝑡)= Periodic function of frequency 𝑓
𝜔 = 2𝜋𝑓- Angular frequency period
𝑇 = 1𝑓⁄ = 2𝜋
𝜔⁄ - Time period
𝑐ℎ−ℎ𝑡ℎHarmonic amplitude
ℎ𝑓 - Harmonic frequency and 𝜓ℎ- Harmonic phase
The Fourier series coefficients are given by
𝑎0 =1
𝑇∫ 𝑓(𝑡)𝑑𝑡 =
1
2𝜋∫ 𝑓(𝑡)𝑑𝑥 (2.10)
2𝜋
0
𝑇
0
𝑤ℎ𝑒𝑟𝑒 𝑥 = 𝜔𝑡
𝑎ℎ =2
𝑇∫ 𝑓(𝑡) cos(ℎ𝑤𝑡) 𝑑𝑡 =
1
𝜋∫ 𝑓(𝑡) cos(ℎ𝑥)𝑑𝑥
2𝜋
0
𝑇
0
𝑏ℎ =2
𝑇∫ 𝑓(𝑡) sin(ℎ𝑤𝑡) 𝑑𝑡 =
1
𝜋∫ 𝑓(𝑡) sin(ℎ𝑥)𝑑𝑥
2𝜋
0
𝑇
0
𝑐ℎ = √𝑎ℎ2 + 𝑏ℎ
2And 𝜓ℎ = tan−1 (𝑎ℎ
𝑏ℎ)
The distortion period of current or voltage waveform expand into a Fourier series is
expressed as follows [31].
𝐼(𝑡) = ∑ 𝐼ℎ cos(ℎ𝑤𝑡 + 𝜑ℎ)
∞
ℎ=1
𝑉(𝑡) = ∑ 𝑉ℎ sin(ℎ𝑤𝑡 + 𝜃ℎ)
∞
ℎ=1
= 𝑎0 + ∑ 𝑉ℎ. sin(ℎ. 2. 𝜋. 𝑓. 𝑡. +𝜃ℎ) (2.11)
∞
ℎ=1
Where,
𝐼ℎ − ℎ𝑡ℎ Harmonic peak current, 𝜑ℎ is the ℎ𝑡ℎharmonic current phase
𝑉ℎ − ℎ𝑡ℎ Harmonic peak voltage, 𝜃ℎis the ℎ𝑡ℎ harmonic voltage phase
𝜔- Angular frequency, 𝜔 = 2𝜋𝑓, 𝑓-is the fundamental frequency
𝑎0: Dc component and 𝑉ℎ: Peak voltage level
𝑓: Fundamental frequency and 𝜃ℎ: Phase angle
Page 52
POWER QUALITY PROBLEMS IN INDUSTRIAL ENTERPRISES AND THEIR MITIGATION TECHNIQUES
MSc. Thesis By Firew Tsegaye/Power System Engineering/BIT/BDU Page 33
2.4. Harmonics Distortion
A pure poly-phase system is expected to have pure sinusoidal alternating current and
voltages wave forms of single frequency. But, the real situation deviates from this purity.
Real voltage and current wave forms are distorted. Normally they are called non
sinusoidal wave forms. Non sinusoidal wave form is formed with the combination of
many sine waves of different frequencies. Thus actual power system signals have
fundamental component as well as harmonic components, before proceeding to concept
of fundamental and harmonic components understand harmonic distortion in non linear
load.
A nonlinear device is one in which the current is not proportional to the applied voltage.
When a wave form is identical from one cycle to the next, it can be represented as a sum
of pure sine waves in which the frequency of each sinusoid is an integer multiple of the
fundamental frequency of the distorted wave. This multiple is called a harmonic of the
fundamental.
Furthers harmonics are defined sinusoidal voltages or currents having frequencies that are
whole multiples of the frequency at which the supply system is designed to operate (50
Hz or 60 Hz). Figure below shows that any periodic distorted waveform can be expressed
as a sum of pure sinusoids. The harmonic number (h) usually specifies a harmonic
component, which is the ratio of its frequency to the fundamental frequency [21].
Figure 2.12 Periodic distorted waveforms [32]
Page 53
POWER QUALITY PROBLEMS IN INDUSTRIAL ENTERPRISES AND THEIR MITIGATION TECHNIQUES
MSc. Thesis By Firew Tsegaye/Power System Engineering/BIT/BDU Page 34
Harmonics have frequencies that are integer multiples of the wave form fundamental
frequency. For example, given a 50Hz fundamental waveform, the 2nd, 3rd, 4th, 5th
harmonic components will be at 100Hz, 150Hz, 200Hz and 250Hz respectively thus,
harmonic distortion is the degree to which a wave form deviates from its pure sinusoidal
values as a result of the summation of all these harmonic elements [32].
2.4.1. Total Harmonic Distortion (THD)
Total Harmonic Distortion (THD) defined as the ratio of the sum of the powers of all
harmonic components to the power of the fundamental frequency [32].
𝑇𝐻𝐷𝑖 = √∑ 𝐼𝑛
2
𝐼1𝑥100% (𝑛 = 2,3,4,5… . .) (2.12)
Where
I1 is the fundamental component of the current
In is the total harmonic component of the current
2.4.2. Sources of Harmonics
There are many sources of harmonics in electrical power system; they can be
categorized as follow:
1. Magnetization nonlinearities of transformer
Transformers magnetic material characteristic is non-linear. This nonlinearity is the
main reason for harmonics during excitation.
Sources of harmonics in transformer maybe classified into four categories they are
normal excitation, symmetrical over excitation, inrush current harmonics and DC
magnetization.
2. Rotating machines
The other source of harmonics is rotating machines. Some classifications are: magnetic
Nonlinearities of the core material cause’s harmonic generation, non-uniform flux
distribution in the air gap leads to harmonic production, and cogging is a problem when
motor fails to start produces harmonics different from those in the normal condition.
3. Arcing devices
Electric Arc Furnace, discharge type lighting, arc welders have highly non-linear voltage
and current characteristics. Arc ignitions are equivalent to a short- circuit with a decrease
in voltage. Hence they are a major source of power system harmonics.
Page 54
POWER QUALITY PROBLEMS IN INDUSTRIAL ENTERPRISES AND THEIR MITIGATION TECHNIQUES
MSc. Thesis By Firew Tsegaye/Power System Engineering/BIT/BDU Page 35
4. Power supplies with semiconductor devices
Harmonics generated by such supplies include integer, inter and sub harmonics whose
magnitudes and frequencies depend up on the type of semiconductor devices used,
operating point, nature of load variation, etc.
5. Thyristor controlled reactors
Different types of thyristor controlled reactors used in power system like series
controller, shunt controller, static VAR compensator (SVC), fixed capacitor thyristor
controlled reactor (FCTCR), thyristors witched capacitor thyristor controlled reactor
(TSCTCR) are sources of harmonics in power system.
6. Phase controllers & AC regulators
Phase Controller for the supply of balanced electric power and AC voltage regulators
when applied both online and offline for voltage regulation will result in harmonic
generation.
2.4.3. Effects of Harmonics
Harmonics are not desirable in most applications and operations of electrical power
system; therefore it has wide adverse effects on the system. The effects of harmonics
maybe classified as:
Resonance and effect on capacitor banks
Resonance occurs when the frequency at which the capacitive and inductive reactance of
the circuit impedance are equal. At the resonant frequency, a parallel resonance has high
impedance and series resonance low impedance. Harmonic resonances create problems
in operation of power factor correction capacitors.
Effects of harmonics on rotating machine, transformer and transmission
Harmonic voltages and currents increase losses in the stator windings, rotor circuit, and
stator and rotor lamination; resulting in overheating and efficiency reduction. On
transformer, harmonic voltage increases the core losses in lamination stresses the
insulation, while harmonic current increase copper losses. On transmission, harmonics
tend to increase skin and proximity effects since both are frequency dependent.
Harmonic currents reduce the power transmitting capacity by increasing copper losses
and produce harmonic voltage drops across various circuit impedances. Harmonic
voltages reduce dielectric strength of cables by causing an increase in dielectric losses.
Page 55
POWER QUALITY PROBLEMS IN INDUSTRIAL ENTERPRISES AND THEIR MITIGATION TECHNIQUES
MSc. Thesis By Firew Tsegaye/Power System Engineering/BIT/BDU Page 36
Effects of harmonics on consumer equipment
Considering to the study of IEEE task force on the effects of harmonics on equipment the
following consumer equipments are effects by harmonic distortion, like television
receivers and fluorescent and mercury arc lighting [20].
2.4.4. Types of Harmonic filter
The harmonic mitigation techniques are mainly line conditioning techniques. These
techniques are mainly used for the improvement of performance of the system. The main
objectives are to improve the power factor, reduction of harmonics and reactive power
compensation.
The harmonic filter is connected either in series or parallel to the load. This filter
produces voltage or current to induce in to the line which filters out the harmonics.
The different filters which are available are divided into three types. They are passive
filters, active filters and hybrid filters. Each type of filter is again classified into different
types based on the configuration and operation.
1. Passive Filters
It is series or parallel combination of passive elements such as resistors, reactors and
capacitors. They provide a low resistive path for the harmonic current to flow by
resonate in gat that particular harmonic frequency. The passive filters are generally
connected in parallel to the load for current harmonic elimination. The similarity
configure and construct and low initial & maintenance cost (compared to APF) is the
advantage of passive filter. The drawbacks are property and characteristics of filter
depend on source impedance (i.e. impedance of the system and its topology) which is
subjected to variations due to external condition and it basically able to remove some
particular harmonic components through tuning whenever the magnitude of those
harmonic components is constant and power factor of the system is low.
Further this Passive filter is again divided into two types, Low Pass Filter and High Pass
Filter.
Low pass filter: is an LCR circuit (a capacitor, a resistor and inductor are connected in
series). Low pass filter also known as single-tuned notch filter [33]. These are also used
to provide reactive power factor improvement. The low pass filter is shown in the Fig.
2.13(a).
Page 56
POWER QUALITY PROBLEMS IN INDUSTRIAL ENTERPRISES AND THEIR MITIGATION TECHNIQUES
MSc. Thesis By Firew Tsegaye/Power System Engineering/BIT/BDU Page 37
C
R
C
R
Ground
L
Ground
L
Figure 2.13 (a) Low pass filter (b) High pass filter
High pass filter: it is also the combination of passive elements but the connection is
different from LPF. It provides a low impedance path to all the harmonic currents above
a certain frequency. The high pass filter is shown in the fig.2.13 (b).
1. Active Filters
An active filter consists of serial/parallel array of arrangement of both active and passive
components. Active filter has dynamic response and thus can remove current distortion.
It is faster than passive filter. It can also be used for reactive power compensation.
Operation of Active Filters
Active Filter generate compensating current signal by continuously monitoring the load
current with the help of some process such as p-q theory, d-q transform, sliding mode
control, DSP based algorithm etc. Now the generated compensating current is used to
generate the switching pulse and switching sequence of IGBT inverter with the help of
hysteresis controller. The inverter then generates the required harmonic current for the
load through charging and discharging of DC link capacitor and injected into the system
through coupling transformer with a phase difference to compensate the reactive power
coming from the AC mains [34].
APF
None linear
Load
Figure 2.14 Active filter
Page 57
POWER QUALITY PROBLEMS IN INDUSTRIAL ENTERPRISES AND THEIR MITIGATION TECHNIQUES
MSc. Thesis By Firew Tsegaye/Power System Engineering/BIT/BDU Page 38
Further active filters are divided into three: series active filter, shunt active filter and
hybrid active filter.
Series active filters: they are connected in series with the line through a transformer. It
acts as a voltage source injecting voltage in series with the supply voltage. It is used to
compensate the power quality problems like voltage sag and voltage swell. It is also
operate mainly as a voltage regulator and as a harmonic isolator between the nonlinear
load and the utility source. Practically shunt active power filter are more effective and
cheaper compared to series active power filters because most of the nonlinear loads
produce current harmonics. Moreover series active power filter requires adequate
protection scheme [34].
C
Is
Vf
None-linear
Load
VSI
IL
Power
Supply
Figure 2.15 Series APF circuit diagram
Shunt Active filter: is a relatively new technology for eliminating harmonics which is
based on the power electronics devices. It consists of one or more power electronic
converters which utilize power semiconductor devices controlled by integrated circuits.
The use of active power filters to eliminate the harmonics before they enter a supply
system is the optimal method of dealing with the harmonics problem. APFs could be
connected either in series or in parallel to power systems; therefore, they can operate as
either voltage sources or current sources. Mostly APF use Voltage Source Inverter (VSI).
It is connected in parallel to the load. It is used to current harmonics mitigation, reactive
power compensation and power factor correction. The compensation principle for the
SAPF is that the VSI is controlled to inject the compensation currents into the system.
Page 58
POWER QUALITY PROBLEMS IN INDUSTRIAL ENTERPRISES AND THEIR MITIGATION TECHNIQUES
MSc. Thesis By Firew Tsegaye/Power System Engineering/BIT/BDU Page 39
The control is based on the reference currents calculated by control strategies
implemented. This is done by estimating the harmonics and the SAPF acts as a current
source injecting harmonics of same magnitude but phase shifted by 180o. The filter is
operated in such a way that the source supplies only the fundamental current and the filter
supplies the harmonic current to the system, it is also cancels the harmonic currents
produced by the non-linear load. The circuit diagram is shown in the fig.2.16.
Is
None-linear
Load
VSI
IL
IC
C
Power
Supply
Figure 2.16 Shunt active power filter circuit diagram
Unified Power Quality Conditioner: it is a combination of both shunt and series Active
Power Filter. It has the advantages of both series and shunt active filters. This filter can
be used to compensate different types of power quality problems faced in the power
system. The circuit diagram is shown in the fig.2.17.
C
Is
Vf
None-linear
Load
VSI
IL
IC
VSI
Power
Supply
Figure 2.17 UPQC circuit diagram
Page 59
POWER QUALITY PROBLEMS IN INDUSTRIAL ENTERPRISES AND THEIR MITIGATION TECHNIQUES
MSc. Thesis By Firew Tsegaye/Power System Engineering/BIT/BDU Page 40
CHAPTER THREE
3. POWER QUALITY PROBLEMS IN THE TEST SYSTEM SITE
AND PROPOSED MITIGATION METHOD
3.1. Mitigation of voltage sag using Dynamic Voltage Restorer
3.1.1. Equivalent circuit of DVR
The compensation of voltage sag can be limited by several factors, including finite DVR
power rating, loading conditions, power quality problems and types of sag/swell. If a
DVR is a successful device, the control can handle most sags/swells and the performance
must be maximized according to the equipment inserted. Otherwise, the DVR may not be
able to avoid tripping and even cause additional disturbances to the loads.
The circuit of DVR in figure below shows a mechanism to solve this problem. on
detection of any reduction in the supply voltage Vsource from any set value, the DVR
injects a voltage, VDVR, in series through the injection transformer such that the desired
load voltage, Vload can be maintained at the load end.
Load
VDVRZdvrZline
Vsource
Figure 3.1 Equivalent circuit of DVR [35]
As pre-sag compensation technique use, DVR injection voltage is written as in equation
(3.1).
𝑉𝐷𝑉𝑅 = 𝑉source − 𝑉𝑙𝑜𝑎𝑑 + 𝑍𝑙𝑖𝑛𝑒𝐼𝑙𝑜𝑎𝑑 (3.1)
Where Vload = Desired load voltage
Zline = Line impedance
Iload = Load current
Vsource = System voltage during any fault condition
VDVR = DVR injected voltage
Page 60
POWER QUALITY PROBLEMS IN INDUSTRIAL ENTERPRISES AND THEIR MITIGATION TECHNIQUES
MSc. Thesis By Firew Tsegaye/Power System Engineering/BIT/BDU Page 41
3.1.2. Mathematical modeling for voltage injection by DVR system
During normal condition means if the supply voltage is not sagged or swelled, then the
Vload equal to Vsource and the DVR injected voltage will be a very small quantity and (Zline
Iload) which is required to compensate for the line voltage drop. However, when voltage
sag occurs in the distribution system, the DVR control system calculates and synthesizes
the voltage required to preserve output voltage to the load by injecting a controlled
voltage with a certain magnitude, phase angle and frequency into the distribution system
to the critical load [6] [35].
RthjXth
VL
PL + jQL
Vth
DVR
VDVR
VSI
Energy
Storage
Zth
Figure 3.2 DVR voltage injection schematic diagram
Consider the schematic diagram shown in figure 4.2.
𝑍𝑡ℎ = 𝑅𝑡ℎ + 𝑋𝑡ℎ (3.2)
𝑉𝐷𝑉𝑅 + 𝑉𝑡ℎ = 𝑉𝐿 + 𝑍𝑡ℎ 𝐼L (3.3)
Where: 𝑉𝑡ℎ: The desired load voltage magnitude
𝑍𝑡ℎ: The load impedance
𝑉𝐿: The system voltage during fault condition
𝐼𝐿: The load current
When dropped voltage happened at VL, VDVR will inject a series voltage VDVR through the
injection transformer so that the desired voltage VL can be maintained. Hence
𝑉𝐷𝑉𝑅 = 𝑉𝐿 + 𝑍𝑡ℎ 𝐼L − 𝑉𝑡ℎ (3.4)
The load current𝐼𝐿 is given by,
Page 61
POWER QUALITY PROBLEMS IN INDUSTRIAL ENTERPRISES AND THEIR MITIGATION TECHNIQUES
MSc. Thesis By Firew Tsegaye/Power System Engineering/BIT/BDU Page 42
𝐼𝐿 = (𝑃𝐿 + 𝑗𝑄𝐿
𝑉𝐿) (3.5)
The equation can be rewritten as
𝑉𝐷𝑉𝑅 < 𝛼 = 𝑉𝐿 < 00 + 𝑍𝑡ℎ𝐼𝐿 < (𝛽 − 𝜃) − 𝑉𝑡ℎ < 𝛿 (3.6)
Here,𝛼, 𝛽 and 𝛿 are the angle of VDVR, 𝑍𝑡ℎ and 𝑉𝑡ℎ, respectively and θ is the load power
factor angle and is given by
𝜃 = tan−1 (𝑄𝐿
𝑃𝐿) (3.7)
Assuming the thevinin impedance is very less (𝑍𝑡ℎ ≪ 1) the voltage injected by the DVR
can be written as
𝑉𝐷𝑉𝑅 = 𝑉𝐿 − 𝑉𝑡ℎ = (1 − 𝐾)𝑉𝐿 (3.8)
Where 𝐾 indicates the ratio of source voltage to the load voltage
𝐾 =𝑉𝑡ℎ
𝑉𝐿 (3.9)
Apparent power required by the DVR (𝑉𝐷𝑉𝑅) is then calculated in terms of the apparent
load power (𝑆𝐿) [19].
𝑆𝐷𝑉𝑅 = 𝑆𝐿(1 − 𝐾) (3.10)
𝑆𝐷𝑉𝑅 = 𝑉𝐷𝑉𝑅𝐼𝐿∗ (3.11)
3.1.3. Control system for dynamic voltage restorer
A controller is required to control or to operate DVR during the fault conditions only.
The DVR control unit used based on park’s transformer. Park’s transformation is another
name dqo transformer that stands for direct-quaderature-zero transformation. This
technique work transformed from abc coordinates to dqo coordinate. The dqo signal of
both supply voltage and reference voltage splits in to direct (d) and quaderature (q) value
of the supply signal are compared with those of the reference signal. The result d and q
are then sent to the dqo-to-abc transformation of pulse is generated. This park’s
transformation requires the Phase Locked Loop (PLL) to generate a signal with the same
frequency and the phase angle of the input signal or reference signal generation. The
block diagram of the phase locked loop is illustrated in figure 3.3. The PLL circuit is used
to generate a unit sinusoidal wave in phase with mains voltage [36] [37] [38].
Page 62
POWER QUALITY PROBLEMS IN INDUSTRIAL ENTERPRISES AND THEIR MITIGATION TECHNIQUES
MSc. Thesis By Firew Tsegaye/Power System Engineering/BIT/BDU Page 43
Voltage supply
Va, Vb, Vc
Input Vref
Converet to
dqo
Converter to dqo
coordinate system
PLL Compare
Convert to Vabc
Coordinate System
Generate signal for
PWM
Figure 3.3 Flow chart of feed forward control technique for dynamic voltage restorer based on dqo
transformation
Based on Park’s transformation below equation defined the transformation of from three
phase system Vabc to Vdqo stationary form. In this transformation, phase A is aligned to
the d-axis that is in quaderature with the q-axis. The angle between phases A to the d-axis
is defined by theta (θ).
[
𝑉𝑑
𝑉𝑞
𝑉0
] =
[ cos(𝜃) cos (𝜃 −
2𝜋
3) 1
− sin(𝜃) −sin (𝜃 −2𝜋
3) 1
1
2
1
2
1
2]
[𝑉𝑎
𝑉𝑏
𝑉𝑐
] (3.12)
Page 63
POWER QUALITY PROBLEMS IN INDUSTRIAL ENTERPRISES AND THEIR MITIGATION TECHNIQUES
MSc. Thesis By Firew Tsegaye/Power System Engineering/BIT/BDU Page 44
And the inverse transformation (from dqo to abc reference frame) is
[𝑉𝑎
𝑉𝑏
𝑉0
] =
[ 𝑐𝑜𝑠(𝜃) − 𝑠𝑖𝑛(𝜃)
1
2
𝑐𝑜𝑠 (𝜃 −2𝜋
3) −𝑠𝑖𝑛 (𝜃 −
2𝜋
3)
1
2
1 11
2]
[
𝑉𝑑
𝑉𝑞
𝑉0
] (3.13)
3.1.4. Injection Transformer
Injection transformer has three single phase transformers for voltage injection purpose.
The converter uses only six switches to generate the three injected voltages and it has
three switches in the current path. The converter can only generate two voltage levels and
the midpoint of the DC-link is connected to the star point of the series transformers in
order to be able to inject a zero sequence voltage into the system. The DC-link voltage
must be actively balanced to avoid unbalanced DC-link voltage [39].
Figure 3.4 Converter with an open star/star transformer connection
As shown in chapter three the injected voltages are introduced into the distribution
system through an injection transformer connected in series with the distribution line. It is
known that in order to assurance the maximum reliability and effectiveness of this
restoration scheme, one of the prerequisites is to select good injected transformer.
Page 64
POWER QUALITY PROBLEMS IN INDUSTRIAL ENTERPRISES AND THEIR MITIGATION TECHNIQUES
MSc. Thesis By Firew Tsegaye/Power System Engineering/BIT/BDU Page 45
3.2. Mitigation of Harmonic Distortion using Shunt Active Power Filter
3.2.1. Mathematical Analysis of Shunt Active Power Filter
Figure 3.5 Basic compensation principle of a SAPF
Is
None-linear
Load
VSI
IL
IC
Power
Supply
RC.LC
Rs.Ls
VdC
Vs
SAPF
Figure 3.6 Block diagram of SAPF
Page 65
POWER QUALITY PROBLEMS IN INDUSTRIAL ENTERPRISES AND THEIR MITIGATION TECHNIQUES
MSc. Thesis By Firew Tsegaye/Power System Engineering/BIT/BDU Page 46
Based on the above figure the source voltage given by
𝑉𝑠(𝑡) = 𝑉𝑚 sin𝑤𝑡 (3.14)
The instantaneous current can be written as
𝐼𝑠(𝑡) = 𝐼𝐿(𝑡) − 𝐼𝑐(𝑡) (3.15)
Where, 𝑉𝑠(𝑡)- is the instantaneous value of the source voltage
𝑉𝑚- is the peak value of the source voltage
𝐼𝑠(𝑡)- is the instantaneous value of source current
𝐼𝐿(𝑡)- is the instantaneous value of load current and
𝐼𝑐(𝑡)- is the instantaneous value of compensation current
Non-linear load will draw current in a non-sinusoidal shape when it is connected to utility
mains. This implies that load current consists of more than one frequency component
[40], so non-linear load current 𝐼𝐿 comprises the fundamental and harmonic components,
which is represented as
𝐼𝐿(𝑡) = ∑ 𝐼ℎ𝑠𝑖𝑛(𝑛𝑤𝑡 + ∅ℎ)
∞
ℎ=1
= 𝐼1 sin(𝑤𝑡 + ∅1) + (∑ 𝐼ℎ sin(𝑛𝑤𝑡 + ∅ℎ)
∞
ℎ=2
) (3.16)
In equation below three terms Active power, reactive power and harmonics [40],
𝐼𝐿(𝑡) = 𝐼1𝑠𝑖𝑛(𝑤𝑡) + 𝐼1𝑐𝑜𝑠(𝑤𝑡) + ∑ 𝐼ℎ sin(𝑛𝑤𝑡 + ∅ℎ)
∞
ℎ=2
(3.17)
Where,
𝐼1𝑠𝑖𝑛(𝑤𝑡): - Active power
𝐼1𝑐𝑜𝑠(𝑤𝑡): - Reactive power
∑ 𝐼ℎ sin(𝑛𝑤𝑡 + ∅ℎ)∞ℎ=2 : - Harmonics
𝐼1and ∅1- are the amplitude of the fundamental current and its angle with respect
to the fundamental voltage
Page 66
POWER QUALITY PROBLEMS IN INDUSTRIAL ENTERPRISES AND THEIR MITIGATION TECHNIQUES
MSc. Thesis By Firew Tsegaye/Power System Engineering/BIT/BDU Page 47
𝐼ℎ and ∅ℎ – are the amplitude of the 𝑛𝑡ℎ harmonic current and its angle
The instantaneous load power is computed from the supply voltage and the load current.
The load power calculation is given as [40]
𝑝𝐿(𝑡) = 𝑣𝑠(𝑡) 𝑥 𝑖𝐿(𝑡)
= 𝑉𝑚 sin𝑤𝑡 𝑥 𝐼1 sin(𝑤𝑡 + ∅1) + 𝑉𝑚𝑠𝑖𝑛𝑤𝑡 + ∑ 𝐼ℎ sin(𝑛𝑤𝑡 + ∅ℎ)
∞
ℎ=2
= 𝑉𝑚 sin𝑤𝑡(𝐼1 sin wt cos∅1 +𝐼1 cos𝑤𝑡 𝑠𝑖𝑛∅1) + 𝑉𝑚 𝑠𝑖𝑛 𝑤𝑡 ∑ 𝐼ℎ sin(𝑛𝑤𝑡 + ∅ℎ)
∞
ℎ=2
= 𝑉𝑚𝐼1 𝑠𝑖𝑛2 𝑤𝑡 ∗ 𝑐𝑜𝑠∅1 + 𝑉𝑚𝐼1 𝑠𝑖𝑛 𝑤𝑡 ∗ 𝑐𝑜𝑠 𝑤𝑡 ∗ 𝑠𝑖𝑛 ∅1 +𝑉𝑚 𝑠𝑖𝑛 𝑤𝑡
∗ ∑ 𝐼ℎ 𝑠𝑖𝑛(𝑛𝑤𝑡 + ∅ℎ)
∞
ℎ=2
(3.18)
When,
𝑝𝑓(𝑡) = 𝑉𝑚𝐼1 sin2 𝑤𝑡 ∗ cos∅1
𝑝𝑟(𝑡) = 𝑉𝑚𝐼1 sin wt ∗ cos wt ∗ sin ∅1
𝑝ℎ(𝑡) = 𝑉𝑚 sin𝑤𝑡 ∗ ∑ 𝐼ℎ sin(𝑛𝑤𝑡 + ∅ℎ)
∞
ℎ=2
𝑝𝐿(𝑡) = 𝑝𝑓(𝑡) + 𝑃𝑟(𝑡) + 𝑃ℎ(𝑡)
= 𝑝𝑓(𝑡) + 𝑃𝑐(𝑡) (3.19)
For ideal compensation only the (fundamental) real power should be supplied by the
source while all the rest power components should be supplied by the active power filter,
𝑝𝑐(𝑡) = 𝑝𝑟(𝑡) + 𝑝ℎ(𝑡)
𝑝𝑐(𝑡) = 𝑉𝑚𝐼1 𝑠𝑖𝑛 𝑤𝑡 ∗ 𝑐𝑜𝑠 𝑤𝑡 ∗ 𝑠𝑖𝑛 ∅1 +𝑉𝑚 𝑠𝑖𝑛 𝑤𝑡 ∗ ∑ 𝐼ℎ 𝑠𝑖𝑛(𝑛𝑤𝑡 + ∅ℎ)
∞
ℎ=2
(3.20)
Page 67
POWER QUALITY PROBLEMS IN INDUSTRIAL ENTERPRISES AND THEIR MITIGATION TECHNIQUES
MSc. Thesis By Firew Tsegaye/Power System Engineering/BIT/BDU Page 48
Where, 𝑝𝑓(𝑡)- is the (fundamental) real power
𝑝𝑟(𝑡)- is the fundamental reactive power
𝑝ℎ(𝑡)- is the harmonic power drawn by the load
𝑝𝑐(𝑡)- is ideal power compensation
From 𝑝𝑓(𝑡) + 𝑝𝑟(𝑡) + 𝑝ℎ(𝑡) equation the real power needed by the load is
𝑝𝑓(𝑡) = 𝑉𝑚𝐼1𝑠𝑖𝑛2𝑤𝑡 ∗ cos ∅1 = 𝑣𝑠(𝑡) ∗ 𝑖𝑠(𝑡) (3.21)
From the above equation the source current will, after compensation is
𝑖𝑠(𝑡) = 𝐼1 cos ∅1 sin𝑤𝑡 = 𝐼𝑠𝑚 sin𝑤𝑡 =𝑝𝑓(𝑡)
𝑣𝑠(𝑡) (3.22)
There are some switching losses in the VSI, and hence the utility must supply small
overhead for the capacitor leakage and inverter switching losses in addition to the real
power of the load. The total peak current supply by the source is therefore
𝐼𝑠𝑝 = 𝐼𝑠𝑚 + 𝐼𝑠𝐼 (3.23)
Where, 𝐼𝑠𝑚 = 𝐼1 cos ∅1 sinwt - peak value of the source current
𝐼𝑠𝐼 = Switching loss current
Now for estimation of reference source current, the peak value of the reference current
𝐼𝑠𝑝 can be estimated by controlling the dc side capacitor voltage. The ideal compensation
requires the main current to be sinusoidal and in phase with the source voltage
irrespective of the load’s current nature. The desired source current after compensation
can be given as
𝑖∗𝑠𝑎 = 𝐼𝑠𝑝 sin𝑤𝑡 (3.24)
𝑖∗𝑠𝑏 = 𝐼𝑠𝑝 sin(𝑤𝑡 − 1200) (3.25)
𝑖∗𝑠𝑐 = 𝐼𝑠𝑝 sin(𝑤𝑡 + 1200) (3.26)
Page 68
POWER QUALITY PROBLEMS IN INDUSTRIAL ENTERPRISES AND THEIR MITIGATION TECHNIQUES
MSc. Thesis By Firew Tsegaye/Power System Engineering/BIT/BDU Page 49
Where 𝐼𝑠𝑝 = 𝐼𝑠𝑚 + 𝐼𝑠𝑖 = 𝐼1 cos ∅1 + 𝐼𝑠𝐿 is the amplitude of the desired source current,
while the phase angles can be obtained from the source voltages, Hence, the waveform
and phases of the source current are known, only the magnitude of the source currents
needs to be determined.
From the above figure we draw the vector diagram of Shunt Active Power Filter as
shown figure below [41] [30].
PWM
ConverterVdc Cdc
Lc
Ic1
Vc1
jωLcIc1
is1
Ic1IL1
Vs Vc1
Figure 3.7 Shunt active power filter and its phasor diagram
𝑉𝑠 = 𝑉𝑚 sin𝑤𝑡 (3.27)
Because of the principle of active power filter compensation we should adjust 𝐼𝑐1 because
it used for compensation reactive power of the load. From the above vector diagram we
consider 𝑖𝑠1 in phase with 𝑉𝑠 and 𝑉𝑐1.
𝑉𝐶1 = 𝑉𝑠 + 𝑗𝑤𝐿𝑐𝐼𝑐1 (3.28)
𝐼𝐶1 =𝑉𝐶1 − 𝑉𝑠
𝑤𝐿𝑐=
𝑉𝐶1
𝑤𝐿𝑐(1 −
𝑉𝑠
𝑉𝐶1) (3.29)
From the above vector diagram three phase reactive power delivered from SAPF is
calculated below [42]
𝑄𝐶1 = 𝑄𝐼1 = 3𝑉𝑠𝐼𝐶1 = 3𝑉 𝑉𝐶1
𝑤𝐿𝑐(1 −
𝑉𝑠
𝑉𝐶1) (3.30)
From the above equation 𝑄𝐶1 𝑖𝑠 𝑝𝑜𝑠𝑖𝑡𝑖𝑣𝑒 𝑤ℎ𝑒𝑛 𝑖𝑓 𝑉𝐶1 > 𝑉𝑠
𝑄𝐶1 𝑖𝑠 𝑛𝑒𝑔𝑎𝑡𝑖𝑣𝑒 𝑤ℎ𝑒𝑛 𝑖𝑓 𝑉𝐶1 < 𝑉𝑠
Page 69
POWER QUALITY PROBLEMS IN INDUSTRIAL ENTERPRISES AND THEIR MITIGATION TECHNIQUES
MSc. Thesis By Firew Tsegaye/Power System Engineering/BIT/BDU Page 50
3.2.2. Voltage source inverter of shunt active power filter
Shunt APF topologies use voltage source inverters, which have a dc voltage source at the
dc voltage. Generally a capacitor used as an energy storage device which acts a voltage
source. In this topology, inverter dc voltage from the capacitor is converted into an AC
voltage by appropriately gating the power semiconductor switches.
As shown in chapter three VSIs are preferred over CSIs because of their higher efficiency
and lower initial cost and in addition VSIs is connected in parallel.
It can generate a sinusoidal voltage with any required magnitude, frequency and phase
angle. The VSI use to either completely replace the voltage or to inject the ‘missing
voltage’. The ‘missing voltage’ is the difference between the normal voltage and the
actual. It also converts the DC voltage across storage devices into a set of three phase AC
output voltages. It is also capable to generate or absorbs reactive power. If the output of
the VSI is greater than AC bus terminal voltages, is said to be in capacitive mode. So, it
will compensate than AC reactive power through Ac system and regulates missing
voltages. These voltages are in phase and coupled with the AC system through the
reactance of coupling transformers. In addition, the converter is normally based on
energy storage, which will supply the converter with a DC voltage. The type of power
switch used is an IGBT in anti-parallel with a diode. Some of the methods of VSI control
are; Hysteresis current control method, Sinusoidal Pulse Width Modulation (SPWM)
control and Space Vector PWM control [43] [33] [44] [45].
Figure 3.8 Voltage source converter for shunt active power filters
Page 70
POWER QUALITY PROBLEMS IN INDUSTRIAL ENTERPRISES AND THEIR MITIGATION TECHNIQUES
MSc. Thesis By Firew Tsegaye/Power System Engineering/BIT/BDU Page 51
3.2.3. Selection of DC side capacitor
The DC side capacitor (CDC ) of VSI performs two key objectives in active filtering
applications. It keeps VdC with a small ripple during steady state and behaves as an
energy storage element to supply the real power difference between source and load
during transient conditions. During steady state conditions the real power demand of the
load and a small power to compensate for the losses in the SAPF should be equal to the
real power supplied by the source. Thus VDC can be maintained at a reference value,
However, when load change occurs, the real power balance between the source and load
will be interrupted and keeps the VDC away from its reference voltage. This real power
difference is to be compensated by the CDC. In order to ensure the satisfactory operation
of the SAPF should be adjusted to change proportionally the real power drawn from the
source. If the VdC attains its reference value, the real power consumed by the load is
supposed to be equal to the real power supplied by the source. Thus, can be found by
regulating the average voltage value of theCDC. If the DC bus voltage is lower than the
reference DC bus voltage implies that the real power supplied by the source is not enough
to supply the load demand. Hence, the source current needs to be increased. In other
words, if the DC bus voltage is larger than the reference DC bus voltage, the source
current needs to be decreased. The reactive power injection may leads to the ripple
voltage of the CDC [40]. In short the selection of DC Side CapacitorCDC, are two main
purposes of DC side capacitor server: first in steady state it maintains DC voltage and the
other during transient period it serves as an energy storage element to supply power
differences. Therefore choosing of DC capacitor is very important, the DC capacitor must
be maintained with the help of a reference value.
When load condition changes, the real power balance between main and the load will be
also disturbed, which is to be compensated by DC capacitor.
During transients, DC side capacitor helps to maintain variations and ripples inVDC .
Change in CDC does not much affect the error in VDCbut by change inCDC, the settling
time and final value of VDC are affected. So, on the basic of settling time, response time
and variation in VDCthe final value of CDCis selected.
Page 71
POWER QUALITY PROBLEMS IN INDUSTRIAL ENTERPRISES AND THEIR MITIGATION TECHNIQUES
MSc. Thesis By Firew Tsegaye/Power System Engineering/BIT/BDU Page 52
There are numerous different methods which can use for designingCDC. They are:-
CDC =2Emax
VDC2 − VDC,min
2 (3.31)
Emax is the maximum supplied energy by the capacitor in the worst case.
CDC =π ∗ Ic1,rated
√3w ∗ VDC,P−Pmax
(3.32)
WhereVDC,P−Pmax: the peak to peak voltage ripple
CDC =s
2wVDC∗∆VDC (3.33)
CDC =Vs√I5
2 + I72 − 2I5I7 cos(5α − 7α)
2wVDC2 ε
(3.34)
CDC =IH
2whVDC (3.35)
WhereIH : current of the lowest order harmonic
In this thesis select capacitor value based on the second method that observed above, the
selection of this capacitor or CDC can be governed by reducing the voltage ripple. The
specification of peak to peak voltage ripple and the rated filter current define the
capacitor [46] [47].
CDC =π ∗ Ic1,rated
√3w ∗ Vdc,P−P(max)
(3.36)
i.e. to know CDCit is necessary to know Vpp
Vpp = π ∗ Ipp ∗ c =π ∗ Ipp
w ∗ Cdc (3.37)
From equation above the max peak to peak voltage ripple can be obtained as [48].
Vpp =π ∗ Ic1,rated
√3 w ∗ Cdc
(3.38)
3.2.4. Selection of DC voltage reference
To actively control filter current Ic, the dc bus nominal voltage Vdc must be greater than
or equal to line peak voltage i.e. the filter can only compensate when Vdc > Vs, if we
assume that the PWM converter is operating in linear modulation mode (0 ≤ ma ≥ 1)
then [46],
Page 72
POWER QUALITY PROBLEMS IN INDUSTRIAL ENTERPRISES AND THEIR MITIGATION TECHNIQUES
MSc. Thesis By Firew Tsegaye/Power System Engineering/BIT/BDU Page 53
ma =Vm
Vdc
2
=2√2 Vf1
Vdc for ma = 1, (3.39)
Where Vm = √2 Vf1
Hence, Vdc = 2√2 Vf1for ma = 1 (3.40)
Where,
Vf1 −Fundamental components in the ac-side of PWM-inverter
In the above equation Vf1is the fundamental component at AC side of PWM converter. If
the non-linear load is already known then reference dc bus voltage chose is the function
of load power and the maximum harmonic order which is the be compensated
Vdc = 2√2 V(fh)max (3.41)
Where, V(fh)max is the voltage value including harmonics of order to be compensated,
approximately becomes equal to Vs source voltage.
3.2.5. Selection of Filter inductance
The value of filter inductance should be kept small enough so that the injected current di
dt
is greater than the reference compensating current to track its reference. The value of
filter inductance can be mainly found out by reactive power requirement of the system
and harmonic cancellations. There are a number of different approaches [46]:
QLf1 = 3VsIf1 = 3Vs
Vf1
wL1(1 −
Vs
Vf1) (3.42)
If1 =Vf1wmf
wmf Lf⁄
Where mf: the modulation ratio of PWM converter
Lf =Vs
2√6fs∆If, p − p,max (3.43)
Where∆If, p − p,max: 15% of the filter current
Page 73
POWER QUALITY PROBLEMS IN INDUSTRIAL ENTERPRISES AND THEIR MITIGATION TECHNIQUES
MSc. Thesis By Firew Tsegaye/Power System Engineering/BIT/BDU Page 54
Lf,min =VDC
8fs∆If, p − p,max (3.44)
Lf,max =VDC − 2√2Vs
2∑ wh∞h=0 Ih√2
(3.45)
Where h is the harmonic order.
Lf =VDC
6fs∆If, p − p,max (3.46)
Where∆If, p − p,max: is the maximum ripple current
In this thesis selected the filter inductance based on the first method. The performance of
the system can be observed taking difference at which the current harmonics are
minimum.
3.2.6. Harmonic Current Extraction Methods
The harmonic or reference current extraction method is classified into time-domain and
frequency- domain. The time-domain is used to extract the reference current from the
harmonic line current with simple algebraic computation. The frequency domain method
includes, Discrete Fourier Transform (DFT), Fast Fourier Transform (FFT), and
Recursive Discrete Fourier Transform (RDFT) based methods. The frequency domain
methods required large memory, computation power and the results provided during the
transient condition may be imprecise. Mostly frequency-domain work based on Fast
Fourier Transformation (FFT) method provides accurate individual and multiple
harmonic load current detection. The merit of time-domain method has fast response
compared to frequency domain, so in this thesis used time-domain method [30] [49].
3.2.7. Instantaneous Real and Reactive Power Theory (p-q method)
The performance of APF depends on the reference currents estimation process. This
process is called reference current generation. The following methods are used to
generate reference currents for the Shunt Active Power Filter.
1. Instantaneous active and reactive power theory also known as p-q theory.
2. Synchronous reference Method also known as d-q theory.
Page 74
POWER QUALITY PROBLEMS IN INDUSTRIAL ENTERPRISES AND THEIR MITIGATION TECHNIQUES
MSc. Thesis By Firew Tsegaye/Power System Engineering/BIT/BDU Page 55
3. Root Mean Square (RMS) based algorithm.
4. Active and Reactive current methods.
For this thesis used Instantaneous active and reactive power theory (p-q theory). This
theory three phase load voltages and currents of three phase reference frame are
transformed into two phase quantities of orthogonal reference frame. The instantaneous
active and reactive powers are calculated from the orthogonal components. The
compensating currents are calculated from the instantaneous powers. By this method
reactive power compensation can also be done. There active current component can be
used for reactive power compensation.
In advance this theory, basically three phase system as a single unit and performs
Clarke’s transformation (a-b-c coordinates to the α-β-0 coordinates) over load current and
voltage to obtain a compensating current in the system by evaluating instantaneous active
and reactive power of the network system.
The p-q method control strategy in block diagram form is shown in figure below.
Page 75
POWER QUALITY PROBLEMS IN INDUSTRIAL ENTERPRISES AND THEIR MITIGATION TECHNIQUES
MSc. Thesis By Firew Tsegaye/Power System Engineering/BIT/BDU Page 56
Load Current and Voltage Measurement
Clarke Transformation
P and q Calculation
Inverse Clarke Transformation
Compensating Current Calculation
Filter for qc
Calculation
Filter for Pc
Calculation
Figure 3.9 P-Q method control strategy
This theory works on dynamic most important as its instantaneously calculated power
from the instantaneous voltage and current in three phase circuits [33] [44] [45].
Although the method analysis the power instantaneously yet the harmonic suppression
greatly depends on the gating sequence of three phase MOSFET inverter which is
controlled by different current controller such as hysteresis controller, PWM controller,
triangular carrier current controller. But among this hysteresis current controlled method
is widely used due to its robustness, better accuracy and performance which gives to
ability to power system [44].
Page 76
POWER QUALITY PROBLEMS IN INDUSTRIAL ENTERPRISES AND THEIR MITIGATION TECHNIQUES
MSc. Thesis By Firew Tsegaye/Power System Engineering/BIT/BDU Page 57
3.2.7.1. P-Q method mathematical modeling
The relation between load current & voltage of three phase power system and the
orthogonal coordinates (α-ß-0) system are expressed by Clarke’s transformation. The
Clarke transformation maps the three phase instantaneous voltage in the abc phase,
Va, Vb and Vc , into the instantaneous voltages on the αß0-axisVα, VβandV0. The Clarke
transformation and its inverse transformation of the phase generic voltage are given by:-
[
𝑉𝛼
𝑉𝛽
𝑉0
] = √2
3
[ 1 −
1
2−
1
2
0√3
2−
√3
21
√2
1
√2
1
√2 ]
[𝑉𝑎
𝑉𝑏
𝑉𝑐
] (3.47)
And its inverse transformation is
[𝑉𝑎
𝑉𝑏
𝑉𝑐
] = √2
3
[ 1
√2−
1
2
√3
2
1
√2−
1
2−
√3
21
√21 0
]
[
𝑉𝛼
𝑉𝛽
𝑉0
] (3.48)
Similarly, three phase generic instantaneous line currents𝐼𝑎, 𝐼𝑏and𝐼𝑐, can be transformed
on the αß0-axis by
[
𝐼𝛼𝐼𝛽𝐼0
] = √2
3
[ 1 −
1
2−
1
2
0√3
2−
√3
21
√2
1
√2
1
√2 ]
[𝐼𝑎𝐼𝑏𝐼𝑐
] (3.49)
And its inverse transformation is
[𝐼𝑎𝐼𝑏𝐼𝑐
] = √2
3
[ 1
√2−
1
2
√3
2
1
√2−
1
2−
√3
21
√21 0
]
[
𝐼𝛼𝐼𝛽𝐼0
] (3.50)
Where 𝑣𝑎 , 𝑣𝑏 , 𝑣𝑐 𝑎𝑛𝑑 𝐼𝑎, 𝐼𝑏 , 𝐼𝑐 represent the phase voltages and currents respectively.
Page 77
POWER QUALITY PROBLEMS IN INDUSTRIAL ENTERPRISES AND THEIR MITIGATION TECHNIQUES
MSc. Thesis By Firew Tsegaye/Power System Engineering/BIT/BDU Page 58
𝑉0 And 𝐼0can be eliminated from transformation materials, the Clarke transformation and
its inverse transformation become
[𝑉𝛼
𝑉𝛽] = √
2
3[ 1 −
1
2−
1
2
0√3
2−
√3
2 ]
[𝑉𝑎
𝑉𝑏
𝑉𝑐
] (3.51)
And
[𝑉𝑎
𝑉𝑏
𝑉𝑐
] = √2
3
[
1 0
−1
2
√3
2
−1
2−
√3
2 ]
[𝑉𝛼
𝑉𝛽] (3.52)
Similar equation for line current
[𝐼𝛼𝐼𝛽
] = √2
3[ 1 −
1
2−
1
2
0√3
2−
√3
2 ]
[𝐼𝑎𝐼𝑏𝐼𝑐
] (3.53)
And
[
𝐼𝑎𝐼𝑏𝐼𝑐
] = √2
3
[
1 0
−1
2
√3
2
−1
2−
√3
2 ]
[𝐼𝛼𝐼𝛽
] (3.54)
The three phase instantaneous active power, 𝑝(𝑡)is calculated from the instantaneous
voltage and current as
𝑝(𝑡) = 𝑉𝑎(𝑡)𝑖𝑎(𝑡) + 𝑉𝑏(𝑡)𝑖𝑏(𝑡) + 𝑉𝑐(𝑡)𝑖𝑐(𝑡) (3.55)
𝑝 = 𝑉𝑎𝑖𝑎 + 𝑉𝑏𝑖𝑏 + 𝑉𝑐𝑖𝑐 (3.56)
𝑝 = (𝑉𝑎 − 𝑉𝑏)𝑖𝑎 + (𝑉𝑏 − 𝑉𝑐)𝑖𝑏 + (𝑉𝑐 − 𝑉𝑎)𝑖𝑐 (3.57)
The three phase instantaneous active power can be calculated in terms of the αß0
components if equation 3.48 and 3.50 are used to replace the 𝑎𝑏𝑐 Variables in equation
3.57.
𝑝(𝑡) = 𝑉𝑎𝑖𝑎 + 𝑉𝑏𝑖𝑏 + 𝑉𝑐𝑖𝑐 ↔ 𝑝(𝑡) = 𝑉𝛼𝑖𝛼 + 𝑉𝛽𝑖𝛽 + 𝑉𝑜𝑖𝑜 (3.58)
This expression can be given in the stationary from by
𝑝(𝑡) = 𝑉𝛼𝑖𝛼 + 𝑉𝛽𝑖𝛽 (3.59)
𝑝0(𝑡) = 𝑉𝑜𝑖𝑜 (3.60)
Page 78
POWER QUALITY PROBLEMS IN INDUSTRIAL ENTERPRISES AND THEIR MITIGATION TECHNIQUES
MSc. Thesis By Firew Tsegaye/Power System Engineering/BIT/BDU Page 59
Similarly the instantaneous reactive power is given by
𝑞(𝑡) = −1
√3[(𝑉𝑎 − 𝑉𝑏)𝑖𝑐 + (𝑉𝑏 − 𝑉𝑐)𝑖𝑎 + (𝑉𝑐 − 𝑉𝑎)𝑖𝑏] (3.61)
Which is equivalent and the reactive power can be calculated as,
𝑞(𝑡) = 𝑉𝛼𝑖𝛼 − 𝑉𝛽𝑖𝛽 (3.62)
The instantaneous reactive power 𝑞(𝑡)takes into consideration all the current and voltage
harmonics.
From equation 3.58 and 3.61, the expression for 𝑝(𝑡)and𝑞(𝑡), can be write in matrix
form as
[𝑝𝑞] = [
𝑉𝛼 𝑉𝛽
−𝑉𝛽 𝑉𝛼] [
𝐼𝛼𝐼𝛽
] (3.63)
In general, each one of the active and reactive instantaneous power contains a direct
component and an alternating component. The direct component represents the
fundamentals of current and voltage. The alternating term represent the harmonics of
current and voltages [43].
In order to separate the harmonics from the fundamentals of the load currents, it is
enough to separate the direct term of the instantaneous power from the alternating one. A
Low Pass Filter (LPF) with feed-forward effect can be used to accomplish this task as
shown in figure [33] [44] [45].
A
Low Pass Filter
AA
+
-
-
Figure 3.10 LPF with feed-forward effect
The instantaneous reactive power produces an opposing vector with 180ο phase shift in
order to cancel the harmonic component in the line current.
From equation 3.62 and 3.63, give up equation 3.64.
[𝐼𝛼𝐼𝛽
] =1
𝑉𝛼2 + 𝑉𝛽
2 [𝑉𝛼 𝑉𝛽
−𝑉𝛽 𝑉𝛼] [
𝑃𝑞] (3.64)
Page 79
POWER QUALITY PROBLEMS IN INDUSTRIAL ENTERPRISES AND THEIR MITIGATION TECHNIQUES
MSc. Thesis By Firew Tsegaye/Power System Engineering/BIT/BDU Page 60
By deriving from these equations, the compensating reactive power can be identified. The
compensating current of each phase can be derived by using the inverse transformations
as shown in equation 3.64
[
𝑖𝑐𝑎∗
𝑖𝑐𝑏∗
𝑖𝑐𝑐∗
] = √2
3
[ 1 0
−1
2
√3
2
−1
2−
√3
2 ]
[𝑖𝑐𝛼𝑖𝑐𝛽
] (3.65)
This instantaneous reactive theory performs instantaneously as the reactive power is
detected based on the instantaneous voltages and currents of the three phase circuits. This
will provide better harmonics compensations as the harmonics detection phase is in small
delay.
The current control strategy plays an important role in fast response current controlled
inverts such as the active power filter. Hysteresis current control method is the most
commonly proposed control method in time domain. This method provides instantaneous
good accuracy, current correction response and unconditioned stability to the system. So
beside that, this method is the most suitable for current controlled inverters [45].
The Figure below shows the block diagram of p-q method for harmonic current
extraction [42].
Inverse Clarke’s
Transformation
vs
Is
If
Iαβ
p
qLPF
LPF
-
αβ
abc
+
-
+
β
α
Filter
Reference Current
Calculation Second Order
Low Pass
Filter
Instantaneous
Power p and q
Calculation
Clarke’s
Transformation
abc
abc
αβ
αβ
Figure 3.11 Principle of instantaneous active and reactive power theory
Page 80
POWER QUALITY PROBLEMS IN INDUSTRIAL ENTERPRISES AND THEIR MITIGATION TECHNIQUES
MSc. Thesis By Firew Tsegaye/Power System Engineering/BIT/BDU Page 61
3.2.8. PI controller for Shunt Active Power Filter
The PI controller is used to estimate the peak value of the reference current and to
regulate the dc-link capacitor voltage, or in the other word it is the controller is used to
eliminates the steady state error in the DC- side voltage [43]. The output of the PI-
controller is considered as the peak value of the estimated source or reference current.
The figure below shows the block diagram of Proportional Integrator Controller with
Unit sine vector [46] [50].
+
-
Vdc,ref
Vdc
X
Unit sine
Vector
Vc
Vb
Va
Proportional
gain
LPF
Derivative
gain
+
+
X
XI*CC
I*aC
I*bC
PI - Controller
e
Usa
Usc
Usb
Figure 3.12 PI control with unit sine vector block diagram
In this method, the DC side capacitor voltage is sensed and compared with a reference
voltage. This 𝑒𝑟𝑟𝑜𝑟 = 𝑉𝑑𝐶(𝑟𝑒𝑓) − 𝑉𝑑𝑐 is used as an input for PI controller. The error
signal is passed through Butterworth design based LPF. The LPF filter has cut-off
frequency at 50Hz that can suppress the higher order components and allow only
fundamental components. The transfer function of the PI Controller is represented as
𝐻(𝑆) = 𝐾𝑝 +𝐾𝑖
𝑆 (3.66)
Where,
𝐾𝑝- is the proportional constant that determines of dynamic response of the DC side
voltage control and
𝐾𝑖 - is the integral constant that determines it’s settling time.
Page 81
POWER QUALITY PROBLEMS IN INDUSTRIAL ENTERPRISES AND THEIR MITIGATION TECHNIQUES
MSc. Thesis By Firew Tsegaye/Power System Engineering/BIT/BDU Page 62
The gain value is derived using the mathematical formula 𝐾𝑝 = 2ξ𝑤𝑛𝐶𝐷𝐶 and similarly
integral gain is derived using𝐾𝑖 = 𝐶𝐷𝐶𝑤𝑛2 . Where ξ =
√2
2damping factor, 𝐶𝐷𝐶 dc-link
capacitor value, wn-natural frequency, chosen as the supply fundamental frequency.
The other point is Unit sine vector, the source voltage are converted to the unit current(s)
while corresponding phase are maintained.
𝑉𝑎 = 𝑉𝑚 𝑠𝑖𝑛(𝜔𝑡)
𝑉𝑏 = 𝑉𝑚 𝑠𝑖𝑛(𝜔𝑡 − 1200)
𝑉𝑐 = 𝑉𝑚 𝑠𝑖𝑛(𝜔𝑡 + 1200)
Where,
𝑉𝑚- Peak value of the source voltage,
𝜔 = 2𝜋𝑓- Fundamental angular frequency
For harmonic free unity power factor, three-phase supply currents are estimated using the
unit sine vector templates, which are in phase with the supply voltages and its peak value.
The unit sine vector templates are derived as [46].
𝑈𝑠𝑎=
𝑉𝑠𝑎𝑉𝑠𝑚
⁄ =sin𝜔𝑡
𝑈𝑠𝑏=
𝑉𝑠𝑏𝑉𝑠𝑚
⁄ =sin(𝜔𝑡−1200) 𝑎𝑛𝑑
𝑈𝑠𝑐=
𝑉𝑠𝑐𝑉𝑠𝑚
⁄ =sin(𝜔𝑡+1200)
The amplitude of the unit sine vector template is unity in steady-state. In the transient
condition, it will try varying according to the load variation. The unit sine vector
templates are multiplied with the peak-amplitude of the estimated reference current
which is used to generate the required reference currents.
The unit current is defined as ia = sinwt , ib = sin(wt − 1200) and ic = sin(wt +
1200). The amplitude of the sine current is unit or 1 volt and frequency is in phase with
the source voltages [51].
The proportional integral controller eliminates the steady state error in the DC side
voltage. The output of the PI controller is considered as the peak value of supply current
(𝐼𝑚𝑎𝑥), which is composed as the fundamental active power component of APF. Peak
Page 82
POWER QUALITY PROBLEMS IN INDUSTRIAL ENTERPRISES AND THEIR MITIGATION TECHNIQUES
MSc. Thesis By Firew Tsegaye/Power System Engineering/BIT/BDU Page 63
value of the current (𝐼𝑚𝑎𝑥) so obtained, is multiplied by the unit sine vectors in phase
with the respective source voltages to obtain the reference current (𝐼𝑐𝑎∗ ,𝐼𝑐𝑏
∗ ,𝐼𝑐𝑐∗ ) and sensed
with actual current (𝐼𝑎, 𝐼𝑏 , 𝐼𝑐) and are compared at hysteresis band, which gives the gating
signals for the active power filter [42].
3.2.9. Hysteresis band current control
The Hysteresis Band Current Control (HBCC) technique is used for pulse generation in
current controlled VSIs. The control method offers good stability, gives a very fast
response, provides good accuracy, low cost and has got a simple operation. The HBCC
technique employed in an active power filter for the control of line current is shown in
Figure 4.13. It consists of a hysteresis band surrounding the generated error current. The
current error is obtained by subtracting the actual filter current from there reference
current. There reference current used here is obtained by the p-q method which is
represented as𝐼𝑎𝑏𝑐∗. The actual filter current is represented as𝐼𝑓𝑎𝑏𝑐. The error signal is
then fed to the relay with the desired hysteresis band to obtain the switching pulses for
the inverter.
Iref=Iabc*
Ifabc
SWITCHING
PULSES
+-
Error
Figure 3.13 Hysteresis band current controller block
Hence, Upper limit hysteresis band = 𝐼𝑟𝑒𝑓 + max(𝐼𝑒) 𝑎𝑛𝑑
Lower limit hysteresis band = 𝐼𝑟𝑒𝑓 − min(𝐼𝑒)
Where, 𝐼𝑟𝑒𝑓= Reference Current
𝐼𝑒= Error Current
The operation of APF depends on the sequence of pulse generated by the controller.
Below figure shown the ramping of the current between the two limits where the upper
hysteresis limit is the sum of the reference current and the maximum error or the
Page 83
POWER QUALITY PROBLEMS IN INDUSTRIAL ENTERPRISES AND THEIR MITIGATION TECHNIQUES
MSc. Thesis By Firew Tsegaye/Power System Engineering/BIT/BDU Page 64
difference between the upper limit and the reference current and for the lower hysteresis
limit, it is the subtraction of the reference current and the minimum error.
Supposing the value for the minimum and maximum error should be the same. As a
result, the hysteresis band width is equal to two times of error [33].
Figure 3.14 Hysteresis band current controller graph
Figure 3.15 Demonstration of hysteresis band current controller using MATLAB/ SIMULINK
Page 84
POWER QUALITY PROBLEMS IN INDUSTRIAL ENTERPRISES AND THEIR MITIGATION TECHNIQUES
MSc. Thesis By Firew Tsegaye/Power System Engineering/BIT/BDU Page 65
CHAPTER FOUR
4. SIMULATION RESULTS AND DISCUSSION
4.1. Mitigation of Voltage sag problem
Before proceed to observe performance solution of voltage sag. Discuss modeling of
factory power distribution system. For factory 15 kV source proposed from Air force
feeder. As shown in figure below source voltage is 15 kV then by use proposed step
down transformer reduced from 15 kV to 380V. As discussed on chapter one APPF has a
power consumption of 2.85 MVA from two 800 kVA and one 1250 kVA step down
transformers. Each transformer is connected different loads.
Frequently occur fault single line to ground fault as discussed in chapter two, but during
gathering information from factory mostly occur on factory distribution system three
phase to ground fault. This is the reason why this type of fault is considered first. Three
phases to ground fault, each individual phases is decreased to 65.78% from their nominal
values during the period 0.05-0.15s for duration of 0.1s.
The factory power distribution system test in three phases to ground fault modeling and
the rms value before DVR connect simulation result are shown in figure 4.1 and figure
4.2 respectively.
Figure 4.1 SIMULINK model of factory with three phases to ground fault without using DVR
Page 85
POWER QUALITY PROBLEMS IN INDUSTRIAL ENTERPRISES AND THEIR MITIGATION TECHNIQUES
MSc. Thesis By Firew Tsegaye/Power System Engineering/BIT/BDU Page 66
4.1.1. Three phase fault occur on factory distribution system
Figure 4.2 SIMULINK result of rms value at three phases to ground faults
4.2. Simulink model of multistage voltage sage without DVR
On this section multistage voltage sag represent three phase voltage sag faults occur
different time for interval of time. It is not represent fault point or location. The first fault
stage duration 0.03 – 0.08s fault was applied to all three phases. While in second stage
which has duration of 0.13-0.16s also applied to all the three phases. All phases reduced
65.78% (around 250V) from their nominal rms values (380V). The factory power
distribution system test in multistage faults modeling and the rms value before DVR
connect simulation result are shown in figure 4.3 and figure 4.4 respectively.
Figure 4.3 SIMULINK model of factory with multistage voltage sage faults without dynamic voltage
restorer
Page 86
POWER QUALITY PROBLEMS IN INDUSTRIAL ENTERPRISES AND THEIR MITIGATION TECHNIQUES
MSc. Thesis By Firew Tsegaye/Power System Engineering/BIT/BDU Page 67
4.2.1. Multistage faults
Figure 4.4 SIMULINK result rms voltage of multistage faults without DVR
4.3. Performance solution of factory voltage sage power quality
problem
As shown on appendix a load flow analysis, it is the most important and essential
approach to investigating problems in power system operating and planning. Selection
the optimal location of DVR is effect on the power quality problem mitigation techniques
on the distribution system. So, from data load flow analysis, it indicates active power and
reactive power loss. Therefore selected DVR location is paramount for achieved power
quality improvement. Factory power distribution system including DVR and only DVR
subsystem shows in figure 4.5 and figure 4.6 respectively.
Page 87
POWER QUALITY PROBLEMS IN INDUSTRIAL ENTERPRISES AND THEIR MITIGATION TECHNIQUES
MSc. Thesis By Firew Tsegaye/Power System Engineering/BIT/BDU Page 68
Figure 4.5 SIMULINK model of factory with three phase sag with DVR
Figure 4.6 SIMULINK model of DVR
Page 88
POWER QUALITY PROBLEMS IN INDUSTRIAL ENTERPRISES AND THEIR MITIGATION TECHNIQUES
MSc. Thesis By Firew Tsegaye/Power System Engineering/BIT/BDU Page 69
4.4. Performance solution three phase to ground fault
The voltage sage problem of the factory power distribution system is modeled using
MATLAB/SIMULINK software. As shown in figure 4.7 simulation of voltage sage
problem without DVR voltage reduce around 65.78% (around 250V), when cause of
three phase short circuit fault occur at a system for 0.1s and the voltage is decreased to
less than 90%, so the voltage sage is needed to be compensated to get the desired voltage
level at the load side.
In figure 4.8 show the DVR application when the missing voltage occurs during voltage
sage is compensated by injected appropriate level of voltage. The compensated voltage
by injected DVR is around 34% (130V).
In figure 4.9 clearly seen the voltage waveform that after DVR connected compensation
missing voltage, this show DVR worked effectively.
Figure 4.7 SIMULINK result of rms at three phase to ground faults without DVR
Figure 4.8 Injected rms voltage by DVR
Page 89
POWER QUALITY PROBLEMS IN INDUSTRIAL ENTERPRISES AND THEIR MITIGATION TECHNIQUES
MSc. Thesis By Firew Tsegaye/Power System Engineering/BIT/BDU Page 70
Figure 4.9 SIMULINK result of rms voltage at three phases to ground fault with DVR
4.5. SIMULINK model of Multistage Voltage Sage with DVR
In figure 4.10 shown modeling of factory power distribution with multistage faults that
consist of two three-phase ground faults, and different fault duration. As shown in figure
4.11, the simulation of voltage sage problem without DVR connected, when multistage
faults occur. Voltages reduce around 65.78% (around 250V), first stage and second stage
duration 0.03 – 0.08s and 0.13-0.16s respectively.
When the missing voltage occurs during voltage sage two different stages is DVR
compensated by injected appropriate level of voltage and the compensated voltage
waveform are shown in figure 4.12 and figure 4.13 respectively.
Page 90
POWER QUALITY PROBLEMS IN INDUSTRIAL ENTERPRISES AND THEIR MITIGATION TECHNIQUES
MSc. Thesis By Firew Tsegaye/Power System Engineering/BIT/BDU Page 71
Figure 4.10 SIMULINK model of factory multistage voltage sage with DVR
Figure 4.11 SIMULINK result of rms at multistage faults without DVR
Page 91
POWER QUALITY PROBLEMS IN INDUSTRIAL ENTERPRISES AND THEIR MITIGATION TECHNIQUES
MSc. Thesis By Firew Tsegaye/Power System Engineering/BIT/BDU Page 72
Figure 4.12 Injected rms voltage by DVR for multistage faults
Figure 4.13 SIMULINK result of rms voltage multistage fault with DVR
Page 92
POWER QUALITY PROBLEMS IN INDUSTRIAL ENTERPRISES AND THEIR MITIGATION TECHNIQUES
MSc. Thesis By Firew Tsegaye/Power System Engineering/BIT/BDU Page 73
4.6. Mitigation of Harmonic distortion
This section presents the MATLAB base simulation results of with and without shunt
active power filter. The complete active power filter system is composed mainly of three
phase source, a nonlinear load, a voltage source PWM converter, PI controller, and
hysteresis band current control. All these components are modeled separately and then
integrated solved to simulate the system. Figure 4.14– figure 4.21 shows the simulations
results of the proposed shunt active power filter controlled by PI controller with
MATLAB software. The parameters selected for simulation studies are given in table 4.1.
Table 4.1 Simulation parameters
Parameters Value
DC reference voltage 700 V
Line inductance 2.5 µH
Filter inductance 3 mH
DC link capacitance 2600 µF
Load inductance 30 mH
Load resistance 10 Ω
Load capacitance 1 µF
System frequency 50 Hz
Three phase source voltage 400 V
Proportional constant, Kp 0.0183
Integral constant, Ki 6.5
Page 93
POWER QUALITY PROBLEMS IN INDUSTRIAL ENTERPRISES AND THEIR MITIGATION TECHNIQUES
MSc. Thesis By Firew Tsegaye/Power System Engineering/BIT/BDU Page 74
In figure 4.14 factory power distribution system modeled by MATLAB /SIMULINK
software. Before connect SAPF source voltage and load current waveform are shown in
figure 4.15 and figure 4.17 respectively. Figure 4.16 show distorted source current
waveform.
Figure 4.14 SIMULINK model of Amhara plastic pipe factory before filter
Figure 4.15 and figure 4.19 are represented source voltage of the factory. Factory source
voltage before step down is 15 kV(1.5 𝑥10 4). So these figures are shown this. The
source voltage is the same before and after compensation.
Figure 4.15 Source voltage waveform of phase ‘a’ without SAPF
Page 94
POWER QUALITY PROBLEMS IN INDUSTRIAL ENTERPRISES AND THEIR MITIGATION TECHNIQUES
MSc. Thesis By Firew Tsegaye/Power System Engineering/BIT/BDU Page 75
Figure 4.16 Source current waveform of phase ‘a’ without SAPF
Figure 4.17 Load current waveform of phase ‘a’ without SAPF
Page 95
POWER QUALITY PROBLEMS IN INDUSTRIAL ENTERPRISES AND THEIR MITIGATION TECHNIQUES
MSc. Thesis By Firew Tsegaye/Power System Engineering/BIT/BDU Page 76
4.7. Performance solution for Harmonic Distortion
The solutions for harmonic distortion modeling have been simulated using MATLAB
/SIMULINK/software. This modeling consists of different subsystems, like PI controller,
unit sine vector, hysteresis band current controller and VSI. Figure 4.18 is show the
integration of this system tools with factory power distribution system. Source voltage
and load current waveform are shown in figure 4.19 and figure 4.21 respectively. Figure
4.20 show the source current distortion filtered by applied shunt active power filter.
Figure 4.18 SIMULINK model of shunt active power filter for APPF
Figure 4.19 Source voltage waveform of phase ‘a’ with filter
Page 96
POWER QUALITY PROBLEMS IN INDUSTRIAL ENTERPRISES AND THEIR MITIGATION TECHNIQUES
MSc. Thesis By Firew Tsegaye/Power System Engineering/BIT/BDU Page 77
Figure 4.20 Source current waveform of phase ‘a’ with filter
As shows figure 4.17 and figure 4.21 with and without connected shunt active power
filter the load current waveform and magnitude is like this, because of non-linear load
current consists of fundamental and harmonic components. Further the magnitude is the
same before and after compensation. From this recommended the filter is show on source
current.
Figure 4.21 Load current waveform of phase ‘a’ with filter
Page 97
POWER QUALITY PROBLEMS IN INDUSTRIAL ENTERPRISES AND THEIR MITIGATION TECHNIQUES
MSc. Thesis By Firew Tsegaye/Power System Engineering/BIT/BDU Page 78
4.8. Result analysis and comparison of before and after SAPF implement
Below figure shows measured current harmonics distortion value before connect shunt
active power filter. For measured harmonics distortion was use frequency analyzer. The
measured value is THD 10.96%, which means above the IEEE standard.
Figure 4.22 Harmonics spectrum
Before apply power quality problem mitigation techniques or before connect SAPF was
analyzed harmonic using Fast Fourier Transform (FFT) analysis. The FFT analysis the
current THD value is 11.52% which means above the standard IEEE 519 acceptable limit
(5%). Therefore to eliminate this power quality problem used shunt active power filter.
Page 98
POWER QUALITY PROBLEMS IN INDUSTRIAL ENTERPRISES AND THEIR MITIGATION TECHNIQUES
MSc. Thesis By Firew Tsegaye/Power System Engineering/BIT/BDU Page 79
Figure 4.23 FFT analysis of source current waveform before filtering
From the measured and simulation result it can be seen that the system having non-linear
load has the harmonic value shown in table 4.3.
Table 4.2 Current harmonic distortion before compensation
Harmonic numbers Harmonic Current (%)
5 9.8
7 4.05
THDI% 11.52
Page 99
POWER QUALITY PROBLEMS IN INDUSTRIAL ENTERPRISES AND THEIR MITIGATION TECHNIQUES
MSc. Thesis By Firew Tsegaye/Power System Engineering/BIT/BDU Page 80
Figure 4.24 shown after filtering Fast Fourier Transform (FFT) analysis gives the current
of THD 0.21%.
Figure 4.24 FFT analysis of source current waveform after compensation
Table 4.3 Current harmonic distortion after compensation
Harmonic numbers Harmonic Current (%)
5 0.038
7 0.029
THDI% 0.21
Based on IEEE 519 standard current of THD must be below 5%. So as shown in figure
4.23 before compensation THD reach 11.52% and in figure 4.24 after compensation THD
reduced into 0.21%. Shunt active power filter effectively reduced the distortion
magnitude according to IEEE 519 standard.
Page 100
POWER QUALITY PROBLEMS IN INDUSTRIAL ENTERPRISES AND THEIR MITIGATION TECHNIQUES
MSc. Thesis By Firew Tsegaye/Power System Engineering/BIT/BDU Page 81
Table 4.4 Comparison THDi with and without SAPF
Harmonics numbers Without SAPF With SAPF
5 9.8 0.038
7 4.05 0.029
THDi (%) 11.52 0.21
Figure 4.25 Comparison of current THD before and after compensation
4.9. Annual cost/tariff and recompense period of DVR
On this section, discussion made based on the calculation of annual cost, DVR Capacity
and Specification and EEU tariff and recompense for period of DVR. Before proceeding
different charges types such as, generation charge, demand charge, transmission charge,
distribution charge and ancillary service charges were discussed.
The types of charges that have traditionally shown up in electricity tariffs include:
Generation charge:
The price paid by consumers to cover the cost of running power plants or
purchasing power from generation companies.
Page 101
POWER QUALITY PROBLEMS IN INDUSTRIAL ENTERPRISES AND THEIR MITIGATION TECHNIQUES
MSc. Thesis By Firew Tsegaye/Power System Engineering/BIT/BDU Page 82
Demand charges:
A special charge based on the highest amount of electricity used over the course
of a month. Imposing a demand charge requires that a utility has a special type of
electric meter that can record electricity usage in specific time increments, such as
an hour or half-hour, so that the utility is able to identify the point of peak demand
for a given month.
Transmission charge:
The price paid by consumers to cover the cost of transmission lines, or the cost of
transmission service purchased from other companies.
Distribution charge:
The price paid by consumers to cover the cost of the low-voltage distribution
systems.
Ancillary service charges:
Price paid by consumers to cover the costs of backup power and other equipment
used to keep the electric grid stable and reliable.
Annual cost of APPF
The maximum 𝑘𝑉𝐴 demand of the factory can be written as:
𝑀𝑎𝑥. 𝑘𝑉𝐴 𝑑𝑒𝑚𝑎𝑛𝑑 = 3675/0.85 = 4323.529
[𝑓𝑟𝑜𝑚 𝑜𝑙𝑑 𝐸𝐸𝑈 𝑡𝑎𝑟𝑖𝑓𝑓 𝑐𝑜𝑛𝑠𝑖𝑑𝑒𝑟, 1𝑘𝑉𝐴 = 56.04]
Factory 𝑘𝑉𝐴 demand charges can be calculated:
𝑘𝑉𝐴 𝑑𝑒𝑚𝑎𝑛𝑑 𝑐ℎ𝑎𝑟𝑔𝑒𝑠 = 4,323.529 ∗ 56.04 = 242,290.565
𝐸𝑛𝑒𝑟𝑔𝑦 𝑐𝑜𝑛𝑠𝑢𝑚𝑒𝑑 𝑝𝑒𝑟 𝑦𝑒𝑎𝑟 = 𝑀𝑎𝑥. 𝑑𝑒𝑚𝑎𝑛𝑑 ∗ 𝑝. 𝑓 ∗ 𝐻𝑜𝑢𝑟𝑠 𝑖𝑛 𝑎 𝑦𝑒𝑎𝑟
= 3675 ∗ 0.85 ∗ 8760
= 27,364,050 𝑘𝑤ℎ/𝑦𝑒𝑎𝑟
[𝐹𝑟𝑜𝑚 𝑜𝑙𝑑 𝐸𝐸𝑈 𝑡𝑎𝑟𝑖𝑓𝑓 𝑐𝑜𝑛𝑠𝑖𝑑𝑒𝑟, 1𝑘𝑤ℎ = 0.5778𝑏𝑖𝑟𝑟]
𝐸𝑛𝑒𝑟𝑔𝑦 𝑐ℎ𝑎𝑟𝑔𝑒 𝑝𝑒𝑟 𝑦𝑒𝑎𝑟 = 0.5778 ∗ 27,364,050 𝑘𝑤ℎ 𝑏𝑖𝑟𝑟
= 15,810,948.1 𝑏𝑖𝑟𝑟
Page 102
POWER QUALITY PROBLEMS IN INDUSTRIAL ENTERPRISES AND THEIR MITIGATION TECHNIQUES
MSc. Thesis By Firew Tsegaye/Power System Engineering/BIT/BDU Page 83
𝑇𝑜𝑡𝑎𝑙 𝑎𝑛𝑛𝑢𝑎𝑙 𝑐𝑜𝑠𝑡 𝑝𝑒𝑟 𝑎𝑛𝑛𝑢𝑎𝑙 𝑏𝑖𝑙𝑙 = 𝑀𝑎𝑥. 𝑑𝑒𝑚𝑎𝑛𝑑 𝑐ℎ𝑎𝑟𝑔𝑒𝑠 + 𝑒𝑛𝑒𝑟𝑔𝑦 𝑐ℎ𝑎𝑟𝑔𝑒𝑠
= 242,290.565 + 15,810,948.1
= 16,053,238.7
Factory total annual cost per annual bill is 16, 053,238.7 birr
DVR capacity and specification
Based on selected study area (amhara plastic pipe factory) power supply system:
𝑉𝑠= 15kV
The voltage source is 15kV, then after step down by transformer the three phase voltage
is 380V. Before voltage sag occur three phase voltage is 380V, then when voltage sag
occur from 0.05 – 0.15s for duration of 0.1s voltage reduced into around 65.78%
(250V). MATLAB/ SIMULINK result show the maximum three phase voltage sag is
65%.
S= 3376.5kVA
Response time = 0.05sec
Duration of sag to protect = 0.4sec
Now solve unknown value Capacity of DVR in KVA and Required energy. It is
recommended to adopt DVR technology to compensate voltage sag and restore to 100%
of the rated value. In fact voltage sag compensator is a power conditioner that corrects
voltage sags and maintains productivity. It corrects deep sags down to 30% of nominal
voltage (70% of reduction) [52] [53]. From MATLAB/ SIMULINK result APPF voltage
sag depth is around 65%, therefore, 70% or 0.7 PU is DVR compensating voltage.
𝑇ℎ𝑒 𝑐𝑜𝑚𝑝𝑒𝑛𝑠𝑎𝑡𝑖𝑛𝑔 𝑝𝑜𝑤𝑒𝑟 = 0.7 𝑥 3376.5𝑘𝑉𝐴 = 𝟐𝟑𝟔𝟑. 𝟓𝟓 𝒌𝑽𝑨
The duration of sag to protect is 0.4 sec. so,
𝑇ℎ𝑒 𝑟𝑒𝑞𝑢𝑖𝑟𝑒𝑑 𝑒𝑛𝑒𝑟𝑔𝑦(𝐸) = 𝑝𝑜𝑤𝑒𝑟 𝑥 𝑡𝑖𝑚𝑒 = (𝑘𝑉𝐴 𝑥 𝑃𝐹)𝑥 𝑡𝑖𝑚𝑒 (3.4)
𝐸 = (2363.55 𝑥 0.85) 𝑥 0.4
𝐸 = 𝟖𝟎𝟑. 𝟔𝟎𝟕 𝐤𝐉
According to calculated compensating power, required DVR energy, and additionally
for reliability and availability of DVR select 3000 kVA and 1000 kJ for installed in the
factory low side power distribution side [53].
Page 103
POWER QUALITY PROBLEMS IN INDUSTRIAL ENTERPRISES AND THEIR MITIGATION TECHNIQUES
MSc. Thesis By Firew Tsegaye/Power System Engineering/BIT/BDU Page 84
Cost and recompense period of DVR
In this section, discussion made on the cost and benefit analysis of installing Voltage Sag
Compensator/Dynamic Voltage Restorer (DVR) to mitigate voltage sag.
As discussed in previous chapters, voltage sages are the frequent causes of disrupted
operations for many industrial processes, especially those using modern electric
equipments that are sensitive to short duration variations. Based on this problem modern
industrial equipment affected which resulted in loss of product, clan up and restarting the
processes. Tripping electronic control devices may cause not only the current production
presently but also the future production, which eventually causes substantial revenue loss.
The recommend solution to address this problem is to install voltage sag compensator
(VSC)/ Dynamic Voltage Restorer (DVR) on important loads [52].
𝐶𝑉𝑆𝐶 = 𝐶𝐷𝑉𝑅 = 𝑇𝑝𝑎𝑦.𝑏𝑎𝑐𝑘 ∗ 𝑁𝑉.𝑆 ∗ 𝐶𝑉.𝑆
Where:
𝐶𝑉𝑆𝐶 = 𝐶𝐷𝑉𝑅: Cost of voltage sag compensator
𝑇𝑝𝑎𝑦.𝑏𝑎𝑐𝑘(𝑦𝑒𝑎𝑟): The payback time for the investment
𝐶𝑉.𝑆: Cost of a production interruption with the cause of voltage sag
𝑁𝑉.𝑆: Number of a production interruption with the cause of voltage sag
Then, cost of DVR is 300 $/kVA [53]
The cost of voltage sag, 𝐶𝑉.𝑆 at APPF is $1123/year, and by taking the upper limit of the
number of voltage sag occurrence, 𝑁𝑉.𝑆is 56/year.
𝐶𝐷𝑉𝑅 = 1123 $ 𝑥 56 𝑥 5 𝑦𝑒𝑎𝑟𝑠
= 314,440$
So the payback period will be,
𝑇𝑝𝑎𝑦𝑏𝑎𝑐𝑘 =𝐶𝐷𝑉𝑅
𝐶𝑉𝑆 ∗ 𝑁𝑉𝑆 =
314,440$
1123$ ∗ 56/𝑦𝑒𝑎𝑟 = 5 years
Since the average life time of the DVR is about 15 years [53], the solution is very
economical and feasible.
Page 104
POWER QUALITY PROBLEMS IN INDUSTRIAL ENTERPRISES AND THEIR MITIGATION TECHNIQUES
MSc. Thesis By Firew Tsegaye/Power System Engineering/BIT/BDU Page 85
CHAPTER FIVE
5. CONCLUSIONS AND RECOMMENDATIONS
5.1. Conclusions
The aim of this research was to investigate the power quality problems in the Ethiopian
industries taking Amhara plastic pipe factory as a case study. The main objective is to
assess the existing power quality problems, associated power distribution system, and to
compare with IEEE standard values. Moreover, the research aims to model mitigation
techniques, based on the results of the power quality assessment carried out at APPF.
Based on the results of the study, the following major conclusions are drawn.
The modeling and analysis of APPF power distribution system with controller have been
done using MATLAB/SIMULINK software. The modeling of DVR is developed and
simulation results of the system with and without DVR where carried out due to the
occurrence faults.
The selected control system is based on dqo technique which is simple control algorithm.
Supply voltage is compared with reference voltage to get error signal which is given to
the gate pulse generation circuit as a reference sine wave that is compared with carrier
signal to get pulses for inverter.
Phase Locked Loop (PLL) circuit one of the most important element use to extract angle
from supply voltage for using at supply of any frequency the error signals will be
synchronized supply frequency.
The simulation result of this thesis depicts that DVR provides better response to protect
voltage sage problem occurs on sensitive loads. The cost and recompense period of DVR
results confirm that DVR has relatively low cost, small in size and fast dynamic response
time. The three phases to ground fault is occurred at distribution line and voltage sage
was occurred around 65.78% rms. When DVR is connected, the voltage variation is
solved and acceptable by IEEE standard.
Page 105
POWER QUALITY PROBLEMS IN INDUSTRIAL ENTERPRISES AND THEIR MITIGATION TECHNIQUES
MSc. Thesis By Firew Tsegaye/Power System Engineering/BIT/BDU Page 86
The THD of the factory is 11.52% indicating it is, beyond the IEEE 519-1992 standard
(i.e. 5%). However, when shunt active power filter is connected, the THD reduced from
11.52% to 0.21% implying it fits the acceptable IEEE 519-1992 standard.
Shunt active power filters is connected in parallel to power systems; therefore, it can
operate as voltage sources. The voltage source inverter is controlled to inject the
compensation currents into the system. The control is based on the reference currents
calculated by control strategies implemented. The filter is operated in such a way that the
source supplies only the fundamental current and it supplies the harmonic current to the
system. It, also cancels the harmonic currents produced by the non-linear load.
5.2. Recommendations
Based on the results found in this thesis, it is recommended that amhara plastic pipe
factory should consider using the above power quality problem mitigation techniques.
These are Dynamic Voltage Restorer and Shunt Active Power Filter. By using these
power quality mitigation techniques, the factory can avoid the damage of information
technology equipments like microprocessor based control system personal computer,
programmable logic controls, adjustable speed drives etc and other important equipment.
Furthermore, the mitigation techniques can control the factory’s production process
stoppage, trip contactors and electromechanical relays, and then disconnection and loss of
efficiency in electrical rotating machines, motors burnout and cable insulation damage.
This eventually could improve profitability, productivity and increase the efficiency and
performance of factory equipments.
6.3. Future Work
In this thesis, the mitigation of power quality problem techniques is implemented by
using only two techniques namely Dynamic Voltage Restorer and Shunt Active Power
Filter. Moreover, the study used different controllers like PI controller. Future research
work should consider other mitigation measure techniques alone or together with DVR
and APF in order to improve more the power quality of the factory.
Page 106
POWER QUALITY PROBLEMS IN INDUSTRIAL ENTERPRISES AND THEIR MITIGATION TECHNIQUES
MSc. Thesis By Firew Tsegaye/Power System Engineering/BIT/BDU Page 87
REFERENCE
[1] A. Banger, "power quality imprevemnt of distribution networks using dynamic
voltage restoller ," Jul. 2011.
[2] Aurelio G. Cerrada, A.Mohammed, and B. H. asanin Shazly A. Mohammed,
"Dynamic Voltage Restorer (DVR) System for Compartion of Voktage sag, State-of
-the Art Review ," International Journal of Computational Engineering Research ,
vol. 3, no. 1, May 2014.
[3] P. Venkata Kishore and S. Rama Reddy, "power Quality Improvement using
mulitiple statcoms ," the international journal of engineering and science , pp. 2319-
1805, 2014.
[4] T. C. Sekar and B. J. Rabi, "A Rivew and study of Harmonic Mitigation Techniques
," IEEE, 2012.
[5] B. Singh, P. Makhija and S. khan, "A Review on power quality problems and its
improvement Techniqes," IEEE, 2017.
[6] A. ElMofty and K.Youssef, "industrial power quality poblems ," IEEE, Jun. 2001.
[7] F.A.L.Jowder, "design and analysis of dynamic voltage restorer for deep voltage sag
and harmonic compensation," in IET generation, transmission and distribution ,
Bahrain , 2008.
[8] Prof. Paramjit. Kaur. and Ms. Santoshi. Gupta, "mitigation technique for Voltage
Sag and Swell By using Dynamic Voltage restorer ," international Journal of
innovative research in electrical, electronics, instrument and control engineering ,
vol. 2, no. 1, Jan. 2014.
[9] Pooja R. Asaba, Prof. Sandeep Chawda and Tejashree G.More, "power quality
issues and it's mitigation Techniques ," international journal of engineering
research and applications , vol. 4, no. 4, pp. 170-177, Apr. 2014.
[10] A.Adejumobi, "harmonics mitigation on industerial loads using series and parallel
resonant filters," nagerian journal of technology , vol. 36, pp. 611-620, Apr. 2017.
[11] B. Raju, "harmonic mitigation techniques ," international journal of advanced
research in electrical electronics and instrumentation engineering , vol. 5, no. 11,
Nov. 2016.
Page 107
POWER QUALITY PROBLEMS IN INDUSTRIAL ENTERPRISES AND THEIR MITIGATION TECHNIQUES
MSc. Thesis By Firew Tsegaye/Power System Engineering/BIT/BDU Page 88
[12] Tahzeeb-ul-Hassan and Tehseen nahi and muhammad Abid, "mitigation of
harmonics produced by nonlinear loads in industerial power system ," FAST-NU
research Journal (FRJ), vol. 1, no. 2, Jul. 2015.
[13] El-Saadany, A. Salama and K.Abdel-Galil, "implementation of different mitigation
techniques for reduction harmonic distortion in medium industrial distribution
system," IEEE, 2001.
[14] Cluaudia-Laurenta popescu, and Laurentiu Ciufu and Mihai-Octavian Popescu,
"Experimental mitigation techniques to reduce the total harmonic distortion of low
voltage non-linear power sources," IEEE, pp. 23-25, Mar. 2017.
[15] Komal Praneeth Kota, "Estimation and Filtering of current Harminics in power
system ," national institute of technology,Rourkela , 2016.
[16] Nitin Saxena, A. K. Sharma and Shiuly Mukherjee, "power system Harmonic
Reduction Using Shunt Active Filter," International Journal of research in
engineering and technology , vol. 03, no. 04, 2014.
[17] P. Venkata Kishore and S. Rama Reddy, "power quality improvement using multiple
statcoms," the international Journal of engineering and Science, pp. 101-108, 2014.
[18] "series compensation technique for voltage sag mitigatio ," IOSR Journal of
Engineering (IOSRJEN), vol. 2, no. 8, pp. 14-24, Aug. 2012.
[19] A. B. Lashari, I. Ansari and R. Shaikh, "Harmonics Analysis and Mitigation Using
Passive Filters ," Jan. 2015.
[20] M. F. McGranaghan, S. Santoso, H. W. Beaty and R. C. Dugan, electrical power
systems quality, second ed. 2004.
[21] K. A. Ming Gao, "Investigation of power electrics solutions to power quality
problems in Distribution Networks ," IEEE, 2015.
[22] Bhupen Mohapatra, Amit Kumar Jena and Kalandi Pradhan, "Modeling and
Simulation of a Dynamic voltage Restorer ," national institute of technology Thesis
769008.
[23] P. E. Daniel, J. Camovale, P. E. Thomas and M.Bloomong, "Application of IEEE
Std 519-1992 Harmonic Limits".
[24] S. Rafiei, " Application of distributed generation sources for Micro-Grid power
Page 108
POWER QUALITY PROBLEMS IN INDUSTRIAL ENTERPRISES AND THEIR MITIGATION TECHNIQUES
MSc. Thesis By Firew Tsegaye/Power System Engineering/BIT/BDU Page 89
quality enhancement", Canada, 2014.
[25] S. Khalid and Bharti Dwivedi, "power quality issues, problems, standards and their
effects in industry with corrective means ," International journal of Advances in
Engineering and Technology , May 2011.
[26] P. S. MOHANTY, power quality improvement using FACTS devices . Rourkela :
Department of electrical engineering national institute of technology , 2016.
[27] Sreekanth G, Narender Reddy and Nagendrabau VASA, "series compensation
technique for voltage sag mitigation ," IOSR journal of engineering (IOSRJEN), vol.
2, no. 8, pp. 14-24, Aug. 2012.
[28] Ahmet Teke, "Modeling of Dynamic voltage restorer ," unversity of Cukurova
institute of natural and applieed science Thesis , 2005.
[29] Karuppana.P, "Design and Implementation of Shunt Active Powwer Line
conditioner using Novel Control strategies," national institute of technology thesis,
2012.
[30] K. C. Modipane, "An investigation of the effects of voltage and current harmonics
on an electrical distribution island ," Jul. 2005.
[31] M. A. Mohamed, "Design of shunt power filter to mitigate the harmonics caused by
nonlinear loads ," INTERNATIONAL JOURNAL OF ENGINEERING
DEVELOPEMENT AND RESEARCH, 2015.
[32] Dibyendu Bhadra and Rajnish kumar meena, "power quality improvement by
harmonic reduction using three phase shunt active power filter with p-q and d-q
current control strategy ".
[33] Arpit Shah and Nirav Vaghela, "Shunt Active Power Filter for Power Quality
Improvement in Distribution System ," INTERNATIONAL JOURNAL OF
ENGINEERING DEVELOPEMENT AND RESEARCH , 2005.
[34] T. Thomas, "mitigation of voltage sag and swell using dynamic voltage restorer ,"
IEEE, pp.220-230, 2014.
[35] R. Omar and N. A. Rahim, "Modeling and simulation for voltage sags/swells
mitigation using dynamic voltage restorer (DVR)," IEEE , Jan. 2009.
[36] Saripalli Rajesh, Mahesh K. Mishra, Senior Member IEEE and Sridhar K, "Design
Page 109
POWER QUALITY PROBLEMS IN INDUSTRIAL ENTERPRISES AND THEIR MITIGATION TECHNIQUES
MSc. Thesis By Firew Tsegaye/Power System Engineering/BIT/BDU Page 90
and Simulation of DVR using Sinusoidal pulse width modulation (SPWM)," in
national power system conference , India , 2010, pp. 317-322.
[37] N. Mahmoud, A. Abdel Haleam and N. M. Ayad and T.Kandil, "Power quality
problem mitigation using dynamic voltage Restorer in Egypt Thermal Research
Reactor (ETRR-2)," Arab journal of nuclear secince and applications,, pp. 347-358,
2013.
[38] J. G. Nielsen, "design and control of a dynamic voltage restorer ," IEEE, vol. 3, pp.
3-8, Jan 2002.
[39] h. B.Singh, "computer-Aided modeling and Simulatio of Active Power Filters,"
electrical machine and power system , vol. 27, pp. 1227-1241, 1999.
[40] F.Zain , "a study of Active Power Filters Using Quad Series Voltage Source PWM
Converters for Harmonic Compenastion ," IEEE, vol. 5, pp. 9-15, Jan 1990.
[41] Vandanna Sharma and Anurag Singh Tomer, "Comparative Analysis on Control
Methods of Shunt Active Power Filter for Harmonics Mitigation ," International
Journal of Science and Research , vol. 3, no. 2, Feb. 2014.
[42] Vikash Anand and S.K.SRIVASTAVA, "performance investigation of shunt Active
power Filter Using Hysteresis Current Control Method ," international journal of
engineering research and technology (IJERT), vol. 1, no. 4, Jun. 2012.
[43] D. Pradeep Kumer, "investigations on shunt active power filter for power quality
improvement," national insititute of technology thesis paper , 2007.
[44] prof. Kamala Kanta Mahapatra Karuppanan P, "PI with Fuzzy Logic Controller
based APLC for compensating harmonic and reactive power," ACEEE international
Journal on Control System and Instrumentation , vol. 1, Jul. 2010.
[45] Prof.Dr.M.M.Abdel Aziz, Dr. G.A. Abdel Salam and Sameh M.Kozman, "cost and
mitigation of voltage sag for industerial plants," International Conference on
electrical Electronic and Computer Engineering , 2004.
[46] B. Rottger, "Economic evaluation of power quality ," IEEE, Feb. 2002.
[47] Pooja R. Asaba, Prof. Sandeep Chawda and Tejashree G.More, "power quality
issues and It's Mitigation Techniques ," international journal of engineering
reasearch and applications , vol. 4, no. 4, pp. 170-177, Apr. 2014.
Page 110
POWER QUALITY PROBLEMS IN INDUSTRIAL ENTERPRISES AND THEIR MITIGATION TECHNIQUES
MSc. Thesis By Firew Tsegaye/Power System Engineering/BIT/BDU Page 91
[48] A. Kuander, "power quality improvement by using dinamic voltage restorer ," IEEE,
vol. 3, no. 4, Jul 2000.
[49] F. A. Jowder, "modeling and simulation of different system Topologies for Dynamic
Voltage Restorer ," electric power and energy conversion systems, EPECS '09
international conference, IEEE, pp. 1-6, 2009.
[50] B. W. Kennedy, M. amotyj and M.McGranaghan, "power quality contracts in a
competative electric utility industry ," IEEE, 1998.
[51]
[52]
[53]
B.Otjaghi, "Analysis of Harmonics and Harmonic Mitigation Methods in
Distribution systems ," Austeralians journal of basic , pp. 996-1005, 2011.
M.M.A. Aziz, G.A.A. Salma and S.M. Kozman, "Cost and mitigation of voltage sag
for industerial plants," international conference on electrical, electronic and
computer engineering, ICEEC, 2004.
P. Daehler and R. Affolter, "Requirements and solutions for Dynamic Voltage
Restorer, " power engineering socity winter meeting, IEEE, 2000.
Page 111
POWER QUALITY PROBLEMS IN INDUSTRIAL ENTERPRISES AND THEIR MITIGATION TECHNIQUES
MSc. Thesis By Firew Tsegaye/Power System Engineering/BIT/BDU Page 92
APPENDIX
APPENDIX A: Factory single line Load flow analysis diagram
Figure A.1: Result of Load flow Analysis
Page 112
POWER QUALITY PROBLEMS IN INDUSTRIAL ENTERPRISES AND THEIR MITIGATION TECHNIQUES
MSc. Thesis By Firew Tsegaye/Power System Engineering/BIT/BDU Page 93
APPENDIX B: Total electrical load of APPF
Table B1: Total electrical load of the factory
Table B2: Load Current
Phase
Load current (A)
Phase a 1234
Phase b 1309
Phase c 1480
Production
lines
Resistive
load 1
(unity)
AC
drive
loads
(0.95-
0.97)
Compe
nsated
loads
Motor
(0.7-
0.85)
Dc drives
(0.4-
0.75)
compre
ssor ,
fans
and
pumps
(0.75-
0.8)
Pups for
Spraying
(0.6-
0.65)
Non
Compensa
ted loads
Idle
loads
UPVC line 1 80.38 9.9 90.28 97.16 110 35.75 37 356.69 13.5
UPVC line 2 44.83 9.9 54.73 92.23 110 24.25 33 300.71 13.5
UPVC line 3 27.68 6.25 33.93 94.11 55.022 15.9 33 224.61 7.25
UPVC line 4 12.5 46.15 58.65 92.11 0 11.15 16.9 165.31 13.5
HDPE line 5 8.99 35.8 44.79 9.235 75 9.65 33 159.67 12
HDPE line 6 27.37 1.1 28.47 11.685 160 12.48 33 233.63 12
HDPE line 7 27.13 23.4 50.53 11.25 110.022 19.25 33 212.06 12
HDPE line 8 15 60.4 75.4 89.35 55.022 15.45 33 256.222 12
Geo membrane
9
73.85 70 143.85 32.9 352.47 27.95 33 568.82 221.35
Green sheet 10 117 780.4 897.4 41.1 15.4 5.75 0 953.65 6
Flat hose 11 4 56.4 60.4 5.335 0 0 1 63.735 3
Accessories 12 16 33.35 49.35 639.95 0 7.5 5.5 375.825 326.47
Total 454.73 1133.05 1587.78 1089.1 1027.54 332.385 285.9 3870.96 431.22
Page 113
POWER QUALITY PROBLEMS IN INDUSTRIAL ENTERPRISES AND THEIR MITIGATION TECHNIQUES
MSc. Thesis By Firew Tsegaye/Power System Engineering/BIT/BDU Page 94
Table B3: Squeezed factory load
Production lines
Resistive load
1(unity)
AC drive loads 0.97
Motor 0.85
Dc drives
0.7
compressor ,fans and
pumps 0.8
Pups for
Spraying
0.65
IDLE loads 0.85
Sub Total With idle
loads
Sub Total
Without idle
loads
KW 454.73 1133.1 1089. 1027.5 332.3 285.9 431.2 4753.9 4322.7
KVA 454.73 1168.1 1281.3 1468 415.5 440 507.2 5734.8 5227.6
KW x 386.5 963.1 925.70 873.40 282.53 243.01 366.5 3917.26 3674.24
KVA x 328.5 992.9 1089.1 1247.8 353.17 374 431.1 4759.47 4385.47
KVAR 0 241 573.8 891.17 212 284.3 227 2703.26 2394.21
Table B4: Electrical quantities of each load
Production lines
Active power
(kW)
Reactive power
(kVAR)
Voltage
(kV)
Current
(kA)
Apparent power
(kVA)
UPVC line 1 357 221.24 0.4 1050 420
UPVC line 2 300 185.92 0.4 882.3 352.9
UPVC line 3 225 139.44 0.4 661.76 264.7
UPVC line 4 165 102.25 0.4 485.29 194.11
HDPE line 5 160 99.15 0.4 470.58 188.23
HDPE line 6 234 145.02 0.4 688.23 275.29
HDPE line 7 212 131.38 0.4 623.52 249.41
HDPE line 8 256 158.65 0.4 752.94 301.17
Geo membrane 9 569 352.6 0.4 1673.5 669.41
Green sheet 10 953 590.6 0.4 2802.9 1121.94
Flat hose 11 63.73 39.49 0.4 187.4 74.97
Accessories 12 370.82 232.9 0.4 1105.3 442.14
Page 114
POWER QUALITY PROBLEMS IN INDUSTRIAL ENTERPRISES AND THEIR MITIGATION TECHNIQUES
MSc. Thesis By Firew Tsegaye/Power System Engineering/BIT/BDU Page 95
Table B5: Exist Load Transformer Rating
Voltage
(kV)
Apparent
power (kVA)
Power
factor
Active Power
(kW)
Reactive Power
(kVAR)
Transformer -1 15/0.4 1250 0.85 1000 619.7
Transformer -2 15/0.4 800 0.85 640 396.6
Transformer -3 15/0.4 800 0.85 640 396.6
Table B6: Voltage Unbalance in factory
Voltages Measured Values in (V)
Phase 1 to Neutral (V1 to N) 225.93
Phase 2 to Neutral (V1 to N) 218.48
Phase 3 to Neutral (V1 to N) 221.89
Phase to Phase Voltage Measured Values in (V)
V12 389.95
V13 375.67
V31 381.24
Table B7: Typical Un-improve power factor by Equipment
Equipment Power Factor Power factor
Air Compressor & Pumps (external Motors) 75-80
Hermetic Motors (compressors) 50-80
Arc Welding 35-60
Resistance Welding 40-60
Machining 40-65
Arc Furnaces 75-90
Induction Furnaces (60Hz) 100
Standard Stamping 60-70
High Speed Stamping 45-60
Spraying 60-65
Industrial Heating With resistance, as in ovens or dryers, the
power factor is often closed to
100%.
Welding Electric arc welders generally have a low power factor,
around Other types of machinery or equipment those are likely
to have a low power factor include
60%.
Page 115
POWER QUALITY PROBLEMS IN INDUSTRIAL ENTERPRISES AND THEIR MITIGATION TECHNIQUES
MSc. Thesis By Firew Tsegaye/Power System Engineering/BIT/BDU Page 96
Table B8: Shows the typical power factors of some electrical equipment
Load power factor
Transformers (no load condition) 0.1÷0.15
Motor 0.7÷0.85
Metal working apparatuses:
- Arc welding
- Arc welding compensated
- Resistance welding:
-Arc melting furnace
0.35÷0.6
0.7÷0.8
0.4÷0.6
0.75÷0.9
Fluorescent lamps
-compensated
-uncompensated
0.9
0.4÷0.6
AC DC converters 0.6÷0.95
DC drives 0.4÷0.75
AC drives 0.95÷0.97
Resistive load 1
Table B9: Shows the variation of the transmissible power for MV/LV three-phase
transformers as a function of the cos φ of the load
Power of the
transformer[kVA]
Power of the transformer[kW][cos φ]
0.5 0.6 0.7 0.8 0.9 1
63 32 38 44 50 57 63
100 50 60 70 80 90 100
160 80 96 112 128 144 160
125 63 75 88 100 113 125
200 100 120 140 160 180 200
250 125 150 175 200 225 250
315 185 189 221 252 284 315
400 200 240 280 320 360 400
630 315 378 441 504 567 630
800 400 480 560 640 720 800
1000 500 600 700 800 900 1000
1250 625 750 875 1000 1125 1250
Page 116
POWER QUALITY PROBLEMS IN INDUSTRIAL ENTERPRISES AND THEIR MITIGATION TECHNIQUES
MSc. Thesis By Firew Tsegaye/Power System Engineering/BIT/BDU Page 97
Table B10: Current carrying capacity I/0 of copper single-core cables on perforated
tray
S [mm2] Cu I [A]
XLPE/EPR PVC
25 141 114
35 176 143
50 216 174
70 279 225
95 342 275
120 400 321
150 464 372
185 533 427
240 634 507
300 736 587
500 998 789
630 1151 905
Table B11: maximum compensation of reactive energy (kVAR) at the terminals of
LV asynchronous motors
Maximum compensation of reactive energy (kVAR)
LV motor nominal power (KW)
Number of pairs of poles
1 2 2 2 3 4
22 6 8 9 10
30 7.5 10 11 12.5
37 9 11 12.5 16
45 11 13 14 17
55 13 17 18 21
75 17 22 25 28
90 20 25 25 30
110 24 29 33 37
132 31 36 38 43
160 35 41 44 52
200 43 47 53 61
250 52 57 63 71
280 57 63 70 79
355 67 76 86 98
400 78 82 97 106
450 87 93 107 117
Page 117
POWER QUALITY PROBLEMS IN INDUSTRIAL ENTERPRISES AND THEIR MITIGATION TECHNIQUES
MSc. Thesis By Firew Tsegaye/Power System Engineering/BIT/BDU Page 98
Table B 12: Load survey of Production Line one Load Type
No. Location Nxwxn
(N)Repetition,(W) wattage (n) no. Ofw/circle
KVA
Resistive load power (KW)
compensated
(KW)
Non compen sated
(KW)
3-phase Ampere (A)
1-phase Ampere (A)
Power Factor
MIXER MACHINE
1. Hot mixer motor 1x47/67 67 120
2. Cold mixer motor 1x11x1 11 22.5 0.84
3. Sucker Motor 1x2.2x1 2.2 5.6 0.81
EXTRUSSION MACHINE
4. Feed motor 1x1.5x1 1.5 3.7
5. Extruder main DC motor 1x110x1 110 275 0.79
6. Main DC motor cooling fan 1x3x1 3 6.4 0.87
7. Barrel cooling Fans 5 consecutive 5x0.55x1 2.75 6.75
8. barrel Heaters- 1 (ø375x215) 1x3.75x1 3.75 7.5
9. barrel Heaters- 2 (ø340x390 1x10x1 10 20
10. barrel Heaters - 3 (ø340x380 1x10x1 10 20
11. barrel Heaters- 4 ( ø340x320 1x8.5x1 8.5 17
12. barrel Heaters- 5 (ø280x260 1x5.3x1 5.3 10.6
13. barrel Heaters- 6 ø280x240 1x5.3x1 5.3 10.6
14. Die -core Heaters- (220x160)x1pcs 1x2.5x1 2.5 5
MOLD (DIE ) MACHINE
15. Die -Heaters-1- (ø 450x136)x1 pcs 1x3.6x1 3.6 7.2
16. Die -Heaters-2,3,- (ø 730x110)x4 2x1.5x4 12 24
17. Die -Heaters-4,5,6, - (ø 850x125)x2 3x3.8x2 22.8 45.6
18. Die -Heaters-7,8- (ø 1040x170)x2 2x6.4x2 25.6 51.2
19. Die -Heaters--9-(ø 1040x120)x2pcs 1x4.5x2 9 18
20. Die -Heaters-10,11- (ø 910x150)x2 2x5x2 20 40
21. Die -Heaters- 12- (ø 720x123)x1 pcs 1x5.6x1 5.6 11.2
22. Die -Heaters-13-(ø 660x235)x4 pcs 1x2.8x4 11.2 22.4
23. Die -Heaters-14- (ø 910x150)x2 pcs 1x5x2 10 20
24. Die -Heaters-15- (ø 710x230)x4 pcs 1x3x4 12 24
25. Die -Heaters-16- (ø 475x300)x4 pcs 1x2.6x4 10.4 20.4
26. Die -Heaters-17,18- ( ø 570x260)x4 2x2.7x4 21.6 43.2
VACUUM TANK MACHINE
27. Vacuum pump motor 2pcs 7.5x2 15 24
28. Water pump motor 2pcs 7.5x2 15 30 0.88
29. Vacuum screw motor 1x1 1 2
COOLING TANK MACHINE 1&2
30. 1st cooling Water pump motor 2pcs 5.5x2 11 22.2 0.88
31. 2nd cooling Water pump motor 2pcs 5.5x2 11 22.2 0.88
HALL OFF MACHINE
32. Hall Off AC motor 4pcs 4x1.1 4.4 10.4
33. Haul off adjuster 2x0.75 1.5 4.06 0.75
CUTTER MACHINE
34. Cutter feed & retract x1 pcs 1.1 1.1 2.2 0.78
35. Cutter -rotation x1 pcs 3 3 6.8 0.87
36. Cutter- revolution x1 pcs 4 4 8
BELLING MACHINE 1&2
37. Heater rode 8x2x2 32 64
38. Pipe puller 2x2.2x1 8.8 17.6
39. Fro and back rotation 2x0.35x1 0.7 1.15
40. Oil pump motor 2x7.5x1 15 15
41. Pipe rotation motor 4x0.09x 0.36 0.72
Sub Total load 241.15/3 9.9 278.41 604.28 481.9
Total load 358.69 =80.38
Speed variable load(feeder, dc motor 110
compensated (heaters,+ ac drives 80.38 +9.9=90.28
Idle loads(pump1/2of belling) No.30,32 11+1+1.5=13.5
Variable loads(mixer, sucker, cutter), fan, vacuum, &cooling pump, haul off)
67+11+ 2.2+3+2.75+15+11+1.1+3+8.8+0.7+15+0.36 =140.91
Page 118
POWER QUALITY PROBLEMS IN INDUSTRIAL ENTERPRISES AND THEIR MITIGATION TECHNIQUES
MSc. Thesis By Firew Tsegaye/Power System Engineering/BIT/BDU Page 99
Table B 13: Load survey of Production Line two
Load Type
No. Location Nxwxn K
V
A
Resistive
load
power
(KW)
compen
sated
(KW)
Non
compens
ated
(KW)
3-phase
Ampere
(A)
1-phase
Ampere
(A)
Power
Factor
MIXER MACHINE
1. Hot mixer motor (47/67KW) 67 120 2. Cold mixer motor 11 11 22.5 0.84
3. Sucker Motor 2.2 2.2 5.6 0.81 EXTRUSSION MACHINE
4. Feed motor 1.5 3.7 5. Extruder main DC motor 110 275 0.79 6. Main motor cooling fan 3 6.4 0.87
7. Barrel cooling Fans 5 consecutive 1.35A
5x0.55x1 2.75 6.75
8. barrel Heaters- 1 (ø375x215) 1x3.75x1 3.75 7.5
9. barrel Heaters- 2 (ø340x390 1x10x1 10 20
10. barrel Heaters - 3 (ø340x380 1x10x1 10 20 11. barrel Heaters- 4 ( ø340x320 1x8.5x1 8.5 17
12. barrel Heaters- 5 (ø280x260 1x5.3x1 5.3 10.6 13. barrel Heaters- 6 ø280x240 1x5.3x1 5.3 10.6 14. Die -core Heaters- (220x160)x1pcs 1x2.5x1 2.5 5
MOLD (DIE ) MACHINE 15. Die -Heaters-1- (ø 390x130)x1 pcs 1x3.5x1 3.5 7.2
16. Die -Heaters-2,3- (ø 740x232)x4 p 1x4.8x2 9.6 24 17. Die -Heaters-4- (ø 740x100)x2 pcs 2x6.2x2 24.8 45.6
18. Die -Heaters-5- (ø 620x130)x2 pcs 1x5.8x2 11.6 51.2
19. Die -Heaters-6- (ø320x152)x4pcs 1x3.5x4 14 18 20. Die -Heaters-7- (ø 470x140)x4pcs 2x4.8x4 19.2 40
VACUUM TANK MACHINE 21. Vacuum pump motor 2pcs 5.5x2 11 22.2
22. Water pump motor 2pcs 5.5x2 11 30 0.88 23. Vacuum screw motor 1x1 1 2
COOLING TANK MACHINE 24. 1st cooling Water pump motor 2pcs 5.5x2 11 22.2 0.88
25. 2nd cooling Water pump motor 2pcs 5.5x2 11 22.2 0.88
HALL OFF MACHINE 26. Hall Off AC motor 4pcs 4x1.1 4.4 10.4
27. Haul off adjuster 2x0.75 1.5 4.06 0.75
CUTTER MACHINE
28. Cutter feed & retract 1x1.1 1.1 2.2 0.78 29. Cutter -rotation 1x3 3 6.8 0.87
30. Cutter- revolution AC motor 1x4 4 8
BELLING MACHINE
31. Heater rode 4 x1.5 6 12 32. Pipe puller 1x2.2 4.4
33. Fro and back rotation 1x0.35 0.35 1.12 34. Oil pump motor 1x7.5 7.5 15
35. Pipe rotation motor 2x0.09 0.18 0.64
Sub Total 134.5/3=44.83
9.9 257.98 873.47 288.7
Total 308.713
Speed variable load dc motor 110
compensated (heaters, ac drives) 44.83 +9.9=54.73
Idle loads pump1/2of belling 11+1.5=12.5
Variable loads mixer, sucker, cutter, fan, vacuum, &cooling pump, haul off
67+11+ 2.2+3+2.75+11+11+1.1+3+4.4+0.35+7.5+0.18 =124.48
Page 119
POWER QUALITY PROBLEMS IN INDUSTRIAL ENTERPRISES AND THEIR MITIGATION TECHNIQUES
MSc. Thesis By Firew Tsegaye/Power System Engineering/BIT/BDU Page 100
Table B 14: Load survey of Production Line three
Load Type
No. Location Nxwxn ( KVA Resistive load power (KW)
Compensated(KW)
Non Compensated(KW)
3-phase Ampere (A)
1-phase Ampere (A)
Power Factor
MIXER MACHINE
1. Hot mixer motor (47/67KW) 67 120
2. Cold mixer motor 11 11 22.5 0.84
3. Sucker Motor 2.2 2.2 5.6 0.81
EXTRUSSION MACHINE
4. Feed motor 0.75 2.03
5. Extruder main DC motor 55 275 0.79
6. Taco generator 0.022 0.2
7. Main motor cooling fan 1.1 2.6 0.84
8. Barrel cooling ,Fans 3consecutive 1.2A 3x0.55x1 2.75 3.6
9. Barrel Heaters- 1 (ø320x300) 1x5x1 5 7.5
10. Barrel Heaters- 2 (ø290x390) 1x10x1 10 20
11. Barrel Heaters - 3 (ø260x380) 1x10x1 10 20
12. Barrel Heaters- 4 ( ø240x320) 1x8.5x1 8.5 17
13. Die -core Heaters- (210x160)x1pcs 1x2x1 2 5
MOLD (DIE ) MACHINE
14. Die -Heaters-1- (ø 330x115) x1 1x2.6x1 2.6 7.2
15. Die -Heaters-2- (ø 520x120) x1 1x4.5x1 12 24
16. Die -Heaters-3- (ø 520x65)x1 pcs 1x2.4x1 2.4 45.6
17. Die -Heaters-, 4- (ø 520x175)x1 1x6.5x1 6.5 51.2
18. Die -Heaters -,5-(ø 436x95)x1pcs 1x4.5x1 4.5 18
19. Die -Heaters-,6,7- (ø 310x110)x2 2x2.5x1 5 40
20. Die -Heaters-8- (ø 150x135)x1 pcs 1x1.4x1 1.4 11.2
21. Die -Heaters-9-(ø 296x80)x1pcs 1x1.6x1 1.6 22.4
22. Die -Heaters-10- (ø 95x150)x1 pcs 1x0.65x1 0.65 20
23. Die -Heaters-11- (ø 296x80)x1 pcs 1x1.6x1 1.6 24
24. Die -Heaters-12- (ø 296x40)x1 pcs 1x0.8x1 0.8 20.4
25. Die-Heaters-13- ( ø 296x110)x1pcs 1x2.5x1 2.5 43.2
VACUUM TANK MACHINE
26. Vacuum pump motor 1pcs 4 4 8.2 0.88
27. Vacuum screw 1pcs 0.37 0.37 1.12
28. Water pump motor 1pcs 5.5 5.5 10.9 0.88
29. Vacuum screw motor 1x1 1 2
COOLING TANK MACHINE
30. 1st cooling Water pump motor 1 5.5 5.5 11.1 0.88
31. 2nd cooling Water pump motor 1 5.5 5.5 11.1 0.88
HALL OFF MACHINE
32. Hall Off AC motor 4pcs 4x1.1 4.4 10.4
33. Haul off adjuster 1pcs 0.75 0.75 1.9 0.75
CUTTER MACHINE
34. Cutter feed & retract 0.35 0.35 1.12 0.78
35. Cutter -rotation 1.5 1.5 3.67 0.87
36. Cutter- revolution 1.5 1.5 3.7
BELLING MACHINE 1&2
37. Heater rode 4x1.5 6 12
38. Tow/Pipe puller motor 1x2.2 4.4
39. Oil pump motor 1pcs 1.5 1.5 3.7
40. Fro and back rotation motor 1pcs 1x0.09 0.18 0.64
41. Pipe rotation motor 1pcs 2x0.09 0.18 0.64
Sub total 83.05/3=27.68 6.25 168.752 499.72 408.7
Total 202.713
Speed variable load feeder, dc motor 55
compensated (heaters, ac drives) 27.68 +5.5=33.18
Idle loads pump1/2of belling 5.5+0.75=6.25
Variable loads mixer, sucker, cutter, fan, vacuum, &cooling pump, haul off
67+11+ 2.2+1.1+2.75+4+0.37+5.5+5.5+0.35+1.5+4.4+1.5+0.18+0.18 =107.53
Page 120
POWER QUALITY PROBLEMS IN INDUSTRIAL ENTERPRISES AND THEIR MITIGATION TECHNIQUES
MSc. Thesis By Firew Tsegaye/Power System Engineering/BIT/BDU Page 101
Table B 15: Load survey of Production Line four
Load Type
No. Location Nxwxn ( KVA)
Resistive load power (KW)
Compensated (KW)
Non Compensated (KW)
3-phase Ampere (A)
1-phase Ampere (A)
Power Factor
MIXER MACHINE
1. Hot mixer motor 47/67 67 120 2. Cold mixer motor 11 11 22.5 0.84
3. Sucker Motor 2.2 2.2 4.7 0.81 EXTRUSSION MACHINE
4. Barrel cooling Fans 3 consecutive 1.35A 3x0.55x1 1.65 3.3
5. Feed motor 0.75 0.75 2.03 6. Extruder main AC motor 37 37 75 0.79
7. Barrel Heaters- 1 (ø265x290) 1pcs 1x4.5x1 4.5 10 8. Barrel Heaters- 2 (ø230x160) 1pcs 1x4x1 4 8.4
9. Barrel Heaters - 3 (ø230x245) 1pcs 1x5x1 5 11 10. Barrel Heaters- 4 ( ø190x240) 1pcs 1x4x1 4 8.4
11. Die -core Heaters- (220x120) 1pcs 1x2x1 2 5
MOLD (DIE ) MACHINE
12. Die -Heaters -1- (ø 210x120)x1 pcs 1x2x1 2 4.2
13. Die -Heaters -2, 3- (ø 215x115)x1 pcs 2x3.4x1 6.8 13.8 14. Die -Heaters -4,5,- (ø 80x65)x1 pcs 2x0.4x1 1.8 45.6
15. Die -Heaters - 6, 7- (ø176x106)x1 pcs 2x0.3x1 0.6 51.2 16. Die -Heaters -8,9- (ø 196x80)x1pcs 2x1.1x1 2.2 18
17. Die -Heaters-10,11- (ø 196x100)x1 pcs 2x1.3x1 2.6 40
VACUUM TANK MACHINE
18. Vacuum pump motor 1pcs 4x2 8 16.4 19. Water pump motor 1pcs 2.2x2 4.4 9.4 0.88
20. Vacuum screw motor 1x1 1 2
COOLING TANK MACHINE
21. 1st cooling Water pump motor 2pcs 5.5x2 11 22.2 0.88
22. 2nd cooling Water pump motor 2pcs 5.5x2 11 22.2 0.88
HALL OFF MACHINE
23. Hall Off motor 4pcs 4x1.1 4.4 10.4 24. Haul off adjuster 2x0.75 1.5 4.06 0.75
CUTTER MACHINE 25. Cutter feed & retract 1x1.1 1.1 2.2 0.78
26. Cutter -rotation 1x3 3 6.8 0.87 27. Cutter- revolution 1x4 4 8
BELLING MACHINE 28. Tow/ Pipe puller motor 1x2.2 4.4
29. Heater rode 4x0.5 2 4
30. Oil pump motor 1.5 1.5 3.7 31. Fro and back rotation motor 1pcs 1x0.09 0.18 0.64
32. Pipe rotation motor 1pcs 2x0.09 0.18 0.64
Subtotal 37.5/3=12.5
46.15 116.06 259.17 294.6
Total 182.2
compensated (heaters, ac drives) 12.5.5+46.15=58.7
Idle loads pump1/2of belling 1+5.5+0.75 = 7.25
Variable loads mixer, sucker, cutter, fan, vacuum, &cooling pump, haul off
67+11+ 2.2+1.65+8+4.4+11+1,1+3+4.4+1.5+0.18+0.18 =116.25
Page 121
POWER QUALITY PROBLEMS IN INDUSTRIAL ENTERPRISES AND THEIR MITIGATION TECHNIQUES
MSc. Thesis By Firew Tsegaye/Power System Engineering/BIT/BDU Page 102
Table B 16: Load survey of Production Line five
Load Type
No. Location Nxwxn K V A
Resistive load Active power (KW)
Compensated (KW)
Non Compensated (KW)
3-phase Ampere (A)
1-phase Ampere (A)
Power Factor
MIXER MACHINE
2. Stripper main motor 1pcs 0.55 0.55 1.15
3. Stripper fan motor 1pcs 0.085 0.085 0.19
4. Stripper heater 4pcs 0.18 0.72 1.5 EXTRUSSION MACHINE
4. Auto loader /Feed motor 3 3 6 0.81
5. Extruder main DC motor 75 75 188 0.79
6. Main DC motor cooling fan 3 6.4 0.87
7. Barrel cooling Fans 4 consecutive 1.35A
4x0.55x1 2.25 6.75
8. Barrel Heaters- 1,2,3,4 (ø160x350) 4x3.5x1 14 28
9. Die -core Heaters- (120x80)x1pcs 1x0.8x1 0.8 1.6
MOLD (DIE ) MACHINE
10. Die -Heaters-1,2- (ø 220x45) x2pcs 2x0.95 1.9 4
11. Die -Heaters-3- (ø 110x55) x1 pcs 1x0.65 0.65 1.5
12. Die -Heaters-4- (ø 180x45)x1 pcs 1x0.7x1 0.7 1.5
13. Die -Heaters-4,5,6- (ø 280x130)x3 3x2.8x1 7.4 15
14. Die -Heaters -5-(ø 120x80)x1pcs 1x0.8x1 0.8 1.6
VACUUM TANK MACHINE
15. Vacuum pump motor 2pcs 2.2x2 4.4 8.8 0.88
16. Water pump motor 2pcs 5.5x2 11 24
17. Vacuum screw motor 1x1 1 2
COOLING TANK MACHINE
18. 1st cooling Water pump motor 2pcs 5.5x2 11 22.2 0.88
HALL OFF MACHINE
19. Hall Off AC motor 4pcs 4x2.2 8.8 18
20. Haul off adjuster 2x0.75 1.5 4.06 0.75
CUTTER MACHINE
21. Cutter feed & retract motor 1.1 1.1 2.2 0.78
22. Cutter -rotation motor 3 3 6.8 0.87
23. Cutter- revolution AC motor 4 4 8
WINDER MACHINE
24. Winder motor 2x5.5 11 22.2
Subtotal 26.97/3=9 26.8 82.85 348.45 53.2
Total 149.685
Speed variable load feeder, dc motor 75
compensated (heaters, ac drives) 9+ 3+8.8+4+11 =35.8
Idle loads pump1/2of belling 11+1=12
Variable loads mixer, sucker, cutter, fan, vacuum, &cooling pump, haul off
0.55+0.085+3+2.25+4.4+11+1.5+1.1+3 =26.885
Page 122
POWER QUALITY PROBLEMS IN INDUSTRIAL ENTERPRISES AND THEIR MITIGATION TECHNIQUES
MSc. Thesis By Firew Tsegaye/Power System Engineering/BIT/BDU Page 103
Table B 17: Load survey of Production Line six
Load Type
No. Location Nxwxn
KVA)
Resistive load Active power (KW)
Compensated (KW)
Non Compensated (KW)
3-phase Ampere (A)
1-phase Ampere (A)
Power Factor
MIXER MACHINE
42. Mixer motor 1pcs 3 3 6 43. Stripper main motor 1pcs 1.1 1.1 2.5
44. Stripper fan motor 1pcs 0.085 0.085
0.19
45. Stripper heater 4pcs 0.18 0.72 1.5 EXTRUSSION MACHINE
46. Autoloader motor 1.5 3.7 47. Extruder main DC motor 160 397 0.79
48. Main motor cooling fan 3 6.4 0.87 49. Barrel cooling Fans 4 consecutive
1.4A 4x0.37x1
1.48 5.6
50. Barrel Heaters- 1 (ø160x565) 1 1x8.5x4 34 70
51. Die -core Heaters- (120x80)x2pcs 1x0.8x2 1.6 3.2
MOLD (DIE ) MACHINE
52. Die -Heaters-1- (ø 245x110)x1 pcs 1x2.4x1 2.4 5
53. Die -Heaters-2,3,- (ø 330x75)x2 pcs 2x2.4x2 9.6 24 54. Die -Heaters-4,5,6, - (ø 530x75)x1 3x2.15x
2 13 26
55. Die -Heaters-7,8- (ø 400x75)x2 pcs 2x1.4x2 9.6 19.2
56. Die -Heaters-9-(ø 510x110)x2pcs 1x2.75x2
4.5 9
57. Die -Heaters-10,11- (ø 410x80)x2 2x1.3x2 5.2 10.4
58. Die -Heaters- 12- (ø 430x80)x1 pcs 1x1.5x1 1.5 3
VACUUM TANK MACHINE
59. Vacuum pump motor 2pcs 4x2 8 16 0.88 60. Water pump motor 2pcs 5.5x2 11 24
61. Vacuum screw motor 1x1 1 2
COOLING TANK MACHINE
62. 1st cooling Water pump motor 2pcs 5.5x2 11 22.2 0.88 63. 2nd cooling Water pump motor 2pcs 5.5x2 11 22.2 0.88
HALL OFF MACHINE 64. Hall Off motor 4pcs 4x2.2 8.8 17
65. Haul off adjuster 2x0.75 1.5 4.06 0.75
CUTTER MACHINE 66. Cutter feed & retract 1.5 1.5 3 0.78
67. Cutter -rotation 3 3 6 0.87 68. Cutter- revolution 1.1 1.1 2.6
Subtotal 82.12/3=27.37
9.9 225.965
538.45 171.3
Total 259.7
Speed variable load feeder, dc motor 160
compensated (heaters, ac drives) 27.37+8.8 +1.1=37.27
Idle loads pump1/2of belling 11+1=12
Variable loads mixer, sucker, cutter, fan, vacuum, &cooling pump, haul off
3+1.1+0.85+5+3+1.48+8+11+11+1.5+1.5+3 =50.43
Page 123
POWER QUALITY PROBLEMS IN INDUSTRIAL ENTERPRISES AND THEIR MITIGATION TECHNIQUES
MSc. Thesis By Firew Tsegaye/Power System Engineering/BIT/BDU Page 104
Table B 18: Load survey of Production Line seven
Load Type
No. Location Nxwxn ( KVA)
Resistive load Active power (Kw)
Compensated (KW)
Non Compensated (KW)
3-phase Ampere (A)
1-phase Ampere (A)
Power Factor
MIXER MACHINE
1. Mixer motor 1pcs 1x3x1 3 6 2. Stripper main motor 1pcs 1x1.1x1 1.1 2.5
3. Stripper fan motor 1pcs 1x0.085x1 0.085
0.19
4. Stripper heater 4pcs 1x0.18x1 0.72
1.5
EXTRUSSION MACHINE 5. Feed motor 1x1.5x1 1.5 3.7
6. Extruder main DC motor 1x110x1 110 275 0.79 7. Taco generator 0.022x1 0.0
22 0.2
8. Main motor cooling fan 1x3x1 3 6.4 0.87
9. Barrel cooling Fans 5 consecutive 1.35A 5x0.55x1 2.75
6.75
10. Barrel Heaters- 1 (ø160x565) 1 1x8.5x4 34 70 11. Die -core Heaters- (120x80)x2pcs 1x0.8x2 1.6 3.2
MOLD (DIE ) MACHINE 12. Die -Heaters-1- (ø 245x110)x1 pcs 1x2.4x1 2.4 5
13. Die -Heaters-2,3,- (ø 330x75)x2 pcs 2x2.4x2 9.6 24 14. Die -Heaters-4,5,6, - (ø 530x75)x1 3x2.15x2 13 26
15. Die -Heaters-7,8- (ø 400x75)x2 pcs 2x1.4x2 9.6 19.2 16. Die -Heaters-9-(ø 510x110)x2pcs 1x2.75x2 4.5 9
17. Die -Heaters-10,11- (ø 410x80)x2 2x1.3x2 5.2 10.4
18. Die -Heaters- 12- (ø 430x80)x1 pcs 1x1.5x1 1.5 3
VACUUM TANK MACHINE
19. Vacuum pump motor 2pcs 4x2 8 16 20. Water pump motor 2pcs 5.5x2 11 22.2 0.88
21. Vacuum screw motor 1x1 1 2
COOLING TANK MACHINE
22. 1st cooling Water pump motor 2pcs 5.5x2 11 22.2 0.88 23. 2nd cooling Water pump motor 2pcs 5.5x2 11 22.2 0.88
HALL OFF MACHINE 24. Hall Off motor 4pcs 4x1.1 4.4 10.4
25. Haul off adjuster 2x0.75 1.5 4.06 0.75
CUTTER MACHINE 26. Cutter feed & retract 0.35 0.3
5 1.12 0.78
27. Cutter -rotation 3 6.8 0.87
28. Cutter- revolution AC motor 4 4 8
WINDER MACHINE
29. AC Winder 2x7.5x1 15 30 0.84
Subtotal 81.4./3=27.13
23.4
168.027
445.22
417.9
Total 201.83
Speed variable load feeder, dc motor 110
compensated (heaters, ac drives) 27.13+ 23.4 =32.4
Idle loads pump1/2of belling 11+1=12
Variable loads mixer, sucker, cutter, fan, vacuum, &cooling pump, haul off
3+1.1+0.85+1.5+2.75+1.48+8+11+11+1.5+1.5+0.35+3 =47.43
Page 124
POWER QUALITY PROBLEMS IN INDUSTRIAL ENTERPRISES AND THEIR MITIGATION TECHNIQUES
MSc. Thesis By Firew Tsegaye/Power System Engineering/BIT/BDU Page 105
Table B 19: Load survey of production line eight
Load Type
No. Location Nxwxn ( KVA)
Resistive load Active power (KW)
Compensated (KW)
Non Compensated (KW)
Ampere (A)
Power Factor
MIXER MACHINE
1. mixer motor 1.1 22.5
0.84
2. Sucker Motor 2.2 5.6 0.81 EXTRUSSION MACHINE
3. Feed motor 1.5 3.7 4. Extruder main AC motor 37 74 0.79
5. Main motor cooling fan 3 6.4 0.87
6. Barrel cooling Fans 5 consecutive 1.35A 5x0.55x1 2.75
6.75
7. Barrel Heaters- 1 (ø160x565) 1 1x2.2x4 8.8 17
8. Die -core Heaters- (120x80)x2pcs 1x0.8x2 1.6 3.2
9. MOLD (DIE ) MACHINE 10. Die -Heaters-1- (ø 245x110)x1 pcs 1x2.4x1 2.4 5
11. Die -Heaters-2,3,- (ø 330x75)x2 pcs 2x2.4x2 9.6 24 12. Die -Heaters-4,5,6, - (ø 530x75)x1 3x2.15x2 13 26
13. Die -Heaters-7,8- (ø 400x75)x2 pcs 2x1.4x2 9.6 19.2
VACUUM TANK MACHINE 14. Vacuum pump motor 2pcs 5.5X1 5.5 24
15. Water pump motor 2pcs 1X5.5 5.5 30 0.88 16. Vacuum screw motor 1x1 1 2
COOLING TANK MACHINE 17. 1st cooling Water pump motor 2pcs 5.5x2 11 22.2 0.88
18. 2nd cooling Water pump motor 2pcs 5.5x2 11 22.2 0.88
HALL OFF MACHINE
19. Hall Off motor 4pcs 4x1.1 4.4 10.4
20. Haul off adjuster 2x0.75 1.5 4.06 0.75
CUTTER MACHINE
21. Cutter feed & retract 1.1 2.2 0.78 22. Cutter -rotation 3 6.8 0.87
23. Cutter- revolution 4 8
WINDING MACHINE
24. Winder 2x7.5x1 15 30 0.84
Subtotal 45/3=15
60.4 35.15 589.81 417.9
Total 122.55
compensated (heaters, ac drives) 15+ 60.4 =75.4
Idle loads pump1/2of belling 11+1=12
Variable loads mixer, sucker, cutter, fan, vacuum, &cooling pump, haul off
1.1+2.2+1.5+2.75+5.5+5.5+11+1.5+1.1+3 =35.15
Page 125
POWER QUALITY PROBLEMS IN INDUSTRIAL ENTERPRISES AND THEIR MITIGATION TECHNIQUES
MSc. Thesis By Firew Tsegaye/Power System Engineering/BIT/BDU Page 106
Table B 20: Load survey of Production Line nine, geo membrane 0.5 mm up to 2
mm
Nxwxn Load Type
No. Location ( KVA)
Resistive load power (KW)
Compensated (KW)
Non Compensated (KW)
3-phase Ampere (A)
1-phase Ampere (A)
Power Factor
MIXER MACHINE 1. 1 Mixer motor 1 1x4x1 4 8 0.87 2. Sucker Motor 1 1x2.2x1 3 6 0.88
3. Blower AC motor 1,2 2x18.5x1 37 71 0.9 4. Blower AC motor 1 1x30x1 30 56.9 0.9 5. EXTRUSSION MACHINE 6. Extruder main DC motor 1 1x315x1 315 630 0.87
7. Main DC motor fan 1x3x1 3 6 0.87 8. Hydraulic Oil pump 1x3x1 3 6
9. Gear box Oil pump 1x3x1 3 6
10. Barrel cooling Fans 9 consecutive 1.5A 9x0.75x1 6.75 13.5 11. Barrel cooling Fans 2 consecutive 1.35A 2x0.55x1 2.7 6.75
12. barrel Heaters -1- (ø375x215) 11x8.5x1 3.75 7.5 13. barrel Heaters -2- (ø340x390) 2x5.8x1 10 20
MOLD (DIE ) MACHINE 14. Die lip-Heaters-1- (ø 1865x85)x12pcs 12x1x1 12 24
15. Die shell - Heaters-2,3,- (ø 1865x70)x4pcs
12x1.5x2 36 72
16. Die base bottom-Heaters-4, (ø1 850x98)x12pcs
12x1x1 12 24
17. Die bottom -Heaters-7,8- (ø 1830x ø 1500x170)x12
12x2x1 24 48
18. Die bottom -Heaters-7,8- (ø 1060x ø x400)x12pcs
12x2x1 24 48
19. Die - neck-Heaters-9-(ø 1040x120)x2pcs 1x4.5x2 9 18 20. Die-neck-Heaters-10,11- (ø
910x150)x2pcs 2x5x2 20 40
21. Adapter -Heaters- 12- (ø 720x123)x1pcs 1x5.6x1 5.6 11.2
22. Adapter -Heaters-13-(ø 660x235)x4 pcs 1x2.8x4 11.2 22.4 23. Adapter -Heaters-14- (ø 910x150)x2 pcs 1x5x2 10 20
24. Feeder-Heaters-15- (ø 710x230)x4 pcs 1x3x4 12 24 25. Feeder-Heaters-16- (ø 475x300)x4 pcs 1x2.6x4 10.4 20.4
26. Die -Heaters-17,18- (ø 570x260)x4 pcs 2x2.7x4 21.6 43.2
HALL OFF MACHINE
27. Hall Off up stair DC motor 2pcs 2x11x1 22 44 0.75 28. Hall Off DC motor Taco generator 2x0.022 0.044 0.1
29. Haul off adjuster 8x2.2x1 17.6 35.2 0.75 30. Adjuster 3x0.55x1 1.75 3.55 0.78
WINDING MACHINE
31. Winder A&B DC motor 2x7.5x1 15 30 0.84 32. Winder DC motor fun 2x0.18x1 0.36 0.72
33. Winder A&B DC motor Taco generator 2x0.022 0.044 0.1 34. Roller rotation 1x0.55x1 0.55 1.15 0.84
35. Rewinder 2x1.5x1 3 6
Subtotal 221.55/3=73 70 400.798 930.97 442.7
Total 524.63
Speed variable load feeder, dc motor 315
compensated (heaters, ac drives) 73.85+70 =143.85
Idle loads pump1/2of belling 17.6+1.75=18.35
Variable loads mixer, sucker, cutter, fan, vacuum, &cooling pump, haul off
4+3+3+3+6.75+2.7+22+15+0.36+0.55 =47.43
Page 126
POWER QUALITY PROBLEMS IN INDUSTRIAL ENTERPRISES AND THEIR MITIGATION TECHNIQUES
MSc. Thesis By Firew Tsegaye/Power System Engineering/BIT/BDU Page 107
Table B 21: Production Line ten, green sheet 0.1 mm up 0.5 to mm
Load Type
No. Location Nxwxn Apparent Power ( KVA)
Resistive load Acpower (KW)
Compensated (KW)
Non Compensated (KW)
3-phase Ampere (A)
1-phase Ampere (A)
MIXER MACHINE
1. 1 Mixer motor 1,2,3 3x3x1 9 18 0.87
2. Sucker Motor 1,2,3 3x2.2x1 6.6 6 0.88 3. Blower motor 1,2 2x22x1 44 88 0.9
4. Blower motor 1 1x37x1 37 74 0.9
EXTRUSSION MACHINE
5. Extruder main AC motor 1,2 2x200x1 400 800 0.87 6. Extruder main AC motor 1 1x280x1 280 560 0.87
7. Barrel cooling Fans 5 consecutive 1.3A 29x0.75x1 2.75 6.75 8. barrel Heaters- 1 (ø375x215) 1x3.75x1 3.75 7.5 9. barrel Heaters- 2 (ø340x390) 1x10x1 10 20
MOLD (DIE ) MACHINE 10. Die lip-Heaters-1÷18- (ø 2090x85)x18pcs 18x1x1 18 36
11. Die shell - Heaters-1÷54- (ø 2000x150)x54 54x1.5x1 81 162 12. Die bottom-Heaters-1÷18-(ø1985x98)x18 18x1x1 18 36
13. Die bottom -Heaters-1÷12-(ø 1965x ø 1465x250)x12
12x3x1 3.6 7.2
14. Die - neck-Heaters-1,2-(ø 814x55)x2pcs 1x2.2x2 4.4 18
15. Die -Heaters-1÷4- (ø 984x90)x2pcs 4x4x1 8 16 16. Die -Heaters-1÷4- (ø 750x ø 550x200)x4pcs 4x1.5x1 6 12
17. Die -Heaters-1÷4- (ø 880x ø 450x250)x4pcs 4x2x1 8 16 18. Die -Heaters-1÷4- (ø 1530x110)x4pcs 4x1.5x1 6 12
19. Die -Heaters-1÷4- (ø 1530x110)x4pcs 4x2x1 8 16 20. Die -Heaters-1 - ( ø 340x185)x1 pcs 1x1.6x1 1.6 3.2
21. Adapter -Heaters -1- (ø 120x200)x6pcs 6x2x1 12 24 22. Adapter -Heaters-1-(ø 160x160)x3 pcs 3x2x1 6 12
23. Adapter -Heaters-1- (ø 100x100)x1 1x0.8x1 0.8 1.6 24. Feeder-Heaters-1- (ø 216x100)x1 pcs 1x1.6x1 1.6 3.2
25. Feeder-Heaters-1- (ø 350x156)x1 pcs 1x3.2x1 6.4 12.8 26. Feeder-Heaters-1- (ø 360x50)x2x3 pcs 6x0.7x1 4.2 8.4 27. Feeder-Heaters-1- (ø 360x60)x2x3 6x0.85x1 5.1 10.2
28. Feeder -Heaters-1- ( ø 206x350)x18 18x3.4x1 61.2 122.4 29. Feeder-Heaters-1- (ø 250x350)x8 pcs 8x8.2x1 65.6 131.2
30. Feeder-Heaters-1- (ø 250x250)x2 pcs 2x5.9x1 11.8 23.6 HALL OFF MACHINE
31. Hall Off AC motor 4pcs 4x1.1 4.4 10.4 32. Haul off adjuster 8x0.75 6 12 0.75
WINDING MACHINE
33. Winder AC motor 2x7.5x1 15 30 0.84 34. Roller 1x2.2x1 22 45 0.84
35. Winder A&B DC motor 2x7.5x1 15 30 0.84 36. Winder DC motor fun 2x0.18x1 0.36 0.72
37. Winder A&B DC motor Taco generator 2x0.022 0.044 0.1 38. Roller rotation 1x0.55x1 0.55 1.15 0.84 39. Rewinder 2x1.5x
1 3 6
Subtotal 351.05/3 780.4 59.26 1677.18 717.3
Total 962.66 =117
Speed variable load feeder, dc motor 0
compensated (heaters, ac drives) 44+37+400+280+4.4+15=780.4 +117=
Idle loads pump1/2of belling 6
Variable loads mixer, sucker, cutter, fan, vacuum, &cooling pump, haul off
9+6.6+2.75+22+15+0.36+0.55+3=59.26
Page 127
POWER QUALITY PROBLEMS IN INDUSTRIAL ENTERPRISES AND THEIR MITIGATION TECHNIQUES
MSc. Thesis By Firew Tsegaye/Power System Engineering/BIT/BDU Page 108
Table B 22: Load survey of Production Line eleven, flat hose
Load Type
No. Location Nxwxn KVA
Resistive load power (KW)
Compensated (KW)
Non Compensated (KW)
Ampere (A)
Power Factor
EXTRUSSION MACHINE
25. Material sucker/ Feed motor 0.18 0.4 26. Material heater blower motor 0.155 0.15
5 0.3
27. Extruder main AC motor 37 37 72 0.79
28. Main motor cooling fan 3 3 6.4 0.87 29. Barrel cooling Fans 4 consecutive 1.35A 4x0.25x1 1 2.15
30. Barrel Heaters- 1 (ø375x215) 12 pcs 12x0.4x1 4.8 9.6
31. Barrel screen Heaters- 2 (ø340x390) 4x0.3x1 1.2 20 32. Material Heaters - 3 (ø340x380 1x4x1 4 8
33. Fiber adjuster motor 2x1.5 3 6
MOLD (DIE ) MACHINE
34. Die -Heaters-1- (ø 450x136)x1 pcs 1x4x2 8 8 35. Die -Heaters-2,3,- (ø 730x110)x4 pcs 2x2.4x1 2.4 4.8
WEAVING MACHINE 36. Weaving motor 4pcs 4x1.1 4.4 10.4
COOLING TANK MACHINE 37. 1st cooling Water pump motor 2pcs 1x1 1 2 0.88
WINDING MACHINE
38. Winder motor 2x7.5x1 1 30 0.84 39. Roller 1x1x1 1 45 0.84
Subtotal 12/3 56.4 6.335
233.91 37.6
Total 49.4
Speed variable load feeder, dc motor 0
compensated (heaters, ac drives) 37+4.4+1=42.4+4=46.4
Idle loads pump1/2of belling 3
Variable loads mixer, sucker, cutter, fan, vacuum, &cooling pump, haul off
0.18+0.155+3+1+1+1=6.335
Page 128
POWER QUALITY PROBLEMS IN INDUSTRIAL ENTERPRISES AND THEIR MITIGATION TECHNIQUES
MSc. Thesis By Firew Tsegaye/Power System Engineering/BIT/BDU Page 109
Table B 23 Production Line twelve: Accessories and Recycle machines
Load Type
No. Location Nxwxn KVA
Resistive load Active power (KW)
Compensated (KW)
Non Compensated (KW)
3-phase Ampere (A)
1-phase Ampere (A)
Power Factor
COMPRESSOR MACHINE 1. 1
Compressor motor 1,2 2x55x1 110 220 0.87
2. Compressor fan Motor 1,2 2x2.2x1 4.4 8.8 0.88 CHILLER MACHINE
3. Factory Inlet pump motor 1,2,3 3x11x1 33 66 0. 78
4. Condenser inlet pump motor 1,2,3
3x7.5x1 22.5 45 0. 78
5. cooling tower inlet pump motor 1.2,3
3x5x1 15 30
6. cooling tower fan motor 1.2,3 3x3x1 9 18
CRUSHER MACHINE
7. UPVC hammer crusher main motor
1x45x1 45 90
8. UPVC hammer crusher oil pump
1x3x1 3 6
9. UPVC crusher 1,2 2x55x1 110 220
10. UPVC Fine crusher/miller/ 1 1x45x1 45 90
11. Fine crusher/miller/ oil pump 1x2.2x1 2.2 4.4
12. Miller blower 1x5.5x1 5.5 11
13. Milling /pulverizer/ 1,2 2x37x1 74 150
14. Milling blower 1,2 2x4x1 8 16
15. HDPE hammer crusher main motor
1x55x1 55 110
16. HDPE hammer crusher oil pump
1x3x1 3 6
17. HDPE belt conveyer 1x2.2x1 2.2 5
18. HDPE crusher 1 1x75x1 75 150
19. HDPE crusher adjuster 1x0.55x1 0.55 1.2
20. HDPE crusher screw conveyer 1,2,3,4
4x2.2x1 8.8 18
21. HDPE crusher washing 4x2.2x1 8.8 18
22. HDPE crusher dewater 1x5.5x1 5.5 12.1
23. HDPE crusher blower 1x7.5x1 7.5 14.5 0.89
24. Shower heaters 8pcs 8x3 24 48
25. Dryer heaters 8pcs 8x3 24 48
26. Factory lighting 100x1 100 200 Subtotal 48/3 100/3 652.95 1507.2 96
Total 605.85 Speed variable load feeder, dc motor 0
compensated (heaters, ac drives) 33.35+16=49.35
Idle loads pump1/2of belling 302.95
Variable loads mixer, sucker, cutter, fan, vacuum, &cooling pump, haul off
110+4.4+33+22.5+15+9+45+3+110+45+2.2+55+3+2.2+75+0.55+8.8+5.5+7.5=556.65
Page 129
POWER QUALITY PROBLEMS IN INDUSTRIAL ENTERPRISES AND THEIR MITIGATION TECHNIQUES
MSc. Thesis By Firew Tsegaye/Power System Engineering/BIT/BDU Page 110
APPENDIX C: Electricity tariff category
Table C 1 Equivalent flat rate tariff of EEU void source specified