34
Power Switch The Future of the Electric Power System in the Northeast and the Disruptive Power of Innovation October 2016
| Date post: | 10-Feb-2018 |
| Category: |
Documents |
| Upload: | truongminh |
| View: | 215 times |
| Download: | 0 times |

Power Switch The Future of the Electric Power System in the Northeast and the Disruptive Power of Innovation
October 2016

1
Contents
Acknowledgements ....................................................................................................................................... 2
Foreword ....................................................................................................................................................... 3
Introduction ................................................................................................................................................... 4
An Industry in Transition .............................................................................................................................. 6
A Lower Carbon System ............................................................................................................................... 9
Managing a System in Transition ............................................................................................................... 10
Ambitious Goals Ahead .............................................................................................................................. 12
Looking Forward: Electric Sector Trends and Opportunities ..................................................................... 13
Renewable Energy: Expanding the Portfolio of Zero Carbon Generation .............................................. 15
Transmission: A Critical Resource for Expanding the Renewables Resource Base ............................... 21
Energy Storage: An Asset to Renewables Development & Reliability .................................................. 22
Nuclear Power: Economic Challenges for a Zero-Carbon Resource ...................................................... 24
Energy Efficiency: More Savings, More Investment .............................................................................. 25
Distribution System Resource Planning and the Smarter Grid ............................................................... 29
Electric Vehicles: More Vehicles, More Electricity Demand ................................................................. 30
Conclusion .................................................................................................................................................. 33
2
Acknowledgements
Lead Authors: Michael Bradley and Christopher Van Atten
This independent report, Power Switch, explores and documents electricity market trends and the
disruptive power of innovation in the Northeast states, and the future challenges and opportunities for the
electric power sector through 2030 in this region. This report is part of the RGGI Project Series, a series
of independent research and analysis projects to inform and assist leaders and stakeholders in the
Northeast.
M.J. Bradley & Associates would like to thank the Barr Foundation, the Merck Family Fund, the
Devonshire Foundation and Daniel Hildreth for grants that helped make this work possible. We also
thank Laurie Burt, of Laurie Burt, LLC and Project Coordinator for the RGGI Project Series, for her input
and assistance throughout the project.
Grace Vermeer, Robert LaCount, Dana Lowell, Amlan Saha, Paul Allen, Lauren Slawsky, Kaley
Bangston, Pye Russell, and Kim Voellmann of M.J. Bradley & Associates made important contributions
to this report. M.J. Bradley & Associates would also like to thank Ann Berwick, David Littell
(Regulatory Assistance Project), and Apurba Sakti (MIT Energy Initiative) for their helpful input on the
report.
This project includes a companion video with interviews from leading energy experts, including Sue
Tierney (Analysis Group), Gordon van Welie (President and Chief Executive Officer of ISO NE), Peter
Kelly-Detwiler (Northbridge Energy Partners), and Kelly Speakes-Backman (Alliance to Save Energy).
This report reflects the analysis and judgment of the authors only and does not necessarily reflect the
views of the foundations, Ms. Burt, or any of the reviewers.
This report and companion video are available at www.mjbradley.com.
About M.J. Bradley & Associates
M.J. Bradley & Associates LLC (MJB&A), founded in 1994, is a strategic consulting firm focused on
energy and environmental issues. The firm includes a multi-disciplinary team of experts with
backgrounds in economics, law, engineering, and policy. The company works with private companies,
public agencies, and non-profit organizations to understand and evaluate environmental regulations and
policy, facilitate multi-stakeholder initiatives, shape business strategies, and deploy clean energy
technologies.
© M.J. Bradley & Associates 2016
For questions or comments, please contact:
Christopher Van Atten
Senior Vice President
M.J. Bradley & Associates, LLC
978-369-5533
3
Foreword Society has become more dependent than ever on electricity to drive our economy, power our devices and
keep us connected. At the same time, expectations around the “quality” of the energy we consume have
been evolving with growing interest in clean energy technologies and decarbonizing the electric grid.
This is reflected in state policy decisions on energy efficiency, carbon regulation, and renewable energy,
corporate commitments to purchasing renewable energy, and the millions of solar panels that households
have installed on their roofs.
Technology innovation is giving producers and consumers new options to generate, use, manage, store,
and save electricity. Combine this desire for clean energy with the right policy framework and the
technological capability to deliver on these goals, in a cost-effective way, and you have the recipe to
radically transform the electric system over the coming decades.
Power Switch discusses these trends, focusing on the Northeast region of the United States, which has
long been a laboratory for innovative energy policies and technologies. For example, as discussed in the
report, the first commercial offshore wind project in the U.S.—the Block Island Wind Farm—will begin
commercial operation in 2016 off the coast of Rhode Island.
Competition is a big part of what drives innovation in the Northeast power markets. Competitive power
markets and market-based environmental programs, like RGGI, create competition to supply low-cost
power and lower-carbon megawatt hours. Competitive markets enabled the massive shift that has already
occurred in the region to highly efficient, combined cycle power plants. This shift in the generation mix
has led to dramatic reductions in electric sector carbon emissions, as well as other air pollutants. The big
challenge for the region going forward will be how to reduce greenhouse gas emissions beyond the
electric sector, including transportation and buildings. Many of the Northeast states have set ambitious
medium-term and long-term greenhouse gas reduction goals, with most aiming to achieve an 80 percent
reduction in emissions by 2050.
One way to achieve these targets would be to continue decarbonizing electricity production and supply,
while at the same time transitioning building heating and transportation from fossil fuels to electric
power. The basic building blocks to achieve such an outcome are (for the most part) known today, like
electric vehicles, energy efficiency, wind and solar, fast ramping gas plants, transmission, advanced
lighting and controls, cold climate heat pumps, and energy storage devices, but they have yet to be
deployed at the scale required to meet the goals envisioned by the states. The rapid pace of innovation
that we are witnessing with these technologies suggests that such a transition will become increasingly
feasible, as companies continue to inhabit this new economic space.
We hope that this report, and the companion video, will encourage policymakers and other stakeholders
to continue examining these issues and help to build an appropriate policy framework that will enable this
process of “constructive innovation” to continue.
Michael J. Bradley
President of M.J. Bradley & Associates LLC

4
Introduction The electric power system in the Northeast region has changed significantly over the past decade and
continues to evolve, although to the casual observer it might not appear that much has changed.1 This is
partly by design. The electric system is able to accommodate changes in generating technologies and end
uses, while still delivering the same reliable supply of energy to homes and businesses. However, look
below the surface (or beyond the meter) and you will find that much has already changed and disruptive
forces continue to reshape the system, creating challenges, but also exciting new opportunities for the region.
Driving these system changes are rapid advancements in technology, changes in fuel prices, aging
infrastructure in need of replacement, and state and federal policy choices. Customers are also spurring this
change as they embrace new innovative technologies, like electric vehicles, and pursue greater energy
savings in their homes and offices. Technology is changing how consumers interact with the electric grid,
how much electricity people draw from the grid and when they draw it. The future of the electric system will
include more interconnected devices, more intermittent renewables, and a more distributed grid, but the full
implications of these changes are far from clear. Just as Apple did not know the full suite of applications that
would be available for the iPhone when it first hit the market, we do not know exactly what the electric
system will look like in 20 years. What we do know for certain is that change is coming and the pace of
innovation has only been accelerating.
1 For the purpose of this paper, we define the Northeast region to include New England, New York, New Jersey,
Maryland, Delaware, and Pennsylvania.
Key Statistics
Population: 57 million
Electricity Sales: 564 terawatt-hours
Power Plant Capacity: 164 gigawatts
Generation: 583 terawatt-hours
Power markets: ISO NE, NYISO, PJM
Generation Fuel Mix: 2015
Northeast Region
Transmission Line
Pow er Plant
Figure 1 Northeast Region and Focus of This Report
Coal15%
Natural Gas37%
Oil1%
Nuclear35%
Hydro6%
Renewable3%
Other3%

5
Technology innovation has been a disruptive force in other sectors of the economy with widespread social
and economic implications. Computers, telecommunications, even the taxi business, has been upended in
recent years by technology and business model innovation. The breadth and the pace of change can often be
hard to predict because we have preconceived notions of how these systems should work and recent historic
experience can often cloud our expectations of the future. The electric sector is different in many respects
from these other sectors of the economy and change in the sector has tended to be gradual, but Peter Kelly-
Detwiler, an expert on the energy industry, makes the case that the world of electric energy is undergoing a
profound change and the change is accelerating: “[t]hanks to breakthroughs in high performance computing
and materials science, a whole generation of vastly improved or entirely new technologies is likely to be
unleashed on us in the very near future. And that surge of innovation will not stop. It will, in fact,
accelerate.”2
The purpose of this report is to explore the major trends that are reshaping the electric power system in the
Northeast and explore some of the implications of these changes. We focus on this region because the
Northeast states have been at the vanguard of the changes that are transforming how electricity is produced
and delivered in the U.S. The region has already experienced a major shift in the mix of resources used to
produce electricity, with natural gas and renewables displacing older coal- and oil-fired power plants. The
Northeast states are particularly well positioned to manage the ongoing changes with well-established energy
and capacity markets, and flexible market-based regulatory programs that integrate well with the region’s
power markets.
Utility restructuring and the establishment of competitive markets, provides the region with critical
tools and a strong foundation to manage the on-going changes that are occurring within the sector. In
the 1990s, virtually all of the Northeast states began the process of transitioning toward retail competition
and industry restructuring, launching a new era of market and regulatory innovation. The region now has
three well established electricity market operators—PJM, New York ISO (NYISO), and ISO New England
(ISO NE)—with centralized reliability planning and coordination and market mechanisms that guide
investment in the electric system.
RGGI is likely to play a central role in guiding the resource and investment decisions within the
region. Many of the Northeast states have also embraced market-based environmental policies and carbon
pricing. The Regional Greenhouse Gas Initiative (RGGI), which relies on a market-based trading system to
reduce carbon dioxide (CO2) emissions from the electric sector, is a prime example of the innovative policies
championed within the region. Originally launched as an effort to demonstrate environmental policy
leadership and encourage similar state or federal actions, RGGI has become a fully functioning marketplace
for CO2 emissions, putting the participating states well ahead of federal efforts to address carbon emissions.
Since 2009, RGGI has set a gradually declining cap on CO2 emissions from fossil-fired power plants with a
final reduction goal to be met in 2020 and a further phase of reductions under active consideration.
Emissions from the electric sector have dropped sharply since RGGI went into effect in 2009 due to a
combination of factors including the recession, complementary energy and environmental programs, and fuel
switching in response to lower natural gas prices. RGGI has been a catalyst for several of the market trends
2 Kelly-Detwiler, Peter. Forbes: With Super-Computing, the Process of Disruptive Innovation In Energy Is Likely to
Accelerate. March 21, 2016.

6
discussed in this paper, including the expanded role of energy efficiency within the region. From 2009 to
2015, the RGGI states have reinvested nearly $2 billion in proceeds from the CO2-allowance auctions back
into the economy in various ways, including primarily on energy efficiency measures and community-based
renewable power projects.
Electricity has the potential to play a dramatically expanded role in the region’s overall energy mix in
the coming decades in order to achieve deep reductions in carbon emissions. Looking to the future,
many of the Northeast states have set ambitious goals for themselves. All of the New England states, New
York, Maryland, and New Jersey have established economy-wide goals or requirements for reducing
greenhouse gas emissions with most aiming to cut emissions 80 percent from 1990 levels by 2050. This
implies a major transformation in the region’s energy system, including changes well beyond the electric
system. RGGI will continue to be a central element of the region’s climate and energy strategy; however,
new and expanded strategies will be required to achieve these deeper reduction targets. To date, shifting
from coal and oil to natural gas has been the primary source of CO2 emissions reductions. However, this
option has been largely exhausted in some states. Transportation is the leading source of CO2 emissions
within the region. There are certainly more opportunities to reduce emissions within the electric system, but
as the system continues to decarbonize, electricity will provide opportunities for achieving emissions
reductions more broadly across the economy by switching from gasoline powered vehicles to electric
vehicles, and by switching from oil and natural gas use in boilers and furnaces to heat pumps powered by
electricity.
The region has already experienced several waves of innovation and change, and there are more to come.
The question now is: how will the electric system evolve over the coming decades, while continuing to
maintain reliability and reducing greenhouse gas emissions across the economy?
An Industry in Transition It used to be that the Northeast region relied almost exclusively on large, central station coal, oil, and nuclear
power plants to supply the grid. Over the past several decades, however, the region has undergone a massive
shift in the generation fuel mix with greater reliance on highly efficient, natural gas-fired combined cycle
power plants. This shift from coal and oil to natural gas could be described as the first wave of change and
innovation that swept across the region after the introduction of competitive power markets. The first large-
scale combined cycle power plants arrived on the scene in the Northeast in the late 1980s and early 1990s.3
Today, there are more than 100 combined cycle power plants in the region with a total generating capacity of
more than 40 gigawatts (GW). More recently, a second wave of change has been sweeping across the region
with the deployment and integration of alternative energy sources, such as wind, solar, and demand response.
Investments in energy storage and smart grid technologies have also been on the rise, bringing new
innovations to the market that could dramatically reshape the energy system.4 In the future, electricity will
3 The Hay Road Energy Center in Wilmington, Delaware, a 1,130 megawatt combined cycle power plant, started
commercial operation in January 1989. 4 Electricity markets have an extensive vocabulary. Power plants, generating facilities, and supply resources are all
synonymous for the facilities that produce and deliver electricity to the grid, including coal-fired power plants, nuclear
facilities, hydroelectric facilities, wind farms, and other technologies. Demand-side energy efficiency refers to energy
saving measures and appliances in our homes and offices, like LED lighting and high efficiency dryers. Distributed

7
be used to an increasing degree as a transportation fuel and to heat the region’s homes and offices with heat
pump technology—a further wave of technology innovation and change with important implications for the
electric sector as well as the broader energy system.
These changes have been stimulated in part by the competitive forces of the market. In particular, the
wholesale power markets and the competitive price of natural gas have been key factors driving the changes
in the region’s fuel mix; fuel costs are the biggest component of a traditional power plant’s operating costs.
Since 2010, natural gas prices have fallen 40 percent (Henry Hub Spot).5 The New York Independent
System Operator (NYISO) reports that low natural gas prices have resulted in record low wholesale electric
energy costs in 2015. The average wholesale electric energy price ($44.09 per megawatt-hour) was the
lowest in the 15-year history of New York’s competitive markets for wholesale electricity.6 The PJM
marketplace has also been experiencing record low prices. In March 2016, wholesale power prices plunged
to a 15-year record low in the PJM Interconnection.7 Low gas prices have encouraged greater reliance on
natural gas throughout the region; low gas prices have also created economic challenges for power plant
operators and have led to a significant number of power plant retirements.
generation refers to small-scale generating facilities, like solar panels, located at an individual home or business, close
to the load that it is intended to serve. 5 U.S. Energy Information Administration. “Natural Gas Spot and Futures Prices.” August 3, 2016. Accessed August 5,
2016, http://www.eia.gov/dnav/ng/ng_pri_fut_s1_a.htm. 6 NYISO. Power Trends 2016: The Changing Energy Landscape. July 5, 2016. 7 Platts. PJM Average Power Prices Hit 15-Year Low in March. April 25, 2016.
208
87
2005 2015
6
16
2005 2015
$7.18
(Jun ’05) $2.59
(Jun ’16)
64% 184% 58%Decline in natural gas
spot price
Increase in non-hydro
renewable generation
Decline in coal-fired
generation
Northeast Generation (TWh)
Figure 2 Some of the Key Trends Shaping the Northeast Electric System
U.S Henry Hub ($/MMBtu)
Source: U.S. Energy Information Administration (EIA) Henry Hub Sport Price, Fuel Consumption for Electricity from the
State Energy Data System and Form 923 Monthly Generation and Fuel Consumption; MJB&A Analysis.

8
At the same time, the industry has seen a significant upsurge in renewable generation driven by decreases in
technology costs and constantly improving technology, combined with supportive state and federal policies.
In 2015, renewables (including large hydroelectric facilities) accounted for more than 9 percent of total
electricity production in the Northeast, but this share could increase significantly in the coming years. As
discussed later in the report, the costs of producing electricity with wind and solar technologies have declined
significantly, and further declines are expected as the technology continues to improve
Figure 3 highlights the historic changes in the generation fuel mix across the region. New York and New
England, in particular, have both experienced significant changes over the past decade. Between 2005 and
2015, coal-fired generation declined more than 80 percent in both New England and New York, and more
coal plants are scheduled to close. There are currently only four coal-fired plants still operating in New
England, although all may be closed over the next several years: Bridgeport Harbor Station in Connecticut
(scheduled to close in 2021),8 Brayton Point in Somerset, Massachusetts (scheduled to close in 2017),9 and
the Merrimack and Schiller facilities in New Hampshire (both scheduled to be sold and potentially converted
to natural gas).10 A similar story is playing out in New York, where in the past several years a number of
coal plants have retired or been converted to burn other fuels. The two coal plants in the state that continue
to operate have low utilization rates and have struggled financially.11 The declines in oil use have been even
8 Hartford Courant. Connecticut’s Last Coal-Fired Power Plant to Be Closed. February 12, 2016. 9 The Herald News. Somerset Secures $3 million to Offset Lost Power Plant Revenue. June 21, 2016. 10 The New Hampshire Union Leader. Eversource Ordered to Sell its Power Plants. July 1, 2016. 11 Opalka, William. “FERC Approves Sale of Doomed New York Coal Plants”. RTO Insider. January 18, 2016.
Accessed August 12, 2016, http://www.rtoinsider.com/ferc-sale-ny-coal-plants-21251/; EPA Air Markets Program
Data.
18 204
8
50
54
30
13
2
37
35
32
9
9
7
2
4
110
137
111
0
40
80
120
160
1990 2005 2015
26 21
2
23 3257
34 242
24 42
45
28
26
26
1
5
136
148
139
0
40
80
120
160
1990 2005 2015
Other
Renewable
Hydro
Nuclear
Oil
Natural Gas
Coal
Figure 3 Generation by Fuel Type (terawatt-hour)
New England New York DE/MD/NJ/PA
Source: U.S. Energy Information Administration (EIA), Fuel Consumption for Electricity from the State Energy Data System
and Form 923 Monthly Generation and Fuel Consumption.
142167
81
12
30
108
111
83
122128
44
27
258
340 334
0
40
80
120
160
200
240
280
320
360
1990 2005 2015

9
more dramatic (>90% since 1990). By contrast, the use of natural gas for electricity production, in New
York and New England, has increased between two to six times since 1990.
In Pennsylvania, New Jersey, Delaware, and Maryland, similar changes in the fuel mix have taken place,
although several of these states still have significant coal generation. Across these four states, coal
generation has declined over 40 percent since 1990 and now accounts for roughly 24 percent of the region’s
electricity generation. By contrast, natural gas-fired generation has increased nearly 8-fold and now accounts
for more than 30 percent of total electricity generation.
A Lower Carbon System As a result of these changes in the generation fuel mix, the Northeast region has been successful in driving
down emissions of CO2 and other air pollutant emissions associated with the production of electricity. The
electric sector has reduced its CO2 emissions by roughly a quarter since 1990, across the Northeast (31
percent since 2005). Among the states that participate in RGGI, a market-based trading program that limits
CO2 emissions from the electric sector, the reductions have been even more dramatic. In the 9 state RGGI
region, the electric sector has reduced its CO2 emissions by 45 percent since 1990 (or roughly the same
percentage since 2005). Electricity production, which once accounted for 30 percent of economy-wide CO2
emissions across the RGGI states, now accounts for about 20 percent of emissions. Economy-wide CO2
Figure 4 Demolition of the Salem Harbor Coal-fired Power Plant
Demolition of the Salem Harbor coal-fired power plant in Salem, Massachusetts. Salem Harbor is being replaced with a $1 billion natural gas-fired power plant. More than nine gigawatts of coal capacity has been retired in the Northeast since 2010.
Photo credit: JDC Demolition Company

10
emissions have also declined, about 20 percent since 1990 in the RGGI region in large part because of the
progress made within the electric industry (see Figure 5).
Managing a System in Transition The Northeast has been successful in managing and nurturing this market transformation, while driving
economic growth and maintaining reliability, because of a mix of policy choices and well-functioning power
markets, which have facilitated and enabled many of the changes that we discuss throughout this paper. The
region has a history of leadership on energy and environmental policies, including market-based
environmental programs like RGGI. Many of the states in the Northeast have also made commitments to
clean energy goals and long-term greenhouse gas reductions.
Well-Functioning Power Markets. Beginning in the late 1990s, all of the Northeast states, with the
exception of Vermont, began to transition toward retail competition and industry restructuring, launching a
new era of market and regulatory innovation. The region now has three well established system operators—
PJM, NY ISO, and ISO New England—with centralized reliability planning and coordination and market
rules that have evolved over the years.
Utility restructuring and the establishment of the RTO markets provides the region with critical tools and a
strong foundation to manage the on-going changes in the energy landscape. Locational marginal pricing12
ensures that the lowest cost resources are dispatched to meet energy demand even as the resource mix
changes. Capacity markets ensure that adequate resources are available to meet future demand. Deactivation
rules help to ensure an orderly retirement of existing generating facilities as the resource mix continues to
evolve. A recent study by PJM found that markets have done well in attracting new generation investment
12 The market-clearing price for electricity at the location the energy is delivered or received.
Figure 5 RGGI Region Historic CO2 Emissions (million short ton) and Percent Share by Sector
0
40
80
120
160
200
2001 03 05 07 09 11 13 2015
16% 17% 17% 18%
10% 11% 10%11%
11% 9% 8%7%
33%35% 37%
43%
30%28% 29%
21%
517540 552
416
1990 2000 2005 2013
Electric Power
Transportation
Industrial
Commercial
Residential
Total Emissions
Electric Power Sector CO2 Emissions
in the RGGI Region: 2001-2015
Economy-wide CO2 Emissions in the
RGGI Region: 1990-2013
Source: U.S. Energy Information Administration (EIA), Carbon Dioxide Emissions from Fossil Fuel Consumption by Sector
by State, Released October 26, 2015; RGGI Inc.

11
based on transparent price signals that allow generators to make rationale economic decisions.13 On the
distribution side, a variety of policies have been adopted in the Northeast ensure that utilities have an
incentive to invest in energy efficiency, a key component of the region’s energy strategy.
Market-Based Environmental Policies. The Northeast states have a long-tradition of relying on market-
based regulatory approaches. As far back as 1999, a subset of states in the Northeast established the nation’s
first trading system for nitrogen oxide (NOx) emissions to reduce smog pollution. Between 2000 and 2008,
many of the Northeast states adopted renewable portfolio standards (RPS), based on a system of tradeable
renewable energy certificates. Massachusetts utilities, for example, can purchase renewable credits from any
qualifying source that delivers power to the New England power grid, and other Northeast states allow this
type of credit trading. Finally, in 2009, a large block of Northeast states launched the nation’s first carbon
trading system, RGGI. These flexible, market-based approaches allow emissions goals to be met at lower
cost, versus more prescriptive regulatory approaches. Market-based environmental programs (pricing
mechanisms) also tend to integrate well with the region’s competitive power markets.
A Commitment to Clean Energy and Greenhouse Gas Reduction Goals. Many of the Northeast states have
established aggressive GHG reduction goals and renewable energy targets, which will continue to influence
the energy mix within the region. All of the New England states, New York, Maryland, and New Jersey
have established economy-wide goals or requirements for reducing GHG emissions. Most aim to cut
emissions 80 percent from 1990 levels by 2050. Many of the Northeast states have also adopted renewable
portfolio standards (RPS).14 New Jersey, for example, has adopted a renewable standard, requiring utility
companies to source 20 percent of their power from renewable sources by 2021. Legislation has also been
considered by the New Jersey legislature that would establish an 80 percent renewables target by 2050.15
13 Duane, Vincent. “Markets best way to attract new investment, adapt to change.” PJM Inside Lines, May 16, 2016,
accessed August 5, 2016, http://insidelines.pjm.com/markets-best-way-to-attract-new-investment-adapt-to-change/. 14 A renewable portfolio standard is a regulatory mandate to increase the supply or production of electricity from
renewable sources such as wind, solar, biomass and other qualifying technologies. 15 NJ Spotlight. Lawmakers Push for 80 Percent Renewable Energy by 2050 – Again. March 17, 2016.
Figure 6 Key Milestones in the Evolution of the Northeast Power Markets
1990
Restructuring
In the early 1990’s, the majority of northeast states
start down the path of
restructuring their electricity markets.
20102000
RTOs Formed
In 1996, FERC recommends the
creation of independent
entities to administer wholesale markets.
1997 PJM becomes a fully independent energy market
1997 ISO New England established to operate regional power system and wholesale markets
Dec. 1999 NYISO assumes control of the New
York power grid
Markets Continue to Evolve
In 2001, ISO-NE launches first demand-response programs.
NYISO implements first
Emergency Demand Response Program in 2002.
In 2007, PJM implements new method for pricing capacity.
Resource Mix
PJM capacity auction secures record amounts of
new generation, demand
resources, and energy efficiency in 2012.
Natural gas supplies 52% of New England power
demand in 2012.
Wind supplies 7% of New York’s total system
demand on March 1, 2015.
2015

12
The RGGI program, which encompasses most of the Northeast, is arguably the centerpiece of the region’s
commitment to decarbonizing the energy sector. Since 2009, RGGI has set a cap on CO2 emissions from
fossil-fired power plants with a final reduction goal to be met in 2020. The participating states are currently
considering the potential tightening of the regional CO2 emissions cap and adjustments for future compliance
with EPA’s Clean Power Plan. The choice of a more stringent emissions cap, the second to be considered
since RGGI started, will have an important influence on the region’s power mix in the coming decades by
limiting the sector’s CO2 emissions.
Technology Research and Development. The Northeast region has a high concentration of research and
development programs, universities, and innovative start-up companies in the clean energy sector. In New
York, NYSERDA, a publicly funded corporation focused on promoting energy efficiency and renewable
energy, has well established technology R&D programs. In Massachusetts, the publicly-funded Clean
Energy Center is dedicated to accelerating the development and deployment of clean energy technologies.
One of the initiatives supported by the Clean Energy Center is the Greentown Labs. Greentown Labs
provides office space and resources for energy and clean technology entrepreneurs to collaborate, test and
develop ideas, market products and services, and share experiences with a community of like-minded
individuals. Greentown Labs is now expanding its network in the Northeast by teaming with a similar
incubator at New York University-the New York City Accelerator for a Clean and Renewable Economy.
Ambitious Goals Ahead The degree of change that has already occurred within the electric sector in the Northeast has been dramatic.
Supported by effective policy and market frameworks, the region has come a long way in modernizing its
electric system. These changes have delivered many benefits including significant reductions in CO2
emissions. However, the process of innovation never stops and the region has unmet goals with regard to the
adoption of clean energy technologies.
There is widespread support for transitioning to a clean energy system that reduces
the threat of climate change and other contaminants. Many of the Northeast states
have established long-term goals to dramatically reduce greenhouse gas emissions
from all sectors of the economy. As the electric system transitions to low- and zero-
carbon technologies, electrification will offer an important opportunity for reducing
carbon emissions throughout the economy. Greater reliance on electricity for
transportation and heating offers the opportunity for dramatically reducing air
pollution emissions.
The Northeast states have set ambitious goals for the future that extend well beyond the electric sector. As
indicated above, all of the New England states, New York, Maryland, and New Jersey have established
economy-wide goals for reducing GHG emissions with most aiming to cut emissions 80 percent from 1990
levels by 2050. Many of these states have also established interim goals. In evaluating the recent trends and
future goals, several important points emerge. First, the road ahead will need to break new ground to achieve
these deeper reduction targets. To date, it has been the electric sector that has delivered the bulk of the

13
emissions reductions, by shifting from coal and oil to natural gas. However, this option is virtually
exhausted in some states and limited in others. Across the region, coal and oil only account for about 20
percent of total electricity generation; down from 40 percent of total generation in 2005.
Future opportunities for GHG reductions within the electric sector will need to rely on strategies that
transform the overall efficiency of how electricity is generated, transmitted and used and greatly expands the
use of zero-emissions sources of energy. For New York and New England, the only opportunities to
significantly reduce GHG emissions from the power sector, in the not distant future, will be to reduce
emissions associated with gas-fired power generation. At the same time, the power sector will provide
opportunities for achieving emissions reductions more broadly across the economy by switching from
gasoline powered vehicles to electric vehicles, and by heating homes and buildings with electric heat pumps,
rather than relying on oil and other fossil fuels. Figure 7 shows the historic trends in CO2 emissions within
the Northeast region by sector, as well as an illustration of what an 80 percent reduction goal (from 1990
levels) would imply if applied across the region to CO2 emissions.
Looking Forward: Electric Sector Trends and Opportunities In many ways, the world was simpler prior to restructuring and prior to the rise of distributed generation and
demand response, energy storage, and big data. Peter Kelly-Detwiler, an expert on the trends affecting the
energy industry, said it best in his reflections on the “good old days” of the electric power system in the
Northeast. “In the good old days before about 2010, you had the normal hurdles that typically accompanied
the coordination of the bulk power system (loosely defined as generation and transmission—the big iron
Figure 7 Northeast Region Historic CO2 Emissions (million short ton) and 80% Reduction Goal
Source: U.S. Energy Information Administration (EIA), Carbon Dioxide Emissions from Fossil Fuel Consumption by Sector
by State, Released October 26, 2015.
123 138 137 113
80 86 8270
142 117 11194
299 338 358
305
286303 316
219
186
931982 1,005
800
0
200
400
600
800
1,000
1,200
1990 2000 2005 2013 -80%
Electric Power
Transportation
Industrial
Commercial
Residential
80%
reduction
from 1990
levels.
Historic emissions
14
stuff) and wholesale power markets…In general, supply was supply and demand was demand. While there
were challenges inherent in ensuring that supply was always equal to demand, and that there would be
enough generation to meet future needs, the world was fairly (but not entirely) predictable…In general, the
kids stayed put in the sandbox, and everybody colored within the lines.” The system was built to serve the
instantaneous demand of customers, with a large reserve margin to accommodate plant outages and other
contingencies.
Today, the system is certainly more complex and new challenges lie ahead, as the trends discussed
throughout this paper take hold. The electric system across the Northeast is entering a new phase in its
evolution. The changes underway have been enabled by significant advances in energy technologies, but
they have also been driven by necessity. To meet the state-by-state GHG goals in place across the region, the
power sector will need to achieve significant GHG emissions reductions while delivering reliable and
affordable service. These goals will require a transformation in how electricity is produced, delivered and
used. Initiatives, like the Reforming the Energy Vision (or “REV”) process in New York, have been
exploring these questions with a focus on creating a more distributed energy system and delivering greater
value to consumers.
The good news is that Northeastern states have built a strong foundation to support this transformation.
Renewable generation is rapidly increasing. Many states across the region continue to lead on energy
efficiency. Despite these positive efforts and trends, more substantial change will be required in the future.
These changes will require a rethinking by all stakeholders. Some of the questions facing the region include:
How can electric utilities, projects developers, investors, and the wide range of companies working across
the electric system value chain best support this transition? How well do current policies create effective and
sustainable incentives for required investments? To what extent will the electric system be relied upon to
power transportation and heating?
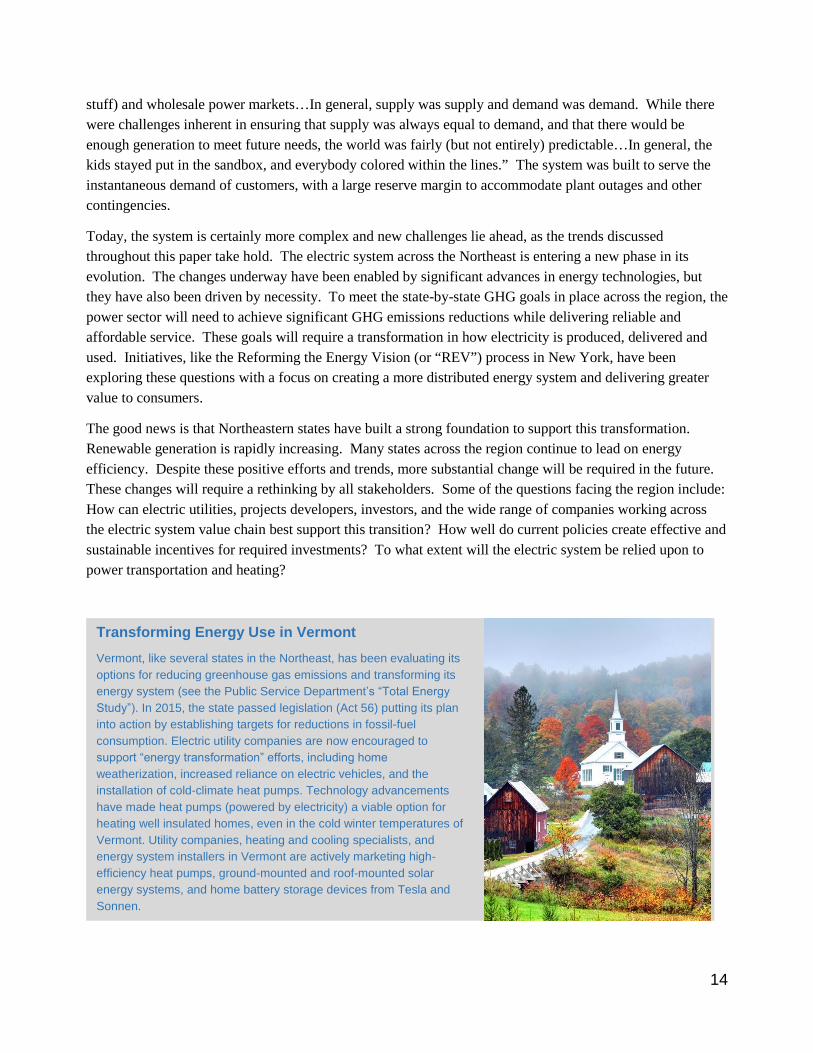
Transforming Energy Use in Vermont
Vermont, like several states in the Northeast, has been evaluating its
options for reducing greenhouse gas emissions and transforming its
energy system (see the Public Service Department’s “Total Energy
Study”). In 2015, the state passed legislation (Act 56) putting its plan
into action by establishing targets for reductions in fossil-fuel
consumption. Electric utility companies are now encouraged to
support “energy transformation” efforts, including home
weatherization, increased reliance on electric vehicles, and the
installation of cold-climate heat pumps. Technology advancements
have made heat pumps (powered by electricity) a viable option for
heating well insulated homes, even in the cold winter temperatures of
Vermont. Utility companies, heating and cooling specialists, and
energy system installers in Vermont are actively marketing high-
efficiency heat pumps, ground-mounted and roof-mounted solar
energy systems, and home battery storage devices from Tesla and
Sonnen.
15
In the sections that follow, we discuss some of the key trends, opportunities, and challenges across the
Northeast as the power sector transitions to a lower carbon system. Some of the key areas of change include:
(1) renewable energy (steady growth); (2) energy efficiency (new opportunities); (3) electric vehicles
(gradually expanding); (4) nuclear energy (economic challenges); (5) energy storage (early stages of
development); and (6) transmission (critical enabler of renewable energy).
Renewable Energy: Expanding the Portfolio of Zero Carbon Generation
Renewable energy has been steadily increasing in the Northeast due to state policy mandates, declining
project costs, federal tax incentives, and consumer preference.16 Today, wind and solar account for a small
share of the overall electricity supply within the region. However, as the number of projects continues to
increase, this number is expected to increase.17 Since 2010, the Northeast region has more than doubled its
installed base of wind and solar capacity, and more growth is expected in the coming decades. This trend is
critical to expanding zero-carbon energy and will largely set the pace for future GHG reductions given the
current power generation mix across the region. States in the region are also looking at the option of
importing additional hydroelectric power from Canada.
The Northeast states have relied on several different approaches to encourage renewable energy
development. One of the mechanisms, as mentioned earlier in this report, has been to introduce carbon
16 On December 18, 2015, Congress passed extensions to the investment tax credit (ITC) for solar and the production
tax credit (PTC) for wind energy projects. The Consolidated Appropriations Act extends the 30% ITC for solar to
facilities that commence construction on or before December 31, 2019 (and are placed in service before 2024). The ITC
then declines for projects that commence construction after 2019. The PTC for wind also gradually declines before
expiring in 2020. 17 In 2015, wind and solar combined accounted for 2.0 percent of the region’s total electricity production.
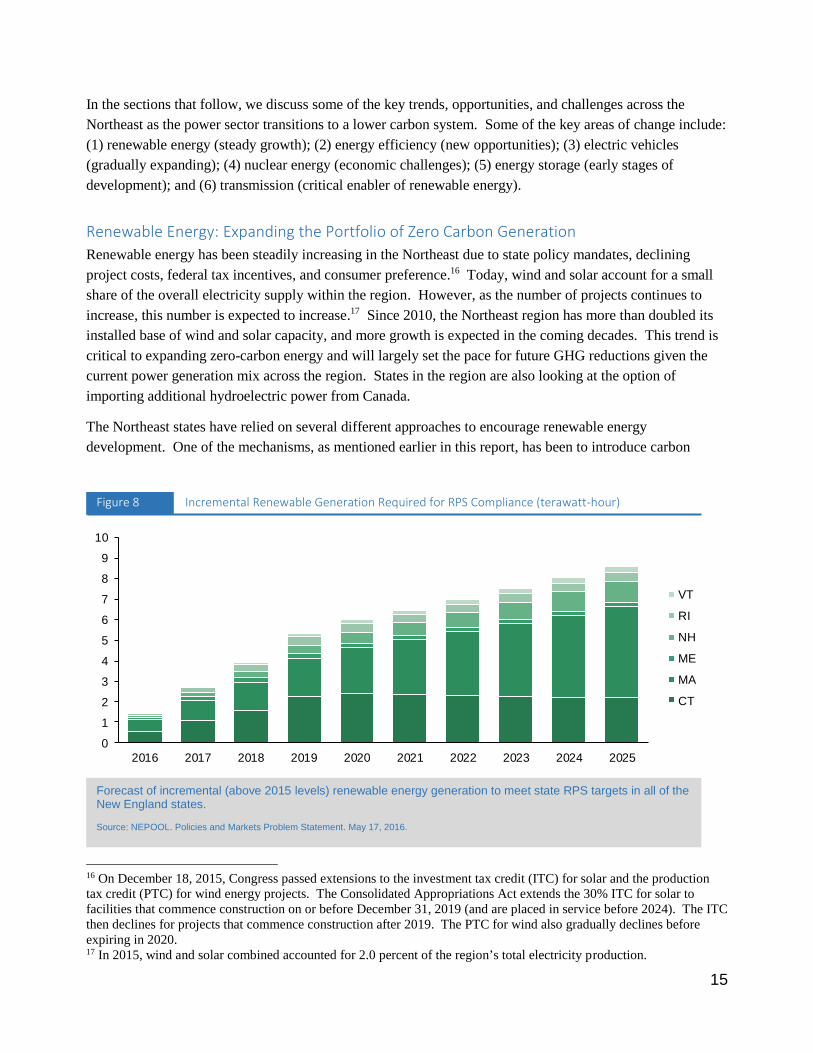
Figure 8 Incremental Renewable Generation Required for RPS Compliance (terawatt-hour)
Forecast of incremental (above 2015 levels) renewable energy generation to meet state RPS targets in all of the New England states.
Source: NEPOOL. Policies and Markets Problem Statement. May 17, 2016.
0
1
2
3
4
5
6
7
8
9
10
2016 2017 2018 2019 2020 2021 2022 2023 2024 2025
VT
RI
NH
ME
MA
CT

16
pricing, through the RGGI program, and reinvesting some of the allowance auction proceeds in renewable
energy projects. By pricing carbon into the market, renewable resources become more competitive in the
marketplace. In addition to RGGI, many states in the Northeast established RPS standards in the late 1990s
and 2000s to drive renewable development. The state laws generally require electricity suppliers (utility
companies) to provide a minimum percentage of their sales from eligible renewable energy resources. The
RPS standard in Massachusetts, for example, was set at 11 percent in 2016 (for Class I resources) and will
continue to increase 1 percent per year. Figure 8 provides a forecast of the incremental renewable generation
required to meet the RPS targets in New England, as they continue to increase through 2025. In 2015,
Massachusetts, Connecticut, and Rhode Island issued a joint request for proposals (RFP) for renewable
energy and transmission projects to help achieve these policy goals. By joining together in a coordinated
procurement effort, the states were hoping to get a larger response from project developers to help meet the
states’ clean energy standards.
New York has taken a somewhat different approach by adopting a “Clean Energy Standard,” requiring
utilities and other energy suppliers to meet 50 percent of their sales from qualifying renewables by 2030,
while also directing financial support to at-risk existing nuclear facilities. This reflects a recognition that
existing nuclear facilities supply a large share of the current non-emitting generation in the state.
Another strategy has been to require utility companies to solicit proposals for renewable energy generation
and enter into long-term contracts. Massachusetts, for example, passed an energy bill in August 2016 that
requires the state’s utility companies to solicit long-term contracts for 1,600 megawatts of offshore wind
power, and 1,200 megawatts of hydropower or other renewable resources. There is currently an active
debate among stakeholders in the New England states exploring potential changes to the wholesale power
markets that could be implemented to advance state public policy objectives, including clean energy and
GHG reductions goals.18 Some of the options under discussion include strengthening the RGGI program, a
new forward market for clean energy resources, or a carbon adder in the energy market (“carbon shadow
pricing”).19
Outside of the state policy programs and mandates, companies have also been driving demand for renewable
energy by building wind and solar projects to power their facilities and signing contracts for renewable
energy. Intel, Procter & Gamble, Apple, Google, Verizon, IKEA and others having been turning to
renewables to help power their businesses.
Wind
Wind energy has been rapidly expanding in the U.S. There are more than 4 gigawatts (GW) of wind capacity
installed in the Northeast.20 New York has the highest amount of wind capacity within the region (about 1.7
GW in 2015), followed by Pennsylvania. And more wind projects are currently underway. New York has
18 The NEPOOL “Policies and Markets Problem Statement” (May 17, 2016) captures the challenge for the New
England market: “…The challenge is finding a means to execute states’ policy-related requirements at the lowest
reasonable cost without unduly diminishing the benefits of competitive organized markets or amplifying the cost to
consumers of implementing those state policies in order to maintain markets. In the same way that market mechanisms
identify the lowest cost way to satisfy the region’s reliability needs, states seek to determine whether market
mechanisms can accommodate public policies without unreasonably increasing the costs to consumers. …” 19 See New England Power Pool Integrating Markets and Public Policy website: http://nepool.com/IMAPP.php. 20 One gigawatt is equal to one billion watts or one thousand megawatts.

17
over 3.7 GW of wind power proposed for interconnection with the New York grid.21 Not all of these projects
will get built, but it is an indication of the continuing development efforts. Maine has also been attracting
significant wind development with more than 2 GW of proposed projects under review. Several wind
projects in Maine, as well as New Hampshire, submitted proposals in response to the New England Clean
Energy RFP discussed above; winning projects will need to be online by 2020.
Looking to the future, offshore wind is expected to be a significant growth area for the Northeast. Today,
offshore wind remains a nascent technology, with only one project (nationwide) nearing completion off the
coast of Rhode Island.22 High costs and political opposition have so far stymied development efforts.23 This
could change, however, as states along the Atlantic coast continue to pursue the technology. In addition to
Rhode Island, several states are actively pursuing offshore wind development, including: Maryland24, New
21 NY-ISO, Interconnection Queue. Accessed August 5, 2016,
http://www.nyiso.com/public/markets_operations/services/planning/planning_resources/index.jsp. 22 Deepwater Wind is expected to complete its first offshore wind farm (30 MW) in 2016 off Block Island; this will be
the first offshore wind farm in the U.S. connected to the mainland power grid. 23 Berwick, Ann. “Offshore wind may finally take off with big projects, none named Cape Wind.” Globe Magazine,
March 23, 2016, accessed August 5, 2016; and Mohl, Bruce. “Utilities terminate Cape Wind power contracts.”
CommonWealth, January 6, 2015, accessed August 5, 2016. 24 Maryland Public Service Commission, “Offshore Wind Energy RFP.” Accessed August 5, 2016,
http://marylandoffshorewind.com/.
Figure 9 Wind Generation by State and Region (gigawatt-hour)
Wind generation has increased significantly in the Northeast; New York, Pennsylvania, and Maine have seen the largest increase, but this could change if offshore development picks up.
Source: EIA 923 2010; EIA 923 2015
New England New York DE/MD/NJ/PA

18
Jersey25, New York26, and Massachusetts.27 As mentioned above, Massachusetts passed a new energy law
that requires utilities to procure a combined 1,600 megawatts of offshore wind by 2027.
Europe has developed significant offshore wind capacity (>10 GWs), and companies are looking to leverage
this development experience in the United States.28 As the industry grows in the U.S., more of the supply
chain, and associated jobs, could move from Europe to the Northeast. Offshore wind is one of the few
options available to add large blocks of zero-carbon energy to the Northeast power grid.
Solar
New Jersey had the highest amount of solar capacity within the region at the end of 2015 (more than 1,200
MW in 2015), followed by Massachusetts (see Figure 10).29 New Jersey was an early adopter of solar power
with its solar RPS and SREC30 market, and industry analysts expect the state to double its solar capacity over
the next five years.31 ISO New England is also projecting significant growth in solar capacity. The region’s
electric market operator projects that solar capacity in New England will increase to about 3,300 MW by
2025 (with more than 4 TWh of electricity production).32 This is roughly equivalent to the annual output of a
mid-sized fossil generating plant (600 MW @ 80% capacity factor).
25 Fishermen’s Energy, “Fishermen’s Energy.” Accessed August 5, 2016, http://www.fishermensenergy.com/. 26 Bureau of Ocean Energy Management, “New York Activities.” Accessed August 5, 2016,
http://www.boem.gov/New-York/. 27 DONG Energy’s Bay State Wind project, if approved, would add up to 1,000 MW of offshore wind 15 miles off the
coast of Martha’s Vineyard. DONG Energy is the worldwide leader in offshore wind development. See U.S.
Department of the Interior. Interior Department Leases Area Offshore Massachusetts for Wind Energy Development.
Office of the Secretary, January 29, 2015. Accessed August 5, 2016, https://www.doi.gov/news/pressreleases/interior-
department-leases-area-offshore-massachusetts-for-wind-energy-development. 28 Wind Europe, “Wind in power: 2015 European statistics.” Accessed August 5, 2016, https://windeurope.org/about-
wind/statistics/european/wind-power-2015-european-statistics/. 29 New Jersey, Maryland, and Delaware have the best solar resource (the amount of solar radiation that reaches a
specific location) among the Northeast states (4.5-5.0 kilowatt-hours per square meter per day). 30 Solar Renewable Energy Certificates (SRECs) are credits produced from qualifying solar energy projects. 31 Solar Energy Industries Association, “New Jersey Solar.” Accessed August 5, 2016, http://www.seia.org/state-solar-
policy/New-Jersey. 32 ISO New England, “Final 2016 PV Forecast Details.” Accessed August 5, 2016, https://www.iso-ne.com/static-
assets/documents/2016/04/2016_pvforecast_20160415.pdf. ISO New England assumes an annual capacity factor of
14.1% in its solar forecast.

19
More solar is being deployed because the technology has improved and installation costs have fallen
significantly in recent years. The Northeast states have also established a robust solar industry with almost
43,000 workers33 employed by the solar industry in 2015, according to the Solar Foundation.34
Massachusetts and Vermont rank among the top five states for solar jobs per capita.35 Between 2009 and
2015, the levelized cost of generating electricity (LCOE: total cost of installing and running a project divided
by expected electricity output over the project’s lifetime) from solar resources fell by 82 percent.36 The U.S.
Department of Energy (NREL) projects that solar costs will continue to fall, with capital costs for utility-
scale projects declining to roughly $1/watt by 2030.37 Others are more bullish, projecting that costs will dip
below $1.0/watt by 2020.38
33 This includes jobs in solar installation, manufacturing, sales and distribution, and project development. 34 The Solar Foundation, “Solar Jobs Census 2015.” Accessed August 5, 2016, http://solarstates.org/#states/jobs. 35 The Solar Foundation, State Solar Jobs Census Compendium 2015. Accessed August 5, 2016,
http://www.thesolarfoundation.org/solar-jobs-census/solar-jobs-compendium/. 36 Lazard. “Levelized Cost of Energy Analysis 9.0.” November 17, 2015. Accessed April 13, 2016,
https://www.lazard.com/perspective/levelized-cost-of-energy-analysis-90/. 37 To put this in perspective, the overnight capital cost for utility-scale solar projects in 2014 is estimated at $1.90/watt.
See National Renewable Energy Laboratory, “Annual Technology Baseline,” July 8, 2015, accessed August 5, 2016,
http://www.nrel.gov/docs/fy15osti/64077.pdf. 38 Cusick, Daniel. “Solar for less than a McDonald's coffee? It's coming.” E&E News, June 1, 2016, accessed August 5,
2016, http://www.eenews.net/stories/1060038112.
Figure 10 Solar Capacity through 2015 (megawatt)
New Jersey and Massachusetts have added the most solar capacity among the Northeast states due to a combination of supportive policies, declining panel costs, and competition among solar installation firms. Source: Estimated by U.S. EIA (Electric Power Monthly, year-to-date through December 2015). Distributed solar is less than 1 MW. EIA, ISO-New England, and the Solar Energy Industries Association all report state-by-state solar capacity, and the data vary to some degree because they each rely on different methodologies.

20
Integrating Renewables
As the amount of wind and solar power increases, one of the challenges will be to integrate variable energy
resources that depend on the weather into the existing wholesale market structure and the operation of the
grid. Wholesale electricity prices reflect the cost of producing electricity and delivering it over a high-
voltage transmission system. As more renewable energy is added to the system, with zero fuel costs, the
revenues earned by all generators through the energy markets is likely to decline. Faced with declining
energy prices, it then becomes incumbent on capacity and ancillary service markets, and other mechanisms,
to ensure that a flexible resource mix is available to maintain grid reliability. Market operators in the
Northeast and other parts of the U.S. have been introducing reforms to address this challenge.
Distributed solar, located at homes and businesses, has been an attractive option in many states with various
incentives available. Net metering is a billing system by which utility customers with on-site generation
(primarily solar panels) can sell their excess electricity to their electric utility provider. Forty-one states and
the District of Columbia have put in place some form of net metering rules. These rules also set the rates at
which ratepayers are credited for the electricity they feed into the grid.39 These payments or credits have led
to significant deployment of solar panels in the U.S., particularly in the residential and commercial sector.40
39 DSIRE, “Net Metering.” February 2016. Accessed April 13, 2016, http://ncsolarcen-prod.s3.amazonaws.com/wp-
content/uploads/2016/02/Net_Metering_022016.pdf. 40 Hallock, Lindsey and Rob Sargent. “Shining Rewards: The Value of Rooftop Solar Power for Consumers and
Society,” 2016. Accessed August 5, 2016,
http://www.environmentamerica.org/sites/environment/files/reports/EA_shiningrewards_print.pdf.
Figure 11 Levelized Cost of Energy (LCOE) in 2030 (2013$/MWh)
NREL projects continued declines in the cost of wind and solar technology, making these alternative technologies increasingly competitive with natural gas combined cycle generation. The projected costs of wind and utility-scale solar technology in 2030 are lower than a new natural gas plant in some cases. Source: National Renewable Energy Laboratory (NREL) Annual Technology Baseline (ATB) Summary Presentation – 2015 Final, Released July 8, 2015. Solar-PV utility-scale representative plant is single axis tracking with capacity of 100 MW. NREL projects low, medium, and high cost
estimates for wind and solar to reflect to reflect the uncertainty associated with their cost and performance assumptions.
$0
$50
$100
$150
$200
$250
Low Mid High Low Mid High Low Mid High Low Mid High
Land-Based Wind Offshore Wind Solar - PV Gas (CC)

21
However, some within the industry, including many utilities, argue that the tariffs, which are often set at full
retail electricity rates, are overly generous. They point out that retail rates include not just energy charges,
but also distribution and generation capacity costs. The concern raised is that these payments or credits will
shift a growing share of the maintenance and development costs of the electricity grid to an ever smaller
group of ratepayers that do not use solar panels.
Net metering policies have given rise to contentious debates in several states. Over 60 percent of all states
with net metering policies limit in some form the total amount of generating capacity that may connect to the
grid to sell excess electricity to their utilities.41 When the limits are exhausted only further regulatory or
legislative action can enable new projects to take advantage of the terms available under net metering
policies. But any such effort leads to a debate that has never quite been settled. A key question going
forward will be how to balance the incentives for solar development while attracting investments into the
sector to maintain critical infrastructure.
Transmission: A Critical Resource for Expanding the Renewables Resource Base
As the Northeast states seek to achieve aggressive renewable energy goals, developers are proposing new
transmission projects to move power from remote energy projects to the region’s load centers. New York,
for example, is evaluating potential transmission projects to move electricity from new upstate wind farms
down to New York City. As of September 1, 2016, fourteen transmission projects had been proposed in the
ISO New England Interconnection Queue, totaling more than 9,000 MW of potential transfer capability to
bring power from large-scale hydroelectric facilities in eastern Canada and wind projects in northern New
England, as well as other resources.42
On a local level, as energy sources are increasingly distributed throughout the system and interspersed with
consumers, the grid is becoming more integrated. This is changing the way that the grid is managed and
operated by shifting the direction the power flows on lines, emphasizing the need for local generation,
additional connections, and coordination among generators, grid managers, and consumers. Entities across
the Northeast are investing in new programs to facilitate the move to a more flexible, integrated transmission
and distribution system.
The evolving nature of the grid, combined with the need to upgrade and maintain aging infrastructure, has
triggered significant investment in the past decade. According to the Edison Electric Institute, investor-
owned utilities alone invested about $73 billion in transmission infrastructure from 2010 through 2014 and
are estimated to spend another $85 billion from 2015 through 2018. In the Northeast, DOE notes that
investment reached nearly $2 billion in 2012. Looking forward, DOE also reports that, as of 2014, over 130
circuit-miles were in construction in New York and New England and neighboring parts of Canada; another
1,300 circuit miles were planned to be completed by 2019, and an additional 75 circuit miles by 2024. In
addition to under construction and planned lines noted in this report, which either have completed permitting,
41 National Renewable Energy Laboratory. “Status of Net Metering: Assessing the Potential to Reach Program Caps,”
September 2014. Accessed April 13, 2016, http://www.nrel.gov/docs/fy14osti/61858.pdf; and St. John, Jeff. “Breaking:
California’s NEM 2.0 Decision Keeps Retail Rate for Rooftop Solar, Adds Time-of-Use.” Greentech Media, January
28, 2016. Accessed April 13, 2016, http://www.greentechmedia.com/articles/read/Californias-Net-Metering-2.0-
Decision-Rooftop-Solar-to-Keep-Retail-Payme. 42 ISO New England. The Transformation of the New England Power System: Infrastructure Needs and Market
Implications. September 28, 2016. https://www.iso-ne.com/static-assets/documents/2016/09/gvw__nec_9_28_2016.pdf.

22
are required for regulatory reasons, or have a complete design, DOE also tracks “conceptual” lines that are
either projected in transmission plans or may be required to meet NERC standards. This same northeastern
region has over 600 conceptual circuit miles in the pipeline.
There have been challenges siting and permitting some large transmission projects. Developers typically
need approval from several state and federal agencies, which is a multi-year process. Markets that cross state
lines, such as ISO NE, can help by coordinating Regional System Planning processes to conduct joint
planning, though each affected state retains jurisdiction over the specific siting in its territory. The ISO has
also occasionally used cost distribution across all users in its market, based on an understanding that the
benefits of new transmission lines can spread far beyond their exact pathways. However, this remains a
challenge for transmission improvement and development across the region.
Energy Storage: An Asset to Renewables Development & Reliability
As the Northeast plans for a system that is more dependent on variable renewable resources, energy storage
will play an important role in providing cost-effective and reliable electricity. Storage systems draw energy
from the system when there might be more than necessary (for example, when wind generation increases in
the evening), and discharge stored energy when it is needed to serve customer demand. At the end of 2015,
U.S. storage capacity reached 221 MW, up 243 percent from 2014, and is expected to surpass 4 GW by
2020.43 In the Northeast, states are working to advance the technology through procurement mandates, pilot
programs, and market design changes aimed at recognizing the services that can be provided by a range of
energy storage applications.
Energy storage goes far beyond battery technologies. In fact, the largest form of energy storage in the United
States and Northeast is pumped hydro storage, where water is pumped uphill during times of off-peak
43 GTM Research, Q2 2016 U.S. Energy Storage Monitor. Accessed August 5, 2016,
http://www.greentechmedia.com/research/subscription/u.s.-energy-storage-monitor.

23
demand, then released in controlled amounts to power turbines during times of peak demand. New York is
one of the national leaders today for energy storage with 1,400 MW of pump storage capacity on-line.44
Other energy storage applications include flywheels, which use a motor to store energy as kinetic energy in a
mass that spins at very high speed. When power is needed, the grid can pull energy from the flywheel, using
the motor as a generator to return the energy to the power grid. Flywheels offer strong and rapid frequency
regulation services by providing fast response and high ramp speed, an increasingly important task with more
renewable generation on the system. In recent years, battery technologies have been the most common
storage medium used by project developers, accounting for 96 percent of total storage deployment in 2015.45
Maine has recently added a 500 kW battery system.46 Three more battery projects totaling 94 MW are
currently in the New England ISO queue. PJM has 1,831 MW of storage under study in the interconnection
queue.
Storage technologies could enhance the value of wind and solar by allowing
electricity to be stored for later use. Storage technologies can also provide important
services to the grid, including reducing peak demand, voltage support and frequency
regulation, and grid resiliency. There is still work to do, however, in terms clarifying
regulatory treatment of storage technologies and crafting effective business models
for energy storage systems.
Energy storage can be applied in a variety of ways to strengthen and improve the cost-effectiveness of the
electricity system. For example, a battery storage system in Boothbay, Maine was deployed to help avoid the
need for transmission upgrades. This was part of a pilot project testing non-transmission alternatives to meet
peak demand, including ice cooling systems, distributed solar, energy efficiency, and a large diesel generator.
Storage systems can also provide voltage support and frequency regulation services, which are increasingly
important to incorporate higher levels of variable energy sources. Energy storage can also be used to store
and later disperse renewable energy—this can occur through state initiatives, through pairing renewable
installations with batteries or other storage devices (as some home rooftop solar companies now offer), or
through markets, as they begin to reflect larger price differentials between hours of high renewable
production (leading to often very low energy prices) and hours with little or no renewable production.
The Northeast states have begun pursuing market and regulatory changes to integrate more storage. For
example, in 2009, the NYISO became the first grid operator in the nation to implement regulations that
enable storage systems to participate in the markets as frequency regulation providers, providing reserve
capacity for grid operators. To provide these systems access to the market, a new type of regulation service
provider was defined: Limited Energy Storage Resource (LESR).
44 NY-BEST, New York Energy Storage Roadmap, September 2012. Accessed August 5, 2016, https://www.ny-
best.org/sites/default/files/type-page/4254/attachments/NY-BEST%20Roadmap_final-1.pdf. 45 GTM Research, U.S. Energy Storage Monitor: 2015 Year in Review Executive Summary, March 2016. 46 Walton, Robert. “Maine turns to battery storage to avoid transmission investment.” UtilityDive, June 9, 2015,
accessed August 5, 2016, http://www.utilitydive.com/news/maine-turns-to-battery-storage-to-avoid-transmission-
investment/400440/.

24
The New England ISO had a brief setback in 2014 when the FERC denied changes to its market for voltage
regulation services, arguing that these new changes were discriminatory to storage technologies.47 Since
then, however, the ISO has made further modifications to its tariffs to allow for increased energy storage
participation. A recent report by the New England ISO identified opportunities for different technologies
and responding to stakeholder feedback, and this June submitted a filing to FERC to request market changes
to increase market participation of energy storage resources. It also had a pilot program in place (from 2008
to 2015) that encouraged alternative technologies to participate in wholesale electricity markets, in which a
flywheel system participated by providing quick response regulation and other services.48
States and utilities throughout the region have instituted procurement and subsidy programs aimed at
increasing storage penetration and further supporting energy storage R&D. For example, the New York
State Energy Research and Development Authority (NYSERDA) will fund seven companies based inside the
state to either scale up projects or demonstrate how energy storage can help transform the state's electricity
grid.49 Green Mountain Power, the largest utility in Vermont, has partnered with NRG and Tesla to provide
customers with personal home energy storage systems paired with solar installations.50 And, Massachusetts
announced in May 2015 a $10 million energy storage initiative that will analyze opportunities to support
storage options, including a pilot program and further policy options to encourage storage deployment.51
Nuclear Power: Economic Challenges for a Zero-Carbon Resource
As renewable energy expands across the Northeast, states are confronted with critical questions regarding the
largest current source of carbon-free generation—nuclear power. Nuclear energy accounted for 35 percent of
the Northeast region’s total electricity production in 2014 and 79 percent of the region’s zero-carbon energy
generation.52 Among the RGGI states, there are seventeen nuclear units currently in operation, although
several are scheduled to close. Pennsylvania is home to a significant nuclear fleet, including nine units at
five locations. There are three nuclear power stations in New Jersey.
For many years, these facilities were highly profitable sources of zero-carbon energy generation, while also
providing round-the-clock power. However, low wholesale electricity prices are posing a major economic
challenge for many of the region’s nuclear plants. Nuclear units are finding it harder to cover their operating
costs and sustain profitability in competitive markets where low natural gas prices are driving down the
wholesale price of electricity. Nuclear plants now may also encounter further economic pressures with wind
and solar energy also driving down wholesale electric prices.
47 Energy Storage Association, “Resources: New England.” Accessed August 5, 2016, http://energystorage.org/energy-
storage/industry-resources/new-england. 48 “New energy-storage options emerging in New England; ISO-NE published primer and makes FERC filing on market
participation,” ISO NEWSIRE, June 22, 2016. Accessed August 5, 2016,
http://isonewswire.com/updates/2016/6/22/new-energy-storage-options-emerging-in-new-england-iso-ne-pu.html. 49 Walton, Robert. “New York funds 7 energy storage projects for REV initiative.” UtilityDive, June 2, 2015. Accessed
August 5, 2016, http://www.utilitydive.com/news/new-york-funds-7-energy-storage-projects-for-rev-initiative/400064/. 50 See Green Mountain Power, “Enhancing energy independence and providing savings to Vermonters.” Accessed
August 5, 2016, http://www.greenmountainpower.com/innovative/gmp-nrg-making-vermont-a-national-leader/; and
Green Mountain Power, “TESLA Powerwall.” Accessed August 5, 2016,
http://products.greenmountainpower.com/product/tesla-powerwall/. 51 Walton, Robert. “Massachusetts launches $10 million energy storage initiative.” UtilityDive, June 1, 2015. Accessed
August 5, 2016, http://www.utilitydive.com/news/massachusetts-launches-10-million-energy-storage-initiative/400007/. 52 MJB&A analysis based on EIA-923.

25
As a result of these changing economics, which in some instances has been exacerbated by operational
challenges at specific units, several nuclear plants have announced plans to retire before their license periods
expire, or have already begun the process of decommissioning, as is the case with Vermont Yankee. Oyster
Creek in New Jersey and the Pilgrim plant in Massachusetts are both slated to retire in 2019. State regulators
have intervened in an attempt to save the James Fitzpatrick and R.E. Ginna facilities in upstate New York.
These units currently serve to significantly lower the overall GHG intensity in the Northeast region, and the
nature of what type of energy will replace the output of these plants is not a trivial question. If gas is the
dominant resource used to replace existing nuclear plants, the challenging GHG goals in specific states may
become insurmountable under current timelines.
Energy Efficiency: More Savings, More Investment
Energy efficiency has become an integral part of the energy landscape in the Northeast and continues to be
an area ripe for innovation. State, community, and utility-managed efficiency programs reduce energy bills
and help to alleviate reliability concerns during periods of peak electricity demand. New businesses have
been established to serve the demand for efficiency and energy management services, creating an important
source of employment and business activity within the region. For example, GE recently launched a Boston-
based startup focused on high efficiency lighting and other alternative energy technologies, including load
controls, sensors, motion detectors, and wireless monitoring systems.53 According to the Northeast Energy
Efficiency Partnerships (NEEP), there are more than 300,000 people in the Northeast and Mid-Atlantic
employed in the energy efficiency space, including electricians, construction workers, HVAC installers, and
program managers.54
Many of the Northeast states rank among the top in the nation for their energy efficiency programs and
policies: Massachusetts (#1), Vermont (#3), Rhode Island (#4), Connecticut (#6), Maryland (#7), and New
York (#9).55 All of these states have made a concerted effort to prioritize energy efficiency using a portfolio
of programs and policies. Key among these are: (1) decoupling or lost revenue mechanisms, (2) performance
incentives that allow utility companies to earn a return on their investment in energy efficiency programs that
is on par with investments in supply-side resources, (3) savings targets for utility companies, and (4) markets
that recognize energy efficiency as a resource, similar to traditional supply-side generating facilities. The
goal in many of these states has been to align utility shareholder interests, customer interests, and public
policy objectives. Utility ratemaking can allow utilities to earn a return on their investments in energy
efficiency programs; customers benefit and businesses are more competitive with lower energy bills; and
progress can be made toward other policy objectives (e.g., reducing carbon emissions).
53 Current powered by GE, “We Are Current,” accessed August 5, 2016, http://www.currentbyge.com/. 54 U.S. Department of Energy, U.S. Energy and Employment Report. Last modified March 2016. Accessed August 5,
2016, http://www.neep.org/sites/default/files/resources/Energy Efficiency Snapshot Spring 2016_FINAL_0.pdf. 55 ACEEE, “ACEEE State Scorecard: Massachusetts Edges Out California as Most Energy-Efficiency State, Maryland
Among Most Improved.” Last modified October 21, 2015. Accessed August 5, 2016,
http://aceee.org/press/2015/10/aceee-state-scorecard-massachusetts.

26
Many of the Northeast states have also established aggressive savings targets for utility companies with
funding provided from RGGI auction revenues and system benefit charges. Rhode Island and Connecticut,
for example, both require utility companies to acquire all cost-effective energy efficiency before securing
additional supply-side resources.56 Maryland requires its utility companies to achieve a 2 percent reduction
in electricity sales from 2013 levels by 2020.
Energy efficiency offers a significant opportunity to enhance customer value and
affordability. Many of the Northeast states have recognized the value of efficiency
and have sought to increase investment in energy-saving technologies. Technology
innovation is opening new opportunities for even deeper energy savings.
The New York Public Service Commission (NY PSC) has gone even further by making major structural
reforms to its electric utility regulations in an effort to further promote efficiency and carbon reductions.
New York utilities will continue to operate as natural monopolies, but their revenues will be tied to the
delivery of “consumer value,” rather than simply earning a regulated rate of return for investing in
transmission or central station power plants. The new regulatory structure will diversify the ways that
utilities can earn revenues, incentivizing investments in cost-effective demand-side energy efficiency and
distributed generation. As an example of what this could look like, the NY PSC cites Consolidated Edison’s
Brooklyn/Queens Demand Management (BQDM) Program, approved in December 2014. The program
56 ACEEE, “State Energy Efficiency Resource Standards (EERS).” Last modified May 2016. Accessed August 5, 2016,
http://aceee.org/sites/default/files/eers-052016.pdf.
Figure 12 Per Capita Investment in Energy Efficiency (Utility Programs)
Per capacity investment in energy efficiency (electric) has generally been increasing among the Northeast states. Source: NEEP REED Database: Expenditures as Percent of Total Cost, and ACEEE Electricity Efficiency Program Spending and Savings tables.
$0
$10
$20
$30
$40
$50
$60
$70
$80
$90
CT DC DE ME MA MD NH NJ NY PA RI VT
2011 2012 2013 2014

27
enabled Consolidated Edison to defer the construction of a $1 billion electrical substation in Brooklyn by
using a combination of energy efficiency, solar, and batteries. The Commission authorized a return on total
program expenditures, as well as performance incentives tied to goals on customer savings, thereby aligning
utility financial incentives and customer interests.
The electric power markets in the Northeast—ISO NE, NY ISO, and PJM—have all established market rules
allowing energy efficiency and demand response to participate to varying degrees in the energy, capacity,
and ancillary service markets, competing along-side conventional generating facilities. For example, in New
England, demand-side resources accounted for 8 percent of the resources procured to meet future projected
demand in the 2016 forward capacity auction.57
In the coming years, the six New England states will invest more than $1 billion annually in energy
efficiency programs, and much more will be spent directly by households and businesses looking to reduce
their energy costs.58 As a result, energy efficiency (and distributed solar) is projected to produce a net
reduction in the New England region’s grid-based electricity use, offsetting more than 100 percent of
anticipated growth (see Figure 11).59 ISO NE projects the region’s overall electricity demand will decline -
0.2 percent annually (although peak summer demand continues to increase).60 In contrast, electricity demand
in New England increased by 0.5 percent annually between 2000 and 2010. NYISO also projects a decrease
57 ISO New England, “ISO-NE Capacity Auction Secures Sufficient Power System Resources, At a Lower Price, for
Grid Reliability in 2019-2020,” February 11, 2019. Accessed August 5, 2016, http://www.iso-ne.com/static-
assets/documents/2016/02/20160211_fca10_initialresults_final.pdf. 58 ISO New England, “Energy-Efficiency Forecast.” Accessed August 5, 2016, http://www.iso-ne.com/system-
planning/system-forecasting/energy-efficiency-forecast. 59 Ibid. 60 ISO-New England, “Key Grid and Market Stats.” Accessed August 5, 2016, http://www.iso-ne.com/about/key-stats.
Figure 13 Projected Electricity Demand and Savings (Terawatt Hour)
Source: New England: ISO-NE CELT 2016; New York: NYISO Gold Book 2016.
152
156
160
164
168
172
176
20
16
20
17
20
18
20
19
20
20
20
21
20
22
20
23
20
24
20
25
120
125
130
135
140
145
150
155
20
16
20
17
20
18
20
19
20
20
20
21
20
22
20
23
20
24
20
25
Minus PV
Gross Load
Minus PV, PDR
PV, PDR
Savings
Gross Load
Minus EE
EE
Savings
New England New York

28
in load growth in the coming years due to energy efficiency investments (see figure 13).61 A large source of
funding for energy efficiency programs in the northeast is the RGGI program, under which states utilize the
majority of revenues from allowance sales to fund energy efficiency programs that further reduce regional
GHG emissions.
The challenge for utilities and energy service providers going forward will be to secure savings from a more
diverse set of technology measures and program participants.62 Gone are the days when compact fluorescent
lightbulbs (CFL) could be relied on to deliver large energy savings; federal law has effectively banned
standard incandescent light bulbs. The future of energy efficiency is now focusing on high efficiency LED
lighting, integrated controls, zero energy buildings, intelligent building technology, high-performance heat
pumps, big data, and smart grid technologies.63
61 NY-ISO, 2015 Load & Capacity Data, “Gold Book”, April 2015. Accessed August 5, 2016,
http://www.nyiso.com/public/webdocs/markets_operations/services/planning/Documents_and_Resources/Planning_Dat
a_and_Reference_Docs/Data_and_Reference_Docs/2015%20Load%20%20Capacity%20Data%20Report_Revised.pdf. 62 York, Dan, “The next generation of energy efficiency programs could save22% of electricity use in 2030,” ACEEE
Blog, September 15, 2015, 11:12 a.m., http://aceee.org/blog/2015/09/next-generation-energy-efficiency. 63 Northeast Energy Efficiency Partnerships, The Regional Roundup of Energy Efficiency Policy: Next Generation
Energy Efficiency, February 2016, accessed August 5, 2016, http://www.neep.org/2016-regional-roundup.
In an effort to cut back on energy use, Digital Lumens, in partnership with Leading Edge Design Group, conducted a lighting retrofit of Dartmouth College’s 91,000 square foot Leverone Field House in Hanover, New Hampshire. The sports complex was previously lit by 1,000-Watt metal halide fixtures. Implementation of their Intelligent LED Lighting System involved the replacement of all high-bay fixtures with LEDs, installation of rotating lights with dimmers, occupancy and daylight sensors, and a customizable lighting management system. This retrofit achieved a 75 percent—482,000 kWh—annual lighting energy savings for the facility.
Photo credit: Digital Lumens
Figure 14 Lighting Retrofit at Dartmouth College

29
Commercial lighting systems, in particular, have been rapidly improving and now come equipped with
automatic controls that adjust lighting based on daylight availability and switch off lights at specified
intervals. Intelligent lighting control systems can integrate lighting and building controls for a single room, a
whole building or even multiple campuses. These networked systems are able to learn building use trends
and optimize comfort and energy savings by automatically adjusting lighting and other systems as usage
patterns change over time. Integrated controls can also provide complete facility energy usage information
as well as remote operation and control capabilities.
Energy management systems are also available for residential use. Home energy management systems allow
households to monitor their energy use and control devices within the home from their phone or computer to
reduce energy use and shift usage to off-peak periods. The technology is still in the early stages of adoption,
but offers the potential for deeper energy savings and better integration of advanced energy devices.
Distribution System Resource Planning and the Smarter Grid
The development of the smart grid is improving control of the grid and the ability of system operators, and
even consumers, to monitor their energy use. Increased control allows operators to send nearly instantaneous
signals to “smart” grid equipment, generators, and sources of demand to adjust operations, leading to better
reliability outcomes and lower operating costs. Visibility helps system operators plan better for and rapidly
respond to grid conditions by allowing entities to see how facilities are operating in real time and how
consumers are drawing electricity. With smart grid capabilities, utilities can instantly know the exact
location of outages; utilities and customers can both track usage on a minute-by-minute basis. Other aspects
of the smart grid allow for greater control of the grid and connected resources, ranging from near-
instantaneous changes to small generators’ output to increased ability for customers to adjust their demand to
take advantage of lower prices or to lower grid stressors, either individually or through emerging companies
that help large groups of customers participate in new demand management programs. These capabilities—
and many more—have led to reduced system losses and electricity costs.
A key benefit of the smart grid is helping to improve the integration of renewable generators, especially
those that are distributed among consumers. For example, the smart grid can improve distributed resource
“visibility” by transmitting signals from distributed resources back to central locations, allowing grid
planners and managers to track the output from small resources throughout the grid that previously were
invisible to the system. Grid managers can then better account for these resources in ensuring that demand
meets supply, and individual distribution lines are capable of handling the flows of electricity likely to be on
them. The smart grid can also provide increased data that can be used for forecasting future renewable output
by using collected generation data to build models that predict distributed resource generation under certain
conditions. Finally, smart inverters, which are used to connect many distributed resources to the system
(especially solar resources) are allowing these resources to respond in real time to grid conditions, adjusting
output to provide frequency or voltage adjustments to retain reliability, to continue to provide power through
grid disruptions, and help smooth out natural variation in renewable power. Taken together, these and other
smart capabilities of the grid are allowing the system to incorporate higher levels of distributed resources
while maintaining a reliable system.
Many states across the Northeast have put in place programs to advance smart grid deployment. For
example, building upon an initial roll out of smart electric meters in 2004, utilities in Vermont are

30
participating in eEnergy Vermont, which received over $200 million in federal grant to improve system
communication, upgrade and automate distribution equipment, and increase smart meter use. In
Pennsylvania, state legislation in 2008 authorized utilities to upgrade customers to smart meters and move
them to “time of use” pricing, which differs retail rates based on the time electricity is consumed, which can
be a critical tool for managing peak demand, mitigating distribution and transmission costs, and improving
system reliability. A 2012, $19 million pilot in Harrisburg installed hundreds of electronic devices, a new
distribution management system, and dedicated communications systems that worked together to improve
service, reliability and system operations. The implementing utility, PPL plans to install distribution
automation technology in close to half of its service area (central and eastern Pennsylvania) by the end of the
decade.
Electric Vehicles: More Vehicles, More Electricity Demand
Electric vehicles (full battery-electric and plug-in hybrids) account for a small share of new passenger car
sales in the U.S. (1.5% in 2015, excluding light trucks); however, new models are coming on the market each
year and several states have set a goal of having at least 3.3 million zero emission vehicles on the road by
2025 (see inset box).64 In 2015, it is estimated that roughly 116,000 EVs were sold in the U.S.65 In the long
64 See Yang, Zifei, “2015 Global electric vehicle trends: Which markets are up (the most),” The International Council
on Clean Transportation Blogs, May 18, 2016, http://www.theicct.org/blogs/staff/2015-global-electric-vehicle-trends;
and U.S. Energy Information Administration, “California leads the nation in the adoption of electric vehicles,”
December 10, 2014. Accessed August 5, 2016, http://www.eia.gov/todayinenergy/detail.cfm?id=19131. 65 To put this number in perspective, auto makers sold 17.5 million cars and light trucks in the U.S. in 2015, according
to the Wall Street Journal. InsideEVs, “Monthly Plug-In Sales Scorecard.” Accessed August 5, 2016,
http://insideevs.com/monthly-plug-in-sales-scorecard/. InsideEVs. http://insideevs.com/monthly-plug-in-sales-
scorecard/.
Figure 15 Cost of Lithium-Ion Battery Packs ($/kilowatt hour)
$0
$200
$400
$600
$800
$1,000
2010 2015 2020 2025 2030
Actual
Estimated Range
Source: Source: Bloomberg New Energy Finance 2016

31
term a significant shift to electric vehicles could drive large reductions in transportation sector CO2
emissions, while creating additional demand for electricity. Given the currently anticipated growth,
however, EVs are not expected to have a significant effect on electricity demand in the next 5 to 10 years. In
the long term, a shift to electric vehicles could have profound implications for several major economic
sectors by displacing oil demand and providing a large potential base of demand-response capacity.
The key challenges in scaling up the use of electricity as a transportation fuel include: (1) increasing electric
vehicles sales; (2) building public fueling infrastructure, providing confidence in the availability of charging
stations; and (3) potential electric system impacts (distribution-level) from high concentrations of plug-in
vehicles.
The auto industry has made significant progress in developing viable electric vehicles in the last 10 years. In
2010, there were only two EV models commercially available from major auto manufacturers—today there
are more than 25, with additional models projected to be available every year. The vast majority of EVs are
two- and four-door compact sedans such as the Nissan Leaf, Volkswagen e-Golf, and Ford Focus EV, with
price tags ranging from $23,000 to $43,000, and advertised range per charge from 53 to 107 miles. There are
several luxury models available including the BMW i3 and Mercedes B-Class, with a price of approximately
$43,000 but comparable size and range as the other compacts. The only true mid-size EV on the market is
the Tesla Model S, which gets 240 miles per charge but has a price tag of more than $70,000. The all-wheel
drive version of the Model S includes a larger battery pack that allows it to travel 270 miles on a charge but
costs over $100,000.
While the current generation of EVs have proven to be reliable and appealing to a number of early adopters,
more widespread adoption continues to be hampered by their high cost relative to gasoline vehicles, and by
their limited range. Battery costs are the most significant driver of both EV purchase cost and the effective
States Seek Expanded Role for Electric Vehicles
In 2013, California, Connecticut, Maryland, Massachusetts, New York,
Oregon, Rhode Island, and Vermont signed a memorandum of
understanding (MOU) to support the deployment of zero emission
vehicles (ZEV), including battery electric vehicles and fuel cell vehicles.
One of the major goals of the MOU is to deploy at least 3.3 million ZEVs
and adequate fueling infrastructure within the eight states by 2025. To
reach this goal, annual electric vehicle sales over the next ten years
would have to increase by 400% or more compared to 2014. In May
2014, the task force created by these states published a ZEV Action
Plan, which identifies 11 priority actions to accomplish the goals of the
MOU, including development of uniform standards related to vehicles
and infrastructure; development of state-wide building codes to support
installation of charging infrastructure; establishing ZEV purchase targets
for government fleets and commitments for the use of ZEVs in state
contracting; evaluation of additional monetary and non-monetary
incentives for ZEV purchase; and development of a coordinated
education and outreach campaign to promote the benefits of ZEVs.

32
range of commercial models. Battery costs have fallen by more than 60 percent in the last 5 years, and are
projected to continue to fall, which will allow for future EVs with greater range and lower purchase cost.
General motors will begin selling the Chevy Bolt in Fall 2016 (model year 2017). This EV will be priced as
low as $37,500 (MSRP) and will have 200+ mile range. Tesla has also begun taking pre-orders for their
2018 Model 3 sedan, which will begin production some time in 2017. This EV has an MSRP as low as
$35,000 and will have a range of “at least 215 miles” according to Tesla. If these vehicles prove successful,
they could significantly expand the market for EVs beyond the limited pool of early adopters.
In order to encourage EV adoption, both the federal government and some states provide financial incentives.
The federal government provides a tax credit of $2,500 to $7,500 for the purchase of battery electric vehicles
(BEV) that run exclusively on electricity or plug-in hybrid electric vehicles (PHEV), depending on the size
of the battery pack. However, these credits will start to phase out for specific EV models once the
manufacturer has sold 200,000 vehicles. In the Northeast, Massachusetts and New Jersey provide state
financial incentives for light-duty EV purchases. Massachusetts offers a $2,500 rebate for purchase of an EV
or Chevy Volt (a PHEV) and a $1,500 rebate for the purchase of most other PHEVs. New Jersey exempts
BEVs from the state sales tax. New York does not offer incentives for light-duty EV purchases but does
have a rebate program for medium-duty battery electric trucks.
Electric vehicles have the potential to be a game changer by creating substantial new
demand for electricity, while trimming demand for oil. The Northeast states
currently spend upwards of $20 billion per year on imported oil. EV deployment
would not only reduce the region’s dependence on imported oil, but could also
significantly reduce air pollution emissions from the transportation sector. EVs could
also be used to help manage the grid by discharging energy back to the grid during
periods of peak demand.
Compared to the same model gasoline vehicle, EVs cost $12,000 to $19,000 more before federal and state
rebates. For example, after the state and federal tax credit, a Massachusetts resident would pay only $2,000
to $9,000 more for a EV compared to the same gasoline vehicle. If a consumer drives 10,000 miles per year,
the vehicle owner would save about $310/year in fuel costs with an EV, at current fuel prices ($2.27/gallon
for gasoline and $0.125/kWh for electricity). Thus, the current, average pay-back period on the purchase of
an EV is six to 29 years even with federal and typical state incentives. However, pay-back periods would be
significantly shorter with fuel prices at 2014 levels (average of $3.36/gallon). At these average prices, the
annual fuel cost savings for an EV could have been as high as $700, which would make the pay-back period,
after federal and typical state incentives, as short as three years.
As discussed earlier in this report, many of the Northeast states have committed to economy-wide
greenhouse gas reduction targets, and the transportation sector is the leading source of CO2 emissions (38%
in 2013). Achieving these reduction goals would be impossible without significant progress in reducing
transportation sector emissions, and EVs offer one of the best options for addressing transportation sector

33
emissions. Electric vehicles would also reduce the region’s dependence on imported oil. The figure below
estimates the reductions in CO2 and the increase in electricity demand with different EV penetration levels.
Conclusion This report covered a fair amount of ground in discussing the electric market trends in the Northeast.
However, it has really only scratched the surface in terms of addressing the full policy landscape, the
innovative technologies that are continuing to emerge, and the challenges that lie ahead. However, we hope
that this report will be a helpful introduction to these topics and motivate further exploration and dialogue. If
the region transitions to rely more on electricity to power the region, the need for a reliable and cost-effective
electric system will only further increase. The industry is at a crossroads, there will be significant changes
between now and 2030, and it will be fascinating to engage and observe the changes to come.


