43
Power System Emergency - 6 March 2014 Brian Dames Chief Executive 7 March 2014
| Date post: | 14-Feb-2018 |
| Category: |
Documents |
| Upload: | duongkhanh |
| View: | 215 times |
| Download: | 0 times |

Power System Emergency -6 March 2014
Brian Dames
Chief Executive
7 March 2014

2
Key Message
Overview of the Power Emergency Declaration
System Status
Understanding load shedding
Conclusion

3
Key Message
Overview of the Power Emergency
System Status
Understanding load shedding
Conclusion

Key messages
• Eskom declared an emergency at 06:00 on 6 March 2014 and for the first time since 2008, implemented rotational load shedding at 08:00. The emergency was lifted at 22:00 on 6 March 2014 and load shedding stopped
• This was a painful yet necessary decision to protect the electricity power system from a total black-out. A total black-out would have significant consequences on the South African economy
• Eskom’s power stations are old and the system is tight. Any event impacting >1500MW, could have a significant impact on the availability of supply
• While we are committed to provide early warning, this was the earliest we could communicate as the system status changed rapidly in the early hours of the morning of 6 March 2014
• Eskom is in a better position than in 2008 to manage the situation.
- experience and knowledge of managing this complexity, appropriate emergency and communication protocols in place and open and transparent communication with stakeholders, including the media
• The system will remain tight up to the end of Summer and throughout Winter, until a substantial part of the build programme delivers capacity
• It remains important for all customers to maintain or achieve 10% electricity savings especially in the commercial, industrial and residential sectors. 4

2008 vs. 2014 load shedding
5
2008 2014
Communication of
system status
Inadequate pre-communication
of system constraints
-Pro-active communication (Quarterly
system updates, summer/winter comm’s)
- Improved communication with
customers, media and other stakeholders
Executive management
oversight (pre-incident)
Inadequate integration
between functions prior to the
incident
Executive team assigned, Emergency
command centre (ERCC) established,
weekly reviews, alignment with
shareholder
Country demand
reduction protocols
No country protocol in place National Code of Practice, based on multi-
stakeholder input, approved by NERSA
Load shedding (small
customers)
Schedules developed during
the critical constraint
Prepared and published by Eskom and
Metros before the emergency as per Code.
Load curtailment (large
customers)
No pre-agreement Signed curtailment agreements
Preparedness Limited exercises and tests. Regular operational and two national
multi-stakeholder exercises.
Visibility Limited visibility of key
processes
Detailed information via Generation and
Customer Nerve Centres & National
Control Help Desk
Declaration of an
emergency
Once system was nearing
instability.
In line with the National Code of Practice.
Coal supplies Unhealthy levels – on average
below ten days no wet coal
Healthy levels – on average at 45 days
Wet coal procedures in place

As a reminder - electricity usage in Summer and Winter…
Sept-March – Spring/Summer
‘Live Lightly’
• Table Mountain profile
• Constrained all day incl. from 5 - 9pm
• Air-conditioning, geysers & pool pumps
primarily impact demand
• Commercial, agricultural & residential
customers can make the biggest
difference
April-Aug – Autumn/Winter
‘Beat the Peak’
• Peak profile
• Constrained from 5pm – 9pm
• Electrical heating, geysers, & pool
pumps primarily impact demand
• Residential customers can make the
biggest difference as demand
increases in the evenings
20,000
22,000
24,000
26,000
28,000
30,000
32,000
34,000
36,000
38,000
23:00 02:00 05:00 08:00 11:00 14:00 17:00 20:00 23:00 02:00
MW Summer & Winter load profiles
Typical Winter Day
Winter Peak Profile
Summer flat (Table Mountain profile)
6

7
Key Message
Overview of the Power Emergency
System Status
Understanding load shedding
Conclusion

Overview of events leading up to the emergency
• The already constrained power system was further impacted by the following
events:
- The continuous rain in the last few days resulted in poor coal quality
resulting in additional load losses at our power stations
- A rapid change on the system in the early hours of 6 March 2014, as we
lost additional units at our power stations (4 x Kendal, 1 x Majuba, 1 x
Grootvlei - 3320MW lost by 05:00).
- There was limited available generation at Drakensberg and Palmiet
- Eskom utilised all emergency reserves at its disposal:
- Open-cycle gas turbines were brought on-line
- Demand market participation (DMP) including Emergency from key
industrial customers were utilised
• Over and above the utilisation of emergency reserves there was a shortage
of 3000 MW at 08:00. To manage the frequency levels and to protect the
national system from total collapse, controlled load shedding was
implemented immediately and unavoidably at short notice.
• The stage 3 load shedding resulted in a 20% reduction in demand enabling
National Control to balance the system
8

Cross-border impact during an emergency
• During Eskom system emergencies the following applies to exports:
• All non-firm energy supplies are reduced to zero,
• All firm energy supplies are reduced by 10%,
• Trading Partners are required to enforce the 10% reduction on their customer
base,
• Trading Partners are required to utilize all their own generation capacity to the
maximum,
• Energy which may inadvertently be drawn out of the Eskom system is charged
at emergency generation rates,
• The interruptibility of the specific customer agreements is activated by
National Control as the system requires it.
9

Generation challenges
• Generally Eskom’s power stations are oldand are impacted by frequent break downs.Increased boiler tube leaks are the primaryreason behind generator outages. Outageslips and extensions have taken muchlonger than initially planned due to the stateof the plant when opened up for inspectionas well as some performance issues inexecution.
• Over this week, some power stations in theMpumalanga area were further challengeddue to the high, continuous rainfall over thepast eight days that impacted coal quality(wet coal). This severely impacted theirability to effectively handle and feed coal tothe boilers at the power stations
• The result is that key power stations in thearea are operating at additional reducedoutputs
Coal stockyard under water
Conveyor belt impacted by wet coal
10

Wet vs. dry coal stockyard
11
• Wet stockyard• Dry stockyard

Wet vs. dry coal on conveyors
12
Wet
Wet
Dry

Kendal sequence of events (1)
Wednesday
Experienced problems
handling wet fine coal.
Took load losses up to
400 MW from 21:00
Coal stock level above target at 56 days.
Have experienced consistent heavy rain since Friday last week
Wet fine coal
1
2
3
During shift change-over
fine and wet coal received
from opencast mine with low
delivery of dry coal from
underground mine.
Supplemented shortfall with
fine and wet coal from
stockpile. This makes handling
of coal on conveying plant
difficult - causing blockages
and incline conveyor belts
slipping

2014-03-07 14
2. Coal Handling Plant Overview

Kendal sequence of events (2)
15
Thursday
Trips due to empty coal
bunkers during early hours of
Thursday Unit six 01:22
Unit one 01:40
Unit two 02:26
Unit five 07:58
Units were
recovered during the
day by getting dryer,
coarser
underground coal
By 17:26 all
units at Kendal
back on load
4
56

Kendal coal stock yard
16
Coal stock yard 1.3 km x
800 m

By having a robust
supply plan for all our
primary energy
resources, able to face
and recover from:
Wet coal management initiatives since 2008
Infrastructure Process Measurement and
Control
Guided flow chutes at
Duvha
Adequate coal stockpile
holding
Annual rain season
readiness audit for power
stations
Staithe bypass
conveyors
5 day coarse coal
stockpile at critical
stations
External rain season
audit of mines
Wet coal management
procedures per station
Review of management
and operating
procedures
Initiatives investigated but not implemented due to cost constraints
Re-claimers Covered stockpiles Additives

• Conveyor fire incident in December 2013 resulted in total supply to Duvha being sourced via road transport
• Middelburg Mining Services (MMS) constrained to supply full volume due to infrastructure and process flow
• Additional volumes available from MMS North Plant, however road construction and associated safety risk makes supply infeasible
• Additional coal supply sourced from various short term sources
• Feed to station constrained by current weather conditions
• Weather conditions impacting on return to service of conveyor system
• Supply in the latter part of March 2014
Duvha Power Station Coal Supply Constraints

Coal stocks at sufficient levels
Actual Stock days F2008, F2012, F2013 vs YTD Actual F2014
19
25 2522
20 19 1817 18
15
1213 13
4039 39
3638
41 4144 43
4139 3938
3940 42
43 4445
47 4748
494748
51 50 5152
5456 55
48
45 46
0
10
20
30
40
50
60
APR MAY JUN JUL AUG SEP OCT NOV DEC JAN FEB MAR
Sto
ck d
ays
Months
2007/8 2011/12 2012/13 2013/14
• Current coal stock piles are at healthy levels, in average of 45 days.
• Power stations that are highly dependent on road deliveries like Grootvlei, Komati and Tutuka stock days
have dropped below alarm level in February mainly due to mine and road deliveries slow ramp up after
the festive period , social unrest around specific routes and rain.
• Duvha Power Station stock days dropped due to the conveyor fire, but are being maintained around 14
days
• In anticipation of long duration rainfall, strategic stockpiles are set aside for such situations. However,
given the duration of this rainfall period these strategic stockpiles have been depleted.

Open cycle gas turbines
• Costly liquid fuelled gas turbines in the Western Cape continue to be used during the day, as an emergency resource, to meet the required demand
• Very expensive
• We are currently managing the utilisation of these units to safeguard fuel levels
Ankerlig Gourikwa
20

21
Key Message
Overview of the Power Emergency
System Status
Understanding load shedding
Conclusion

February 2014 compared to February 2013
• There is an average difference between 1000 MW and 2200 MW over peak periods
• IPP supply expired Dec 2013
2014-03-07 22
4 – 5 February 2013, 10 – 11 February 2014 (Monday – Tuesday)
2014
2013
Difference

Available capacity to meet demand
23
• The emergency of 20 and 21 February 2014 was particularly tight from the
Thursday afternoon and into the Friday afternoon.
• A substantial change can be seen on the emergency of the 6th March when
the available capacity was much lower than the entire day’s demand
Emergency declared
Emergency declared
4 Kendal units lost

Prognosis for the next two weeks
• Rainy weather conditions are
forecast until the beginning of
next week
• Any small change on the system
could have a significant impact:
risks include fuel shortages,
increased plant maintenance
• This plan considers a forced
outage allowance of 6500 MW.
This does not cater for
significant events such as those
experienced this week which will
result in much tighter operations
and reliance on emergency
reserves.
24

Prognosis for the next two months
• The risk of emergency conditions
developing remains with us for the rest of
March and into April.
• From a planning perspective, the
unplanned outages are expected to
reduce as we go into winter.
• Planning is consistently in the “red” which
makes us extremely vulnerable to any
unforeseen events.
• Koeberg unit 2 is scheduled to come out
of service for planned maintenance in the
third week of March.
• Decision on license agreements on Kriel
PS expected in the latter part of March
201425

Supply-side: Renewable IPPs gain momentum
• The Department of Energy introduced three bid windows for the Renewable Independent Power Purchase Programme
• Of the 19 Renewable IPPs connected to the grid, 3 projects (99 MW) have achieved their contractual Commercial Operation Date (COD) and 8 projects are generating Early Operating Energy. Expect the last project of Bid Window 1 by no later than the first half of 2015
Bid Date MW Power
Purchase
Agreements
Type of Technology Status
(As at 21 February 2014)
1 5 Nov. 2012 1416 28 Wind, Solar PV,
Solar CSP
- 19 of 28 connected
- 3 projects achieved
COD; 8 projects in
Early Operating
- Last plant commercial
expected by Feb 2015
2 9 May 2013 1044 19 Wind, Solar PV,
Solar CSP, Landfill &
Biomass
- Progressing well
3 - Bid Window
3 still to be
concluded
17 bidders for 1456 MW - Wind, Solar PV, Solar CSP, Landfill and
Biomass technology
26

Supply-side: Cross-border IPPs
• Only until recently was Eskom allowed to conclude power purchase agreements with regional independent power producers
• While Eskom is committed to use IPPs, most contracts could not be concluded due to high price expectation
•
27
Project Type Potential Eskom
off-take
Status
Kudu Natural
gas
800 MW 600 MW Eskom spent substantial time negotiating.
PPA could not be concluded due to price
Mmamabula Coal 1 200 MW 900 MW • IG MOU signed
• Due to high price expectation could not be
signed
• Explicit linkage to coal price which was
higher than the Eskom coal cost
• New regulations implemented in RSA
making the DoE the procurer
Zesco Coal and
Hydro
200 MW 200 MW Could not be concluded due to high price
expectation
Kariba South Hydro 120 MW 50 MW Could not be concluded due to high price
expectation

Continued progress with New Build …
• Eskom is committed to completing the
new build programme and has put the
necessary resources in place to do so
• Work has resumed at Ingula pumped-
storage scheme after the safety incident
• Medupi and Kusile continue to
demonstrate world-class safety
performance (0.1 lost time incident rate).
Medupi’s first unit is still expected to be
synchronised in the second half of 2014
and Kusile’s first unit following a year
thereafter.
• The technical C&I issues at both Kusile
and Medupi are being addressed with the
on-boarding of Siemens.
28

Continued Progress with New Build
• Seven of the 46 wind-turbines at Sere PS are complete and the station’s 100MW is expected to be commissioned by 2014/2015
• Transmission power line construction is progressing well, major sections of the power grid (Western Cape, Limpopo and Gauteng) have been strengthened, although challenges still remain in terms of servitude acquisition.
29

30
Key Message
Overview of the Power Emergency
System Status
Understanding load shedding
Conclusion

Balancing supply & demand
49.5 Hz
50.0 Hz
51.5 Hz
Generation Load
• Electricity demand must be matched in real time.
• Any mismatch in supply and demand is reflected in the system frequency.
• Strict frequency control is required in order to ensure system security.
• This requires 24/7/365 management of the integrated power system.
• This is a primary role of the System Operator (National Control)
31

Declaring a power emergency – NRS048
32
• On days when Eskom needs to reduce demand still further, afterutilising emergency reserves, the NRS048 protocol indicates thatEskom can declare a power emergency in order to protect the systemfrom a total blackout or collapse
• It does this by instructing key industrial customers to reduce load by10%.
• When all options have been exhausted, and if the demand stillexceeds available supply, Eskom initiates rotational load shedding.
• This is a scheduled process and is a controlled way of sharing theavailable electricity between all customers. By switching off parts ofthe network in a planned and controlled manner throughout the day,the system remains stable, and the impact is spread over a wider baseof customers.

Emergency demand reduction
• Demand reduction is executed in Stages.
• Each stage provides a given amount of demand depending on the season and time of day.
• The System Operator (National Control) determines the capacity shortfall and instructs the relevant stage of shedding to Eskom’s Top Customer division and Eskom’s Distribution control rooms.
• These control rooms in turn instruct the metros and municipalities to prepare for and implement load shedding.
• Procedures are in place to engage critical loads as defined in the Code of Practice (e.g. hospitals, airports, stadiums etc). These cannot all be kept off the schedules and therefore the necessity that these services keep back-up generators
33

Load shedding protocols
• Unlike 2008, where Eskom implemented load shedding through-out the day and for a few days at a time, load shedding will now be used only under emergency conditions for limited periods.
• For Eskom customers only, four schedules have been developed based on the possibility of risk and to ensure that it is applied in a fair and equitable manner:
• An ‘All Day Schedule’ (24 hour) – Applicable during Summer and Emergencies (any time of the year)
• Three schedules for ‘Peak Stages’ during (5pm to 9pm) – Applicable during Winter.
• Eskom schedules cater for Eskom supply areas only
• Customers supplied by municipalities need to contact
their municipalities directly.
• Municipal load shedding is managed independently
34
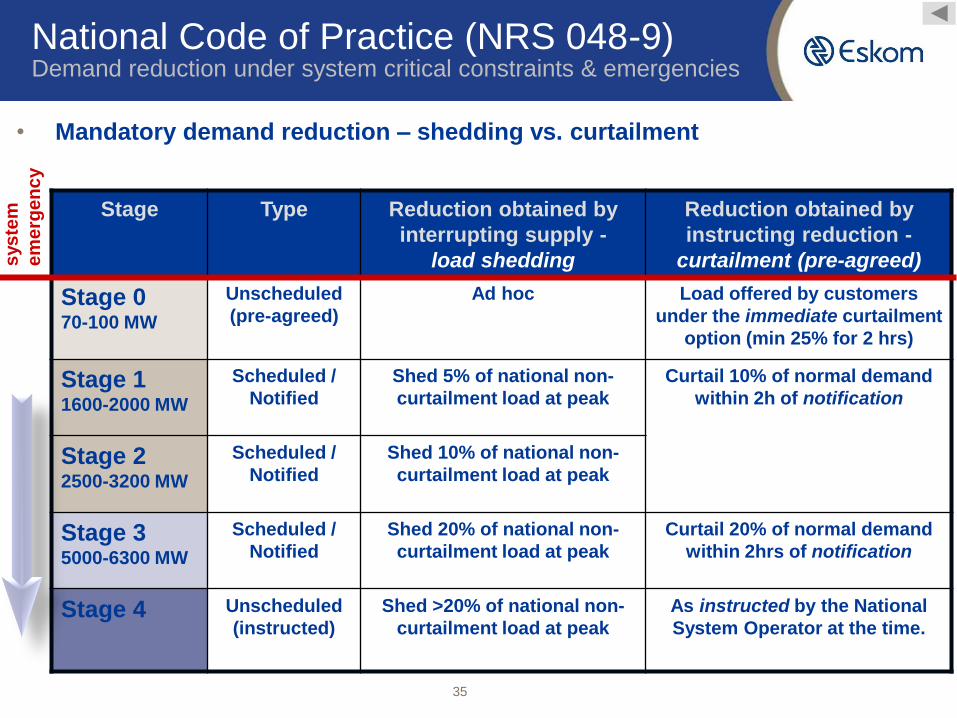
National Code of Practice (NRS 048-9)Demand reduction under system critical constraints & emergencies
• Mandatory demand reduction – shedding vs. curtailment
Stage Type Reduction obtained by
interrupting supply -
load shedding
Reduction obtained by
instructing reduction -
curtailment (pre-agreed)
Stage 070-100 MW
Unscheduled
(pre-agreed)
Ad hoc Load offered by customers
under the immediate curtailment
option (min 25% for 2 hrs)
Stage 11600-2000 MW
Scheduled /
Notified
Shed 5% of national non-
curtailment load at peak
Curtail 10% of normal demand
within 2h of notification
Stage 22500-3200 MW
Scheduled /
Notified
Shed 10% of national non-
curtailment load at peak
Stage 35000-6300 MW
Scheduled /
Notified
Shed 20% of national non-
curtailment load at peak
Curtail 20% of normal demand
within 2hrs of notification
Stage 4 Unscheduled
(instructed)
Shed >20% of national non-
curtailment load at peak
As instructed by the National
System Operator at the time.
sys
tem
em
erg
en
cy
35

Monday Tuesday Wednesday Thursday Friday Saturday
06:00 Block 9 Block 1 Block 9 Block 1 Block 9 Block 1
08:00 Block 10 Block 2 Block 10 Block 2 Block 10 Block 2
10:00 Block 11 Block 3 Block 11 Block 3 Block 11 Block 3
12:00 Block 11 Block 4 Block 11 Block 4 Block 11 Block 4
14:00 Block 13 Block 5 Block 13 Block 5 Block 13 Block 5
16:00 Block 14 Block 6 Block 14 Block 6 Block 14 Block 6
18:00 Block 15 Block 7 Block 15 Block 7 Block 15 Block 7
20:00 Block 16 Block 8 Block 16 Block 8 Block 16 Block 8
Stage 1 ALL DAY Schedule: Eskom customers only
The current schedule is designed
to be fair if load shedding takes
place during most of the day.
36

Where to locate the load shedding schedules: http://loadshedding.eskom.co.za
Option 3 – Internet
Add slides
37

Where to locate the load shedding schedules
38
Option 3 – Internet
Add slides

39
Key Message
Overview of the Power Emergency
System Status
Understanding load shedding
Conclusion

Help us to communicate better
• While the load shedding schedules for Eskom customers were loaded, the system failed to perform optimally. Complaints were received around the accessibility of the site in particular
• Our customer contact centres were inundated and due to the overload were unable to help all customers
• We saw significant uptake on social media and we trended on twitter. We recorded a significant increase in social media shares of messaging across all platforms (130 million compared to daily trend of 1 million)
• The media houses reacted positively and we continue to have spokespeople across the country on various broadcasters to respond to media requests
• We welcome suggestions and feedback from the public on ways to improve the load shedding schedules. Please contact us on [email protected] or 0860037566
40

How to Live Lightly and Beat the Peak
• Saving electricity reduces pressure on the grid and cuts your electricity bill and South Africa’s carbon emissions
• The power system remains vulnerable all day during Summer
1. Use air-conditioning efficiently
- Set air-conditioning at 23 degrees
- Close windows and doors to optimize air-conditioning
- Switch off 30 minutes before leaving the office
2. Continue to switch off all geysers and pool pumps from 5pm to 9pm
3. As we approach winter, use alternatives to electrical heating
4. Switch off all non-essential lighting and appliances
5. Respond to the Power Alert and Power Bulletin radio messages by switching off all appliances that are not being used
41

In support of
Conclusion
• The system remains tight and is vulnerable to any changes going into Winter, and will remain so for the next few years until the build programme is completed
• With the projected demand and current trends in plant performance, extensive and expensive use of OCGTs is anticipated, resulting in limited operating reserves to deal with volatility in demand or generation performance.
• We call on all customers, particularly the municipalities and the commercial sectors, to manage and cut out all electricity wastage. The industrial and commercial sector can make significant contributions particularly in large office blocks and shopping centres.
• If this is done, it will ensure a stable power system and reduced costs
• We thank all our customers who continue to assist by reducing consumption.

Thank you


