Page 1
Power-to-Ammonia: Rethinking the role of ammonia –
from a value product to a flexible energy carrier
(FlexNH3)
Project Systeemintegratie Studie
Final Report
Yasmina Bennania
András Perlb
Anish Patila
Christian E. J. Van Somerenb
Leo J. M. Heijneb
Machiel van Steenisc
Report No.: TESIS15001
Project period: October 2015 to April 2016
Page 2
Acknowledgements
This study was funded by the Ministry of Economic Affairs, Nationale regelingen EZ-subsidies,
Top Sector Energy conducted by Netherlands Enterprise Agency (RVO).
This study was carried out by a consortium of:
a. Proton Ventures BV, Schiedam, The Netherlands (project leader),
b. Hanzehogeschool, Groningen, the Netherlands (project partner), and
c. Stichting Energy Valley, Groningen, The Netherlands (project partner).
For their individual help we would like to thank Aafke Jansma, Jesper Kone, Chun Lam Yip and
Kevin Kardux. For further information please contact the project manager, Yasmina Bennani
([email protected] ).
Page 3
Summary
This report focuses on the feasibility of the power-to-ammonia concept. Power-to-ammonia
uses produced excess renewable electricity to electrolyze water, and then to react the obtained
hydrogen with nitrogen, which is obtained through air separation, to produce ammonia. This
process may be used as a “balancing load” to consume excess electricity on the grid and maintain
grid stability. The product, ammonia, plays the role of a chemical storage option for excess
renewable energy. This excess energy in the form of ammonia can be stored for long periods of
time using mature technologies and an existing global infrastructure, and can further be used
either as a fuel or a chemical commodity. Ammonia has a higher energy density than hydrogen;
it is easier to store and transport than hydrogen, and it is much easier to liquefy than methane,
and offers an energy chain with low carbon emissions.
The objective of this study is to analyze technical, institutional and economic aspects of power-
to-ammonia and the usage of ammonia as a flexible energy carrier.
Various scenarios for different locations were modeled at different scales of capacity. Historical
KNMI (Koninklijk Nederlands Meteorologisch Instituut) data were used to estimate wind and
solar energy production for various locations for each hour of the year. The pattern of the
renewable electricity production was found to be location specific, but for a given location the
correlation between the surplus electricity consumption and the electrolyzer capacity showed
similar tendencies, independent of the technical boundaries of the scenarios.
Both smaller (local-scale) and larger (national-scale) power-to-ammonia scenarios were
investigated. The ammonia synthesis step is a high pressure and temperature catalytic process
and requires a continuous reagent flow. The intermittent nature of the renewable electricity
sources does not allow a steady flow of hydrogen. Two main strategies were identified for the
local scenarios to secure the continuity of the renewable ammonia synthesis step: i) the adaption
of a hydrogen storage tank that acts as a buffer and ii) electricity import from the grid during
Page 4
periods of no renewable electricity generation for maintaining the ammonia production at a
minimum rate. For larger national-scale scenario only the storage-buffer of hydrogen was used,
in order to focus on the grid balancing aspect of the power-to-ammonia process.
The output of these scenarios resulted in the finding that the main steps of the power-to-
ammonia process (hydrogen production through water electrolysis, nitrogen separation from air
and ammonia synthesis) are technically feasible using proven technologies powered by
renewable electricity sources.
Ammonia is a flexible chemical that can be used as a chemical commodity and as an energy
carrier. Given this flexibility of usage, and given the fact that the supporting technology and
infrastructure for the transport, distribution and usage of ammonia is already in place, ammonia
is a good candidate to be a large-scale, low-carbon, energy carrier of the future. Power-to-
ammonia can provide the flexibility required in the future with an increased share of intermittent
renewable energy and represents a direct link between the energy and chemistry sectors. The
concept could facilitate the energy transition for the Netherlands to meet its greenhouse gases
emissions targets for 2020.
Furthermore, capital costs, operating parameters and other financial assumptions of a power-to-
ammonia plant were used in an economic model to calculate the break-even point at which the
total cost and the total revenue are equal. The renewable energy production profile determines
the size and the rate of the ammonia synthesis plant. The results showed that a power-to-
ammonia plant at local scale with a nominal electricity consumption of around 1.5 MW or smaller
was technically feasible but not from a financial point of view. However, when the scale of the
renewable electricity production and the power-to-ammonia plant is increased to 15 MW, a
successful business case is feasible. The transport and storage costs of ammonia in general are
significantly lower than that for hydrogen. The storage cost of hydrogen is significant higher when
it is stored for a longer period.
Page 5
The elimination of the costly hydrogen storage tank from the plant design for the local scenario
where electricity is purchased to run the process continuously at the lowest possible production
rate offers an economical advantage. In this local scenario the results suggest that at windier
locations it is economically more advantageous to only sell the produced electricity, losing any
excess energy produced. In this case, as the power available for the electrolysis increases (and
concomitantly the ammonia production rate), the higher the break-even time becomes. On the
other hand, in moderately windy areas, it is more advantageous to invest in higher electrolyzer
power (rated stack capacity) and focus on ammonia production.
The frequency of the excess renewable electricity production determines the economic feasibility
of power-to-ammonia on a large national-scale. It was found, that power-to-ammonia at very
large scale would have a reasonable chance for a successful business case only when
approximately two times the planned 2020 renewable power is installed in the country. A wind-
and solar-based power-generation with a nominal power of around 20.000 MW would be needed
for increasing the yearly excess electricity production hours to a level where its distribution is
uniform enough to economically operate a national scale power-to-ammonia plant powered
exclusively by excess renewable electricity.
To increase the social acceptance of power-to-ammonia, the social and economic benefits of the
technology and the way it is implemented has to be taken into account. The current ammonia
technology is safe, but any power-to-ammonia plant should be realized at locations where as few
people as possible experience any real or perceived safety risk. A dialogue with the public should
be started in the very beginning of the planning process to create trust. The advantages and
disadvantages of power-to-ammonia should be distributed at the community level as fairly as
possible.
Page 6
Samenvatting
Dit onderzoek is gebaseerd op de haalbaarheid van het power-to-ammonia concept. Hierbij
wordt elektriciteit omgezet en opgeslagen in ammoniak. In deze studie wordt gebruik gemaakt
van overtollig geproduceerde hernieuwbare elektriciteit voor de productie van waterstof en
stikstof, dat uiteindelijk geconverteerd wordt naar vloeibare ammoniak. Hierbij wordt water en
omgevingslucht door middel van electrolyse en drukwisselabsorptie gebruikt als grondstof. Door
het gebruik van overtollig geproduceerde hernieuwbare elektriciteit kan het verschil tussen
elektriciteitsvraag en aanbod gereduceerd worden waardoor de stabiliteit van het
elektriciteitsnet zal toenemen. Dit concept resulteert in een duurzaam geproduceerde
energiedrager door het gebruik van bewezen technologieën. Doordat ammoniak al geruime tijd
wordt toegepast in verschillende sectoren is de benodigde infrastructuur reeds beschikbaar.
Andere voordelen naast de bestaande infrastructuur zijn dat de opslag van ammoniak door de
lage dichtheid eenvoudiger is dan bijvoorbeeld de opslag van waterstof of (vloeibare) methaan
en dat er geen CO2 emissies vrijkomen.
Het doel van dit onderzoek is om de technische, economische en maatschappelijke aspecten van
het power-to-ammonia concept en de toepassing als flexibele energiedrager te analyseren.
Voor dit onderzoek zijn verschillende capaciteiten (van lokale schaal tot nationale schaal) bij
diverse scenario’s en op diverse locaties in Nederland onderzocht. Hiervoor is gebruik gemaakt
van historische data van het KNMI (Koninklijk Nederlands Meteorologisch Instituut) om
betrouwbare aannames te verrichten met betrekking tot de opbrengst van wind en zonne-
energie.
De ammoniak-synthese is een continu proces dat op hoge druk met hoge temperaturen
plaatsvindt. De opbrengst van overtollig geproduceerde energie fluctueert en dus ook de
waterstofproductie door electrolysers. Daarom zijn voor de lokale schaal twee scenario’s
onderzocht zodat de installatie continu in bedrijfsvoering kan opereren: i) De toepassing van een
waterstoftank als buffer voor de ammoniak synthese en ii) Elektriciteitsafname van het net indien
Page 7
geen overtollige elektriciteit beschikbaar is. Op nationale schaal is alleen het scenario met
waterstof-opslag onderzocht.
Als resultaat van dit onderzoek is gebleken dat het technisch haalbaar is om met duurzame
energiebronnen en bewezen technologieën zowel waterstof als stikstof te produceren om deze
vervolgens te converteren naar ammoniak. Door de wereldwijde toepassingsmogelijkheden en
de reeds bestaande infrastructuur voor ammoniak heeft het concept een hoog potentieel als
grootschalige energiedrager voor de toekomst met als bijkomend voordeel dat er geen CO2
emissies zijn. Hierdoor biedt het concept perspectief voor de benodigde stabilisatie tussen vraag
en aanbod van elektriciteit en zodoende kunnen de doelen betreft de Nederlandse
energietransitie en CO2 reductie voor 2020 worden gerealiseerd.
Vanuit bedrijfseconomisch oogpunt is op basis van gestelde operationele en investering kosten
een inschatting gemaakt betreft de terugverdientijd van de verschillende scenario’s. Uit de
resultaten blijkt dat een power-to-ammonia plant met een elektriciteitsverbruik van 1,5 MW
bedrijfseconomisch niet haalbaar is. De bedrijfseconomische haalbaarheid en daarmee een
positieve businesscase blijken in Nederland realiseerbaar vanaf 15 MW (dus 10 keer zo veel).
Daarnaast zijn, in verhouding met waterstofproductie, de kosten voor opslag en distributie van
het ammoniak-concept aanzienlijk lager.
Verder blijkt dat voor het lokale scenario, waarbij geen overschot beschikbaar is en de plant op
minimale belasting draait, het bedrijfseconomisch voordelen biedt om elektriciteit te importeren
vanaf het net in tegenstelling tot het gebruik van een kapitaalintensieve waterstofopslag met de
benodigde infrastructuur. Bij dit scenario geldt dat voor locaties met veel wind het voordeliger is
om de elektriciteit te verkopen (rekening houdend met het verlies van overtollige energie), en
daarmee de investering voor een power-to-ammonia unit te vermijden. Als de capaciteit van
electrolysers stijgt en daarmee de hoeveelheid verkochte elektriciteit daalt, dan wordt de
terugverdientijd namelijk hoger. Anderzijds is het in gebieden met minder wind voordeliger om
de capaciteit van electrolysers te verhogen en daarmee de productie van ammoniak.
Page 8
Voor het nationale schaal scenario wordt de economische haalbaarheid voor power-to-ammonia
bepaald door de mate waarin overtollige energie beschikbaar is. Uit het onderzoek blijkt dat de
power to ammoniak productie op deze grote schaal aanzienlijke kansen biedt indien de
beschikbare hoeveelheid energie aanzienlijk hoger is. Een nominaal vermogen van 20.000 MW
geïnstalleerde zonne- en- windenergie (dat is ongeveer tweemaal hoger dan de verwachte
opbrengsten in 2020) zou nodig zijn op nationale schaal economisch een power-to-ammonia unit
te bouwen die uitsluitend wordt aangedreven door een overschot aan elektriciteit.
Verder dient er rekening gehouden te worden met de sociale acceptatie van het power-to-
ammonia concept. Ondanks de veilige technologie dient de plant op locaties gerealiseerd te
worden waarbij zo weinig mogelijk mensen potentieel veiligheidsrisico oplopen. Het publiek zal
daarnaast geïnformeerd moeten worden over de mogelijke gevaren en over de sociale en
economische voordelen om het vertrouwen voor het concept te winnen.
Page 9
Table of Contents 1. Introduction .................................................................................................................................... 1
1.1. Project background ...................................................................................................................... 1
1.2. Renewable energy targets............................................................................................................ 1
1.3. The effect of renewable sources on the performance and reliability of the electric grid. .............. 2
2. System integration of power-to-ammonia ....................................................................................... 8
2.1. Technical benefits of an electrical energy storage system ............................................................ 8
2.1.1. Power quality and reliability ................................................................................................. 9
2.1.2. Load shifting ......................................................................................................................... 9
2.1.3. Supporting the integration of intermittent renewable energy sources .................................. 9
2.1.4. Power-to-X concept as a cost reduction approach .............................................................. 10
2.2. Power-to-Ammonia ................................................................................................................... 11
2.3. Renewable ammonia production ............................................................................................... 13
2.3.1. Hydrogen production through water electrolysis ................................................................ 13
2.3.2. Nitrogen production ........................................................................................................... 15
2.3.3. Ammonia synthesis through the Haber-Bosch process........................................................ 18
2.4. Storage of ammonia................................................................................................................... 19
2.4.1. Comparison of energy carriers ............................................................................................ 21
2.5. Transport of ammonia ............................................................................................................... 23
3. A comparative evaluation of the available electrical energy carriers .............................................. 27
3.1. The cost of power-to-X technologies .......................................................................................... 31
3.2. CO2 emission reduction .............................................................................................................. 33
4. The possible roles of ammonia in the global energy economy ........................................................ 34
4.1. Ammonia as a source of hydrogen ............................................................................................. 38
4.1.1. Catalytic decomposition of ammonia into nitrogen and hydrogen ...................................... 39
4.1.2. Electrolysis/Electro-oxidation of Ammonia into Nitrogen and Hydrogen ............................. 39
4.1.3. Hydrogen production from ammonia product - ammonia borane ....................................... 40
4.2. Direct ammonia-based fuel cells ................................................................................................ 40
4.2.1. Ammonia-based PEM fuel cells ........................................................................................... 40
4.2.2. Ammonia-based alkaline fuel cells ...................................................................................... 40
4.2.3. Direct ammonia solid oxide fuel cells .................................................................................. 41
4.2.4. Ammonia vehicles .............................................................................................................. 41
5. Power-to-ammonia scenarios ........................................................................................................ 43
Page 10
5.1. Method of the renewable energy production calculations ......................................................... 44
5.1.1. Wind Production ................................................................................................................ 44
5.1.2. Solar Production ................................................................................................................. 45
5.2. Assessment of green ammonia production – the dedicated wind-powered system – Scenario 1 45
5.2.1. Short-time storage of ammonia for a local scale power-to-ammonia plant ......................... 48
5.2.2. A simple technical evaluation of Scenario 1 ........................................................................ 49
5.3. Green ammonia production in the countryside – Scenario 2 ...................................................... 52
5.3.1. Excess Energy Production ................................................................................................... 53
5.3.2. A simple technical evaluation of Scenario 2 ........................................................................ 54
5.4. FlexNH3 – Green ammonia production on a national scale – Scenario 3 ...................................... 56
5.4.1. Renewable energy production on a national scale .............................................................. 57
5.4.2. Annual Surplus Electricity Patterns ..................................................................................... 58
5.4.3. A simple technical evaluation of Scenario 3 ........................................................................ 58
6. Economic feasibility of power-to-ammonia .................................................................................... 62
6.1. Economic feasibility of the local scenario ................................................................................... 62
6.1.1. The effect of the electricity price ........................................................................................ 68
6.1.2. Larger scale local power-to-ammonia ................................................................................. 69
6.2. Economic feasibility of the national scenario .............................................................................. 71
7. Economical evaluation of power failures ........................................................................................ 74
7.1. Blackouts and social costs .......................................................................................................... 75
7.2. The compensation payment ....................................................................................................... 76
8. Legal and social issues of power-to-ammonia ................................................................................ 78
8.1. An overview of license obligations and environmental rules for wind turbines ........................... 78
8.1.1. Environmental permits and exemptions ............................................................................. 78
8.1.2. Other permits and exemptions ........................................................................................... 79
8.1.3. Competent authority .......................................................................................................... 80
8.1.4. General rules that apply to all wind turbines ...................................................................... 80
8.2. License obligations of a renewable ammonia plant .................................................................... 81
8.3. Social acceptance of power-to-ammonia ................................................................................... 82
9. Stakeholder analysis of power-to-ammonia ................................................................................... 84
10. Conclusions ................................................................................................................................ 89
References ............................................................................................................................................ 91
Page 11
1
1. Introduction
1.1. Project background
This report is the result of the cooperation between Energy Valley, Hanze University of
Applied Sciences and Proton Ventures BV within the TKI Power2X system integration subsidy
program-line of the Netherlands Enterprise Agency (RVO). The work focuses on the feasibility of
using ammonia as a flexible renewable energy carrier.
1.2. Renewable energy targets
The European Union has adapted emission reduction, energy savings and renewable energy
targets for 2020 [1, 2]:
A 20% reduction in EU greenhouse gas emissions from 1990 levels;
Raising the share of EU energy consumption produced from renewable resources to 20%;
A 20 % improvement in the EU's energy efficiency.
The European Union targets represent an important first step towards developing a low-carbon
economy. They are as well headline targets of the Europe 2020 strategy for smart, sustainable
and inclusive growth.
However, with only 5.5 % of energy generation coming from renewable sources in 2014, the
Netherlands falls behind the other European countries (Table 1).
It is expected, that the percentage of renewable energy both in the Netherlands and in Europe
will grow significantly in the coming decades. With the increase in the percentage of renewables
in the countries, many new challenges for the reliability and performance of the existing power
grid will occur. This comes as a consequence of the intermittency of renewable resources and
the lack of large-scale economical storage capability.
Table 1. EU renewable shares, 2014 baselines and estimated 2020 targets [2, 1].
Page 12
2
European country Baseline % 2014 Target % 2020
Sweden 52.6 49
Latvia 37.9 40
Austria 33.1 34
Finland 38.7 38
Portugal 27 31
Denmark 29.2 30
Estonia 26.5 25
Slovenia 21.9 25
Romania 24.9 24
Spain 16.2 20
France 14.3 23
Italy 17.1 17
Netherlands 5.50 14
UK 7.00 15
1.3. The effect of renewable sources on the performance and reliability of the
electric grid.
The growing renewable electricity sources in the Netherlands are wind and solar irradiation.
These renewable electrical energy sources are integrated into the electric power system and the
transmission grid at various voltage levels. The electricity gained from the renewable sources are
certain to have a significant impact on the performance and the efficiency of the electrical grid.
In order to avoid any power and system outages, the possible scenarios that can have an effect
on the electric grids in the future have to be accordingly planned in advance.
One of the main challenges in the production of wind and photovoltaic electricity is caused by
the significant mismatch between renewable electricity production and grid power demand.
However, the rising penetration of renewables pose a dilemma. Wind and solar radiation are not
Page 13
3
always available when or where they are needed. Since power from wind and solar is variable,
balancing supply and demand can be a problem. Therefore, new ways needed to be found to
keep the system in balance and deal with all the excess energy. Our own calculations suggest (see
details in Chapter 3) that installing around 10.000 MW nominal wind turbine capacity on a
national scale (the 2020 target of the Dutch Government [3]) would produce excess electricity
for a few times per year. The distribution and the number of these national excess hours depend
on the weather pattern. However, as soon as the installed wind capacity approaches 15.000 MW,
the excess production becomes more frequent (Figure 1) and would require a suitable means for
large scale electrical energy storage.
0 2000 4000 6000 8000
0
400
800
1200
1600
2000
2400
2800
3200
Excess e
lectr
icity (
MW
)
Hour of the year (h)
Figure 1. Excess electricity production on a national scale in a modeled scenario where 15.000
MW wind turbine capacity is assumed to operate in the Netherlands in 2014.
The electricity providing infrastructure can be divided into the transmission and the distribution
subsystems determined by the different working voltage levels (Figure 2). The transmission
subsystem, also known as the bulk power system, delivers electricity generated at central
stations to locations close to load centers.
The Dutch transmission system consists of networks at 380, 220, 150 and 110 kV. The 380 and
220 kV networks are used for the longer distance transmission function while the role of the 150
and 110 kV can be defined as a sub-transmission function. The main body in the transmission
Page 14
4
network is a ring at the 380 kV voltage level with several radial branches, see Figure 2. In the
Northern part of the Netherlands a similar ring structure exists at 220 kV level. In the western
part of the Netherlands, the Randstad, a second and third 380 kV ring are implemented to fulfill
energy demands while making sure that a certain level of supply security is reached [4].
In the Netherlands, TenneT, the transmission system operator (TSO), operates the 380 and 220
kV grids. The regional sub-transmission and distribution grids are operated by regional,
distribution system operators (DSO).
The transmission grid in The Netherlands is connected to the neighboring countries, Germany
and Belgium, through five interconnectors at 380 kV. In order to have more control over cross-
border flows, phase shifting transformers were installed at the Dutch German border in Meeden.
Furthermore, an additional high-voltage direct current link to England is in the early stage of
development [4].
Page 15
5
Figure 2. Overview of the Dutch high-voltage electrical system [5].
However, the increased development of the renewable power infrastructure in the neighboring
and other European countries will inevitably lead to situations where the problem of an excess
electricity production could not be solved by simply transporting it to other regions. Research
studies showed that worldwide electricity demand was fulfilled with the installed renewable
power capacity at the end of 2013, whereas by 2050 the demand can be overtaken with an
additional excess energy [6, 7, 8].
Page 16
6
With upcoming targets in the renewables and new regulations accepted in Paris Climate Change
Conference regarding CO2 emissions, finding solutions to deal with the generated excess
electricity is a growing concern. The Netherlands together with other European countries has
adopted European climate and energy measures as well as agreeing on common EU positions in
the global context. The Netherlands committed to achieve a 20 % reduction in EU greenhouse
gas emissions from 1990 levels till 2020 and at least 40 % greenhouse gas reduction in 2030 to a
robust and effective legislative framework [2, 9]. The Dutch government considers that it is
essential to fully integrate a growing supply of renewable energy into the EU energy system. For
the Netherlands up to 2020 this means the following [9]:
A non- Emissions Trading System share of 16 % (binding);
14 % renewable energy (binding);
1.5 % savings per year.
In order to achieve the set targets and to deal with this issue, a strategy needs to be employed
aiming to exploit the excess energy, stabilize the grid and reduce the greenhouse gas emission.
A possible solution for this issue is power-to-ammonia, a chemical energy storage technology at
wind turbine locations. This concept uses the produced excess electricity to electrolyse water,
and then react the obtained hydrogen with nitrogen, where the nitrogen is produced through air
separation. The product, ammonia, would serve the purpose of storing the excess renewable
energy.
Ammonia offers an attractive chemical storage option for renewable power since:
ammonia plants are scalable to gigawatt-hour sizes;
ammonia can be stored for long periods of time;
a mature global infrastructure already exists; and
ammonia is an industrial chemical that can be used further either as a fuel, fertilizer, de-
NOX agent and chemical commodity.
Page 17
7
Moreover, at this moment, one of the additional problems, not directly linked to the new
perception of the future grid stabilization, is the amount of greenhouse gases that are emitted
from the ammonia industry, since hydrogen production is almost exclusively based on fossil
feedstocks. Natural gas in the Western Europe releases 2.34 metric tons of the greenhouse gas
carbon dioxide, respectively, for every metric ton of produced ammonia [10, 11, 12, 13]. A more
environment-friendly option would be to produce the hydrogen via water electrolysis powered
by renewable electricity.
Page 18
8
2. System integration of power-to-ammonia
2.1. Technical benefits of an electrical energy storage system
Energy storage will play a key role in enabling the EU to reach the promised targets of emission
reduction and increase of the renewable energy which will have effect on the grid stability and
it’s operation. Energy storage can supply more flexibility and balancing to the grid, providing a
back-up to intermittent renewable energy. Locally, it can improve the management of
distribution networks, reducing costs and improving efficiency. In this way, it can ease the market
introduction of renewables, indirectly increase CO2 reduction, improve the security and efficiency
of electricity transmission and distribution (reduce unplanned loop flows, grid congestion,
voltage and frequency variations), stabilize market prices for electricity, while also ensuring a
higher security of energy supply.
Additionally to the grid stabilization during the grid disturbance, energy storage technologies can
also be used to support the normal operations of the grid. Four types of support operations can
be performed through the use of an energy storage application [14, 15, 16]:
Frequency Regulation Services: The storage system can be used to provide and absorb
power to maintain grid frequency in the face of fluctuations in generation and load.
Unforeseen Reserves: At the transmission level, an unforeseen reserve includes spinning
(or synchronous) and supplemental (non-synchronous) reserve units, and they provide
power for up to two hours in response to a sudden loss of generation or a transmission
outage.
Voltage Support: Voltage support involves the injection or absorption of reactive power
(VARs) into the grid to maintain system voltage within the optimal range. Energy storage
systems use power-conditioning electronics to convert the power output of the storage
technology to the appropriate voltage and frequency for the grid.
Black Start: Black start units provide the ability to start up from a shutdown condition
without support from the grid, and then energize the grid to allow other units to start up.
Page 19
9
A properly sized energy storage system can provide black start capabilities, provided it is
close enough to a generator.
2.1.1. Power quality and reliability
The most often adopted reason of electrical energy storage is to use it in order to improve
the power quality and reliability. The most common issues of grid-related power quality events
are voltage sags and interruptions with durations of few seconds [17].
2.1.2. Load shifting
Storing excess electric energy during periods of low demand and releasing the stored energy
during periods of high energy demand is the main concept behind load shifting. The most
common form of load shifting is peak shaving, when the energy storage system is used to reduce
peak demand in an area [18]. Peak shaving is usually applied when the peak demand for a system
is much higher than the average load. This allows an utility to defer the investment required to
upgrade the capacity of the network. From an economic point of view the economic viability of
peak shaving depends mostly on the rate of load growth and on the price differential between
minimum and maximum price [18].
2.1.3. Supporting the integration of intermittent renewable energy sources
After hydropower, wind power generation is the next largest sustainable energy source and
presently the fastest growing renewable power source in the world [19, 20]. Wind energy has
been used since the earliest civilizations to pump water, power sail boats and grind grain.
In the last decades, industry has been developing the approach where wind turbines would be
used to convert power from wind to electricity. The following applications of an energy storage
system can be applied in supporting the integration of wind power [21]:
Page 20
10
Frequency and synchronous spinning reserve support: If there is a significant amount of
wind generation in the grids, intermittency and variability in wind generation output due
to sudden shifts in wind patterns can lead to significant imbalances between generation
and load that in turn result in shifts in grid frequency. These imbalances could be managed
by applying a spinning reserve at the transmission level. A storage system can provide
quick response to such imbalances without the emissions related to most conventional
solutions.
Transmission-decrease reduction: Wind turbines are mostly built in remote areas where
transmission and distribution systems are less developed. As a result, wind operators are
forced sometimes to reduce their production and therefore lose production opportunity,
or are required to invest in the expansion and upgrading of the transmission network. An
energy storage system coupled to wind turbines can store the excess energy and
furthermore deliver it at times when the transmission system is not overloaded.
Time Shifting: Wind turbines are renewable energy sources that cannot adjust their
power output accordingly to an order or demand at the request of grid operators. A
storage system can be used to store energy generated during periods of low demand and
deliver it during periods of high demand. When applied to wind generation, the
commonly used term is “firming and shaping” because it changes the power profile of the
wind to allow greater control over dispatch [22].
Similar applications also exist for renewable energy sources other than wind power, such as solar
photovoltaic (PV), though typically at a lower scale, and less centralized.
2.1.4. Power-to-X concept as a cost reduction approach
From an economical point of view, power-to-x technology can enable companies to achieve
the emission reduction (C02 reduction and increase of the renewable sources) in a more cost-
effective way. An example can be found in the neighboring country Germany where Fraunhofer
Institute for Solar Energy Systems ISE revealed a study on role of power-to-gas in achieving policy
Page 21
11
targets [23]. From their overview and analysis, it can be seen that an extensive reduction in
carbon dioxide emissions would reduce the total annual costs of the German energy system by
billions of euros per year, if an electrical energy storage is adopted and developed accordingly in
the future. If carbon dioxide emissions are reduced by 75 to 82 % in 35 years with the approach
of power-to-x technology, this would lead to a significantly lower economic cost. The study was
based on a simulation model for the current cost-optimized sustainable energy supply in
Germany, which was further differentiated for the analysis [23].
2.2. Power-to-Ammonia
In an electrical system, supply and demand have to be balanced on a per-second basis.
Electricity production, especially renewable sources, cannot be increased so fast. Therefore,
sufficient power should be supplied to the system in order to be able to meet the maximum
electricity demand. The maximum consumption is only reached for a few hours per year (the
average demand is ~60 % of maximum demand). To manage these fluctuations, demand side
management technologies (balancing the supply of electricity) in combination with energy
storage can be used to operate the electricity system normally.
A number of electricity storage technologies are used nowadays. Figure 3 shows an overview of
the most common storage technologies. Generally, these technologies can be divided into direct
and indirect storage technologies. In direct technologies the electricity is stored in the magnetic
or electrical field of a capacitor or inductor. In case of indirect technologies the electricity is
stored in mechanical (potential, kinetic etc.) or chemical energy and it is converted back into
electricity when needed.
Page 22
12
Figure 3. Overview of electricity storage systems [24].
“Power-to-ammonia systems’’ produce ammonia through the use of excess renewable electricity
from wind turbine generators or solar panels. Wind turbines are commercially available in sizes
up to about 2.5 MW of nominal capacity for on-shore applications and even larger (3.7 MW) can
be found in off-shore applications. The electrical output of the wind turbine is dependent on the
wind speed and availability, resulting in unpredictable electrical energy production variations.
The “green” ammonia synthesis is designed to use as a base a renewable energy-powered
electrolyzer to produce hydrogen from water and an air separation unit to obtain nitrogen from
air. Both materials are further used as reactants in a Haber-Bosch synthesis reactor for the
production of ammonia (Figure 4).
Page 23
13
Figure 4. Overview of electric (wind or PV) powered ammonia production process.
2.3. Renewable ammonia production
2.3.1. Hydrogen production through water electrolysis
In periods of excess electrical energy production, the electrolyzer is switched on, and water
is decomposed into hydrogen and oxygen. Due to the low input voltage of an electrolyzer it is
necessary to decrease the high output voltage of the grid with the help of an AC/DC converter
equipped with a step-down isolation transformer. The hydrogen generation system consists of
two main parts:
1. Interface AC/DC converter with a step-down isolation transformer, which allows
interfacing the high voltage AC output of converter with a low voltage input of the
electrolyzer.
2. Electrolyzer, which produces hydrogen from water using excess electricity from the wind
generator. There are three basic types of electrolyzers: alkaline, proton exchange
membrane (PEM) and high-temperature solid oxide electrolyzers (SOEC) [25]. The key
operational parameters of the three electolyzers are summarized in Table 2.
Page 24
14
Table 2. Summary of the key operational parameters of the currently available electrolyzers [26].
Alkaline PEM Solid oxide
State of
development Commercial Commercial Laboratory
H2 production, m3/h <760 Up to ≈ 450 -
Electrolyte Alkaline solution Solid polymer membrane ZrO2 ceramic doped with Y2O3
Charge carrier OH- H3O+/H+ O2-
Cell temperature °C 40-90 20-100 800-1000
Cell voltage V 1.8-2.4 1.8-2.2 0.91-1.3
System power
consumption
kWh/m3
4.5-8.2 5.2-7.1 -
Cold start time Minutes-hours Seconds-minutes -
Advantages
Available for large
plant size, cost,
lifetime
No corrosive substances,
high power density, high
pressure, dynamics
High electrical efficiency,
integration of waste heat
possible,
Disadvantages Low current density,
maintenance cost Expensive, fast degradation
Limited long term stability of
the cells, not suited for
fluctuating systems, expensive,
Lifetime Up to 30 5 -
System costs €/kW
(average) [27] 1100 2090 -
The alkaline electrolyzer suppliers currently dominate the water electrolysis market with a broad
stack capacity range and varying system energy requirements. Commercial PEM system suppliers
are on the rise, but system sizes are still below the MW scale. No commercial SOECs are currently
available [27]. The current density and deployment time from standby are important aspects for
the flexible operational use in power-to-ammonia.
Page 25
15
2.3.2. Nitrogen production
Three methods exist for obtaining pure nitrogen gas: cryogenic distillation, polymer
membrane separation and pressure swing adsorption (PSA). Cryogenic nitrogen purification
constitutes around 90 % of all commercial production [28] today. In addition, combustion can be
used to eliminate oxygen from the air either in a reformer or in a combustor. Table 3 shows the
composition of dry air.
Table 3. Principle gases of dry air [28].
Constituent Percent by volume
Nitrogen – N2 78.084
Oxygen – O2 20.946
Argon – Ar 0.934
Carbon dioxide – CO2 0.034
Neon - Ne 0.00182
Helium - He 0.000524
Methane – CH4 0.00015
Krypton – Kr 0.000114
Hydrogen – H2 0.00005
Figure 5. Summarizes the ranges of the nitrogen separation technologies. This figures is based on
two most important parameters: nitrogen purity and its flow rate. For example for a specific purity and
flow rate, one may suggest the membrane system (shown in the graph as permeation) as the
most economic choice while the other presents PSA process as the best one (shown in the graph
as adsorption). The purity for nitrogen supply to the ammonia production section is very much
limited by the catalysts in the ammonia reactor system, where usually very low levels of oxygen
components can be allowed. Different ammonia technology suppliers (like Proton Ventures BV)
can handle higher amounts of oxygen components and therefore can use cheaper N2 generation
processes.
Page 26
16
Figure 5. Selection Diagram for nitrogen production process [28].
Cryogenic air separation
Cryogenic air separation exploits the boiling point difference in the three main constituents of air
– nitrogen, oxygen and argon (Table 3) [29]. The process shown in the Figure 6 consists of:
Compression and cooling of air
Purification of dry air stream
Cooling of the air up to the dew point of air (-176.15 °C)
Distillation of air
Page 27
17
Figure 6. Cryogenic air separation [30].
Pressure swing adsorption
Figure 7. Pressure swing adsorption process configuration [31].
In a PSA process compressed air first passes through a combination of filters. The purified air is
then directed to one of the two adsorption vessels that are packed with adsorptive materials
(zeolite, activated carbon, etc.). The impurities, such as carbon dioxide and residual moisture, are
adsorbed by the carbon molecular sieves at the beginning of the adsorbent bed. At high
pressures, the carbon molecular sieves selectively adsorb oxygen, allowing nitrogen to pass
through at the desired purity level. The automatic cycling of adsorption and desorption between
the two beds enables the continuous production of nitrogen (Figure 7) [31].
Page 28
18
Membrane separation
This system operates on the principle of selective gas permeation. A typical membrane process
(Figure 8) uses several membrane modules. Every molecule has a characteristic permeation rate
that is a function of its ability to dissolve in, diffuse through, and dissolve out of the hollow-fiber
membrane.
When compressed air passes through the fibers, oxygen, water vapor, and carbon dioxide are
selectively removed, creating a nitrogen [32].
Figure 8. Membrane system for nitrogen generation [32].
2.3.3. Ammonia synthesis through the Haber-Bosch process
In the ammonia plant, the hydrogen and nitrogen, after being produced, are mixed to form a
syngas with a ratio of 3:1 respectively. Nitrogen and hydrogen react at 350-550 °C and 100-300
bar over an iron-based catalyst. The reaction is exothermic and generates 91.4 kJ/mol heat. Due
to low conversion of the syngas feed to ammonia, commonly 15-30 %, a large share of the stream
leaving the reactor consists of unconverted syngas. To separate the ammonia from the syngas
components for the refrigeration. The condensed ammonia is removed and the residual syngas
is recycled as reactor feed [33].
Page 29
19
2.4. Storage of ammonia
Ammonia is a liquid when compressed or cooled. It is stored under pressure to prevent
vaporization so a large volume can be available for use. For pressure vessels, the inspection
requirements in most countries are governed by the respective pressure vessel codes and
regulations.
Two main methods exist for storing liquid ammonia [34]:
1) Pressurized storage at ambient temperature in spherical or cylindrical pressure vessels having
capacities up to about 8000 t (Figure 9 a)).
2) Atmospheric storage at – 33 °C in insulated cylindrical tanks for commonly amounts around
10 000 t per vessel (refrigerated).
The illustrations of the different types of storage tanks are shown below. The main types of
atmospheric tanks operating at -33°C in Europe are [35]:
a. Steel tank with full height concrete bund wall close to it with capacity to contain
the full contents of the tank and the space between the tank and the bund having
an impervious floor and roof covering (Figure 9 b)).
b. Steel tank housed within another steel tank to contain the full contents of the
tank, with a single roof (cup in tank) or independent roofs (Figure 9 c)).
c. Steel tank with a partial height concrete bund wall with impervious floor within
the contained area and no roof over the space.
d. Steel tank with an embankment of earth to contain the full contents of the tank
and no roof over the space between the tank and the embankment.
e. Single steel wall tank with no secondary containment.
Page 30
20
Figure 9. Storing liquid ammonia; a) pressure storage at ambient temperature; b) and c)
refrigerated storage (BCT terminal, Estonia) [34].
In some cases, ammonia is also stored at intermediate temperatures and pressures (semi-
refrigerated). For pressure vessels, the inspection requirements in most countries are governed
by the respective pressure vessel codes and regulations [36]. The cost of storage mostly depends
on the use of the available infrastructure. The capital costs of ammonia storage tanks are related
to the amount of steel required. For high pressure storage, about 2.8 tons of ammonia can be
stored for every ton of steel, whereas for low temperature storage over 40 tons of ammonia can
be stored per ton of steel [34].
In the Netherlands two main ammonia producers are considered to be Yara and OCI Nitrogen.
As an example, OCI Nitrogen has two world-scale production plants at Geleen, The Netherlands,
with effective capacities of 560 000 tons and 570 000 tons/year, respectively [37]. The ammonia
produced in Geleen is stored in two atmospheric cooled tanks, each containing 25 000 m3. At the
Geleen site, ammonia is supplied through a liquid ammonia distribution grid to which the
ammonia storage tanks are connected. Supply to external customers is arranged through leased
rail cars that directly connect the Geleen site to customer’s production sites. The Geleen site has
fully integrated rail loading facilities and a daily loading capacity of 24 rail tank cars. Moreover,
OCI Nitrogen is the owner of two ammonia storage tanks at Europoort (Rotterdam) shown in the
Figure 10. Each tank has a capacity of 15 000 tons of refrigerated ammonia [37].
a) b)
c)
Page 31
21
Figure 10. OCI Nitrogen – two ammonia storage tanks at Europoort (Rotterdam)
2.4.1. Comparison of energy carriers
Many different materials can store energy, ranging from wood, to gas, to uranium. These
materials are known collectively as fuels, and all of these fuels are used as energy sources for a
variety of systems. Some fuels can be considered as energy rich carriers. The amount of energy
that can be stored in energy carriers, in a given mass of a substance or system is related as an
energy density [38]. Furthermore, the use of fossil fuels in the transportation sector have resulted
in a greenhouse gas emissions. Therefore with agreed points from Paris Climate Change
Conference regarding CO2 emissions, there is a strong need to come up with some
environmentally benign and sustainable alternatives. In general when comparing the energy
carriers, the higher the energy density of a system or material, the greater the amount of energy
stored in its mass. Energy can be stored in many different types of substances and systems (Figure
11).
Figure 11 shows the comparison of power density and energy density of different storage
technologies and energy carriers.
Page 32
22
In this regard, the volumetric energy content of the fuel is considered an important parameter
because it accounts not only for the calorific value, but also for the fuel ability to perform work
due to pressure difference between the tank pressure and environment. For a given amount of
energy, the higher the power and energy densities are, the smaller the volume of the required
energy storage system will be. From the Figure 11 it can be seen that ammonia has a both lower
volumetric (11.5 MJ/L) and gravimetric density (18.6 MJ/kg) compared to other energy carriers
except hydrogen. Compared to other fuels, diesel stores the most energy per unit of volume (34
MJ/L). However, diesel has the disadvantage that when combusted in an ICE emits SOx, NOx,
large amounts of CO2 and other pollutants. Furthermore, liquid hydrogen has a higher gravimetric
energy density (MJ/kg) than ammonia but a lower volumetric energy density (8 MJ/L) as shown
in Figure 11. The low energy density of hydrogen, both when liquefied and at high pressure,
presents a storage challenge for vehicular applications, as well as large scale hydrogen storage,
making ammonia more viable and attractive option [39]. Regardless the lower energy densities,
compared to other fuels such as diesel and gasoline, ammonia releases little or no greenhouse
gas when burned, and that it's possible to produce it by means that involve minimal GHG
emissions throughout its lifecycle [40].
Figure 11. Volumetric and gravimetric energy densities of various energy carriers.
Page 33
23
Figure 16 compares the cost of storage for ammonia and hydrogen per unit of delivered energy.
Additionally, the size of the storage devices is an important factor for many applications.
An anhydrous ammonia transport tank, even with a 4.5 times smaller volume, stores 31 % more
H2 mass than a pressuried hydrogen transport tank (Figure 12) [39].
Figure 12. The storage capacity comparison of anhydrous ammonia and pressurized hydrogen
tanks [39].
2.5. Transport of ammonia
Ammonia is used as a base chemical for a large number of intermediate products that find
their use in many applications. As a result of the international market and high demand for
ammonia, ammonia can only be produced economically in large scale production plants. If an
industrial site has an ammonia consumption that is a lot smaller than the economical size of an
ammonia plant, it is required to transport the ammonia to this site. Rail transport is regarded as
a safe means of transport for large quantities of ammonia [37].
In the Netherlands, ammonia is produced from natural gas in the industry located in Geleen and
Sluiskil (Figure 13). Part of the produced ammonia in Sluiskil is further exported along the
Westerschelde as well as through Westerschelde to companies in Antwerp. Ammonia in Geleen
Page 34
24
and IJmuiden Sluiskil is partly processed into fertilizers. For fertilizer production in IJmuiden
ammonia is imported from Geleen by rail. Ammonia is used as a raw material by many chemical
companies in the Netherlands. The ammonia for these companies is transported by rail from
Geleen (Figure 15). Figure 13 shows the balance of production and distribution of ammonia in
the Netherlands in the form of the Sankey diagram [41]. Production location and the most
important delivery (customer) points are also indicated in Figure 14.
Figure 13. Production and distribution of ammonia in The Netherlands (quantities expressed in
1000 ton).
In the UN classification system for transport, anhydrous ammonia and strong solutions of
ammonia are classified as toxic gas of Division 2.3, falling in Class 2 [36]. Dilute solutions fall in
Class 8, corrosive substances. Table 4 summarizes the relevant particulars. The UN transport
regulations specify a proper shipping label for all the dangerous substances. This also applies to
mixtures and solutions. The proper shipping labels to be filled in the accompanying documents
are also shown in Table 4.
Page 35
25
Figure 14. Locations in the Netherlands of ammonia producers ( ); delivery points (customers) (
) and transport routes by rail [41].
Figure 15. Rail transport of ammonia in Netherlands (source OCI).
Page 36
26
Table 4. UN transport classification and labeling [42].
UN no.
Name and description Class Labels Tank code
Transport category
Hazard identification
number
1005 Ammonia anhydrous 2 2.3+8(+13) PXBH(M) 1 268
3318
Ammonia solution relative density less than
0.880 at 15°C in water, with more than 50 % ammonia
2 2.3+8(+13) PXBH(M) 1 268
2073
Ammonia solution relative density less than
0.880 at 15°C in water, with more than 35 % but not
more than 50 % ammonia
2 2.2(+13) PXBN(M) 3 20
2672
Ammonia solution relative density less than
0.880 and 0.957 at 15°C in water, with more than 10 %
but not more than 35 % ammonia
8 8 L4BN 3 80
Ammonia is classified as a “hazardous substance” and transport, as previously mentioned, is
subject to stringent safety requirements. Ammonia is often transported by rail, and the fact that
routes in the Netherlands pass through city centers involves risks. Therefore there is need to
minimize rail transport of ammonia as far as possible. Ammonia is transported via the routes in
the “basic rail network for the transport of hazardous substances”, for example the Betuwe line
[43].
The alternative forms of ammonia transport include pipeline, large sea-going vessels, river
barges, rail tank cars and tank trucks (except in Germany). Inside Europe ammonia is transported
by river barges, rail tank cars and tank trucks. In Europe there are no long-distance pipeline
systems. The most comparable transport form for large quantities versus rail tank cars is river
barges. The locations that need to import ammonia are not necessarily located next to a canal
suitable for river boats. The advantage of rail tank cars is that they can reach more locations,
however the transferred load per rail tank cars is considerably less than for river boats [42].
Page 37
27
3. A comparative evaluation of the available electrical energy carriers
This chapter presents static data and characteristics of different technologies that are
available for electricity storage. The technologies discussed here are: power-to-chemicals
(ammonia and methanol), power-to-gas (hydrogen, methane), compressed air energy storage,
flywheels, supercapacitor and batteries. The detailed description of the mentioned energy
storage technologies is out of the scope of this study. Instead, a brief overview of the latest
developments and potential disadvantages are given here. In order to provide a more complete
picture of the entire portfolio on future energy storage technologies see tables 5 and 6.
Flywheels store energy in the angular momentum of a spinning mass. During charge, the
flywheel is spun up by a motor; during discharge, the same motor acts as a generator
producing electricity from the rotational energy of the flywheel. They have several
disadvantages including their low energy and power density, large standby losses, and
potentially dangerous failure modes [44]. They are not suitable for storing energy for
more than a day (they have a self-discharge rate of 3-40 % per hour), they have a low
energy capacity (less than 25 kWh). Flywheels are relatively expensive, and their
application is limited to frequency control, reactive power mediation and possibly short-
term uninterruptible power supply [45].
Batteries are electrochemical devices that convert chemical energy into electrical energy
during battery discharge. While primary batteries lose all of their electricity when the
chemical reactions are spent, secondary or rechargeable batteries can reverse the
chemical reaction by the introduction of electricity. The fundamental building block of a
battery is a single electrochemical cell, which generally consists of two different
electrodes and an electrolyte [45]. Many different battery types exist today. However,
different forms of batteries are suitable mostly for short term applications.
Page 38
28
Compressed Air Energy Storage (CAES) system compresses a gas (usually air) to high
pressures (70 to 100 bar) and injects it into either an underground structure (e.g. cavern,
aquifer, or abandoned mine) or an above ground system of tanks or pipes to store energy.
This kind of system has several disadvantages. It requires a suitable site that must satisfy
specific underground geological characteristics. Large subterranean caverns of suitable
geologic strata, ancient salt mines, or underground natural gas storage caves are ideal for
CAES as they can maintain high geostatic pressures with minimal loss [46]. The
underground caverns must be large enough to make CAES cost effective [47]. The air must
be heated when it is decompressed and this heat is typically derived from combusting
natural gas, which greatly reduces the efficiency of the overall system. Each kilowatt-hour
of stored compressed air would require 4500 kJ of fuel for heating. Lastly, CAES systems
generally have a long construction time.
Unlike above mentioned storage technologies, ammonia as an energy storage technology is
suitable for mid-term or long-term storage. Ammonia can be easier liquefied than other gaseous
energy carriers such as hydrogen and methane, making it easier to store and transport. This is a
significant advantage, because it could be transported in tankers or pumped over existing gas
pipelines. Although it is toxic, its characteristic smell would quickly give away the presence of
leaks. Hydrogen, stored at higher pressures, is likely to be more dangerous [48].
Furthermore, the performance and characteristic parameters of some technologies that store
energy in chemicals are summarized in table 5.
Comparing hydrogen to ammonia, there are several disadvantages to hydrogen storage systems.
First, the storage cost of hydrogen is quite high given current technology. Lastly, analyses of the
full life cycle cost for hydrogen storage systems have not yet been performed [52].
Page 39
29
Table 5. Chemicals that could be used as renewable energy storage materials.
It is apparent that the energy application is the key to determining which storage technology is
most suitable for a given situation. Every storage technology is defined by the storage properties,
and these properties will further determine which storage technology is most suitable. Based on
which application the stored energy is intended to be used for, one can easily judge which
technologies best meet their needs and should be studied further (Table 6).
Energy carrier Energy density
Wh/L Power density
W/L Specific energy
Wh/kg Suitable storage
duration
Ammonia 4325
[49, 50, 51] 4325
[49, 50, 51] 4318-5140 [49,
52] Hours-months
Hydrogen 2600 [52] 2600 [52]
33300 -39000
[52] Hours-months
Methane 6400 6400
15400 Hours-months
Methanol 4600 4600 5600-6400 [52] Hours-months
Page 40
30
Table 6. Technology suitability of various energy storage technologies [45].
● indicates full suitability
● indicates potential or moderate suitability
○ indicates no suitability
Ap
plic
atio
n
Tech
no
logy
Nam
e
Fre
qu
ency
C
on
tro
l
Ho
url
y B
alan
cin
g
Dai
ly
Bal
anci
ng
Seas
on
al
Bal
anci
ng
T&D
C
on
gest
io
n R
elie
f
Bla
ck
Star
t
Off
-gr
id /
M
icro
gr
id
Was
te
Hea
t U
tiliz
ati
on
Off
- to
O
n-P
eak
Shif
tin
g &
Fi
rmin
g
Dem
and
Sh
ifti
ng
&
Pea
k R
edu
ctio
n
Ener
gy
Arb
itra
ge
Rea
cti
ve
Po
wer
Un
inte
rru
pti
ble
Po
wer
Su
pp
ly
Tran
spo
rt
Ele
ctri
c En
erg
y
Pu
mp
ed H
ydro
●
●
●
○
○
○
○
●
○
●
●
○
○
Co
mp
ress
ed
Air
En
ergy
Sto
rage
●
●
●
○
○
○
○
○
●
●
○
○
Lead
Aci
d B
atte
ry
○
●
○
○
●
●
○
●
●
○
○
●
●
Lith
ium
Ion
Bat
tery
○
●
○
○
●
●
○
●
●
○
○
●
●
Gas
an
d L
iqu
id F
ue
l
Hyd
roge
n G
as
●
●
●
●
●
○
○
○
●
○
●
●
○
Liq
uef
ied
Nat
ura
l Gas
○
●
●
○
●
○
○
○
○
○
○
○
○
○
Page 41
31
3.1. The cost of power-to-X technologies
This chapter focuses on the economics/costs of only the power-to-x-energy storage
technologies using ammonia, methane and hydrogen as storage materials. Generally, the costs
of a power-to-x plant can by divided into capital cost for the construction and variable cost for
the operation of the unit (Table 7).
Table 7. Total costs of storage technologies for ammonia, hydrogen and methane.
*Power consumption was calculated on base of the 100 kg/hr production. **kW refers to power consumption
The prices for ammonia and hydrogen storage, transport and production cost can vary per
country by currency and energy price (Table 8).
Energy carrier
Process power
consumption MWel
*
Production Capacity
kg/h
Investment costs
€/kW**
Maintenance and
Operating costs €/kW
Capital costs of storage capacity
€/kg
Ammonia 1.23 100 450 16 25 [53]
Hydrogen 5,9 [54] 100 300-850 [55] 21-42 [56,
57] 600-900
[55]
Methane 20.8-27.6
[58] 100 400-2500 [55] 16-100 [55] 8/127 [59]
Page 42
32
Table 8. Production, transport and storage costs for ammonia and hydrogen [51].
Hydrogen (€/kg H2) Ammonia (€/kg H2)
Production 2.70 3.40
Pipeline transport 1.69 0.17
Storage
1 day 0.71 0.03
15 day 1.78 0.05
182 day 13.48 0.49
The production cost of green ammonia is €0.7/kg H2 equivalent higher than that of hydrogen,
assuming that the price of the bidden electricity is zero. Higher production costs are expected
since the first step of ammonia production is hydrogen generation, followed by the Haber Bosch
synthesis. The transport and storage costs of ammonia are however significantly lower than that
for hydrogen (- €1,5/ kg H2 equivalent). The difference in cost between hydrogen and ammonia
is even more evident when the three expenses are combined (Figure 16). The storage cost of
hydrogen is significant higher when it is stored for a longer period.
In all cases an ammonia-based process-chain is currently more economical than hydrogen [51].
Figure 16. Total costs for ammonia and hydrogen – production, transport and storage for 1, 15
and 182 days; ammonia values normalized to hydrogen [51].
Page 43
33
3.2. CO2 emission reduction
Table 9 shows a worldwide ammonia production overview. It can be seen that in most parts
of the world ammonia is produced using hydrogen from natural gas. China and India are the
exceptions where oil and coal play an important role.
Table 9. Percentage of different fossil fuels used for production of ammonia and the energy
efficiency of ammonia production in different parts of the world [54].
Gas Oil Coal GJ/t NH3
Western Europe 100 % 35.0
North America 100 % 37.9
Russia and Central Europe 98.9 % 1.1 % 40.7
China and India 26.5 % 18.7 % 54.7 % 47.6
Rest of the world 100 % 36.4
World average 70.7 % 8.2 % 21 % 41.5
The greenhouse gas emissions from producing ammonia are shown in the Table 10. It can be seen
that the average current European ammonia production (middle value from Western Europe,
Centrale Europe and Russia) has 1.82 ton CO2 equivalent for every ton NH3 produced [11]. From
the worldwide survey it is calculated that a global average emission is 3.45 ton CO2/t NH3 [12,
13].
With green ammonia production, environmental impact is relatively minor. According to the
Intergovernmental Panel on Climate Change (IPCC), wind turbines have an emission of 10 – 20 g
CO2 eq/kWh, depending on whether offshore or onshore turbines are being assessed [60, 61].
Assuming that 179 kg hydrogen is needed to produce 1 ton NH3, a wind-powered power-to-
ammonia unit would have an emission of 0.1 – 0.2 ton CO2 eq/t NH3. However, it should be
mentioned, that no information could be found on the CO2 emission of the nitrogen capture
process.
Page 44
34
Table 10. Greenhouse gas emissions of the current ammonia production technology [11].
Region ton CO2 eq/t NH3
Western Europe 2.34
North America 2.55
Russia and Centrale Europe 3.31
China and India 5.21
Rest of the world 2.45
World average 3.45
4. The possible roles of ammonia in the global energy economy
The global industrial production of ammonia is more than 170 million tons per year. Ammonia
is considered to be the second-largest industrial chemical and it is used for various applications
with a primary use for fertilizer production. Figure 17 shows the global ammonia consumption in
the last 15 years. It can be seen that a slight decline by ammonia consumption for the industrial
purposes was present in 2008 and 2009 during the economic crisis. On the other hand, the
agricultural and technical demand for urea (converted ammonia) has increased.
Page 45
35
Figure 17. Global ammonia consumption as urea, other fertilizers, di-ammonium /mono-
ammonium phosphate and industrial purposes.
Ammonia demand grows on average by 2 % per year. China is the biggest producer of the
ammonia with 32 % of global ammonia production in 2012. Other producers are India with 9 %,
United States and Russia with 7 % (Figure 18). The largest importer is United States with 35-40 %
of world trade, while Europa accounts for 25 % of the trade. The areas and countries with the
low costs for natural gas and limited domestic consumption are the major exporters (Latin
America, Middle East and North Africa).
Figure 18. A schematic summary of the global ammonia producers.
Page 46
36
In Europe ammonia is mostly produced from natural gas. The total capacity for the industrial
ammonia was around 21 million tons (15 % of global production). 17 European countries
produce ammonia within 42 production plants (Table 11).
Table 11. Ammonia production in Europe (2013).
Countries Production k tons Number of plants % European production
Germany 3438 5 17
Poland 3210 5 16
Netherlands 2717 2 13
Romania 2176 6 11
France 1495 4 7
Lithuania 1118 1 5
Bulgaria 1118 3 5
United Kingdom 1100 3 5
Belgium 1020 2 5
Spain 609 3 3
Italy 600 1 3
Austria 485 1 2
Slovakia 429 1 2
Hungary 383 2 2
Czech Republic 350 1 2
Estonia 200 1 1
Greece 165 1 1
Total 20613 42 100
Furthermore the possible roles that ammonia as an energy carrier may play in the future of the
global energy economy are discussed. The following options for usage could be identified and
divided into seven most important applications:
Page 47
37
Energy storage, transport and usage [40, 62] - Ammonia production for storing renewable
energy sources, with special attention to those characterized by uncertainties and
intermittence, for their improved valorization. Ammonia can be converted into useful
energy either directly, i.e. in a spark ignition engine or an electrochemical fuel cell, or
indirectly via its dissociation into hydrogen. Hydrogen storage and transportation,
ammonia contains more hydrogen than liquefied hydrogen itself and it is easily stored.
Fertilizers [63, 64] - Production of liquid fertilizer solutions which consist of ammonia,
urea, ammonium nitrate and aqua ammonia. Over 80 % of NH3 production is used for
fertilizer. It can be directly applied to soil as a plant nutrient or converted into a variety of
common N fertilizers such as ammonium nitrate, ammonium sulfate or urea.
Pharmaceuticals and chemicals [65] - A source of protein (ammonia together with urea)
in livestock feeds for ruminating animals such as cattle, sheep and goats. Ammonia can
also be used as a pre-harvest cotton defoliant, an anti-fungal agent on certain fruits and
as preservative for the storage of high-moisture corn. Ammonia is used in the
manufacture of nitric acid; certain alkalis such as soda ash; dyes; pharmaceuticals such as
sulfa drugs, vitamins and cosmetics; synthetic textile fibers such as nylon, rayon and
acrylics; and for the manufacture of certain plastics such as phenolic and polyurethanes.
The food and beverage industry uses ammonia as a source of nitrogen needed for yeast
and microorganisms. Ammonia is used as the developing agent in photochemical
processes such as white printing, blue printing and in the diazo duplication process. Weak
ammonia solutions are widely used as commercial and household cleaners and
detergents.
Mining, Metallurgy [66] - Dissociated ammonia is used in metal treating operations like
nitriding, carbonitriding, bright annealing, furnace brazing, sintering, sodium hydride
descaling, atomic hydrogen welding and other applications where protective
atmospheres are required. Ammonia is used in the mining industry for extraction of
metals such as copper, nickel and molybdenum from their ores.
Industry [40, 41] - Ammonia is used in neutralizing the acid constituents of crude oil and
for protection of equipment from corrosion. In the pulp and paper industry, it is used for
Page 48
38
pulping wood and as casein dispersant in the coating of paper. Ammonia is used in the
rubber industry for the stabilization of natural and synthetic latex to prevent premature
coagulation. Ammonia is used by the leather industry as a curing agent, as a slime and
mold preventative in tanning liquors and as a protective agent for leathers and furs in
storage. Ammonia is used in stack emission control systems to neutralize sulfur oxides
from combustion of sulfur-containing fuels, as a method of NOx control in both catalytic
and non-catalytic applications and to enhance the efficiency of electrostatic precipitators
for particulate control.
Water treatment [67] - Ammonia is used in several areas of water and wastewater
treatment, such as pH control, in solution form to regenerate weak anion exchange resins,
in conjunction with chlorine to produce potable water and as an oxygen scavenger in
boiler water treatment.
Refrigeration [68, 69] - Ammonia is a widely used refrigerant in industrial refrigeration
systems found in the food, beverage, petro-chemical and cold storage industries.
DeNOX - Ammonia is used in various forms for using as DENOX agent in SNCR and SCR
catalyst systems all around the world. This application where ammonia is used as
chemical to clean the emissions in power plants or boiler operations is growing fast.
4.1. Ammonia as a source of hydrogen
One of the goals of the automotive industry is the development of low emission engine
technology for vehicles to reduce their environmental impact. Among the various solutions
considered hydrogen appears to be a promising alternative for automotive applications [70, 71].
The main problems with hydrogen, however, are the safe handling, storage and transport. The
use of hydrogen as a fuel for wide-spread distribution in either gaseous or liquid form poses
numerous safety, technical, and economical problems. One approach to resolve the drawbacks
of hydrogen as a fuel includes the consideration of less expensive, simpler, and cheaper
alternatives that can act as hydrogen carrier. 1 mol of ammonia contains 1.5 mol of hydrogen,
which is 17.8 % by weight or 108 kg eq H2/m3 embedded in liquid ammonia at 20 C [34, 72].
Page 49
39
Comparing this to advanced hydrogen storage systems, e.g. metal hydrides, which store H2 up to
25 kg/m3, the advantage of ammonia in carrying hydrogen per unit volume is significant [72].
Moreover, decomposition of ammonia is by definition carbon free. Thus using ammonia as a
hydrogen source is a potential alternative to the conventional hydrocarbon reforming and makes
the on-board hydrogen production free of carbon. There are several ways to obtain hydrogen
from ammonia and it’s products.
4.1.1. Catalytic decomposition of ammonia into nitrogen and hydrogen
Ammonia is unstable at high temperature and begins to decompose at 220 °C. A conversion
of 98-99 % from ammonia to hydrogen is possible at temperatures as low as 445 °C. The chosen
catalyst greatly influences the rate of conversion. These catalysts are mostly iron based
containing Ni, Pt, Ru, Ir, Pd, Rh; alloys such as Ni/Pt, Ni/Ru, Pd/Pt/Ru/La; and alloys of Fe with
other metal oxides including Ce, Al, Si, Sr, and Zr, WC, Ni/Al2O3, NiCeO2 /Al2O3, Cr2O3, Ru/ZrO2,
and Ru on carbon nano-fibres. The highest conversion for catalytic decomposition is obtained on
the Nano-sized Ni/Santa Barbara Amorphous (SBA)-15 and Ir/SiO2 catalysts with conversions of
99.2 % and 98 %, respectively [73].
4.1.2. Electrolysis/Electro-oxidation of Ammonia into Nitrogen and Hydrogen
Ammonia can be electrochemically decomposed in an alkaline medium:
2𝑁𝐻3 + 6𝑂𝐻− → 𝑁2 + 6𝐻2𝑂 + 6𝑒− E0=-0.77 V/SHE
6𝐻2𝑂 + 6𝑒− → 3𝐻2 + 6𝑂𝐻−, E0 = -0.82 V/SHE.
The thermodynamic potential for ammonia electrolysis in alkaline media is -0.77 V compared to
-1.223 V for the electrolysis of water. The theoretical thermodynamic energy consumption is 1.55
Wh/g of H2 from electrolysis of NH3 compared to 33 Wh/g of H2 from H2O [73].
Page 50
40
4.1.3. Hydrogen production from ammonia product - ammonia borane
Reaction of diborane with ammonia mainly gives the diammoniate salt [H2B(NH3)2]+(BH4)−.
Ammonia borane is the main product when an adduct of borane is employed in place of di-borane
[74]. Ammonia-Borane (AB) complex has a high hydrogen content (about 19.6 % wt) with a
system-level H2 energy storage density of about 2.74 kWh/L. Various catalysts can be used for
this process: noble metals-based catalysts and non-noble metal-based catalysts such as Fe, Ni
and Co. [73]. Ammonia borane will undergo hydrolysis in order to obtain hydrogen at room
temperature in basic water, presented in the equation below:
𝑁𝐻3𝐵𝐻3 + 2𝐻2𝑂 → 𝑁𝐻4
+ + 𝐵𝑂2− + 3𝐻2
4.2. Direct ammonia-based fuel cells
4.2.1. Ammonia-based PEM fuel cells
Polymer electrolyte membrane (PEM) fuel cells cannot be used directly with ammonia.
Ammonia acts as a poison to the Nafion membrane in the cells, since both the conductivity of the
membrane and the activity of the catalysts are adversely affected by trace amounts of ammonia
in the fuel feed. Therefore, ammonia must be decomposed externally at higher temperatures,
and then the produced hydrogen can be supplied to the fuel cell. The internal ammonia
decomposition is not thermodynamically favorable. If there is not 100% conversion of ammonia
to hydrogen, then there could be trace amounts of ammonia in the hydrogen feed. [73].
4.2.2. Ammonia-based alkaline fuel cells
Alkaline fuel cells can be used for decomposing the anhydrous ammonia, aqueous alkaline
electrolytes are tolerant to ammonia. [73].
Page 51
41
4.2.3. Direct ammonia solid oxide fuel cells
Few studies have investigated solid oxide fuel cells (SOFCs) for direct ammonia oxidation [75,
76, 77]. Ammonia decomposes readily at the high temperatures of SOFCs and has not been
shown to act as a poison to the ceramic electrolytes utilized in SOFCs [73].
4.2.4. Ammonia vehicles
As previously mentioned ammonia can be used as a fuel and converted into energy either by
using an internal combustion engine (ICE) or electrochemical fuel cell by decomposing into
hydrogen [78].
Oil shortages, CO2 emissions and the cost of fossil fuels constitute the main problems of the
traditional combustion engine, while electric cars do not currently have the flexibility to be a
viable option for everyone. The ammonia-based car is designed to meet these challenges. The
first vehicle that travelled using ammonia was designed in Belgium in 1943 (Figure 19 a)).
a)
b)
Figure 19. a) The first ammonia vehicle in Belgium in 1943 (Vercruysse and Rug) and b) an
ammonia vehicle today.
The Greg Vezina, The AmVeh, Marangoni Toyota GT86 ECO explorer (Figure 19 b)) and Kia
Morning G/L bi-fuel are experimental ammonia cars currently being developed. Ammonia is
directly injected and burned into an ICE. The Greg Vezina’s ammonia car uses a dual fueled diesel
and ammonia engine [79]. First the diesel is used to start the engine and to initiate the ignition
Page 52
42
of ammonia after the car is started. The AmVeh (ammonia vehicle) is an ammonia fueled car from
South Korea that uses 30 % gasoline and 70 % ammonia. Gasoline is necessary for starting the
ignition. 70 % of the carbon dioxide emission is avoided. This car can drive 10 km/L at a speed of
60-80 km/h. [80].
The Marangoni Toyota GT86 ECO explorer is also a dual fueled car. It holds up to 30 L ammonia
and can travel up to 180 km CO2 free [81]. The Kia Morning G/L bi-fuel is fuelled by ammonia and
gasoline dual fuel with a ratio of 70:30. Ammonia is taken along with the fresh air from the intake
manifold and a small quantity of diesel fuel is injected inside the cylinder to have the ammonia
air mixture ignited. [82].
It is expected that based on the present R&D efforts by the various automotive suppliers, still big
improvement could be made in the motor management to realise better efficiencies. However,
first the demonstration of ammonia in vehicles shall be commonly accepted. The acceptance of
ammonia in cars is however not yet at the attention of decision makers for policies and shall need
man years of exploration and acceptation before further breakthrough in car development will
be done for running cars on ammonia (or as Proton Ventures registered tradename :NFUEL ®).
In addition to personal transportation, ammonia can be used as a fuel for the agro-industry. HEC
has produced the first dual fueled hydrogen/ammonia tractor. The tractor has no direct CO2
emissions [83].
Ammonia has also been used as a fuel in the aircraft industry: The X-15 rocket plane was fueled
by ammonia in the 1960s [84].
Page 53
43
5. Power-to-ammonia scenarios
In order to further investigate the viability of the power-to-ammonia concept, three
scenarios were developed.
Scenario 1:
Dedicated wind-powered system
This scenario considers a setup wherein an ammonia plant is placed alongside a 1.5 MW wind
turbine, which acts as the sole source of electricity. The premise of this scenario is to demonstrate
the viability and potential annual production hours of an ammonia plant which is powered
entirely by the fluctuating energy production of a wind turbine.
Scenario 2:
Local scale power-to-ammonia system
The second scenario details a hypothetical rural region consisting of 10 houses, each with 5 kW
of solar PV panels and a 150 kW wind turbine installed. The premise of this scenario is that the
local electricity grid is limited to 22 kW (a realistic case if there is no mid-voltage grid in the
immediate area), which will limit the export of renewable energy during peak production hours.
During these times, surplus electricity will be used to power a small ammonia plant. Power-to-
ammonia offers the stabilization of a power-overshooting situation and helps to avoid a local
scale blackout.
Scenario 3:
National scenario
The third scenario considers how surplus electricity could be handled on a national scale.
Currently, surplus electricity can be exported, stored or discarded. Assuming that energy export
is not an option, it is preferable to store surplus electricity, in this case in the form of ammonia,
rather than discard it. Using various future energy scenarios, the production of electricity is
Page 54
44
estimated for the entire Netherlands for each hour of the year. When production exceeds
demand, the surplus electricity is (partially) used to power an ammonia plant.
5.1. Method of the renewable energy production calculations
In order to evaluate the scenarios, it is important to estimate the production of renewable
energy throughout the year. Using some approximations and calculations based on historical
KNMI (Koninklijk Nederlands Meteorologisch Instituut) weather data and Tennet electricity
consumption data, it is possible to estimate potential net renewable energy production.
5.1.1. Wind Production
Using KNMI data and wind turbine power curves, we can estimate wind energy production
for a given location with a given installed wind capacity for each hour of the year. The following
equation was used for this estimate:
𝑀𝑊𝑊𝑖𝑛𝑑 = 𝐶𝑎𝑝𝑎𝑐𝑖𝑡𝑦 × 𝑈𝑡𝑖𝑙𝑖𝑧𝑎𝑡𝑖𝑜𝑛 × 𝑃𝑜𝑤𝑒𝑟 𝐹𝑎𝑐𝑡𝑜𝑟
The variables used in this calculation were:
- Capacity – The installed wind capacity; depending on the scenario, this ranges
from 1.5 to 25,000 MW.
- Utilization – The maximum peak output which is assumed to be achievable at any
given time (due to maintenance, connectivity issues, etc.), typically set at 82 %. This
number may be 100 % when modeling a single turbine.
- Power Factor – The amount of energy produced according to the current wind speed, as
a percentage of total capacity. We use the power curve of a Vestas 2 MW wind turbine as
a basis.
Page 55
45
5.1.2. Solar Production
The same approach was used for the estimation of the solar energy production for a given
location with a given installed solar capacity for each hour of the year. The following equation
was used for this estimate:
𝑀𝑊𝑃𝑉 =𝐶𝑎𝑝𝑎𝑐𝑖𝑡𝑦 × 𝑈𝑡𝑖𝑙𝑖𝑧𝑎𝑡𝑖𝑜𝑛 × 𝐻𝑜𝑢𝑟𝑙𝑦 𝑀𝑢𝑙𝑡𝑖𝑝𝑙𝑖𝑒𝑟 × 𝑆𝑜𝑙𝑎𝑟 𝐼𝑟𝑟𝑎𝑑𝑖𝑎𝑛𝑐𝑒
1000
The variables used in this calculation were:
- Installed Capacity (MW) – The amount of installed solar energy capacity; in the case
of the national scenario (Scenario 3), this is assumed to be equal to 10 % of installed wind
capacity.
- Maximum PV utilization – The maximum peak output which is assumed to be
achievable at any given time (due to variation in PV panel orientation, tilt angle, efficiency,
etc.), set to 75 % in our scenarios.
- Solar Irradiance (W/m2) – The measured solar irradiance for each weather station.
- Hourly Multiplier – A multiplication factor used to correct for the South-West
facing, 45˚ tilt angle typical of solar panels compared with the KNMI measurement on a
horizontal plane.
5.2. Assessment of green ammonia production – the dedicated wind-powered
system – Scenario 1
The main assumption in this scenario is that an ammonia plant is constructed alongside a 1.5
MW wind turbine. It is also assumed that there is no electrical grid connection available and the
electrolyzer can be powered exclusively by the wind turbine. Surplus energy from the wind
turbine is simply discarded. The aim of this scenario is to demonstrate the viability of the
construction of an ammonia plant which is powered solely by renewable energy, assuming that
the electrolyzer can be quickly turned on or off depending on the availability of energy.
Page 56
46
For the assessment of the wind resource in the Netherlands, the database from KNMI for 2014
at the locations of Hoek van Holland, Eelde and Eindhoven was used.
For the calculations an electrolytic hydrogen-production energy-cost of 4.5 kWh/m3 was taken.
The ammonia production for the system consisting of an 1.5 MW nominal wind turbine and an
electrolyzer with the same nominal power was used. Figures 20, 21 and 22 show the generation
profiles of a 1.5 MW wind turbines which will be further used for the production of ammonia
with renewable hydrogen, via the Haber- Bosch process. There are seasonal peaks visible for the
generation profile. During the winter months the wind tends to be stronger.
The wind turbines at Hoek van Holland, Eelde and Eindhoven generated 7.41; 2.92 and 2.15
GWh/year power.
Figure 20. Generation profile of 1.5 MW nameplate wind turbine at Hoek van Holland for 2014
(monthly average values).
Page 57
47
Figure 21. Generation profile of 1.5 MW nameplate wind turbine for 2014 at the location of Eelde
(monthly average values).
Figure 22. Generation profile of 1.5 MW nameplate wind turbine for 2014 at the location of
Eindhoven (monthly average values).
For any given ammonia plant size, the flows of reactants and products throughout the plant can
be easily calculated. The flow rates through the system are determined from the stoichiometry
of ammonia. Ammonia is 82.25 % nitrogen by mass; and 17.75 % hydrogen by mass. Table 12
shows the total ammonia production for these three places, as well as their nitrogen and
hydrogen consumption. For the calculations an energy requirement of 10 400 kWh per ton of
NH3 produced was assumed.
Page 58
48
Table 12. Total ammonia production for Hoek van Holland, Eelde and Eindhoven according to
their electricity generation profile.
Place Total ammonia
produced tons/year
Nitrogen consumption
kg per day
Hydrogen consumption
kg per day
Hoek van Holland 712 1603.8 343.7
Eelde 281 631.3 135.3
Eindhoven 207 465.5 99.8
From the comparative research conducted in the chapter 2.3.1., it can be concluded that the
electrolyzer type suited for the produced amount of energy in this case scenario would be the
alkaline electrolyzer. In this situation alkaline electrolyzer would be more convenient than PEM
since it is more cost effective and has long term stability compared to PEM. However, ammonia
production has specific technical requirements that must be met to achieve successful operation,
high pressure and temperature. Additionally, some of the requirements originate from the fragile
nature of the catalyst: pressure and temperature cycling degrade the effectiveness, as do oxygen,
sulfur and other elements. Other considerations are the result of economic factors: a continuous
process enables more ammonia to be produced than a batch process, and in less time. As a result,
ammonia plants are designed to run using pure reactants, at nearly constant pressure and
temperature, almost continuously for their entire lifetime. A continuous operation can be
challenging with a fluctuating renewable energy source.
5.2.1. Short-time storage of ammonia for a local scale power-to-ammonia plant
The suitable storage methods for the estimated amount of ammonia production from a 1.5
MWnominal wind turbine would be pressurized vessels and portable tanks. Pressurized vessels and
portable tanks for ammonia storage are available in a number of convenient sizes. Table 13
presents the possibilities for the ammonia storage.
Page 59
49
Table 13. Suggested storage of ammonia according to a 100 kg/hr of ammonia production.
Am
ou
nt
of
amm
on
ia
kg/h
Pressurized vessel Steel H II ISO container Total price
of the storage units €
Nu
mb
er o
f
un
its
m3
Len
gth
m
Dia
met
er m
Shee
t th
ickn
ess
mm
Nu
mb
er o
f u
nit
s
Cap
acit
y
L
Dim
ensi
on
s
m
100.14 1 6 2.04 1.8 14.7-18.7
1 16630 0.51x0.20x0.22 48 000
100.14 0 6 2.04 1.8 14.7-18.7
2 16630 0.51x0.20x0.22 72 000
The data were calculated and were made on two possible cases. First of having one pressurized
vessel (Steel H II) for using as a storage buffer and one ISO tank that would be loaded for the
further transport of ammonia at the end of the day. A second possibility could arise from using
two ISO tanks with the storage duration of 5 days. Ammonia could be further unloaded and
stored in the larger tanks (OCI tanks) until it can be pumped into the various means of transport
for delivery to the customer or directly transported to the user.
5.2.2. A simple technical evaluation of Scenario 1
The viability of an ammonia plant is defined by the hours per year the plant is running, and
by the amount of surplus energy which the plant utilizes. These factors are defined as:
1. Capacity Factor: Defined as the ratio between an ammonia plant’s average working
capacity and its maximum working capacity. For example, an ammonia plant with a
nominal power of 1 MW which consumes an average of 500 kW would have a capacity
factor of 50 %.
2. Surplus Energy Utilization: Defined as the percentage of surplus energy which the
electrolyzer and the ammonia plant are able to consume. For example, if we have an
Page 60
50
average surplus power of 1 MW and an ammonia plant is able to consume 750 kW of this
energy on average, the surplus energy utilization would be 75 %.
In general, the higher an ammonia plant’s rated power, the lower the capacity factor, but the
higher the surplus energy utilization.
Based on the electricity production pattern, the capacity factor and the surplus energy utilization
for an electrolyzer/ammonia plant of a given size can be estimated. The power of the electrolyzer
determines the maximum hydrogen production rate that is achievable and directly influences the
size of the ammonia synthesis unit.
In this scenario, the capacity factor is strictly defined by the availability of wind energy. Since
ammonia production (coupled with a nitrogen buffer) can be easily ramped up and down, we
assume that the ammonia plant consumes all available energy up to its rated capacity, with
surplus energy being discarded.
Figure 23 shows the capacity factor and wind energy utilization of a theoretical
electrolyzer/ammonia plant with a variable rated power in Eelde in 2014.
An electrolyzer/ammonia plant with a rated power of 400 kW would have a capacity factor of
approximately 50 % (i.e. on average, the facility is consuming 200 kW) and would utilize
approximately 60 % of available wind energy (with the remainder being discarded).
Page 61
51
0 200 400 600 800 1000 1200 1400 16000
20
40
60
80
100
Electrolyzer capacity factor
Percentage of the used electricity
Perc
enta
ge
Electrolyzer power (kW)
Figure 23. Electrolyzer capacity factor and surplus energy utilization within Scenario 1 for a
theoretical ammonia plant in Eelde in 2014.
This same analysis was also performed for a theoretical ammonia plant at Hoek van Holland, as
shown below (Figure 24).
0 200 400 600 800 1000 1200 1400 1600
0
20
40
60
80
100
Electrolyzer capacity factor
Percentage of the used electricity
Perc
enta
ge
Electrolyzer power (kW)
Figure 24. Electrolyzer capacity factor and surplus energy utilization within Scenario 1 for a
theoretical ammonia plant in Hoek van Holland in 2014.
Since Hoek van Holland is more consistently windy than Eelde, we expect a greater availability of
wind energy. As a result, we see a relative increase in the electrolyzer/ammonia plant’s capacity
factor, but a decrease in the wind energy utilization for a given plant power. In short, more wind
Page 62
52
energy means an ammonia plant will run more often, however, a significant amount of energy is
also discarded.
Eindhoven is a relatively non-windy location. Hence, the theoretical capacity factor of the
ammonia plant is relatively low, while the available wind energy utilization is relatively high
(Figure 25).
0 200 400 600 800 1000 1200 1400 16000
20
40
60
80
100
Electrolyzer capacity factor
Percentage of the used electricity
Pe
rce
nta
ge
Electrolyzer power (kW)
Figure 25. Electrolyzer capacity factor and surplus energy utilization within Scenario 1 for a
theoretical ammonia plant in Eindhoven in 2014.
Based on the rated power of the ammonia plant and the available wind energy, we can conclude
that the capacity factor and wind energy utilization may vary greatly. Notably, these relations are
not linear, so appropriate sizing for an ammonia plant will be location-dependent.
5.3. Green ammonia production in the countryside – Scenario 2
The second scenario describes a rural region with ten households. Each household is assumed to
have 5 kW of solar panels and a 150 kW wind turbine installed. Additionally, there is a poor grid
connection (i.e. there is no mid-voltage grid in the immediate area), which will limit the potential
grid capacity to 22 kW. 22 kW was adopted because of a fact that one house will consume on
average 440 W, but as much as 5 kW, though not all the houses have a peak consumption
Page 63
53
simultaneously (when the electrical connection of the households was designed, the grid capacity
was based on the average consumption of the households: 0.44 kW per house times 10 houses
times safety factor of 5). This limitation reduced the amount of renewable energy which can be
exported at a given time. In this scenario, surplus energy (i.e. energy which is not consumed
directly or cannot be exported due to grid limitations) was used to power a hypothetical ammonia
plant. Similarly to the first scenario, the ammonia plant’s capacity factor was defined by the
availability of surplus energy.
5.3.1. Excess Energy Production
As described in chapter 4.2, solar and wind energy production for each hour of the year at a
given location were estimated. From this value a rough modeled electricity consumption pattern
for the ten households in our scenario was subtracted. Furthermore, it is assumed that of the
remaining electricity which is produced, as much as possible (in this case, up to 22 kW) was
exported through the electricity grid. Any remaining ‘surplus’ electricity was either discarded or
used to power an ammonia plant. Figure 26 displays the theoretical ‘surplus’ energy for each
hour of the year in Eelde, Hoek van Holland and Eindhoven after accounting for self-consumption
and energy export.
Figure 26. Theoretical surplus energy production for Scenario 2 in 2013 for Eelde, Hoek van
Holland and Eindhoven.
Page 64
54
5.3.2. A simple technical evaluation of Scenario 2
As in the previous scenario, the capacity factor and surplus energy utilization of a theoretical
ammonia plant at three locations within the Netherlands, Eelde, Hoek van Holland and
Eindhoven, were estimated. According to our analysis, in all three locations the solar energy
production was quite similar, while wind energy production varied greatly: largest in Hoek van
Holland, followed by Eelde and Eindhoven. Figure 27 shows the capacity factor and surplus
energy utilization for an ammonia plant with a given rated power in Eelde. In this case, an
electrolyzer with a rated power of 200 kW consumed roughly 75 % of surplus renewable energy
and had a capacity factor of 35 % (equivalent to the ammonia plant running 128 days per year).
0 100 200 300 400 500 600
0
20
40
60
80
100
Electrolyzer capacity factor
Percentage of the used electricity
Pe
rce
nta
ge
Electrolyzer power (kW)
Figure 27. Electrolyzer capacity factor and surplus energy utilization within Scenario 2 of a
theoretical ammonia plant in Eelde in 2014.
As a comparison, figure 28 shows an ammonia plant located in Hoek van Holland. It can be
observed that as a result of the increased wind energy production, a much higher capacity factor
is obtained, however a slower rise in surplus energy utilization is achieved. Following the above
mentioned example, a 200 kW electrolyzer in this case would utilize approximately 55 % of
surplus energy, having a capacity factor of nearly 80 % (equivalent to running 290 days of the
year).
Page 65
55
0 100 200 300 400 500 600
0
20
40
60
80
100
Electrolyzer capacity factor
Percentage of the used electricity
Pe
rce
nta
ge
Electrolyzer power (kW)
Figure 28. Capacity factor and surplus energy utilization within Scenario 2 of a theoretical
ammonia plant in Hoek van Holland in 2014.
Finally, Figure 29 presents the case for Eindhoven. From the three locations that were analyzed,
Eindhoven had the lowest potential renewable energy production and hence the lowest capacity
factor, with a surplus energy utilization similar to that of Eelde. Furthermore, a 200 kW
electrolyzer in Eindhoven would utilize roughly 80 % of surplus energy, while its capacity factor
would be around 30 % (the equivalent of working 110 days of the year).
0 100 200 300 400 500 600
0
20
40
60
80
100
Electrolyzer capacity factor
Percentage of the used electricity
Pe
rce
nta
ge
Electrolyzer power (kW)
Figure 29. Capacity factor and surplus electricity utilization within Scenario 2 of a theoretical
ammonia plant in Eindhoven in 2014.
Page 66
56
In both scenario 1 and 2 a suggestion would be to combine PEM and alkaline electrolysis. The
alkaline electrolysis for constant production of hydrogen and PEM can be switched on in <10
seconds (from standby) to catch surges when the electricity production peaks and the electricity
demand is low. PEM is recommended when high fluctuation is present. It has a low deployment
time and has a wide range of current density which provides more flexibility than alkaline. A
battery could also provide cheap stored electricity when the electricity price is high.
Furthermore, these scenarios demonstrated the potential viability of ammonia production as a
means of utilizing/storing surplus energy production in remote areas. It can be seen that viability
was extremely location dependent and may not be feasible in all cases. However, this option
could provide an alternative to simply discarding surplus energy production or investing in
additional electricity grid infrastructure.
5.4. FlexNH3 – Green ammonia production on a national scale – Scenario 3
As the amount of renewable energy generation within the Netherlands increases, it is likely
that ‘surplus’ electricity will become increasingly available. ‘surplus’ electricity is considered to
be electricity which is produced by renewable systems (e.g. wind and solar power), but cannot
be immediately used. Since it can be quite expensive to store or transport surplus electricity [24],
it may be beneficial to consume this energy immediately, for example, by powering an ammonia
production process.
This chapter describes the methodology used to estimate the potential of ammonia production
as a grid balancing mechanism on the national level: It describes the calculations, assumptions
and analysis of the data.
In order to determine the potential for ammonia production as a grid balancing mechanism, it is
first important to estimate how much ‘surplus’ renewable energy is available on a national level
at any given time.
Page 67
57
5.4.1. Renewable energy production on a national scale
It is assumed that electricity is produced by a mixture of renewable and non-renewable
sources: wind, solar, coal, gas, nuclear power plants and electricity import. For solar energy, a
relatively even distribution of the installed capacity throughout the country is assumed. For wind,
a higher concentration of capacity in (windier) coastal areas was taken, which reflects the plans
of the Dutch government to install more wind turbines in coastal provinces [3]. It is assumed that
renewable have the highest priority in the electricity production list, according to the merit-order
for the existing Dutch power plants [85]. Nuclear electricity cannot be easily switched on and off,
therefore it has also a priority over all the other electricity sources and it was used all the time.
Gas fired “must-run” combined heat and power capacity has not been considered in the
calculations. The missing amount of electricity that is needed to balance the grid is assumed to
be produced by non-renewable sources.
It is also assumed that the average hourly weather conditions reflect average hourly energy
production. In order to estimate the amount of surplus electricity from renewable sources,
TenneT’s national electricity consumption data from 2011-2014 was matched with the calculated
renewable electricity production. For the renewable electricity production the KNMI hourly
weather pattern from the same years was used. The presence of ‘surplus’ energy is considered
to occur when the nuclear and renewable sources alone produce more electricity that is needed
on a national level. In order to estimate this, 4 different scenarios were considered:
a) Large scale scenario A: 10.000+1000 MW renewable. These numbers reflects the Dutch
government’s renewable energy targets of installing 10.000 MW wind turbine nominal
capacity, and our assumption of 1000 MW solar installed nominal capacity. This
renewable nominal capacity is conjugated with a 492 MW nuclear source.
b) Large scale scenario B: 15.000+1500 MW renewable (15000 MW wind and 1500 MW
solar).
c) Large scale scenario C: 20.000+2000 MW renewable (20000 MW wind and 2000 MW
solar).
d) Large scale scenario D: 25.000+2500 MW renewable (25000 MW wind and 2500 MW
solar).
Page 68
58
5.4.2. Annual Surplus Electricity Patterns
Scenario 3 considers the feasibility of an ammonia plant acting as a grid balancing mechanism
on a national scale. Following this methodology, the hourly renewable energy production was
estimated for each of the scenarios described above.
In the following step the ‘production data’ was compared to the hourly national electricity
consumption data provided by Tennet. The surplus electricity production was selected to give an
approximate hourly surplus electricity pattern for several years.
Using these patterns, one can try to determine an optimal electrolyzer size, depending on
whether the surplus electricity consumption has higher priority (i.e. grid balancing) or
electrolyzer utilization (i.e. return on investment).
5.4.3. A simple technical evaluation of Scenario 3
The results from large scale scenario A suggest that the installation of 10.000 MW wind and
1000 MW solar production capacity will not cause frequent periods of surplus energy production.
Although all the results are highly dependent on the weather pattern, on average only a few
hours of excess electricity production can be expected per year. Table 14 summarizes the number
of excess hours obtained from the calculations.
A more frequent appearance of excess periods would follow the installation of 15.000 MW wind
and 1500 MW solar capacity in large scale scenario B (see Table 15 and Figure 1). These excess
periods become more prevalent in scenarios C and D, indicating an increased necessity for an
adequate technology to store excess electricity.
Page 69
59
Table 14. The number of hours per year when excess renewable electricity is produced in
Scenario 3.
Number of national excess hours per year
2011 2012 2013 2014
Large scale scenario A 71 0 1 0
Large scale scenario B 508 463 447 455
Large scale scenario C 1801 1892 1874 1641
Large scale scenario D 3133 3236 3256 2971
The following Figures (30, 31 and 32) describe the relationship between surplus electricity
consumption and electrolyzer capacity. Larger or smaller electrolyzers could be utilized with a
higher or lower focus on grid balancing in mind.
0 500 1000 1500 2000 2500 3000
0
20
40
60
80
100
Pe
rce
na
tge
Electrolyzer power (MW)
Electrolyzer capacity factor
Percentage of the used electricity
Figure 30. Correlation between surplus electricity consumption and electrolyzer capacity with
15.000 MW wind and 1500 MW solar installed capacity for 2014.
Page 70
60
-1000 0 1000 2000 3000 4000 5000 6000 7000 8000
0
20
40
60
80
100
Electrolyzer capacity factor
Percentage of the used electricity
Perc
enta
ge
Electrolyzer power (MW)
Figure 31. Correlation between surplus electricity consumption and electrolyzer capacity with
20.000 MW wind turbine capacity and 2000 MW solar panel installed for 2014.
0 2000 4000 6000 8000 10000 12000
0
20
40
60
80
100
Electrolyzer capacity factor
Percentage of the used electricity
Pe
rce
nta
ge
Electrolyzer power (MW)
Figure 32. Correlation between surplus electricity consumption and electrolyzer capacity with
25.000 MW wind turbine capacity and 2500 MW solar panel installed for 2014.
Figure 33 shows the total ammonia production profiles (ton/year) based on the surplus electricity
from the discussed renewable nominal capacities. The total ammonia production was based on
Page 71
61
the assumption that 10 400 kWh electricity is needed for the production of one ton NH3 (4.5 kWh
for producing one m3 of H2).
Figure 33. Total ammonia production per year according to the modeled surplus electricity for
large scale scenario A, B, C and D.
From Figure 33 it is clear that a higher nominal renewable capacity produces more surplus that
could potentially be used for ammonia production. Or in other words, higher nominal renewable
capacity creates more energy surpluses, thus requiring more energy consumption (i.e. for
ammonia production) as a grid balancing mechanism.
Page 72
62
6. Economic feasibility of power-to-ammonia
A techno-economic analysis was performed in order to investigate the economic
feasibility of the power-to-ammonia concept. MathWorks Matlab platform was used for the
simulations. Two scenarios where used for the calculations, a local, smaller scale power-to-
ammonia scenario, and a larger scale national scenario.
The simple technical evaluation of the two local scenarios from chapter 5 showed that the
pattern of the renewable electricity production is location specific, but for a given location the
correlation between the surplus electricity consumption and the electrolyzer capacity showed
similar tendencies, independently of the technical boundaries of the scenarios. Therefore, the
local scenario in our economic feasibility study will be a combination of Scenario 1 and Scenario
2, where the local scale green ammonia plant is assumed to have an adequate electrical
connection to the electric grid.
The economic feasibility of the national scale power-to-ammonia infrastructure is discussed
within the technical boundaries of Scenario 3.
6.1. Economic feasibility of the local scenario
When wind (and solar) energy is used to produce hydrogen, the highly intermittent nature of
the renewable electricity does not allow a steady flow of hydrogen. However, the ammonia
production unit requires a steady reagent flow. Two main methods were identified for the local
scenario to achieve a steady hydrogen flow and minimize the number of reaction interruptions :
i) the adaption of a hydrogen storage tank that acts as a buffer and ii) electricity import from the
grid during periods with no renewable electricity generation. The economic feasibility of the local
power-to-ammonia scenario is discussed for these two sub-scenarios.
Several assumptions on the main economical parameters were made:
- An average factory selling price of 400 €/tone is assumed for the produced ammonia.
- The capital cost of the onshore wind turbine is 1350 €/kW.
Page 73
63
- The capital cost of the electrolyzer is estimated using a linear equation – it is assumed
that the price changes linearly with the electrolyzer power within the studied range. The
equation is obtained from the linear fit of the prices obtained from several electrolyzer
sizes from different manufacturers:
𝐶𝑎𝑝𝑖𝑡𝑎𝑙 𝐶𝑜𝑠𝑡𝑒𝑙𝑒𝑐𝑡𝑟𝑜𝑙𝑦𝑧𝑒𝑟 = 180000 ∙ 𝑃𝑜𝑤𝑒𝑟(𝑀𝑊) + 910000
- The capital cost of the ammonia plant is estimated using a linear equation, similarly to the
previous case:
𝐶𝑎𝑝𝑖𝑡𝑎𝑙 𝐶𝑜𝑠𝑡𝑁𝐻3 𝑝𝑙𝑎𝑛𝑡 = 621 ∙ 𝑃𝑙𝑎𝑛𝑡 𝑠𝑖𝑧𝑒(𝑡𝑜𝑛𝑛𝑒𝑁𝐻3/𝑦𝑒𝑎𝑟) + 5000000
The price contains the capital cost of all the needed compressors and the nitrogen
producing unit. Nitrogen is extracted locally from the air.
- The capital cost of the pressurized hydrogen storage tank is 900 €/kg H2.
- The cost of maintenance of both the electrolyzers and the ammonia unit is assumed to
be 2.5 % per year of the original capital cost.
- Both the selling and buying price of electricity are 0.08 €/kWh, unless stated otherwise.
In order to study the economic feasibility, the number of years needed to reach a break-even
point was calculated for several sub-scenarios. The break-even point is reached when the
cumulative income becomes equal with the cumulative costs and the business starts to make
profit.
Figures 34 shows two schematic examples of the methodology to calculate the number of
operational years needed for a power-to-ammonia plant to reach a break-even point. The
weather profile is in both cases from 2014. In Figure 34 a) the financial balance of a 1.5 MW wind
turbine-based ammonia plant installed with hydrogen storage at Hoek van Holland is presented.
The line presenting the cumulative income in this scenario never intersects the line of the total
cumulative costs, clearly indicating that it is not feasible to initiate a business with these
parameters. Figure 34 b) presents a similar scenario with a 1.5 MW wind turbine-base ammonia
plant at Hoek van Holland in 2014, but in this case without a hydrogen storage infrastructure.
The continuity of the hydrogen input is achieved with the purchase of electricity from the grid in
order to keep the ammonia plant running at a minimum rate. It can be seen that a business with
Page 74
64
the aforementioned technical parameters would need around 30 years to the point at which the
total cost and the total revenue are equal.
0 20 40 60 80 100
0
5
10
15
20
25
30
35
40
45
50
55
mill
ion
s €
Time (years)
Cumulative costs
Cumulative income
a b
Figure 34. The variation of the cumulative costs and income as a function on years in case of a
1.5 MW wind turbine-based ammonia plant at the location of Hoek van Holland in 2014. The size
of the electrolyzer is 1.4 MW. a) The continuous hydrogen supply is achieved with the help of a
hydrogen storage tank buffer; b) The continuous hydrogen supply is achieved by purchasing
electricity from the grid, no hydrogen storage is installed.
The capital cost of the hydrogen storage has a significant financial impact. In order to minimize
this effect, the minimum size of the hydrogen storage tank needed was calculated based on the
profile of the amount of hydrogen stored for a period of one year in 2014 (Figure 35). The stored
amount of hydrogen is obtained from the difference between the amount of hydrogen produced
and consumed. The minimum storage tank size should be able to accommodate the maximum
amount of excess hydrogen present at any time, which is around 7000 kg hydrogen as per Figure
35. When the hydrogen level in the storage reaches zero, the continuous ammonia production
might have to be stopped. This situation should be avoided, because any restart of the ammonia
synthesis unit increases the operational expenses and decreases the lifetime of the used
catalysts.
0 20 40 60 80 100
0
5
10
15
20
25
30
35
40
45
50
55
60
mill
ion
s €
Time (years)
Cumulative costs
Cumulative income
Page 75
65
Figure 36 presents the variation of the minimum needed storage tank size as a function of the
electrolyzer sizes. The minimum storage tank size changes almost linearly with the installed
electrolyzer power.
The sub-scenario with hydrogen storage generally produces less ammonia than the one with
purchased electricity (Figure 37).
0 2000 4000 6000 8000 10000
0
1000
2000
3000
4000
5000
6000
7000
8000
Hyd
rog
en
sto
red
(kg
)
Hour of the year
Figure 35. The variation of the amount of hydrogen stored in case of a 1.5 MW wind turbine-
based ammonia plant at the location of Hoek van Holland in 2014. At the beginning of the year
the storage contains 150 kg hydrogen. The size of the electrolyzer is 1.4 MW.
Page 76
66
0 200 400 600 800 1000 1200 1400 1600
0
1000
2000
3000
4000
5000
6000
7000
8000
H2 s
tora
ge
siz
e (
kg
)
Electrolyzer power (kW)
Figure 36. The variation of the minimum hydrogen storage size, that is needed to store the
maximum amount of excess hydrogen present at any time, as a function of the installed
electrolyzer power in case of a 1.5 MW wind turbine-based ammonia plant at the location of
Hoek van Holland in 2014.
0 500 1000 1500
0
200
400
600
800
1000
1200
1400
1600
Am
mo
nia
pro
du
ctio
n (
ton
ne
/ye
ar)
Electrolyzer power (kW)
with H2 storage
without H2 storage, purchased electricity
Figure 37. Annual ammonia production in case of a 1.5 MW wind turbine-based ammonia plant
at Hoek van Holland in 2014 as a function of the installed electrolyzer power.
Page 77
67
Figure 38 summarizes the number of operational years needed to reach a break-even point at
various locations in the Netherlands for a 1.5 MW wind turbine-based ammonia plant. For each
point on the curves, the method presented on Figure 35 was used to calculate the number of
years needed to reach a break-even point. The maximum calculated time period is 100 years,
therefore, if the business needs more than 100 years to reach a break-even point or if a break-
even point is never achieved, the curve stays flat over 100 years.
Figure 38 a) shows that a power-to-ammonia plant at less windy locations, like Eelde or
Eindhoven, would need more than 100 years to equal the total cost and the total revenue. For
both locations the lines stay flat at 100 years. It is not economically feasible to initiate a power-
to ammonia plant within the specified boundaries. Even the significantly windier Hoek van
Holland would need at least 22 years for a break-even point with a minimum electrolyzer size,
but when the electrolyzer power increases, the break-even time increases logarithmically. The
increasing nature of the windy Hoek van Holland curve suggests that economically it is more
advantageous to simply sell the produced electricity, instead of investing in a power-to-ammonia
plant. However, that would not offer any benefits for a scenario where excess renewable
electricity has to be stored.
0 500 1000 1500
0
10
20
30
40
50
60
70
80
90
100
110
Bre
ak-e
ve
n tim
e (
year)
Electrolyzer power (kW)
Hoek van Holland
Eelde
Eindhoven
a b
Figure 38. The number of years needed to reach a break-even point in case of a 1.5 MW wind
turbine-based ammonia plant at various locations in 2014. a) The continuous hydrogen supply
is achieved with the help of a hydrogen storage tank buffer; b) The continuous hydrogen supply
is achieved by purchasing electricity from the grid, no hydrogen storage is installed.
0 500 1000 1500
0
10
20
30
40
50
60
70
80
90
100
110
Bre
ak-e
ve
n tim
e (
ye
ar)
Electrolyzer power (kW)
Hoek van Holland
Eelde
Eindhoven
Page 78
68
In the case of the sub-scenario where no hydrogen storage is installed and some electricity is
purchased to run the ammonia plant continuously (Figure 38 b)), all three locations reach a break-
even point after around 30 years at the largest electrolyzer power. The lifetime of the electrolyzer
and possibly other components is not likely to be so high, so practically, this sub-scenario is also
not economically feasible.
6.1.1. The effect of the electricity price
In order to increase our understanding of the relationship between the electricity price and
the time needed to reach a break-even point, the economic calculations for the local scenarios
were performed with various electricity prices. The main assumption of this local scenario is that
the selling and buying price of electricity are equal, an assumption that might not be valid in the
real world, but it is applied here in order to simplify the calculations. While within the sub-
scenario of the hydrogen storage buffer, electricity is only sold at lower electrolyzer powers and
never bought, within the sub-scenario without hydrogen storage, electricity is both bought and
sold in function of the weather profile. In both cases electricity is never sold when the installed
electrolyzer power is equal with the nominal power of the wind turbine. There all the electricity
produced by the wind turbine is consumed by the electrolyzer. The effect of the electricity price
on the years needed to reach break-even point is depicted on Figure 39.
Page 79
69
0 500 1000 15000
10
20
30
40
50
60
70
80
90
100
110
8 cent/kWh6 cent/kWh
Bre
ak-e
ve
n tim
e (
year)
Electrolyzer power (kW)
4 cent/kWh
a b
Figure 39. The effect of the electricity price on the number of years needed to reach a break-even
point in case of a 1.5 MW wind turbine-based ammonia plant at Hoek van Holland in 2014. It is
assumed that the selling and buying price of electricity are the same. a) The continuous hydrogen
supply is achieved with the help of a hydrogen storage tank buffer; b) The continuous hydrogen
supply is achieved by purchasing electricity from the grid, no hydrogen storage is installed.
The sub-scenario with hydrogen storage it becomes less feasible with a decreasing electricity
price (Figure 39 a)).
The sub-scenario without hydrogen storage is also negatively influenced by lower electricity
prices. It becomes more advantageous to buy electricity, therefore the income can be maximized
only at a higher electrolyzer power (Figure 39 b)).
6.1.2. Larger scale local power-to-ammonia
The influence of the size of the power-to-ammonia plant on the economic feasibility was
studied by increasing the nominal wind turbine capacity and the production rate of the ammonia
plant. The number of years needed to reach a break-even point was calculated for a small wind
park with a nominal power of 15 MW. The same assumptions were applied for the calculations
as they were presented at the beginning of chapter 6.1.
0 500 1000 15000
10
20
30
40
50
60
70
80
8 cent/kWh
6 cent/kWh
4 cent/kWh
Bre
ak-e
ve
n tim
e (
ye
ar)
Electrolyzer power (kW)
Page 80
70
Figure 40 summarizes the results. Generally it can be noted, that the increase in the nominal
power can significantly help the economic viability of a power-to-ammonia plant. In case of the
hydrogen-buffer sub-scenario (Figure 39 a)) even at less windy locations the time needed for a
break-even point is entering in the sub-100 year domain at lower electrolyzer powers. The
increase of the electrolyzer power causes a logarithmic increase of the break-even time at all
locations (Figure 40 a)).
0 3000 6000 9000 12000 15000
0
20
40
60
80
100
Bre
ak-e
ve
n tim
e (
year)
Electrolyzer power (kW)
Hoek van Holland
Eelde
Eindhoven
a b
Figure 40. The number of years needed to reach a break-even point in case of a 15 MW wind
turbine-based ammonia plant at various locations in 2014. a) The continuous hydrogen supply is
achieved with the help of a hydrogen storage tank buffer; b) The continuous hydrogen supply is
achieved by purchasing electricity from the grid, no hydrogen storage is installed.
For the sub-scenario without hydrogen storage (Figure 40 b)), an interesting contrast between
windier and less windy locations can be noticed. The results suggest that at Hoek van Holland, a
windier region, it is economically more advantageous to sell the produced electricity and avoid
the investment in the power-to-ammonia infrastructure. There, the higher the electrolyzer
power (and concomitantly the ammonia production unit), the higher the break-even time
becomes. Still, if balancing the electrical grid and energy storage are the main priority, an
investment in a power-to-ammonia plant could pay off within 10 years. At Eelde and Eindhoven,
it is more advantageous to invest in higher electrolyzer powers and focus on ammonia
production.
0 3000 6000 9000 12000 15000
0
5
10
15
20
25
30
Bre
ak-e
ve
n tim
e (
ye
ar)
Electrolyzer power (kW)
Hoek van Holland
Eelde
Eindhoven
Page 81
71
At the highest electrolyzer power, where no electricity is sold to the grid, all locations would
require roughly the same number of years for a break-even point to be reached.
6.2. Economic feasibility of the national scenario
The calculations for the national scenario were performed within the boundaries of Scenario
3 presented in chapter 5.4. It is assumed, that a very large scale power-to-ammonia infrastructure
is installed with one single reason, namely, the balancing of the national electrical grid. Electricity
is never bought; it is just taken away from the grid to avoid any wind turbine shutdown or a
catastrophic system failure that could lead to a nation-wide blackout. The only source of income
in this scenario is the sold ammonia. However, the capital cost of the wind turbine infrastructure
was not taken in account; it is assumed that they are already installed and are part of the system.
Any financial effect on the business case of the wind turbine operators is not taken in account
here.
Similarly to the local scenario, the ammonia production has to be continuous. At a large scale
national level, the continuity of the ammonia synthesis can be solved only with a suitable
hydrogen storage buffer.
Additionally, the following assumptions on the main economical parameters were made:
- An average factory selling price of 400 €/tone is assumed for the produced ammonia.
- The capital cost of the electrolyzer and ammonia plant is estimated using the same linear
equations showed in chapter 6.1. The price contains the capital cost of all the needed
compressors and the nitrogen producing unit. Nitrogen is extracted locally from the air.
- The capital cost of hydrogen storage is 30 €/kg H2. It is assumed that an underground
storage, a large cavern or area of porous rock with an impermeable caprock above it, is
available.
- The cost of maintenance of both the electrolyzers and the ammonia unit is assumed to
be 2.5% per year of the original capital cost.
Page 82
72
Excess energy periods are not frequent enough in large scale scenario A and B to provide enough
electricity for a successful business case. Nevertheless, for large scale scenario B with 15000 MW
wind and 1500 MW solar capacity an optimal electrolyzer size can be defined (Figure 41). At an
electrolyzer power of around 300 MW it would take around 30 years to reach a break-even point.
0 1000 2000 3000 4000 50000
20
40
60
80
100
120
Bre
ak e
ve
n tim
e (
ye
ar)
Electrolyzer power (MW)
Figure 41. The number of years needed to reach a break-even point for large scale scenario B
(15000 MW wind and 1500 MW solar installed capacity for 2013).
Page 83
73
0 2000 4000 6000 8000
0
200
400
600
800
1000
Hyd
rog
en
sto
red
(to
nn
es)
Hour of the year (h)
Figure 42. The variation of the amount of hydrogen stored in large scale scenario B with the
weather pattern of 2013 as a function of time. At the beginning of the year the storage contains
no hydrogen. The size of the electrolyzer is 300 MW.
But even at an optimal 300 MW electrolyzer power, the hydrogen storage can be nearly depleted
several times per year (Figure 42), suggesting that the ammonia synthesis process may have to
be stopped several times per year.
When the installed renewable nominal capacity is further increased, the economics of a national
scale power-to-ammonia plant becomes more feasible. Figure 43 shows the break-even time for
large scale scenario C and D. Both scenarios show an optimal plant size at lower electrolyzer
power of 1000-2000 MW. At a very low electrolyzer power the amount of produced ammonia is
minimal. By increasing the size of the electrolyzer and the ammonia synthesis unit, the amount
of ammonia produced is also increasing, however, the increased capital cost of the infrastructure
has a more significant impact on the business case.
Page 84
74
0 3000 6000 9000 120000
2
4
6
8
10
12
14
16
Large scale scenario D
Bre
ak e
ve
n tim
e (
ye
ar)
Electrolyzer power (MW)
Large scale scenario C
Figure 43. The number of years needed to reach a break-even point for large scale scenarios C
and D (weather pattern of 2013).
7. Economical evaluation of power failures
This chapter analyses the possible economic consequences and the involved costs of a
blackout. Operators in the electricity market in the Netherlands are regulated by a system of
yardstick competition [86, 87]. This system was created as a substitute for genuine market
incentives. Since 1976, network operators are registering power failures in their networks. The
gathered information is usually used to make changes in the infrastructure of the grid.
Table 15 presents the reliability of the electrical network in the Netherlands in 2014 and the
average of the preceding five years. The data is based on the individual power failure registration
of the operators including the low, middle and high voltage networks [88].
Page 85
75
Table 15. Quality indicator of the reliability of the electrical network in the Netherlands [88].
Quality indicator 2014 Average 2008-2013
Power failures 17757 19384
Affected clients per failure 125 135
Average duration of the failure (min) 72.5 80.4
Annual failure duration (min/year) 20 26.7
Frequency of power failure per year 0.276 0.332
7.1. Blackouts and social costs
The policy chief of Europe’s electricity industry association was interviewed by EurActiv and
revealed that Europe will have to slow down integration of renewable energies or risk power
failures and system instability. “Either you go very fast in the transition – which is impossible
because smart grids are expensive and the storage is not there in the needed scope – or you
diminish the speed for integrating renewables into the system.” A report was cited in the
interview claiming the rise of serious system stability incidents in period of 2011 - 2012 from 300
to 1000 across the northern Europe. [89]
Social costs resulting from the power failure that are affecting companies and households are
expressed in terms of monetary costs. This involves losses during production and waste of time.
Estimated daily production losses for the companies as a result of by power failures ranges up to
120 million euros/hour [90, 91]. Even though most of the electricity is used in industry, the
biggest social cost can be found in the service sector where during the day lots of added value is
generated in a short period of time. The value of working hours in the service sector is 69 million
euros, whereas for industry is only 10 million euros. The estimated costs of the lost time due to
power failure in households in the evening period, ranges up to 85,5 million euros [91].
Page 86
76
Table 16. Total, region specified, social costs per hour caused by power failure in millions euro,
[91].
Area During the
day Evening
Sunday during
the day
Randstad 72,2 38,3 33,1
Amsterdam with
surroundings 16,7 6,8 6,4
Rijnmond with
surroundings 13,4 8,1 6,9
Agglomeration –s –
Gravenhage 8,7 4,3 4,0
Other regions 83,8 59,3 5,5
Utrecht 13,7 6,5 48,1
Southeast-North- Brabant 6,7 4,4 3,0
Total Netherlands 156,1 97,5 81,2
From the social costs analysis that was conducted in the Netherlands, it can be seen that the
highest costs are generated in larger cities (Table 16). The total cost for the Randstad region
caused by a blackout during the day is estimated to be around 72 million euros per hour. The
total value of one hour of undelivered electricity is 1,6 million euros and as such presents an
enormous difference between social costs and unused electricity [92].
7.2. The compensation payment
Consumers and companies (with a few exceptions) are entitled to compensation if they have
been affected by a power outage that lasted longer than four hours. The compensation increases
gradually as the interruption lasts longer. Consumers are entitled to a statutory compensation
payment as well if the damage was caused by intent or gross negligence of electricity supplier
[93].
Page 87
77
The “Compensation” is established as one of the measures to ensure the quality of the electricity
networks. The scheme (Table 17) is intended as a financial incentive for network operators to
invest in higher reliability, faster recovery times and troubleshooting. Values of compensation
payment for low (LV), medium (MV), intermedium (IV) and high (HV) voltage connections are
shown in the table 17.
Although in chapter 6 it can be seen that power-to-ammonia is not always economically feasible,
it may be in the interest of society and the network operators to invest in such a system in order
to avoid power outages due to renewable overproduction.
Table 17. Compensation scheme for consumers and businesses connected to low, medium,
intermedium and high voltage network after a power failure [93].
Market Failure in Duration/
hours Compensation
From next 4
extra hours
Consumers
LV-connection
≤ 3x25A
HV-network
MV-network
LV-network
4 - 8 € 35,00 € 20,00
Small businesses
LV-connection
> 3x25A
HV-network
MV-network
LV-network
1 - 8
2 - 8
4 - 8
€ 195,00
€ 195,00
€ 195,00
€ 100,00
€ 100,00
€ 100,00
Large businesses
MV-connection
HV-network
MV-network
1 - 8
2 - 8
€ 910,00
€ 910,00
€ 500,00
€ 500,00
Large businesses
IV/HV-connection HV-network 1 - 8 € 0,35 / kWgec
€ 0,20 /
kWgec
Page 88
78
8. Legal and social issues of power-to-ammonia
8.1. An overview of license obligations and environmental rules for wind
turbines
In order to construct a wind turbine (park), the initiator must deal with a variety of laws and
regulations. Depending on the wind turbine(s) size and local conditions, there are different
license obligations, rules for the protection of the environment and local living conditions, and
investigation duties which must be performed.
8.1.1. Environmental permits and exemptions
Regarding the spatial impact of a wind turbine (park), the wind turbine(s) must fit within the
land use plan of the municipality in which the initiator intends to start building. Before that, the
initiator shall submit an Environmental Permit for building (the former Building Permit) within
the meaning of the Environmental Law (General Provisions) Act (Wet algemene bepalingen
omgevingsrecht: Wabo) [94]. Depending on the provincial vision for wind power, the realization
of solitary wind turbines may be prohibited by the province.
For the establishment and operation of a wind turbine (park), an environmental impact
assessment must be performed (Milieu Effect Rapportage (MER)) which accounts for all positive
and negative consequences for the environment and the local living conditions. This obligation
applies at a wind farm that consists of at least three turbines and a joint capacity of 15 MW or
more, or at a wind farm that consists of ten wind turbines or more. Starting from three wind
turbines, limited to an output of 15 MW, the competent authority has a 'duty': the competent
authority must make certain that within the local situation no MER-rating is required [95]. If the
competent authority – or the initiator itself – decides that a MER must be prepared, the initiator
shall submit an Environmental Permit for the establishment and operation of a device (the former
Environmental Permit) [96]. These environmental permits are also referred to as an ‘All-in-one
Permit for Physical Aspects’, which means that this permit comprises several individual
environmental permits.
Page 89
79
Instead of an Environmental Permit for establishment and operation, an All-in-one Permit for
Physical Aspects limited environmental impact assessment (Omgevingsvergunning Beperkte
Milieutoets (OBM)) may in cases be sufficient [97]. This OBM allows the competent authority to
omit the need for the preparation of a MER and consists only of a permission or a refusal. If the
competent authority judges that an MER must be prepared, the initiator shall submit a license
for the creation of a plan. In other cases, in principle no further environmental permit is required.
8.1.2. Other permits and exemptions
In addition to the Environmental Permit, an exemption or a license may be required on the
basis of the Flora and Fauna Act (Flora- en faunawet: Ffw) and the Nature Conservation Law
(Natuurbeschermingswet: Nbw). Because the – intentional or unintentional – killing, injuring and
troubling of protected species under the Ffw is prohibited, it is important prior to the realization
of a wind farm to take into account the potential impacts on these species. An exemption on the
basis of the Ffw shall be granted only if it is determined that there is no negative effect on the
favorable conservation status of species [98]. Also for protected areas, such as Natura 2000 sites,
the ecological area (Ecologische Hoofdstructuur: EHS) has to be examined in advance if the
realization of a wind turbine (park) is deemed harmful to the protected nature. In that case a
license is required [99].
Additional licenses are required on the basis of the land use plan or municipal or provincial
regulation, such as demolition and/or logging permits. Having regard to the fact that a wind
turbine (park) in most cases will need to be connected to the public electricity grid, it is also
required to obtain a license for the building of the electricity cable. These permits and
exemptions can be included in the application for an Environmental Permit (All-in-one Permit for
Physical Aspects). As regards to the exemption on the basis of the Flora and Fauna Act and the
license on the basis of the Nature Conservation Act, a declaration of no reservations must be
asked of the competent authority.
On the basis of a special law, a permit or exemption may be needed, for example on the basis of
the Ontgrondingenwet, the Soil Protection Act (Wet bodembescherming), the Water Act
Page 90
80
(Waterwet) and the Public Works Act (Wet beheer rijkswaterstaatwerken). The application for
permits and exemptions on the basis of these laws are to be submitted separately.
8.1.3. Competent authority
In principle, the college of Mayor and Aldermen of the commune decides on the application’s
approval [100]. Nevertheless, the Executive Council of the Province has to apply the provincial
coordination scheme in the realization of wind turbines with an installed capacity between 5 and
100 MW [101]. Instead of the college of Mayor and aldermen, the Executive Council has exclusive
jurisdiction to grant all licenses, exemptions and statements of no concerns may be required
[102]. From an installed capacity of 100 MW or more, wind energy projects also fall under
National Coordination Regulation (Rijkscoördinatieregeling). In practice, an initiator of a wind
turbine (park) with an installed capacity between 5 and 100 MW goes first to the appropriate
municipality.
8.1.4. General rules that apply to all wind turbines
Since the building and operation of one or more wind turbines affects the local living
conditions, a set of general rules has been established relating to security and maintenance,
noise, shading and light glare (“flicker”) and external security. These conditions are set out since
1 January 2011 in the Activities Decree (Activiteitenbesluit milieubeheer) and the associated
Regulation (Activiteitenregeling)) and they apply also if a wind farm requires an All-in-one Permit
for Physical Aspects limited environmental impact assessment [103].
The maximum noise emissions of a wind turbine for example, amounts to a maximum of 47 dB
Lday as weighted annual average and a maximum of 41 dB Lnight for the night [104]. These emission
standards must be fulfilled on the facade of noise-sensitive buildings (for example, nearby
homes) or on the border of sensitive areas. To reduce flicker, a wind turbine that is within a
certain distance of sensitive objects (such as nearby schools or homes) must be fitted with an
automatic stop facility. If an average of more than seventeen days a year for more than twenty
minutes per day flicker occurs on facades where windows are, the wind turbine should shut down
Page 91
81
automatically [105]. In the framework of external security – this includes, for example, the
breakdown of the blades of a wind turbine – it is desirable to have a minimum distance between
so-called (limited) vulnerable objects and wind turbines. That is why in this Activities Decree rules
are also formulated for the so-called localized risk: the chance each year that a person who would
reside in that place on a continuous basis unprotected dies as a direct result of an unusual
occurrence within that establishment [106].
In addition, wind turbines can disturb civil and military aviation radar systems. That is why within
75 kilometers (measured from the top of the radar antenna) of radar disruption areas, a
maximum height is formulated to the tip of the blades. That maximum height varies by radar
monitoring of the area and is set between 89 and 136 meters [107].
In order to enable the competent authority to verify that all the rules are met, the initiator has a
duty to inform the competent authority at least four weeks before the construction of the wind
turbine [108].
As wind energy is combined with the production of ammonia, next to the permit for wind
turbines, the consequences of the production and storage of ammonia on the local living
conditions also have to be taken into consideration. The wind energy-ammonia complex must fit
within the zoning plan of the involved municipality.
Without prejudice to the outcome of further investigation, the establishment of a wind energy-
ammonia complex is most easily established in existing industrial areas where there is experience
with both chemical activity and wind energy, as in the Rijnmond in Rotterdam [109].
8.2. License obligations of a renewable ammonia plant
Obtaining the construction permit for building an ammonia plant could run into some
difficulties. When referring to the ammonia production of more than 50 tons/day and the
installation of large volume storage tanks, one would need to go through the same permitting
obstacles as for the large industry plants [110, 111]. Moreover, most of the time the same
restrictions as for renewable energy are applied – it’s placing is forbidden in touristic and natural
areas and in many municipalities ammonia storage tanks are not allowed within the city limits.
Page 92
82
An additional requirement is to gain permission for the grid connection. To define the grid
connection concept, Tennet examines based on the request whether the grid conditions at the
existing location or planned grid connection point are able to be connected to a plant without
any problems on the already existing grid.
In order to investigate the request for the new connection point, Tennet will gather the necessary
information from the connectee (form in Appendix A) [112].
Moreover, regarding the connection to the low and mid-level grid, permitting concerns for the
ammonia and storage should not present a problem.
8.3. Social acceptance of power-to-ammonia
Public acceptance of ammonia, which has been discussed only in a few studies, has shown
that even though in a properly running plant no or minimal leakages should occur, it is likely that
communities will be against nearby ammonia plants [62]. This kind of public reaction could be
caused by the associations of various issues to ammonia (unpleasant odor, accidents, perceived
low safety when handling ammonia).
Two social psychological models predict citizens’ intention to act in favor of against a new
technology from psychological variables: (i) the Norm Activation Model, which assumes that
people act based on moral considerations, and (ii) the Theory of Planned Behavior which assumes
that people act out of self-interest [113]. No literature was found that applied these models on
a power-to-ammonia-complex, but the main conclusions of this study on new energy systems
could be also applied here.
Analyses on data collected from a group of Dutch participants who received information about
hydrogen as a fuel, hydrogen technology, and the opinion of stakeholders, suggests that
intention to act both in favor of against the new energy technology was more strongly based on
moral considerations than on self-interest [113]. If the theory of planned behavior variables were
added to a model that included norm activation model variables, the explained variance
increased for the supporters group, whereas this was not the case for the opponents group.
These results indicate that for supporters of hydrogen refueling facilities, self-interest is a
Page 93
83
secondary goal after moral considerations but that this is not the case for opponents. The
strongest determinants of intention to act in the supporter group are personal norm, positive
affect and perceived effect of the technology. In the opponents group, these are personal norm,
negative affect, trust in industry, the perceived effects of the technology and distributive fairness.
A number of policy recommendations could be implemented in the case of a power-to-ammonia
complex as well. Policy makers should design policies based on moral considerations in citizens'
behavioral intentions. This may strengthen and improve the moral benefits of the technology and
the way it is implemented. This can be done by making the technology more beneficial for society
and the environment, making the technology very safe for citizens, and by distributing the costs,
risks and benefits as fairly as possible. Sufficient information may help to create the missing link
between problem perception on the one hand and the evaluation of the technology and behavior
towards the technology on the other. Studies about the acceptance of hydrogen fuel-stations
suggest that resistance is particularly fueled by perceived unfairness with respect to distribution
of costs, risks and benefits and low levels of trust in industry. A dialogue with the public starting
in the early phases of planning may help to avoid the perception of unfair decisions and may
create greater trust within the community [113].
Page 94
84
9. Stakeholder analysis of power-to-ammonia
As energy systems evolve to meet climate targets, there will likely be many new stakeholders
involved in the operation and maintenance of the electric grid. The power-to-ammonia concept
has the technical maturity to play a leading role as a balancing agent and additionally provide a
flexible bridge between the energy world and the chemical industry. In order to further
understand the position and implementation of power-to-ammonia within the energy system, a
brief overview of the identified stakeholders is presented here (Figure 43). A detailed description
of the characteristics of these stakeholders and their interactions with each other and with
power-to-ammonia is not part of this study, but rather would be a topic of a follow-up project.
However, to gain an idea of what role power-to-ammonia could potentially play in future energy
systems, the following future energy system scenario is presented.
The main stakeholders identified in the power-to-ammonia concept are:
Roles Responsibilities
Active demand
and supply (e.g.
Power-to-
ammonia)
• Own assets which can provide ‘balance’ to the grid • ‘Balance’ can be provided in the form of active energy demand and/or
supply • Acts as a bridge between the energy consumer and the transmission /
distribution system operator, providing a higher quality energy service
Energy / NH3
consumer
• Consumes energy / NH3, e.g. producing fertilizer • Negotiate and sign contract with energy suppliers.
Aggregator • Aggregates flexibility from multiple parties (e.g. power-to-ammonia) and offers it to the program responsible party via a trade platform
• Based on the trades executed they control the energy production / consumption of e.g. power-to-ammonia facilities
• Offers trading platforms for trade on energy markets. • Offer a minimum guaranteed price to their customers in case their assets
are deployed
Energy supplier • Supplies and buys energy / NH3 to and from the consumer and the aggregator (direct supply purchase agreements)
Page 95
85
• Actively trades with e.g. power-to-ammonia via the aggregators platform and via markets such as APX
• All the trades executed on the APX market and on the trade platform operated by the aggregator have to be settled via the energy supplier
Balance
responsible
party (BRP)
• Active on the energy balancing market • Provides balancing services to the transmission system operator • Purchases flexibility via aggregators • Creates ‘energy programs’, utilizing active demand & supply, in order to
create a stable energy supply • Setup and operate energy program management
Transmission
system operator
(TSO)
• Sets up and operates high voltage transmission system lines • Provides transportation services (approx 40.000 to 60.000 euros/MW
grid capacity) grid capacity • Sets up and operates balancing markets • Verifies ‘energy programs’ • Requests changes in ‘energy programs’ if necessary
Distribution
system operator
• Setup and operate distribution system lines for gas and electricity • Receive energy consumption programs from BRPs and forecast any
possible congestions • Circumvent congestions by utilizing active demand / supply • Connect consumers and producers to their network • Collect metering data and make it available to the relevant energy
retailers and the system operator
Producer • Produces energy, e.g. wind farm • May be curtailed / dispatched by the TSO or the BRP
Government • Creates and enforces the regulatory framework • Provides oversight on environmental / social acceptance of industries • Provides project permits • May provide subsidies for important energy services
Nearby
inhabitants
• Provide approval for the implementation of industries • Bear the risk of technological failures • May be remunerated relative to their proximity to new projects
Page 96
86
The potential future relationship between the different stakeholders is shown in figure 44 below.
As shown, a power-to-ammonia facility would likely play the role of ‘active demand and supply’.
The power-to-ammonia facility would be directly connected to the distribution grid or
transmission grid in order to consume excess electricity and also potentially consume ammonia
to produce electricity during peak demand times. The power-to-ammonia plant would likely be
controlled by an ‘aggregator’ – a third party which aggregates the flexibility provided by many
different parties, and sells that flexibility as required, based on a merit order. In this way, the
flexibility and balancing potential of a power-to-ammonia facility can be utilized by the ‘balance
responsible party’ in order to provide stability to the grid. Any ammonia or energy produced by
the power-to-ammonia facility would be sold to consumers via a supplier.
Page 97
87
Figure 44. Future stakeholder interaction model.
All the above stakeholders would be at least tangentially active in a power-to-ammonia value
chain. For successful power-to-ammonia initiatives, it is necessary that these stakeholders
interact, negotiate, exchange resources and align visions. There are many operational, financial,
safety, legal and administrative limitations that can block the success of a power-to-ammonia
project. While stakeholders may focus on maximizing their own financial gains, we can see that
all stakeholders must work closely together in order to provide a stable energy supply. A well
Aggregator
Active demand &
supply (e.g. power-
to-ammonia)
Distribution
grid
Producer
Balance
responsible
party
Supplier
Consumer
Demand
response
Energy /
NH3 supply
Energy / NH3
consumption
response
Energy
distribution
Energy
transport
Supply
flexibility
Provide energy
Power
dispatch
Energy
transport Transmission
grid
Supply
flexibility
Nearby
inhabitants
Approval /
remuneration
Government
Oversight /
regulation
Page 98
88
formulated policy could enable many stakeholders to cope with future electricity grid problems
by supporting the development of active energy demand and supply technologies, such as
power-to-ammonia facilities.
Page 99
89
10. Conclusions
The storage of the excess renewable electricity will become a necessity as renewable energy
production increases in order to stabilize the electrical grid against unpredictable production
peaks. Power-to-ammonia is a prominent alternative to store excess production in a chemical
form and decrease the carbon emissions of both the energy sector and the chemical industry.
This study showed that ammonia production with renewable power is technically feasible with
current technologies. Hydrogen production through water electrolysis, nitrogen separation and
ammonia synthesis are all technically feasible and proven technologies. The ammonia synthesis
step is a high pressure and temperature catalytic process and requires a continuous reagent flow.
The highly intermittent nature of the renewable electricity sources does not allow a continuous
flow of hydrogen. Therefore, two main methods were identified for the local scenario to achieve
a steady hydrogen flow and minimize the number of reaction interruptions : i) the adaption of a
hydrogen storage tank that acts as a buffer and ii) electricity import from the grid during periods
with no renewable electricity generation.
The elimination of the costly hydrogen storage tank from the plant design and the adaption of a
strategy wherein electricity is purchased to run the process at the lowest possible production
rate during periods with no renewable energy production, offers an economical advantage for
local scenarios. Additionally, the transport and storage costs of ammonia are significantly lower
than that for hydrogen. The storage cost of hydrogen is significantly higher when it is stored for
a longer period.
At windier locations it is economically more advantageous to sell directly the produced
electricity. However, that would not offer any benefits for a scenario where excess renewable
electricity has to be stored. In moderately windy areas, on the other hand, it is more
advantageous to invest in higher electrolyzer power and focus on ammonia production.
At a local level, calculations based on the historical KNMI weather pattern data and various
economic assumptions showed that a power-to-ammonia plant at a minimal scale of tens of MW
Page 100
90
nominal power is necessary. The minimum nominal power for economic feasibility is location
specific.
The frequency of the excess renewable electricity production determines the economic feasibility
of power-to-ammonia on a large national-scale. It was found that power-to-ammonia at very
large scale could offer a successful business case when the nominal power of the installed
renewable (wind and solar) energy sources would reach around 20.000 MW on a national level.
A power-to-ammonia complex must fit within the zoning plan of the involved municipality. A
power-to-ammonia plant is most easily established in existing industrial areas where there is
experience with both chemical activity and wind energy.
To increase the social acceptance of power-to-ammonia, the benefits of the technology and the
way it is implemented have to be taken into account. A dialogue with the public should be started
in the very beginning of the planning process to create trust. The advantages and disadvantages
of power-to-ammonia should be distributed as fairly as possible for a project to gain public
acceptance.
The research conducted in this report has led to some useful results; however it has mostly used
a theoretical approach. Further research on the power-to-ammonia concept with an
experimental and testing approach at a specific location would be beneficial.
Page 101
91
References
[1] E. Commission, "Report from the commission to the european parliament, the council, the
european economic and social committee and the committee of the regions," European
Commission, Brussels, 2015.
[2] Eurostat, "Energy statistics of the European Union," February 2016. [Online]. Available:
http://ec.europa.eu/eurostat/statistics-
explained/index.php/Energy_from_renewable_sources#Database. [Accessed March 2016].
[3] K. Schoots and P. Hammingh, "Nationale Energieverkenning 2015, ECN-O--15-033," Petten, 2015.
[4] T. TSO, "Quality and capacity plan 2006–2012," 26 October 2015. [Online]. Available:
http://www.tennet.org/.
[5] Tennet, "Voor de Zekerheid-Samenvatting Kwaliteits- en Capaciteits- document 2013," Arhnem,
2013.
[6] Tennet, Tennet Holding BV, 2014. [Online]. Available: http://www.tennet.eu/nl/grid-
projects/international-projects/britned.html. [Accessed 26 March 2013].
[7] W. N. Association, "Uranium, Electricity and Climate Change," December 2012. [Online].
Available: http://www.world-nuclear.org/information-library/energy-and-the-
environment/uranium,-electricity-and-climate-change.aspx. [Accessed December 2015].
[8] Enerdata, "Electricity domestic consumption," 2015. [Online]. Available:
https://yearbook.enerdata.net/electricity-domestic-consumption-data-by-region.html.
[Accessed March 2016].
[9] G. o. t. Netherlands, "Climate change," April 2016. [Online]. Available:
https://www.government.nl/topics/climate-change/contents/eu-policy. [Accessed April 2016].
[10] D. A. Kramer, "Mineral Comodity Profiles-Nitrogen," 2004.
[11] G. Kongshaug, "Energy consumption and greenhouse gas emissions in fertilizer production," in
Proceedings of IFA Technical Conference, Marrakech, 1998.
[12] M. J. G. Haas and T. A. v. Dijk, "Inventarisatie klimaatvriendlijke kunstmes," Nutrienten
Management instituut, Wageningen, 2010.
[13] G. Williams and F. Al-Ansari, "Benchmarking of Global Energy Efficiency in Ammonia Production,"
in IFA Energy Efficiency and CO2 reduction prospects in Ammonia Production, Ho Chi Minh, 2007.
[14] ESA, "Frequency regulation," 2016. [Online]. Available: http://energystorage.org/energy-
storage/technology-applications/frequency-regulation. [Accessed April 2016].
Page 102
92
[15] ESA, "Spinning Reserve," 2016. [Online]. Available: http://energystorage.org/energy-
storage/technology-applications/spinning-reserve. [Accessed April 2016].
[16] ESA, "Grid Operation Benefits," April 2016. [Online]. Available: http://energystorage.org/energy-
storage/energy-storage-benefits/benefit-categories/grid-operations-benefits. [Accessed April
2016].
[17] EPRI, "An Assessment of Distribution System Power Quality," EPRI, Palo Alto, 1998.
[18] EPRI, "EPRI-DOE Handbook of Energy Storage for Transmission and Distribution Applications,"
EPRI, Washington, 2003.
[19] P. Technolgy, "The world's most used renewable power sources," January 2014. [Online].
Available: http://www.power-technology.com/features/featurethe-worlds-most-used-
renewable-power-sources-4160168/. [Accessed April 2016].
[20] W. N. Association, "Renewable Energy and Electricity," April 2016. [Online]. Available:
http://www.world-nuclear.org/information-library/energy-and-the-environment/renewable-
energy-and-electricity.aspx. [Accessed April 2016].
[21] EPRI, "Handbook Supplement of Energy Storage for Grid Connected Wind Generation
Applications," EPRI, Palo Alto, 2004.
[22] C. McGowin and W. Steeley, "Wind power integration: energy storage for firming and shaping,"
Electric Power Research Institute, Inc., 2005.
[23] H. M. Henning and A. Palzer, "The role of power-to-gas in achieving Germany's climate policy
targets with a special focus on concepts for road based mobility," Fraunhofer ISE, Stuttgart,
2013.
[24] Mariyappan, "Cost and Technical Opportunities for Electricity Storage Technologies," Project
GreenNet, 2004.
[25] A. Andrijanovitš, M. Egorov, M. Lehtla and D. Vinnikov, "A hydrogen technology as buffer for
stabilization of wind power generation," in 8th International Symposium ‘Topical Problems in the
Field of Electrical and Power Engineering, Tallin, Estonia, 2010.
[26] M. Gotz, J. Lefebvre, F. Mors, A. M. Koch, F. Graf, S. Bajohr, R. Reimert and T. Kolb, "Renewable
Power-to-Gas: A technological and economic review," Renewable Energy, vol. 85, pp. 1371-1390,
2016.
[27] J. Tonen, "Renewable Hydrogen via water electrolysis," Stichting Energy Valley Groningen,
Groningen, 2015.
[28] E. E. Morgan, "Techno-Economic Feasibility Study of Ammonia Plants Powered by Offshore
Wind," University of Massachusetts, Amherst, 2013.
Page 103
93
[29] G. Beysel, "Enhanced Cyrogenic Air Separation," in Oxyfuel Combustion conference, Cottbus,
2009.
[30] S. s. Amarkhail, "Air separation," SlovakAid, Bratislava, 2010.
[31] S. Ivanova and R. Lewis, "Producing Nitrogen via Pressure Swing Adsorption," American Institute
of Chemical Engineering, 2012.
[32] K. A. Lokhandwala, I. Pinnau, Z. He, K. D. Amo, A. R. DaCosta, J. G. Wijmans and R. W. Baker,
"Membrane separation of nitrogen from natural gas: A case study from membrane synthesis to
commercial deplyment," Journal of membrane sciences, vol. 346, no. 2, pp. 270-279, 2010.
[33] P. W. A. Jess, Chemical Technology, Weinheim: Wiley, 2013.
[34] M. Appl, Ammonia:Principles and Industrial Practice, Weinheim : Wiley-VCH, 1999.
[35] E. F. M. Association, Guidance for inspection of atmospheric, regrigirated ammonia storage
tanks, Brussels: EFMA, 2008.
[36] "Ammoniak:opslag en verlading," Publicatiereeks Gevaarlijke Stoffen 12, versie 1.0, 2014.
[37] O. Nitrogen, 4 November 2015. [Online]. Available:
http://www.ocinitrogen.com/Media%20Library/Ammonia_Fact_Sheet_EN.pdf.
[38] M. Kaviany, Heat Transfer Physics, Content Technologies Inc, 2016.
[39] Elucidare, "New possibilities for Hydrogen storage and Transportation," Print, 2008.
[40] J. R. Bartels, "A Feasibility Study of Implementing an Ammonia Economy," Print, 2008.
[41] KPMG, TNO and ECORYS, "Ketenstudiesammoniak, chloor en LPG," Spinhex-Industrie,
Amsterdam, 2004.
[42] E. F. M. Association, "Guidance for transporting ammonia by rail," EFMA, Brussels, 2007.
[43] E. Commission, "Betuwe line," 2005. [Online]. Available:
http://ec.europa.eu/ten/transport/priority_projects_minisite/PP05EN.pdf. [Accessed April
2016].
[44] R. Walawalkar and J. Apt, "Market analysis of Emerging Electric Energy Storage," 31 July 2008.
[Online]. Available:
http://www.jointventure.org/images/stories/pdf/netl_market.analysis.of.emerging.electric.ener
gy.storage.pdf. [Accessed 5 November 2015].
[45] F. Pierie and C. E. J. v. Someren, "Energy Storage Label," Netbeheer nederland, 2015.
[46] H. Ibrahim, A. Ilinca and J. Perron, "Energy storage systems-Characteristics an dcomparisons,"
Renewable and Sustainable Energy Reviews, vol. 12, pp. 1221-1250, 2008.
Page 104
94
[47] J. Gardener and T. Haynes, "Overview of compressed air energy storage," Boise State University,
2007.
[48] I. E. Agency, "Hydrogen production and storage - R&D priorities and gaps," International Energy
Agency, Paris, 2006.
[49] R. Lang and S. Tao, "Ammonia as a suitable fuel for fuel cells," Frontiers in energy research, 2014.
[50] G. Trowse, J. Ross, D. Groulx and S. Molloy, "At the end of the line:Approaches for adding the
sustainable energy to rural maritme communities," in 4th international conference on ocean
energy, Dublin.
[51] J. R. Bartels, Feasibility study of implementing an ammonia economy, 2008.
[52] C.-J. Winter and J. Nitsch, Hydrogen as an energy carrier:technologies, systems, economy, Verlag
Berlin Heidelberg: Springer, 1988.
[53] B. Leighty, "Energy Storage with Anhydrous Ammonia: Comparison with Other Energy Storage,"
in Ammonia:the key to US Energy Independence , Minneapolis, 2008.
[54] E. Vercruysse, "Ammonia, renewable fuel with zero CO2 emissions," Probatex sc, Bierges, 2011.
[55] L. Grond, P. Shulze and J. Holstein, "System analyses Power to Gas: A technology review," KEMA
Nederland B. V., Groningen, 2013.
[56] J. Eichman, "Hydrogen Energy Storage (EHS) and Power-to-Gas Economic Analysis," in NREL,
Downey, 2015.
[57] P. Menanteau, M.-M. Quemere, A. L. Duigou and S. L. Bastard, "An economic analysis of the
production of hydrogen from wind-generated electricity for use in transport applications,"
Energy Policy Elsevier, vol. 39, no. 5, pp. 2957-2965, 2011.
[58] C. Breyer, Economics of Hybrid Photovoltaic Power Plants, Berlin: PRO Business , 2012.
[59] J. Bärnthaler, H. Bergmann, D. Hornbachner, G. Konrad, V. Kryvoruchko, L. Targyik-Kumer and C.
W. C. Pinter, "Gasversorgung mittels lokaler Biogas-Mikronetze," Berichte aus Energie- und
Umweltforschung, 2009.
[60] D. Nugent and B. K. Sovacool, "Assesing the lifecycle greenhouse gas emissions from solar PV
and wind energy: A critical meta survey," Energy Policy, vol. 65, pp. 229-244, 2014.
[61] D. Weisser, "A guide to life-cycle greenhouse gas (GHG) emissions from electricity supply
technologies," Energy, vol. 32, pp. 1543-1559, 2007.
[62] R. Bañares-Alcántara, G. Dericks, M. Fiaschetti, P. Grünewald, J. M. Lopez, E. Tsang, A. Yang, L. Ye
and S. Zhao, "Analysis of islanded ammonia-based energy storage systems," University of Oxford,
2015.
Page 105
95
[63] R. Mikkelsen, "Ammonia emissions from Agricultural Operations: Fertilizer," Better Crops., vol.
93, pp. 9-11, 2009.
[64] W. Curran and D. D. Lingenfelter, The Agronomy Guide, Pennsylvania: PennState College of
Agricultural Sciences , 2015.
[65] C. Egenhofer and L. Schrefler, "FOR A STUDY ON COMPOSITION AND DRIVERS OF ENERGY
PRICESAND COSTS IN ENERGY INTENSIVE INDUSTRIES: THE CASE OF THE CHEMICAL INDUSTRY -
AMMONIA," Centar for European Policy Studies, Brussels, 2014.
[66] M. Sengupta, Environmental Impacts of Mining - Monitoring, Restoration, and Control, New
York: Lewis Publishers , 1993.
[67] D. Mara, Domestic Wastewater Treatment in Developing Countries, New York: Taylor&Francis,
2003.
[68] ASHRAE, "Ammonia as refrigerant," ASHRAE, Atlanta, 2014.
[69] L. M. Property, "Ammonia Refrigeration," Liberty Mutual, Weston, 2007.
[70] Car, "Carmagazine," October 2015. [Online]. Available: http://www.carmagazine.co.uk/car-
reviews/toyota/toyota-toyota-mirai-2015-hydrogen-fuel-cell-vehicle-review/. [Accessed April
2016].
[71] Guardian, "The future is here:mass-market hydrogen cars take to Britain's roads," November
2015. [Online]. Available: http://www.theguardian.com/environment/2015/nov/04/the-future-
is-here-mass-market-hydrogen-cars-take-to-britains-roads. [Accessed April 2016].
[72] L. Schlapbach and A. Zuttel, "Hydrogen-storage materials for mobile applications," Nature, vol.
114, pp. 353-358, 2001.
[73] D. Cheddie, "Ammonia as a Hydrogen Source for Fuel Cells: A Review," Hydrogen-Energy
Challenges and Perspectives, pp. 333-362, 2012.
[74] A. Karkamkar, C. Aardahl and T. Autrey, "Recent Developments on Hydrogen Release from
Ammonia Borane," Material Matters , vol. 2, 2007.
[75] G. G. M. Fournier, I. W. Cumming and K. Hellgardt, "High performance direct ammonia solid
oxide fuel cell," Journal of Power Sources, vol. 162, pp. 198-206, 2006.
[76] Q. Ma, R. Peng, Y. Lin, J. Gao and G. Meng, "A high-performance ammonia-fueled solid oxide fuel
cell," Journal of Power Sources, vol. 161, pp. 95-98, 2006.
[77] R. Lan and S. Tao, "Ammonia as a suitable fuel for fuel cells," Front. Energy Res. , vol. 2, 2014.
[78] C. Zamfirescu and I. Dincer, "Ammonia as a Green Fuel and Hydrogen Source for Vehicular
Applications," Fuel Processing Technology, pp. 729-737, 2009.
Page 106
96
[79] G. Vezina, "Hydrofuel Inc Update: Spring 2010," 25 04 2013. [Online]. Available: nh3fuel.com.
[80] T. Brown, "The AmVeh – an ammonia fueled car from South Korea," 20 06 2013. [Online].
Available: http://nh3fuelassociation.org/2013/06/20/the-amveh-an-ammonia-fueled-car-from-
south-korea/?fb_source=pubv1.
[81] T. Brown, "Ammonia fueled sports car: Marangoni Toyota GT86 Eco Explorer," 25 04 2013.
[Online]. Available: http://nh3fuelassociation.org/2013/04/25/ammonia-fuel-marangoni-eco-
explorer/.
[82] Y. Woo, "Dual Fueled Internal Combustion Engines in Korea," 24 09 2015. [Online]. Available:
https://nh3fuel.files.wordpress.com/2014/10/nh3fa-2014-youngmin-woo.pdf.
[83] Hydrogen Engine Center, Inc, "HEC ships first hydrogen/ammonia fueled tractor," 2015. [Online].
[84] E. Vercruysse and I. Rug, "A Renewable Fuel with Zero CO2 Emissions," Print, 2011.
[85] M. Boots, "The Dutch electricity value chain," DNV KEMA, Groningen, 2011.
[86] ERGEG, "2011 National Report of Energiekamer to the European Commission," ERGEG, 2010.
[87] D. Hesseling and M. Sari, "The introduction of quality regulation of electricity distribution in The
Netherlands," European Energy Law report III, vol. 7, pp. 127-145, 2006.
[88] H. Wolse and L. Derksen, "Betrouwbaarheid van elektriciteitsnetten in Nederland," Movares,
2014.
[89] S. Nies, Interviewee, Grid blackout threat weighs on renewables take up. [Interview]. 6-10
February 2012.
[90] D. Lineweber and S. McNulty, "The Cost of Power Disturbances to Industrial & Digital Economy
Companies," Primen, Madison, 2001.
[91] C. Bijvoet, M. d. Nooij and C. Koopmans, "Gansch het raderwerk staat stil. De kosten van
stroomstoringen," SEO, Amsterdam, 2003.
[92] J. d. Joode, D. Kingma, M. Lijesen, M. Mulder and V. Shestalova, "Energy Policies and Risks on
Energy Markets," Netherlands Bureau for Economic Policy Analysis, 2004.
[93] A. F. Wals, E. Cross and E. J. W. v. Sambeek, "Review of Current electricity policy and regulation,"
Sustelnet, Petten, 2003.
[94] Art. 2.1(1)(a) Environmental Law (General Provisions) Act.
[95] Art. 2.2a Decree on Environmental Law (Besluit omgevingsrecht).
[96] Art. 2.1(1)(e) Environmental Law (General Provisions) Act.
Page 107
97
[97] Art. 2.1(1)(i) Environmental Law (General Provisions) Act.
[98] Art. 75(5) and (6) Flora and Fauna Act.
[99] Pursuant to art. 19d Nature Conservation Act.
[100] Pursuant to art. 2.4(1) Environmental Law (General Provisions) Act.
[101] Art. 9f(1) Electricity Act in connection with art. 3.33 Dutch Spatial Planning Act.
[102] Unless a administrative body of the state is competent. See art. 9f(2) Electricity Act.
[103] Cf. art. 1.4(3)(a) of the Activities Decree.
[104] Art. 3.14a Activities Decree.
[105] Art. 3.12 Activities Regulation.
[106] Cf. Art. 1(1)(o) Decree on External Safety of Establishments.
[107] Art. 2.4(2) Regulation on General Rules of Spatial Planning in combination with Annex 8.4 and
annex 10..
[108] Art. 1.10(1) Activities Regulation.
[109] A. d. Groot, "Four European futures for the Rijmond Industrial Megasite," Energy Research
Center of Netherlands, Petten, 2006.
[110] M. v. Overveld, P. J. v. d. Graaf, S. Eggink-Eilander and M. I. Berghuis, "Praktijkboek
Bouwbesluit," Sdu Uitgevers, Den Haag, 2011.
[111] E. I. A. Act, "Environmental impact assesment in procedures applied by authorities," BGBI, 2001.
[112] T. TSO, "Grid code - High and extra high voltage," Tennet, Bayreuth, 2015.
[113] N. M. A. Huijts, Sustainable energy technology acceptance: a psychological perspective, PhD
Thesis, Delft University of Technology, 2013.
Page 108
98
Appendix A – Exchange of data and communication [112]
Table 19. Load grid connection.
Project Phase Responsible Party Documentation/Data to be provided
Feasibility Connectee Connection request
Naming a desired grid connection point
Main connection data
Single line circuit diagram confirming to standard
Approximate project schedule
Official approvals and permissions Tennet Non-binding preliminary information on power
consumption
Provision of general information on the grid connection point
Min. and max. short circuit current from the Tennet grid and series impedance
Stationary (steady state) study and inspection of the plant and connection concept
Connectee Connection capacity, load, load development
Switchgear and transformer key data
Protection concept
Details of system interactions Tennet Definition of actual requirements on the generating
plant at the grid connection
Determination of the connection concept
Connectee Presentation of a binding connection concept
Site plans
Other official approvals
Tennet Defining the limits of ownership
Additional/special requirements
Process data list
Measurement, protection, metering
Final description of the “grid connection concept” and grid connection offer
Conditions for commissioning
Connectee Commissioning program and schedule
Plant documentation
Protection adjustment data
Evidence of agreed properties/requirements
Evidence that the plants behave on the grid in accordance with the grid code
Inspection protocols, certificates
Other official approvals
Successful acceptance and approval for commissioning
Tennet Grid connection agreement with technical specification and system management agreement
Approval for commissioning
Page 109
99
Table 20. Generation grid connections [112].
Project Phase Responsible Party Documentation/Data to be provided
Feasibility Connectee Connection request, stating power station type and primary energy type and also how the plant is to be operated
Naming a desired grid connection point or geographical position of the generating plant
Main connection data
Approximate schedule, stating medium-term/ long-term development
Official approvals
Tennet Non-binding preliminary information on power consumption
Provision of general information on the grid connection point
Min. and max. short circuit current from the Tennet grid and series impedance
Stationary (steady state) study and inspection of the plant and connection concept
Connectee Connection capacity, load and operating method, load development
Connection capacity for auxiliary load and start-up
Single line circuit diagram confirming to standard
Connection of the generating plant in the normal switching state.
Switchgear key technical data
Contribution to the short circuit current into the Tennet grid and also data on load flow and short circuit current calculation
Details of the system interactions Tennet Definition of actual requirements on the generating
plant at the grid connection
Determination of the connection concept
Connectee Presentation of a binding connection concept
Protection concept for grid connection and generating plant
Details of the possibility of providing system services
Site plans
Other official approvals
Tennet Defining the limits of ownership
Additional/special requirements
Process data list
Measurement, protection, metering
Final description of the “grid connection concept” and grid connection offer
Dynamic system studies
Connectee Confirmation of the design data provided for the stationary steady state study
Adjustment values and block circuit diagram of the control model
Page 110
100
Dynamic equivalent circuit diagram of the generators
Dynamic equivalent circuit diagram of the motors for auxiliary road
Adjustment values for components for the automatic system and description of its behavior
Concept for auxiliary road
Other data relevant to the system Tennet Stating the requirements on control devices with
regard to grid security and grid compatibility
Conditions for commissioning
Connectee Commissioning program and schedule
Plant documentation
Protection adjustment data
Evidence of agreed properties/requirements
Evidence that the plants behave on the grid in accordance with the grid code
Inspection protocols, certificates
Other official approvals
Successful acceptance and approval for commissioning
Tennet Grid connection agreement with technical specification and system management agreement
Approval for commissioning in test operation
Following evidence on the properties and troubleshooting or improvement for permanent operation approval


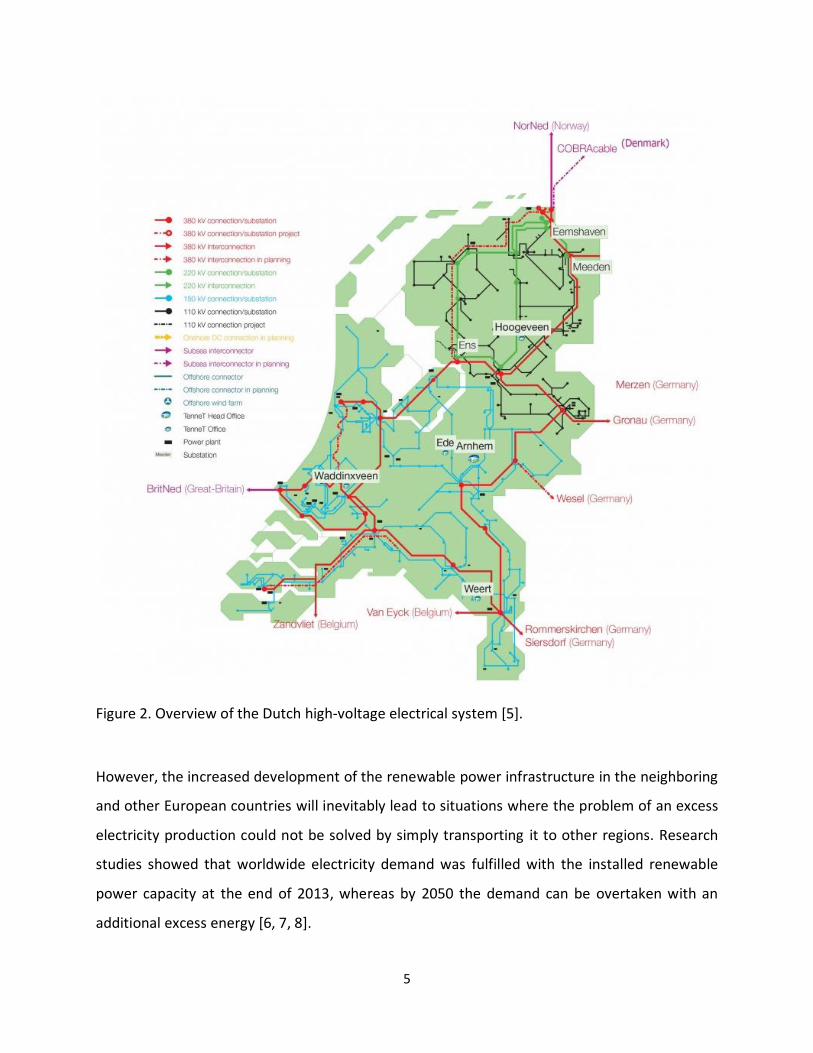


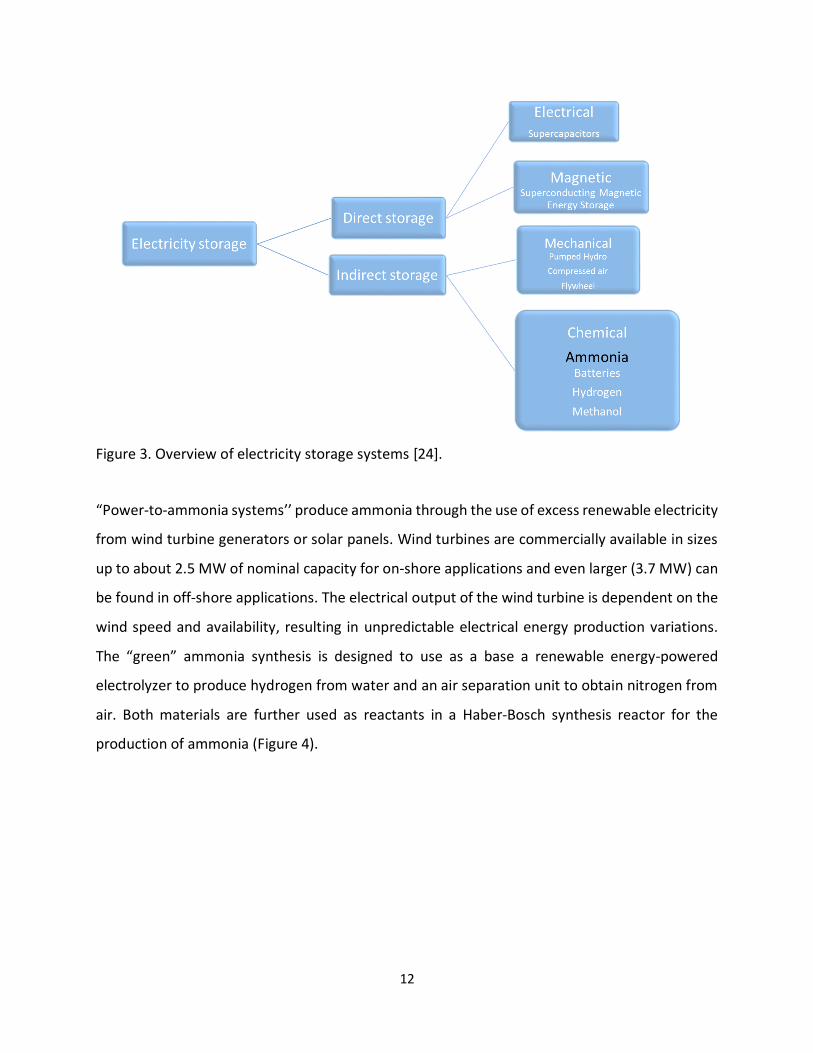

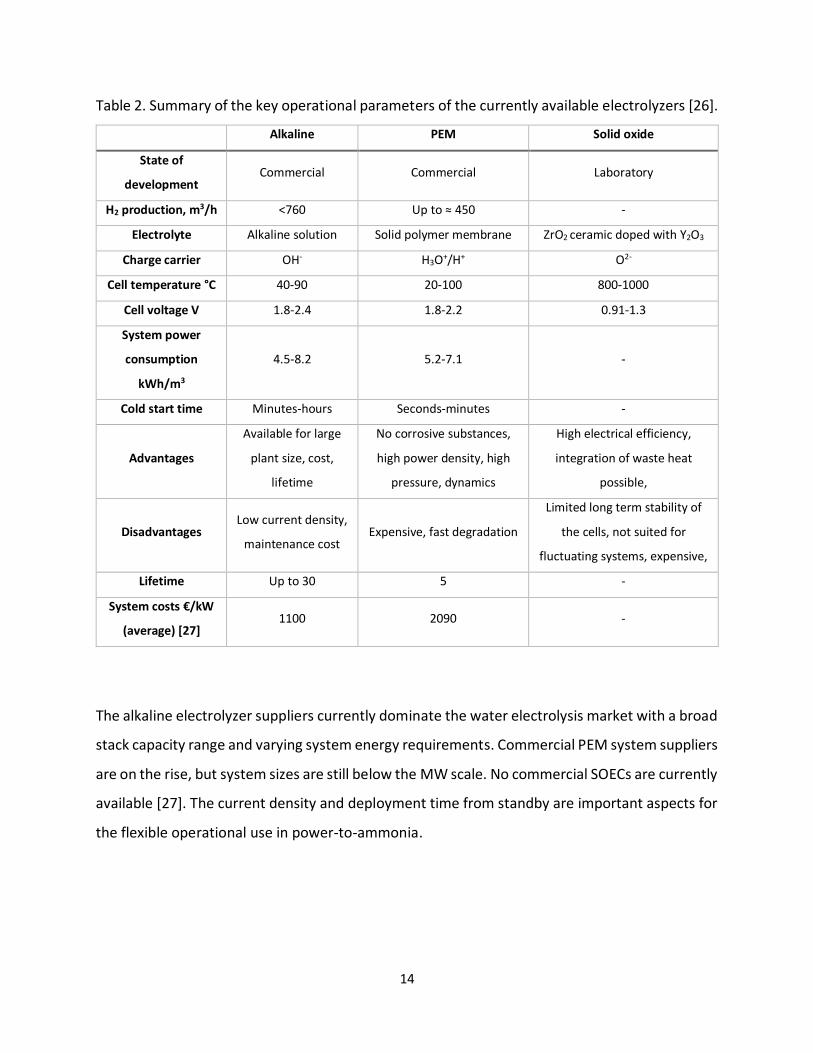


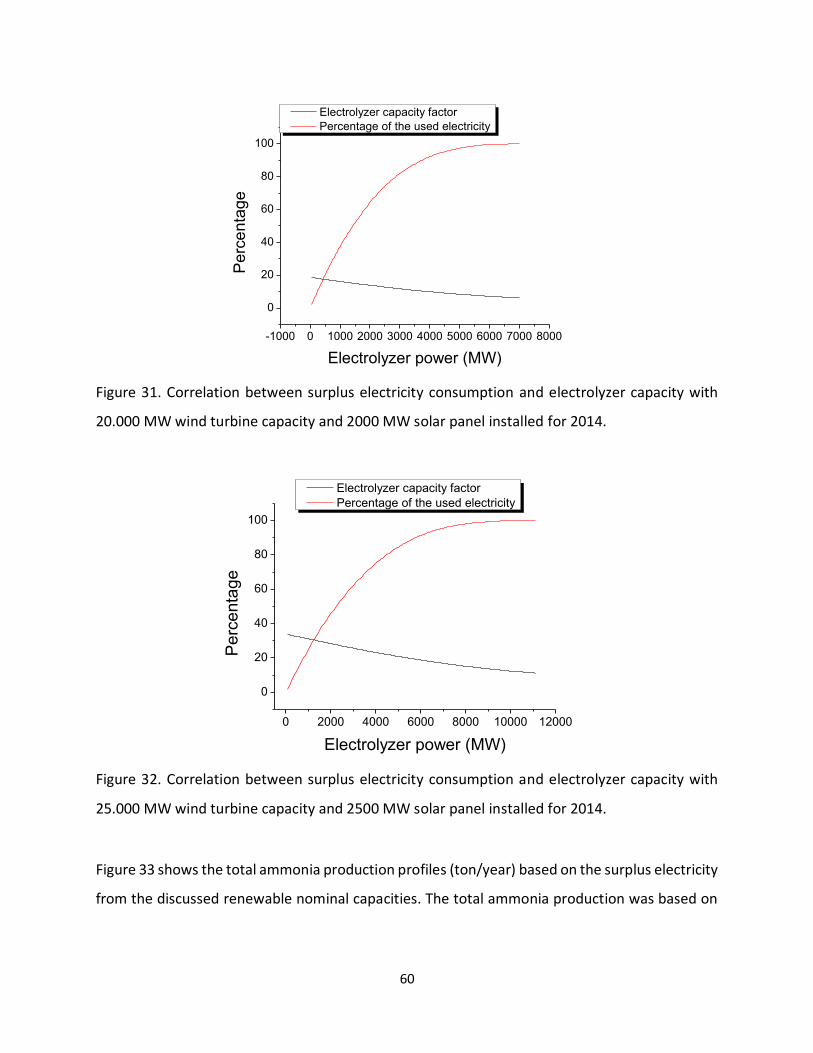


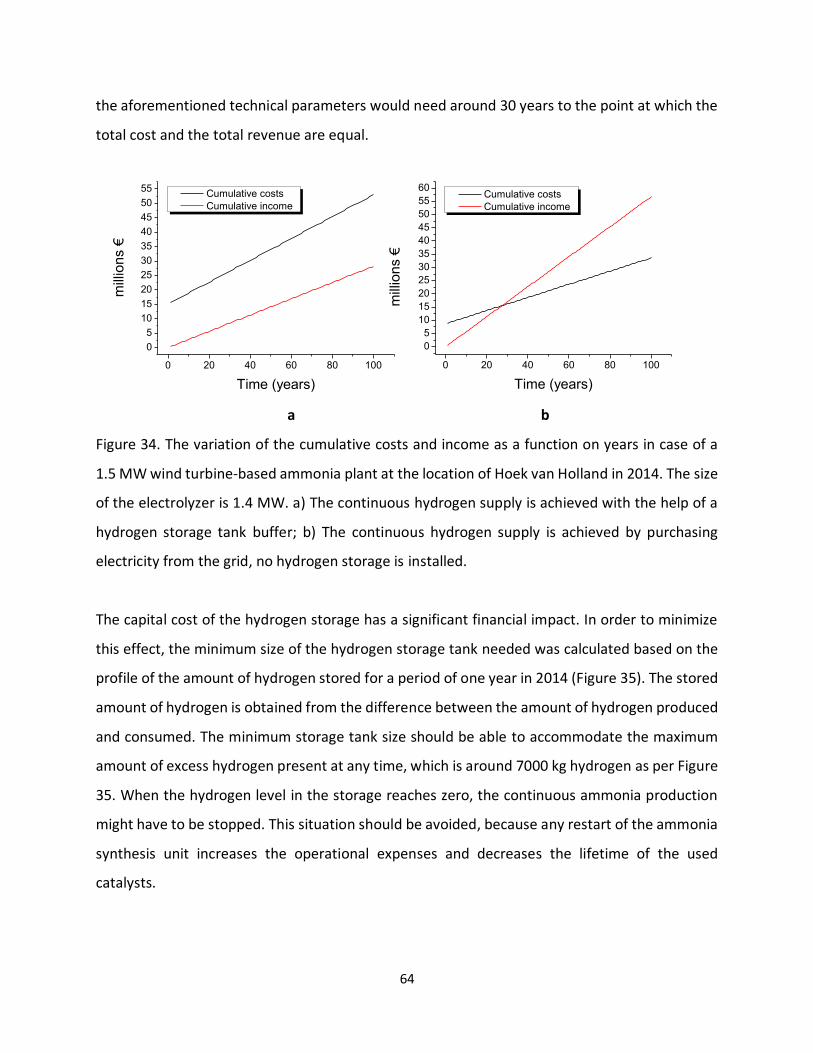


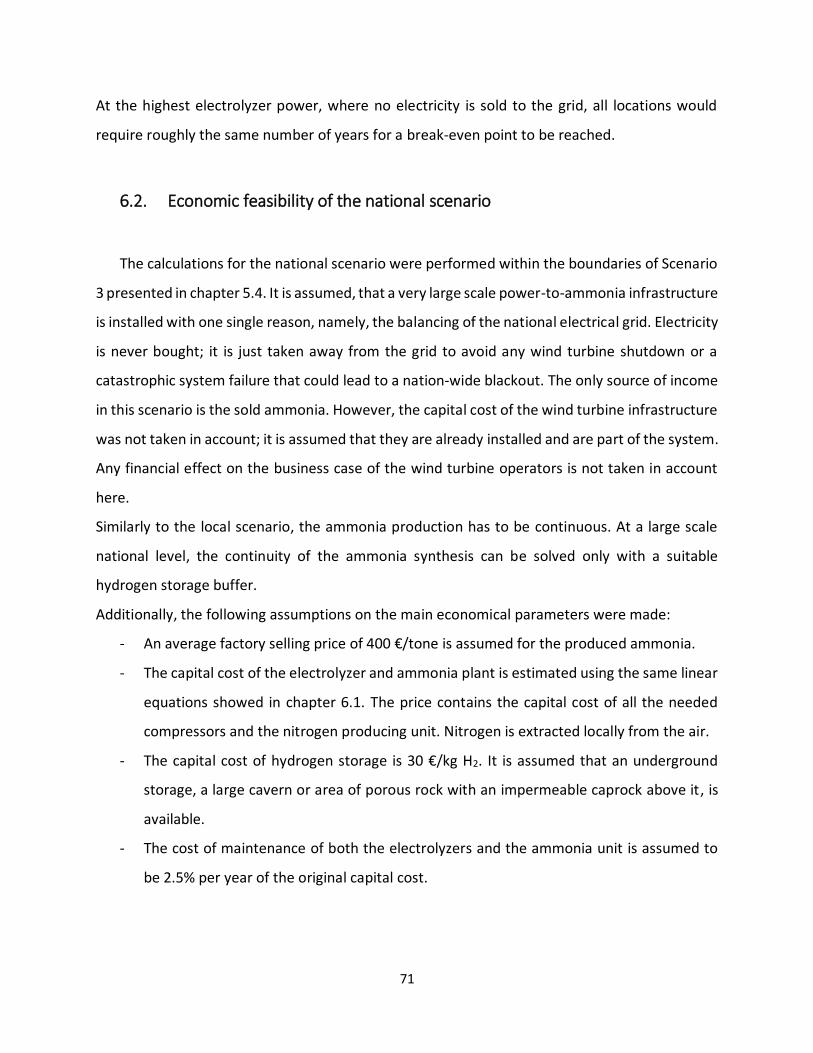


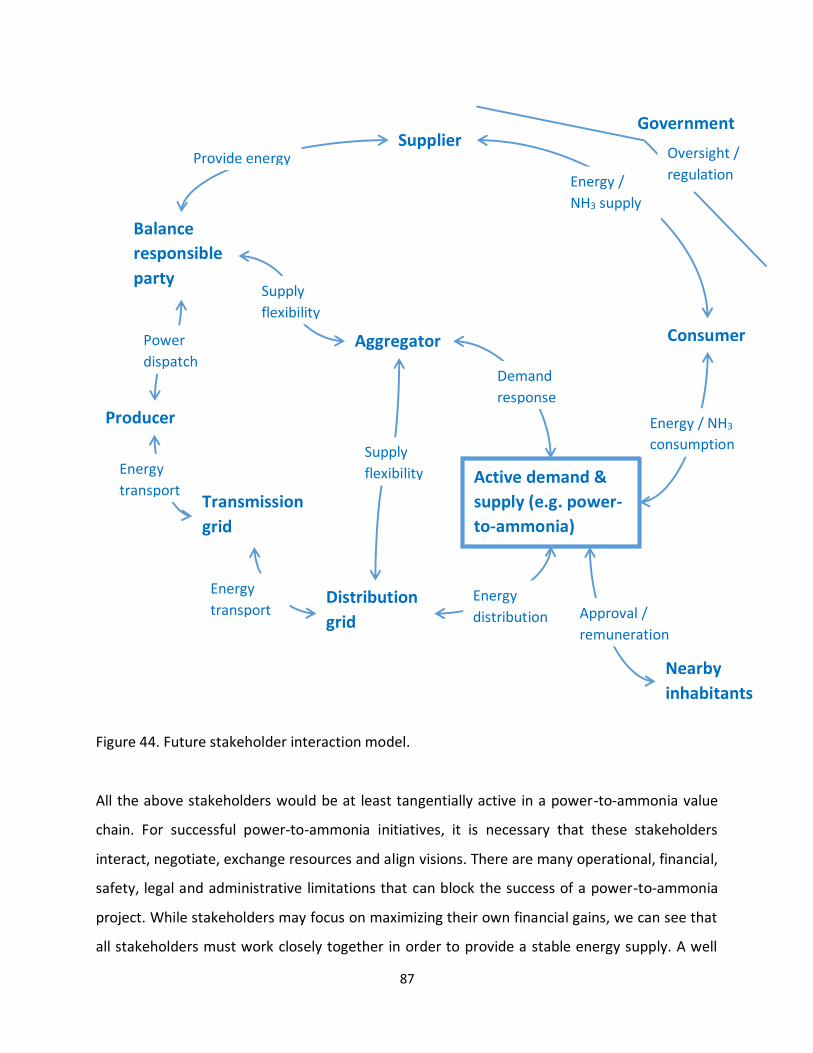


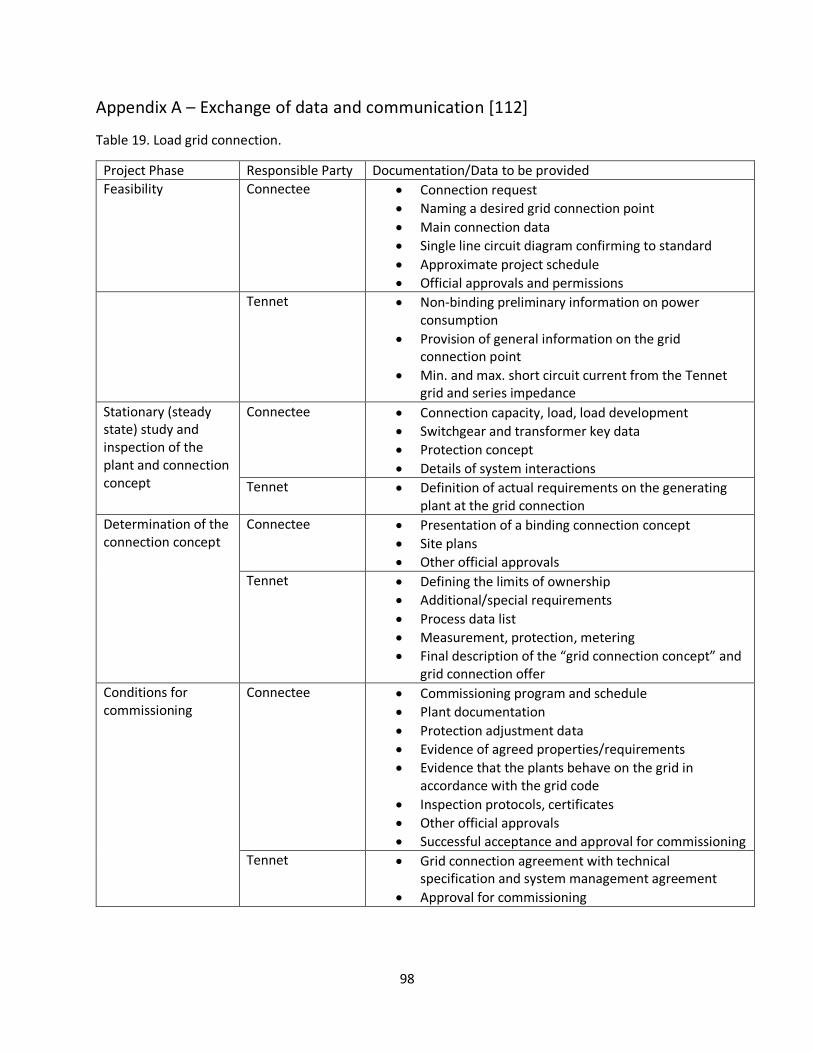
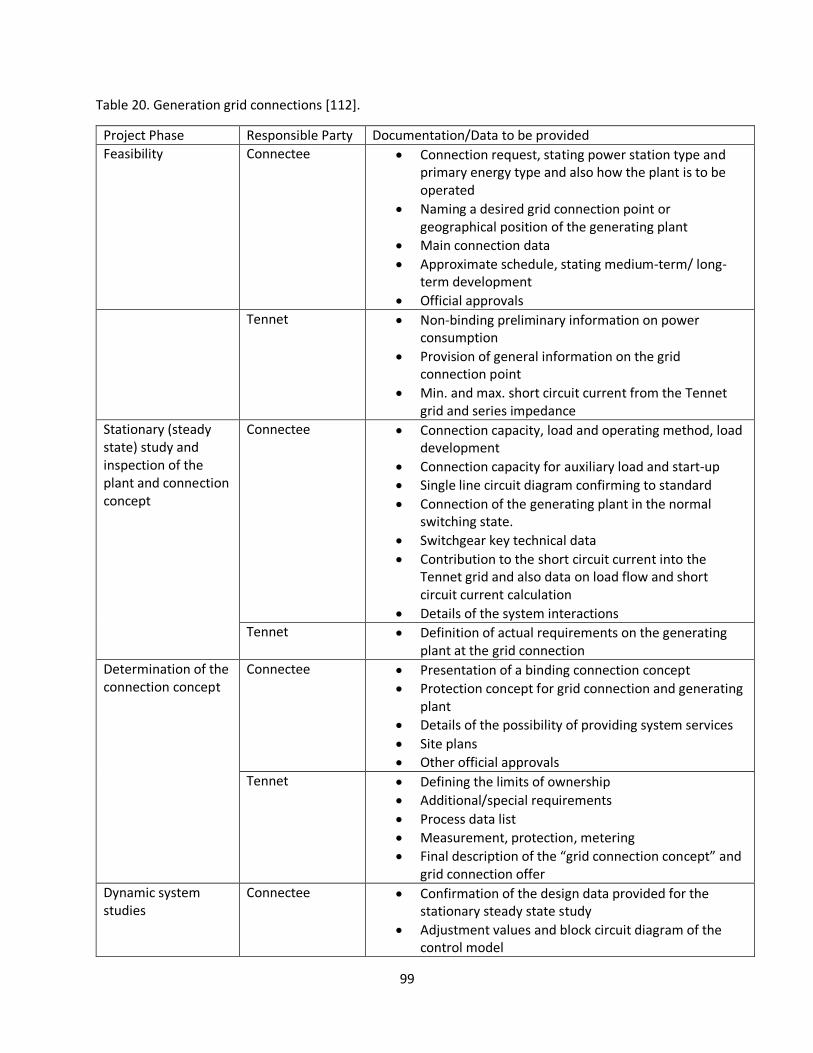


![[Yasmina Reza] Art(BookFi.org)](https://static.documents.pub/doc/80x56/55cf97ce550346d03393bc9c/yasmina-reza-artbookfiorg.jpg)