22
Power transmission and generation politics Mitchell Johnston CBE 555 10/27/2014
| Date post: | 29-Dec-2015 |
| Category: |
Documents |
| Upload: | silas-benson |
| View: | 217 times |
| Download: | 1 times |
Power transmission and generation politics
Mitchell JohnstonCBE 555
10/27/2014
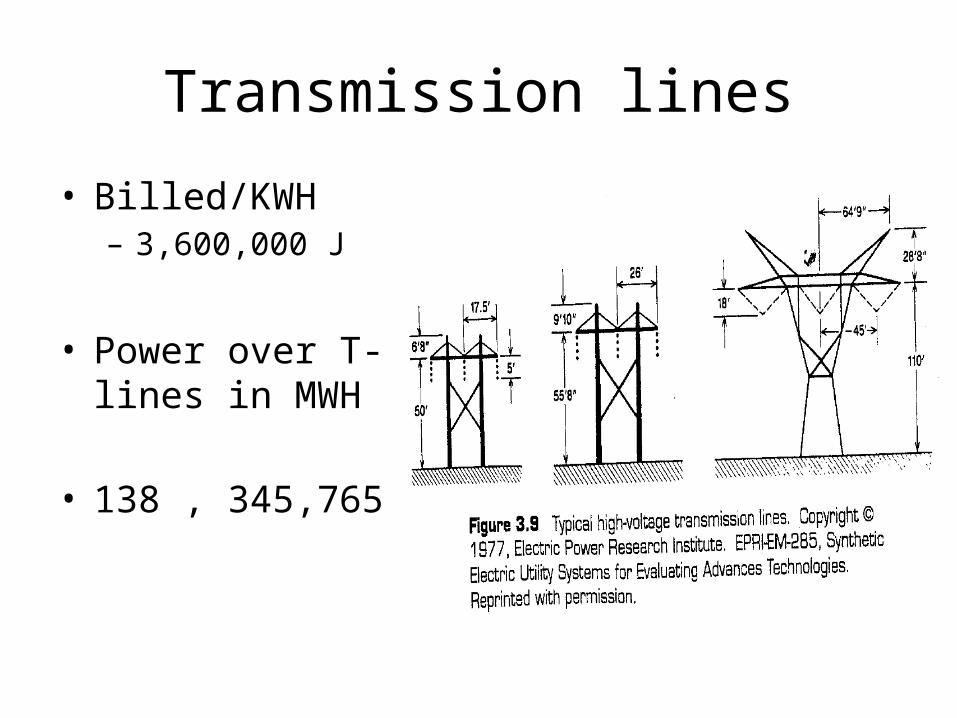
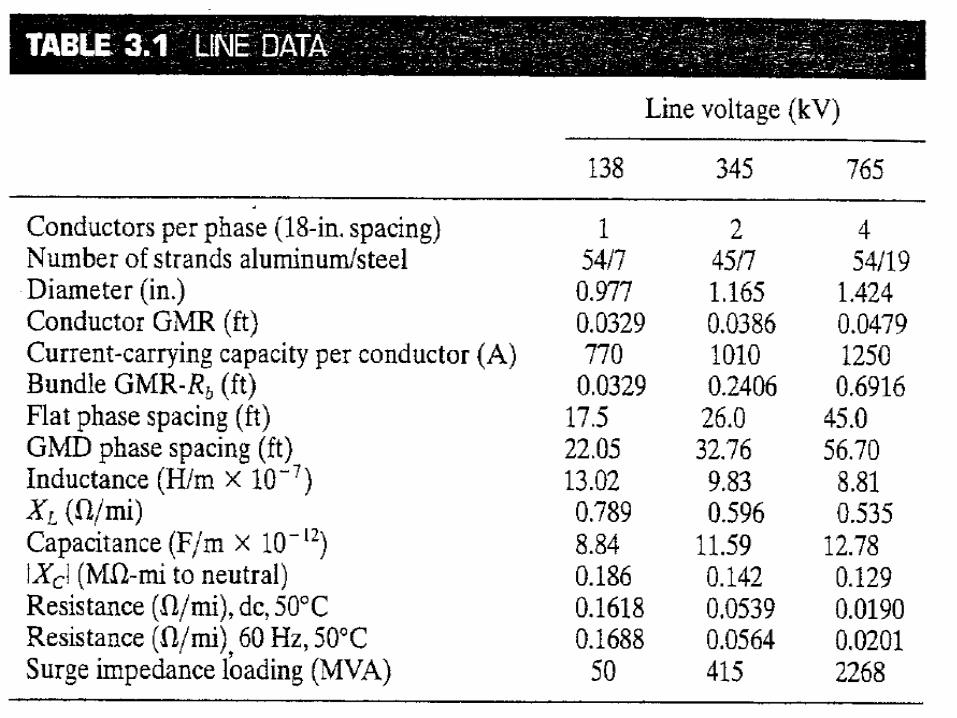
Transmission lines
• Billed/KWH– 3,600,000 J
• Power over T-lines in MWH
• 138 , 345,765 KV
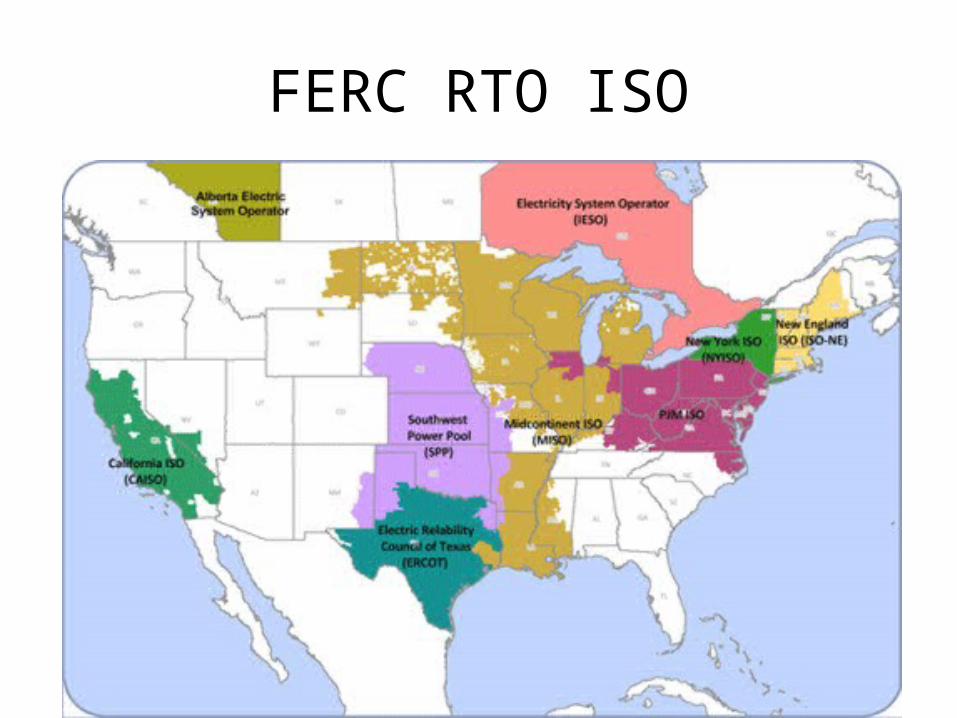
FERC RTO ISO
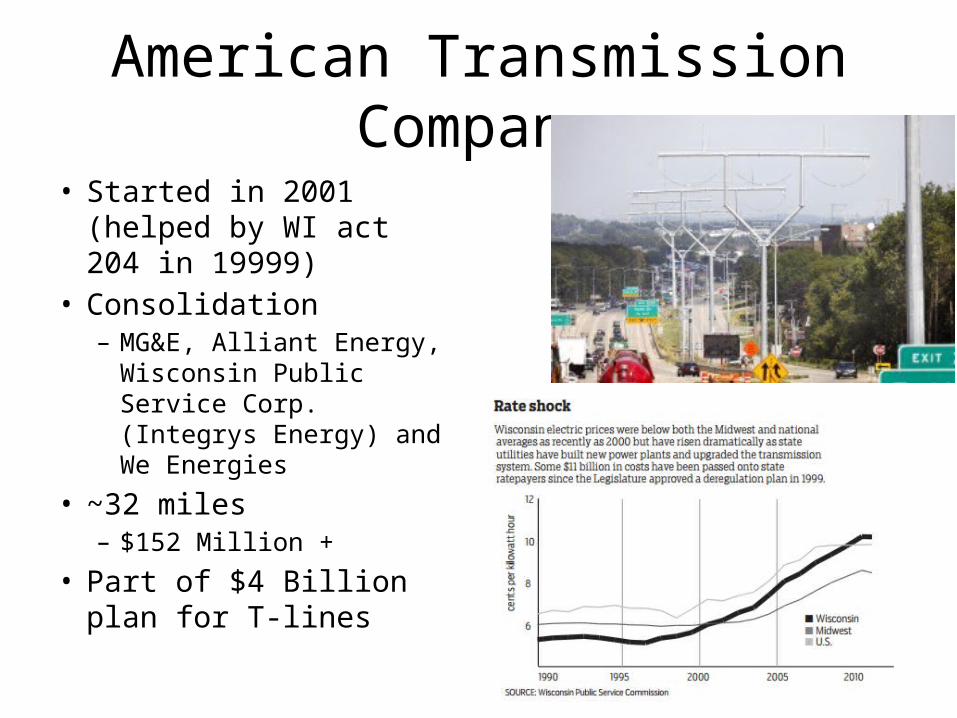
American Transmission Company
• Started in 2001 (helped by WI act 204 in 19999)
• Consolidation– MG&E, Alliant Energy,
Wisconsin Public Service Corp. (Integrys Energy) and We Energies
• ~32 miles– $152 Million +
• Part of $4 Billion plan for T-lines
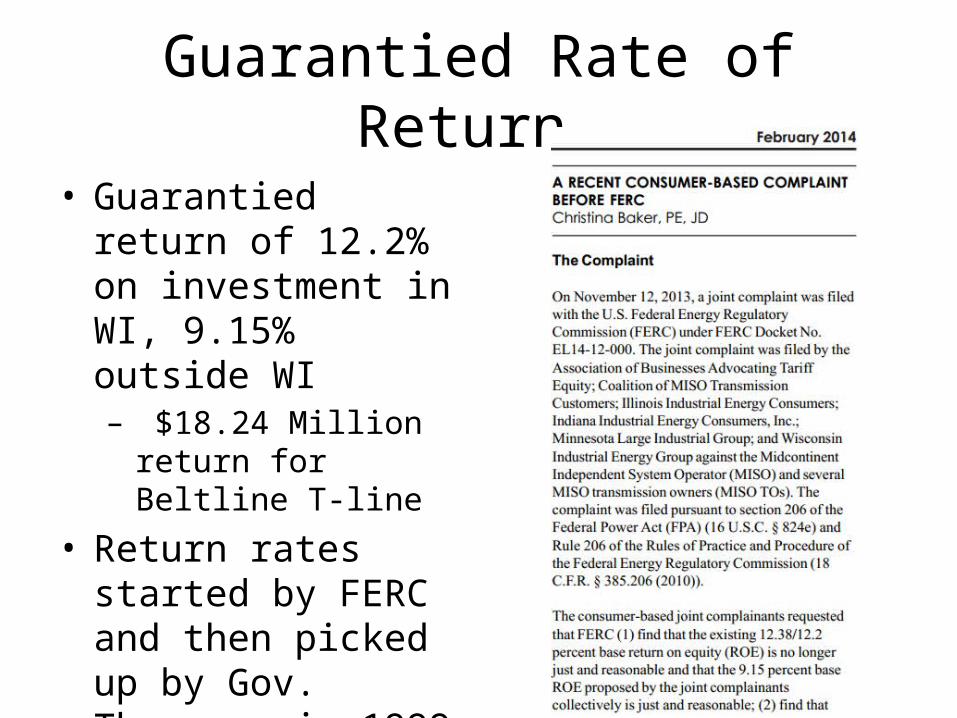
Guarantied Rate of Return
• Guarantied return of 12.2% on investment in WI, 9.15% outside WI– $18.24 Million return
for Beltline T-line
• Return rates started by FERC and then picked up by Gov. Thompson in 1999 (Act 204).
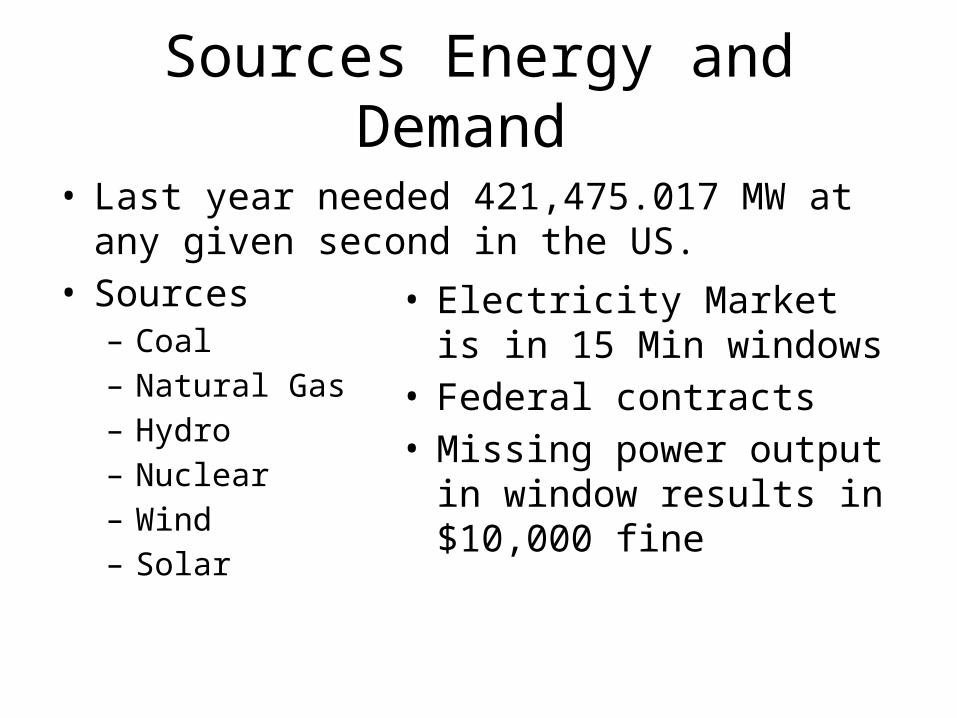
Sources Energy and Demand
• Last year needed 421,475.017 MW at any given second in the US.
• Sources– Coal– Natural Gas– Hydro– Nuclear – Wind – Solar
• Electricity Market is in 15 Min windows
• Federal contracts • Missing power output in
window results in $10,000 fine
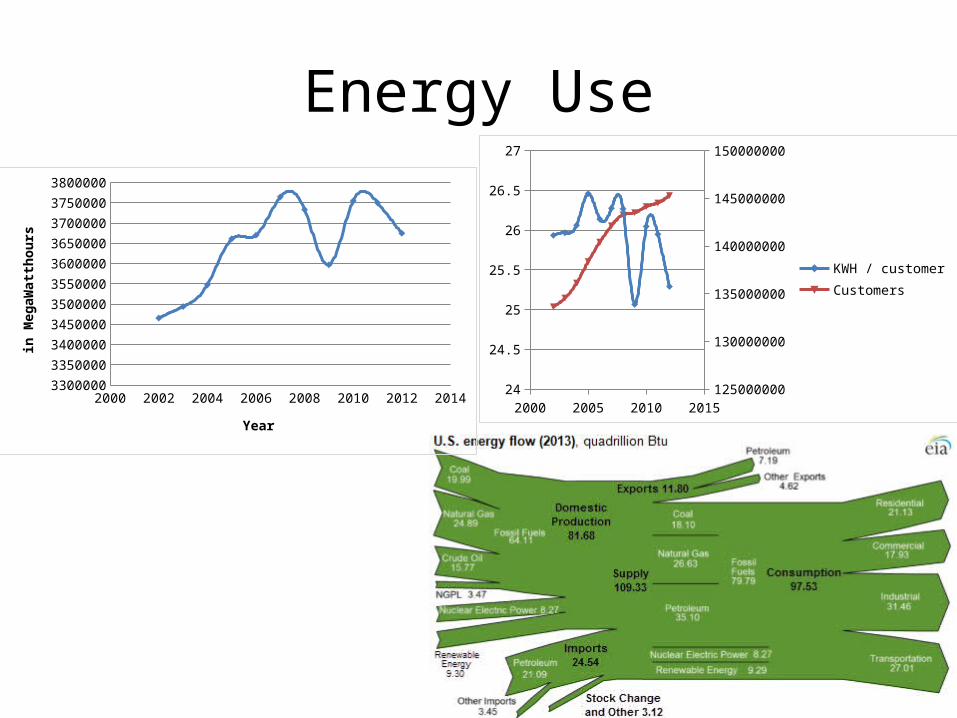
Energy Use
2000 2002 2004 2006 2008 2010 2012 201424
24.5
25
25.5
26
26.5
27
125000000
130000000
135000000
140000000
145000000
150000000
KWH / customerCustomers
2000 2002 2004 2006 2008 2010 2012 20143300000
3350000
3400000
3450000
3500000
3550000
3600000
3650000
3700000
3750000
3800000
Year
in M
egaW
attho
urs
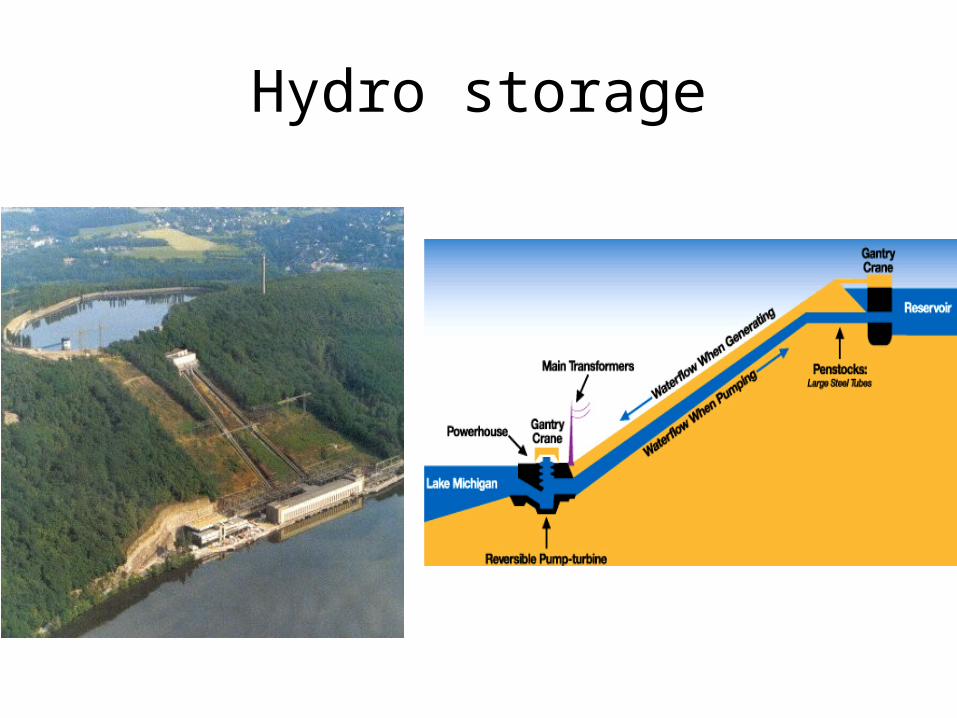
Hydro storage
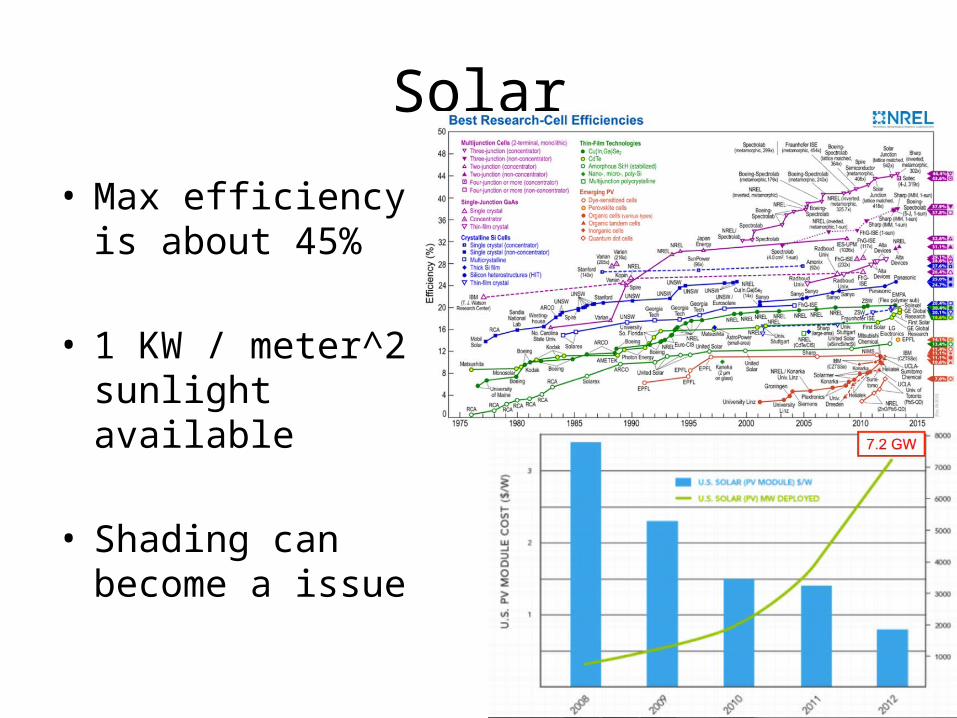
Solar
• Max efficiency is about 45%
• 1 KW / meter^2 sunlight available
• Shading can become a issue
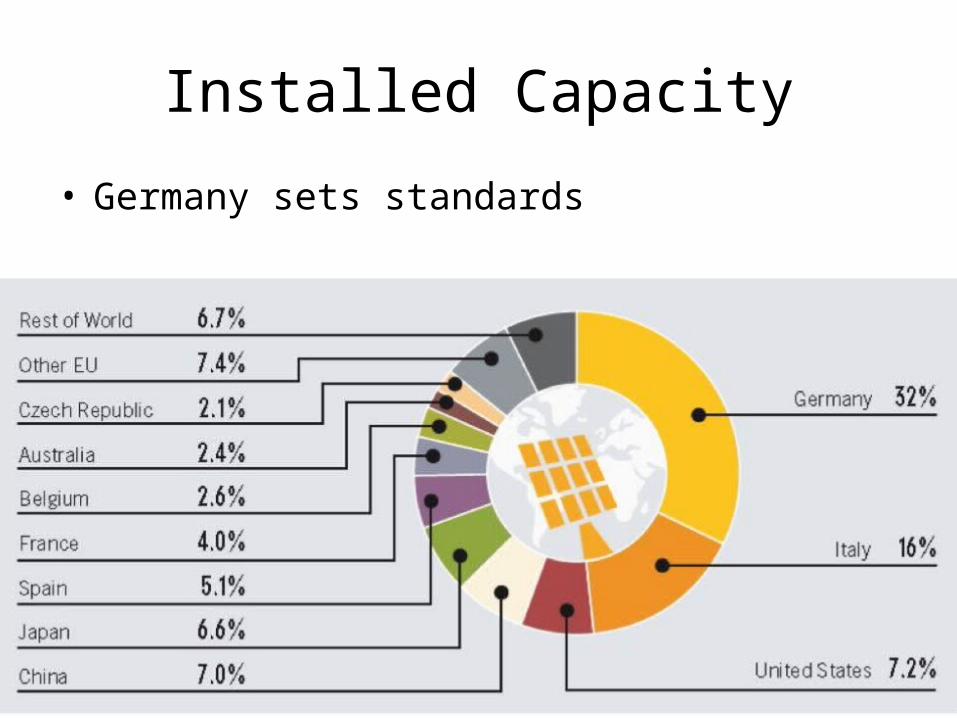
Installed Capacity
• Germany sets standards
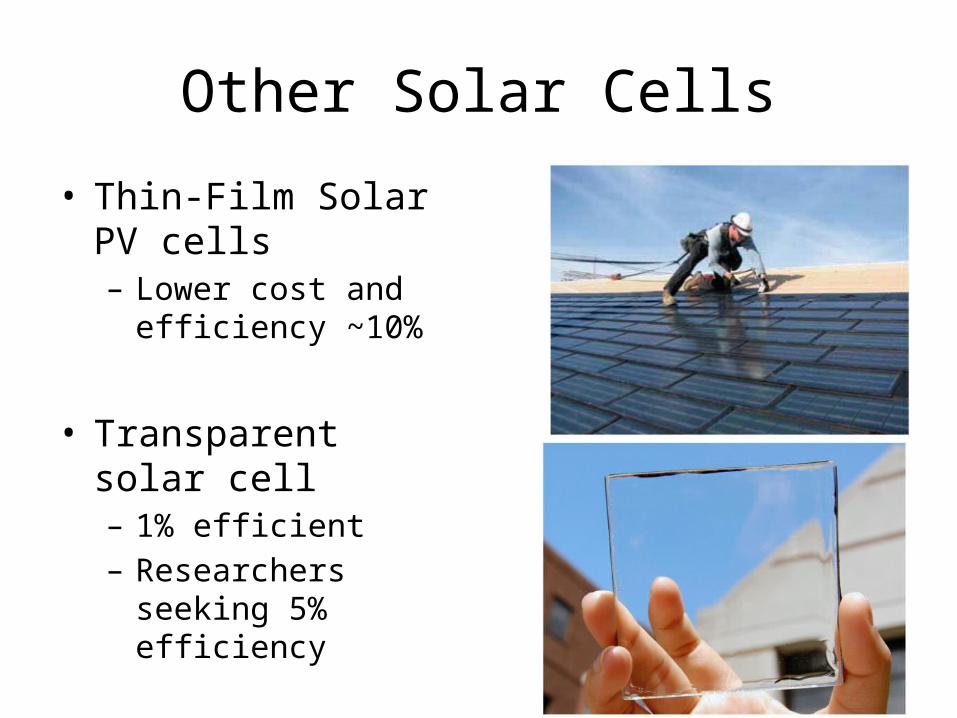
Other Solar Cells
• Thin-Film Solar PV cells – Lower cost and
efficiency ~10%
• Transparent solar cell – 1% efficient – Researchers seeking 5%
efficiency
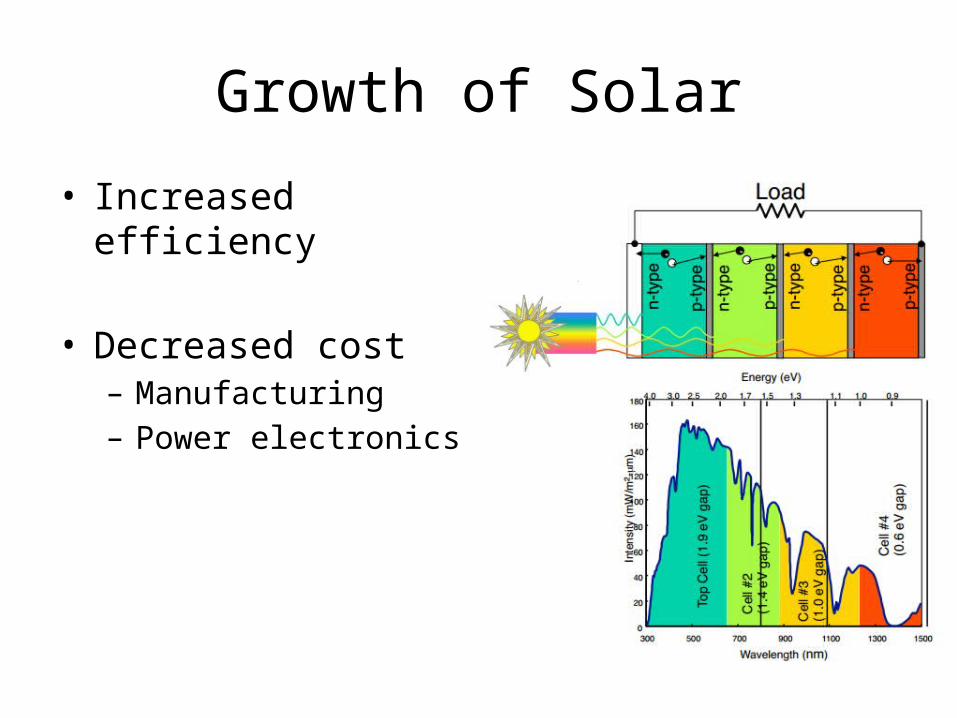
Growth of Solar
• Increased efficiency
• Decreased cost – Manufacturing – Power electronics
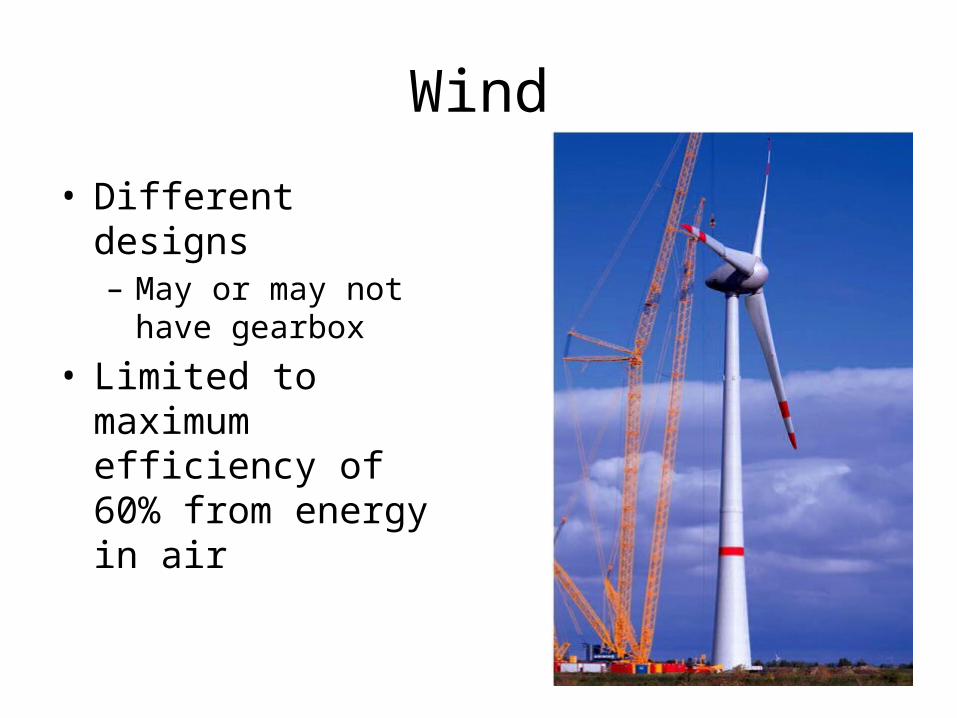
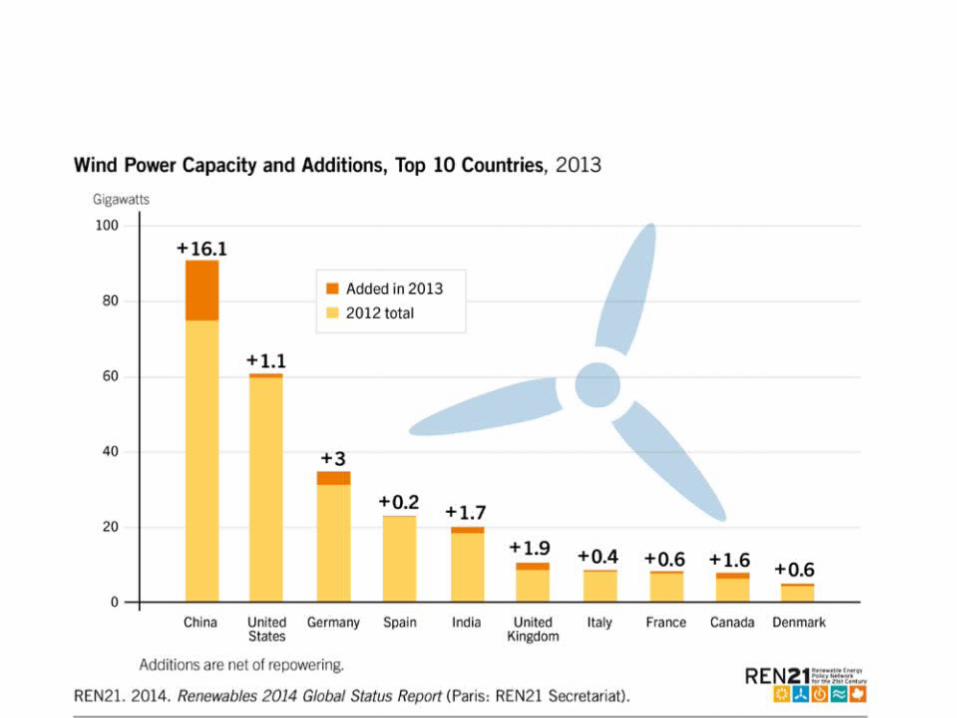
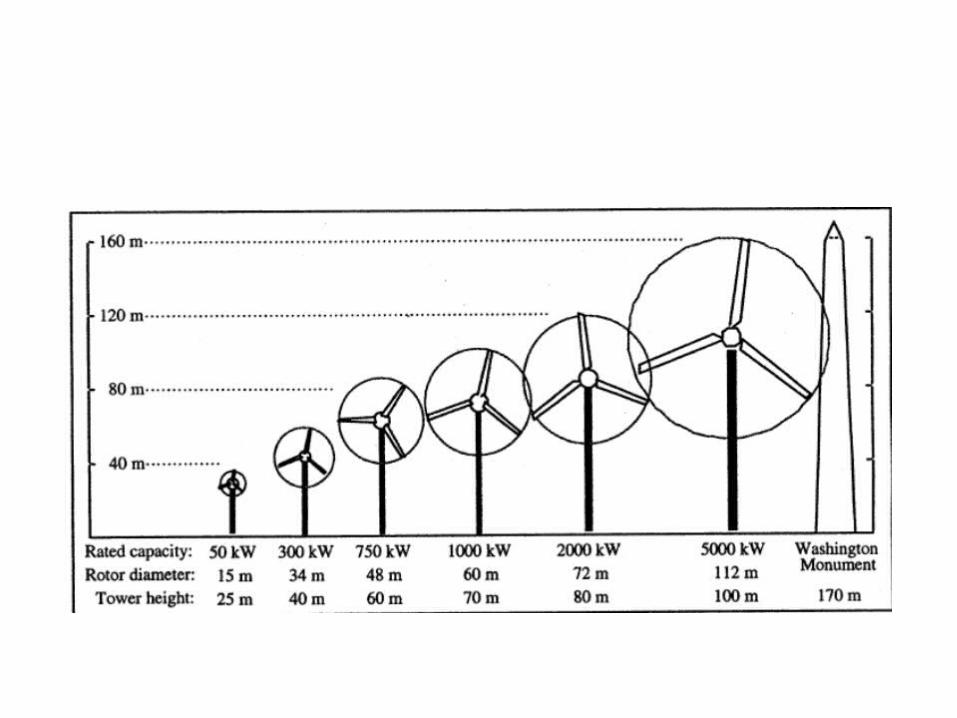
Wind
• Different designs– May or may not have
gearbox
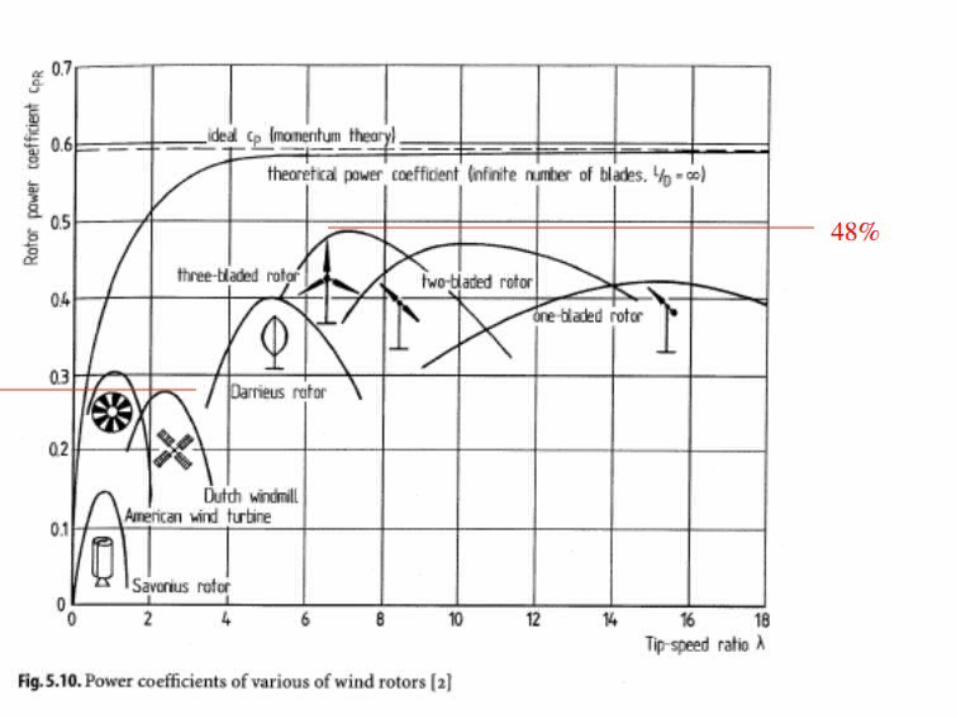
• Limited to maximum efficiency of 60% from energy in air
0 5 10 15 20 250
1000
2000
3000
4000
5000
6000
7000
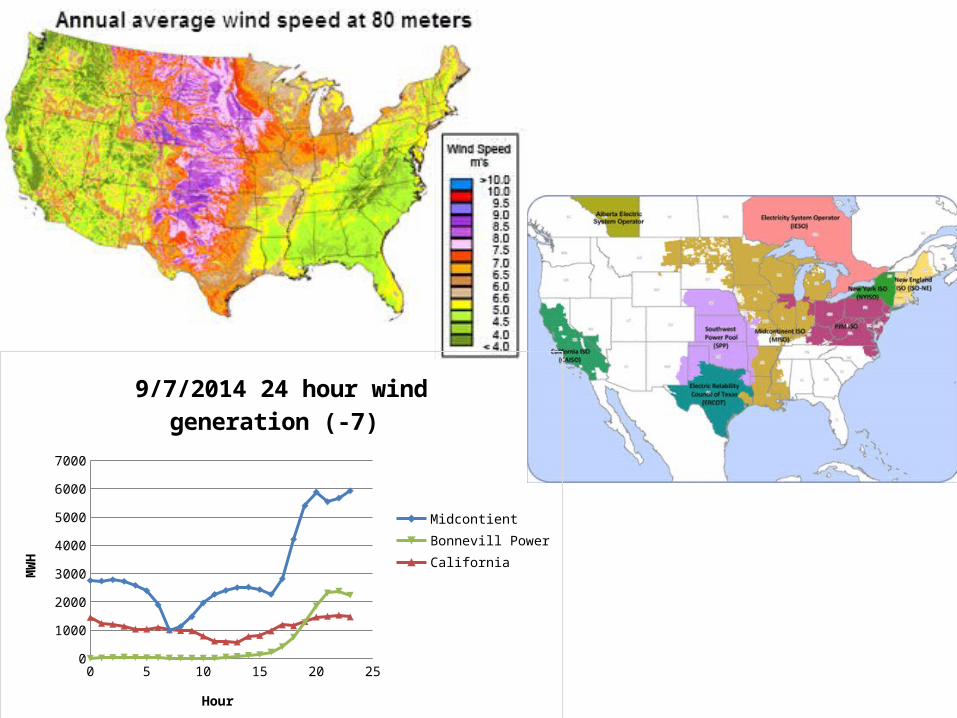
9/7/2014 24 hour wind generation (-7)
MidcontientBonnevill PowerCalifornia
Hour
MW
H
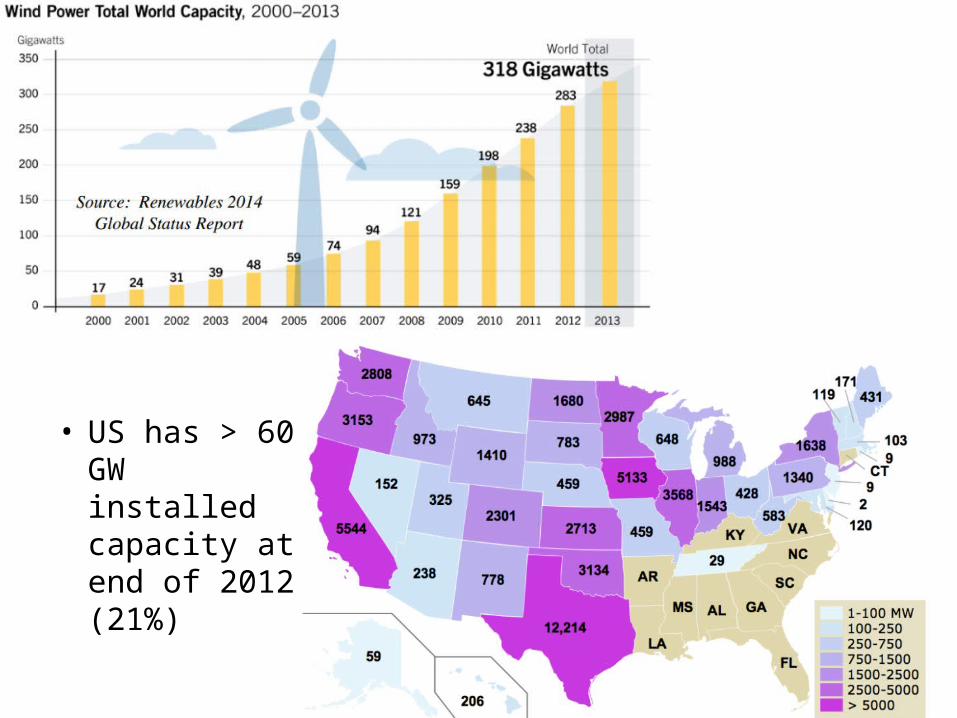
• US has > 60 GW installed capacity at end of 2012 (21%)
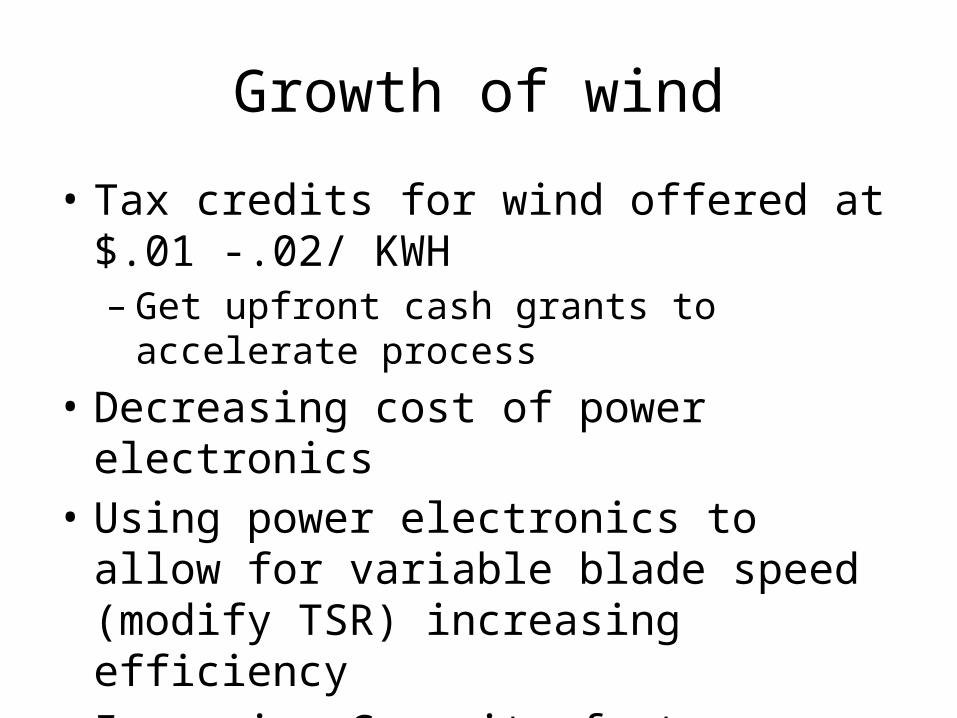
Growth of wind
• Tax credits for wind offered at $.01 -.02/ KWH– Get upfront cash grants to accelerate process
• Decreasing cost of power electronics • Using power electronics to allow for variable
blade speed (modify TSR) increasing efficiency• Improving Capacity factor

Questions
Links• http://host.madison.com/business/biz_beat/atc-profits-nicely-as-it-keeps-the-lights-on/article_14b24c4a-e0cf-11e1-915d-0
01a4bcf887a.html
• http://www.americanbar.org/content/dam/aba/publications/nr_newsletters/eis/201402_eis.authcheckdam.pdf• http://www.eia.gov/forecasts/aeo/ (Annual Energy Report)


