1 Powering Telecoms: East Africa Market Analysis GSMA Green Power for Mobile Powering Telecoms: East Africa Market Analysis Sizing the Potential for Green Telecoms in Kenya, Tanzania and Uganda
Transcript
1
Powering Telecoms: East Africa Market Analysis GSMA Green Power for Mobile
Powering Telecoms: East Africa Market Analysis Sizing the Potential for Green Telecoms in Kenya, Tanzania and Uganda
2
Powering Telecoms: East Africa Market Analysis GSMA Green Power for Mobile
Powering Telecoms: Current State of Affairs .................................................................. 7
Telecoms: The Growth Context ........................................................................................ 7
Subscribers and Penetration ...................................................................................................... 7 Mobile Coverage and Network Size............................................................................................ 8 Size of the Mobile Network ......................................................................................................... 8
Power and Telecoms: Cost of Powering Telecoms........................................................... 9
Power Sector: Current state of power infrastructure ................................................................... 9 Power and Telecoms: Impact of Power infrastructure on telecoms ............................................. 9 Power and Telecoms: Costs of Powering ................................................................................. 11
Powering Telecoms: Current Approach .......................................................................... 12
Powering Telecoms: Green Telecoms and the Size ..................................................... 16
The Green Choices ......................................................................................................... 16
Powering Telecoms: The Green Shades under the Tower (Current Deployments) ........ 21
Powering Telecoms: The Green Potential ...................................................................... 22
Powering Telecoms: The way forward ........................................................................... 23
Growth forecast and Powering outlook ........................................................................... 23
Short term ................................................................................................................................ 23 Long term ................................................................................................................................. 24
Powering Telecoms: Future trends and Model innovations ............................................ 24
Network Optimisation and Energy Efficiency ............................................................................ 24 Structural change: Leading to Tower Company ........................................................................ 25 Supply Model Innovation: Emergence of Energy Service Company (ESCo) ............................. 25 Services Innovation: Tapping the Community Power Potential ................................................. 27
Powering Telecoms: East Africa Market Analysis GSMA Green Power for Mobile
Objective
The Green Power for Mobile Market Analysis report for East Africa aims to provide market insights and potential for green power for telecoms in the three focus countries including Kenya, Tanzania and Uganda.
The objective of the report is to analyse the current state of the telecom market and the highlight the current approach to powering networks to enable readers with see the potential for alternative energy solutions, in particular green power. The report looks at various elements including the industry structure, the regulatory environment, the current state of power within telecoms infrastructure as well as potential green power solutions.
The report presents the reader with the current size of the market and takes a look at the future of green power for mobile. The report also provides the potential market opportunity for 3
rd party outsourced energy model.
Approach
The Green Power Market Analysis for East Africa is based on information gathered using primary data collection through stakeholder interactions and questionnaires. The market analysis report also utilises some generic market data collected through various secondary resources and used as appropriate for analysis.
4
Powering Telecoms: East Africa Market Analysis GSMA Green Power for Mobile
Glossary
MNO: Mobile network operator or mobile operator
Tower Company: A company that manages a part or the entire assets of a telecom tower.
ESCos: An energy service company that provides turnkey or end-to-end GPM solutions to
an operator for off-grid telecom BTS.
CAPEX Model: Mobile Operator or Tower Company invests CAPEX of their own to rollout
the renewable solution.
OPEX Model: A Renewable ESCo invests CAPEX to generator power at site level and
sells power to Mobile Operator or Tower Company.
Tenancy Ratio: Tenancy ratios are expressed as a fraction of total number of operators
sharing towers/total number of sites present.
Off-grid site: Telecom Base Station Site which is NOT connected to the commercial Grid
power supply
On-grid site: Telecom Base Station Site which is connected to the commercial Grid power
supply
DG: Diesel Generator
IRR: Internal Rate of Return is the Rate of Return of an Investment.
CAGR: Cumulative Annual Growth Rate
ARPU: Average Revenue per User of mobile services
PPA: Power Purchase Agreement
REA: Rural Electrification Agency
MEM: Ministry of Energy and Minerals
5
Powering Telecoms: East Africa Market Analysis GSMA Green Power for Mobile
Figure 4: Telecom Base Station Sites (numbers and growth)
Figure 5: Sites by On/Off grid (numbers)
Figure 6: Sites by Power Outage (On-grid)
Figure 7: Powering Cost Structure (On/Off-grid)
Figure 8: Sites by Power Solution Deployed (on-grid)
Figure 9: Sites by Power Solution Deployed (off-grid)
Figure 10: Power Solution Deployed (off-grid) – Green Power Break-up
Figure 11: Telecoms Infrastructure and Operations Ownership by country (major
operators)
Figure 12: OPEX Savings Potential vs. Ease of Adoption and Availability (by power
solution)
Figure 13: Green Power vs. other power solutions (current deployments)
Figure 14: Green Power potential (No. of sites)
Figure 15: Growth (No. of sites) - short term
Figure 16: Powering Outlook - short term
Figure 17: Growth (No. of sites) - long term
Figure 18: Growth (No. of sites) - long term (break-up by Country and by On/Off/Unreliable
grid category)
Figure 19: 3rd
party ESCo business models
Figure 20: Market Potential - 3rd
party ESCo business model
Figure 21: Community Power from Mobile (CPM) – models of delivery
6
Powering Telecoms: East Africa Market Analysis GSMA Green Power for Mobile
Executive Summary
The growth of mobile telecommunications in Kenya, Tanzania and Uganda has resulted in reaching an overall subscriber base of 70.98 million accounting for about 58% of the population of the three countries. The number of subscribers in Kenya, Tanzania and Uganda are 29.2 million, 26.8 million and 15 million respectively. Kenya records the highest penetration levels of mobile services at 74% of the population followed by Tanzania at 62% and Uganda at 42.4%. Mobile network coverage across the region stands at an overall 80% of inhabited population and close to 50% of land area. Nearly 96% of the uncovered population is rural and poses geographic and economic challenges to bring them into mobile network coverage enabling access mobile telecom services.
The three countries combined together have a total network of 13,225 base station sites as on Q3 2012. Kenya has the highest number of base station sites at 5,565 sites followed by Tanzania at 4,593 sites and Uganda at close to 3,067 sites. Out of the total 13,225 base station sites, 9,957 are connected to the commercial grid power supply and the remaining 3,268 base station sites are off-grid and are located in areas without access to grid power infrastructure.
Currently 5% of total off-grid sites are deployed with green power (mostly solar hybrids) while 61% are deployed with DG-battery hybrid power systems; the remaining 34% of sites run on diesel generators 24hrs a day. The majority of the on-grid sites are deployed with grid-DG-battery hybrid power systems and 69% of on-grid sites have diesel generators deployed as a backup power source.
Based on the current power supply scenario, a total of 4,019 sites (30% of the total telecom sites) are estimated to have potential for green power alternatives. Of these potential sites, 23% are unreliable grid sites with power outages of more than 12 hours a day, on average, while the remaining 77% of sites are completely off-grid and are powered by diesel generators and battery hybrid power systems.
The GSMA estimates that a total of 5,700 sites would present the potential for third party outsourced energy model, based on a Power Purchase Agreement (PPA). The estimated market opportunity for an ESCo currently stands at ~US$92 million annually at a PPA rate of US$0.5/kWh.
GSMA forecasts that the total number of base station sites would reach 22,317 by 2015 at a CAGR of 19.1% for Kenya, Tanzania and Uganda together.
The ESCo market potential would reach US$155 million per annum by 2015.
7
Powering Telecoms: East Africa Market Analysis GSMA Green Power for Mobile
Powering Telecoms: Current State of Affairs
Telecoms in East Africa (Kenya, Tanzania and Uganda) are characterised by network coverage of over 75% of population, penetration levels are below 75%, annual subscriber growth rates are below 15%, declining ARPUs and mounting energy OPEX for running the network with 99.98% uptime.
1
In the following sections GSMA analyses a number of things including:
The current growth context of telecoms
Powering infrastructure and its impact on growth of telecoms
Current approaches to powering telecoms
Challenges faced by telecom operators to power their networks.
Telecoms: The Growth Context
The growth context of telecoms in Kenya, Tanzania and Uganda in terms of subscribers and network coverage is presented in the following sections.
Subscribers and Penetration
The telecommunications market in the three East African countries has seen an attractive growth rate over the last few years and reaching an overall subscriber base of 70.98 million accounting for the 58% of all three populations.
1
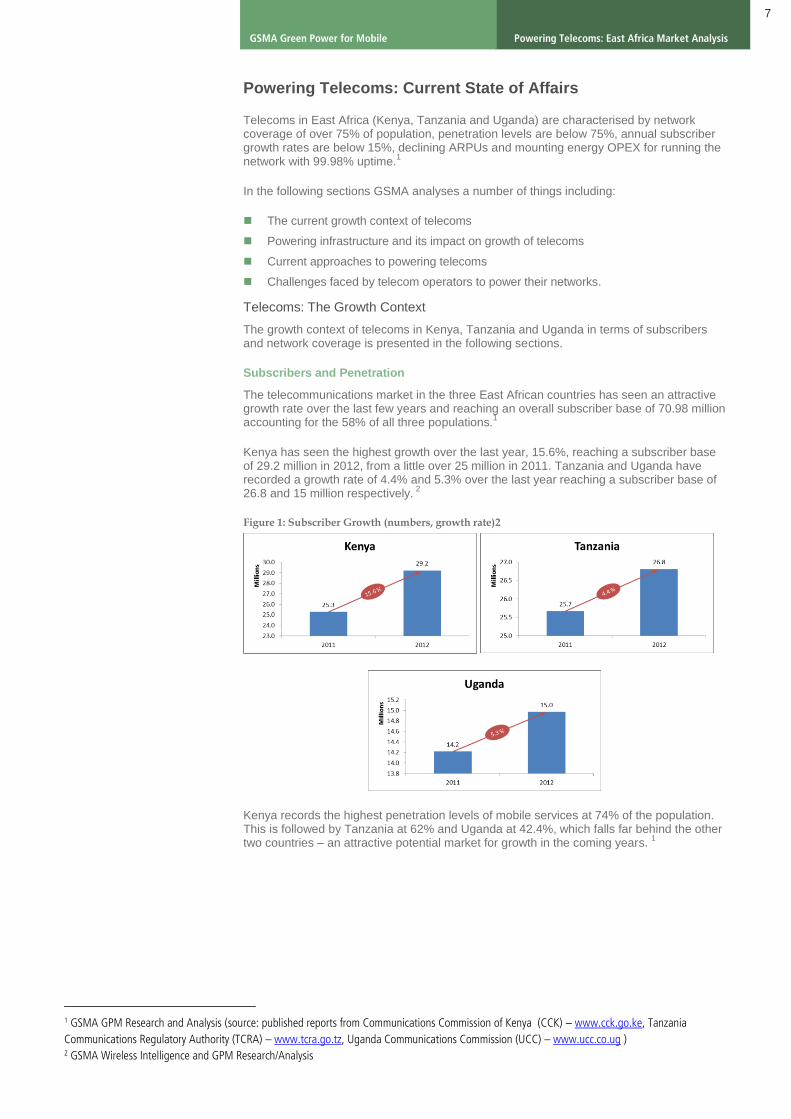
Kenya has seen the highest growth over the last year, 15.6%, reaching a subscriber base of 29.2 million in 2012, from a little over 25 million in 2011. Tanzania and Uganda have recorded a growth rate of 4.4% and 5.3% over the last year reaching a subscriber base of 26.8 and 15 million respectively.
Kenya records the highest penetration levels of mobile services at 74% of the population. This is followed by Tanzania at 62% and Uganda at 42.4%, which falls far behind the other two countries – an attractive potential market for growth in the coming years.
1
1 GSMA GPM Research and Analysis (source: published reports from Communications Commission of Kenya (CCK) – www.cck.go.ke, Tanzania
Powering Telecoms: East Africa Market Analysis GSMA Green Power for Mobile
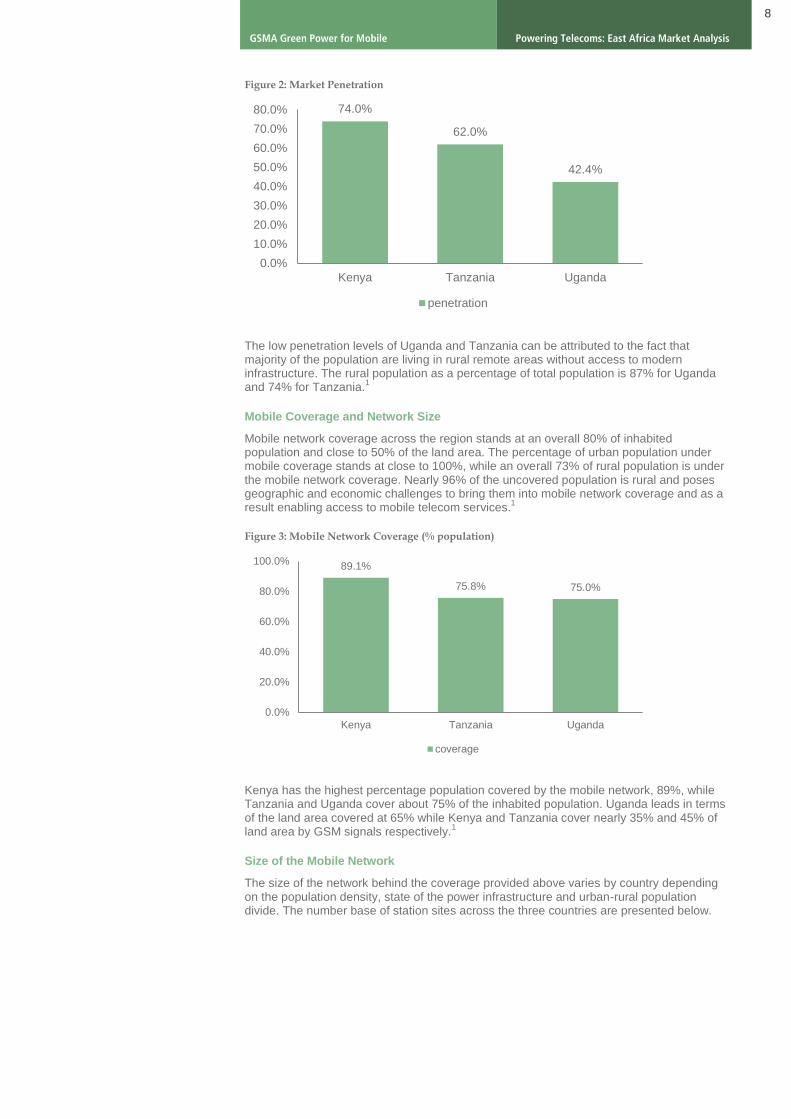
Figure 2: Market Penetration
The low penetration levels of Uganda and Tanzania can be attributed to the fact that majority of the population are living in rural remote areas without access to modern infrastructure. The rural population as a percentage of total population is 87% for Uganda and 74% for Tanzania.
1
Mobile Coverage and Network Size
Mobile network coverage across the region stands at an overall 80% of inhabited population and close to 50% of the land area. The percentage of urban population under mobile coverage stands at close to 100%, while an overall 73% of rural population is under the mobile network coverage. Nearly 96% of the uncovered population is rural and poses geographic and economic challenges to bring them into mobile network coverage and as a result enabling access to mobile telecom services.
1
Figure 3: Mobile Network Coverage (% population)
Kenya has the highest percentage population covered by the mobile network, 89%, while Tanzania and Uganda cover about 75% of the inhabited population. Uganda leads in terms of the land area covered at 65% while Kenya and Tanzania cover nearly 35% and 45% of land area by GSM signals respectively.
1
Size of the Mobile Network
The size of the network behind the coverage provided above varies by country depending on the population density, state of the power infrastructure and urban-rural population divide. The number base of station sites across the three countries are presented below.
74.0%
62.0%
42.4%
0.0%
10.0%
20.0%
30.0%
40.0%
50.0%
60.0%
70.0%
80.0%
Kenya Tanzania Uganda
penetration
89.1%
75.8% 75.0%
0.0%
20.0%
40.0%
60.0%
80.0%
100.0%
Kenya Tanzania Uganda
coverage
9
Powering Telecoms: East Africa Market Analysis GSMA Green Power for Mobile
Figure 4: Current Network Size (numbers and growth)3
Growth context of base station sites
The three countries combined have a total network of 13,225 base station sites as of 2012. Kenya has the highest number of base station sites at 5,565 sites followed by Tanzania at 4,593 sites and Uganda at 3,067 sites. Uganda has seen a growth of over 36% in the number of sites over the last year while Kenya and Tanzania have recorded a growth of 27% and 25% respectively.
Power and Telecoms: Cost of Powering Telecoms
Power Sector: Current state of power infrastructure
The key indicators representing the overall state of the power sector in Kenya, Tanzania and Uganda are presented below.
Key Power Indicators
Kenya Tanzania Uganda
Population (million) 43.0 46.9 35.8
Installed capacity MW 1533 1051 550
Urban Electrification (%) 71 40 50
Rural Electrification (%) 12 2 5
Source IEA, World Bank 2011
Tanzania’s power sector has long been a major concern. Power consumption in Tanzania is low, electrification is limited, and supply is unreliable, even by the standards of other low-income countries in Africa. The country’s strong reliance on hydro-power leaves it vulnerable to climate variability.
Uganda has an emerging national power grid, with regional interconnections planned. The power generation plants are mainly located around Lake Victoria, though a number of planned projects are underway in other parts. The transmission grid covers a substantial portion of the country, but excludes the extreme northeast.
Kenya’s power sector has improved over the years with various efficiency measures across generation, transmission and distribution. The distribution sub-sector has attracted investments to improve the quality of supply and efficiency of power distribution, as well as to expand the access infrastructure with the aim to bring over 300,000 new connections every year.
Power and Telecoms: Impact of Power infrastructure on telecoms
Of the total 13,225 base station sites covering the population of the East African region, 9,957 are located in areas having access to the grid and currently draw power from the commercial grid as a primary source. The remaining 3,268 base station sites are off-grid and are located in areas without access to the grid. The off-grid sites rely on diesel generators to power their equipment.
3 GSMA GPM East Africa Market Research and Analysis
4,367 3,671
2,246
10,284
5,565 4,593
3,067
13,225
0
2,000
4,000
6,000
8,000
10,000
12,000
14,000
Kenya Tanzania Uganda Total
No. of Base Station Sites (by Country)
2011 2012
10
Powering Telecoms: East Africa Market Analysis GSMA Green Power for Mobile
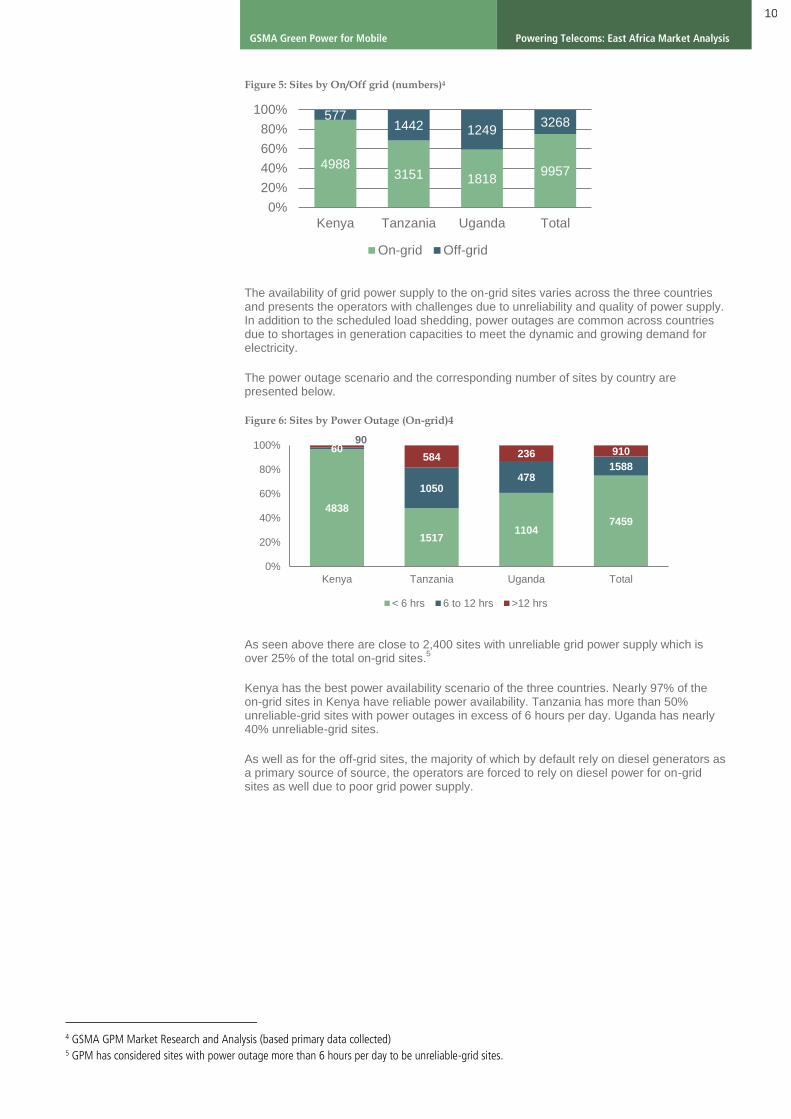
Figure 5: Sites by On/Off grid (numbers)4
The availability of grid power supply to the on-grid sites varies across the three countries and presents the operators with challenges due to unreliability and quality of power supply. In addition to the scheduled load shedding, power outages are common across countries due to shortages in generation capacities to meet the dynamic and growing demand for electricity.
The power outage scenario and the corresponding number of sites by country are presented below.
Figure 6: Sites by Power Outage (On-grid)4
As seen above there are close to 2,400 sites with unreliable grid power supply which is over 25% of the total on-grid sites.
5
Kenya has the best power availability scenario of the three countries. Nearly 97% of the on-grid sites in Kenya have reliable power availability. Tanzania has more than 50% unreliable-grid sites with power outages in excess of 6 hours per day. Uganda has nearly 40% unreliable-grid sites.
As well as for the off-grid sites, the majority of which by default rely on diesel generators as a primary source of source, the operators are forced to rely on diesel power for on-grid sites as well due to poor grid power supply.
4 GSMA GPM Market Research and Analysis (based primary data collected) 5 GPM has considered sites with power outage more than 6 hours per day to be unreliable-grid sites.
4988 3151 1818
9957
577 1442 1249
3268
0%
20%
40%
60%
80%
100%
Kenya Tanzania Uganda Total
On-grid Off-grid
4838
1517 1104
7459
60
1050 478
1588
90
584 236 910
0%
20%
40%
60%
80%
100%
Kenya Tanzania Uganda Total
< 6 hrs 6 to 12 hrs >12 hrs
11
Powering Telecoms: East Africa Market Analysis GSMA Green Power for Mobile
Power and Telecoms: Costs of Powering
The poor power infrastructure and limited grid power access has led to relying heavily on diesel generators for off-grid as well as on-grid sites. The diesel generator power is expensive and has become a major chunk of the costs of running a base station sites.
The powering costs of a telecom base station site can be divided in to direct energy costs and indirect maintenance and operations costs.
Direct costs Indirect costs
On-grid Grid power costs, Cost of grid power outage (diesel backup power costs)
Power equipment maintenance including diesel generators and other power systems components, battery maintenance, and overheads
Off-grid Diesel power costs Equipment maintenance including diesel generators, battery maintenance, and overheads
GPM has analysed the cost structure for an off-grid and on-grid sites based on the current power solutions deployed on the site.
All three countries have a similar cost structure for powering an off-grid site. The major cost components and their share in the total cost of powering an off-grid site is presented below. Diesel constitutes around 69% of the total cost, and the remaining 31% for maintenance and other diesel overheads.
Figure 7: Powering Cost Structure (On/Off-grid)6
Powering Cost Structure (on-grid)
The cost structure of powering an on-grid site varies across the three countries depending on the reliability and availability of the grid’s power supply. Overall, diesel is a major cost item accounting for 46% of total costs followed by grid power which accounts for 33% of the total cost of powering an on-grid site.
For Tanzania and Uganda, diesel costs are a major chunk of the total costs of powering an on-grid site due to poor grid power supply. On the contrary, in Kenya, grid power accounts for a major portion of the energy costs for a grid-connected site.
6 GSMA GPM Analysis (based on current power solutions deployed)
69%
18%
13%
Powering Cost Structure (off-grid)
Direct: Diesel
Indirect:Maintenance
Indirect: Diesellogistics
55%
18% 26% 33%
32%
57% 50%
46%
8% 15% 14% 12%
6% 11% 10% 9%
Kenya Tanzania Uganda Overall
Indirect: Diesel logistics
Indirect: Maintenance
Direct: Diesel
Direct: Electricity
12
Powering Telecoms: East Africa Market Analysis GSMA Green Power for Mobile
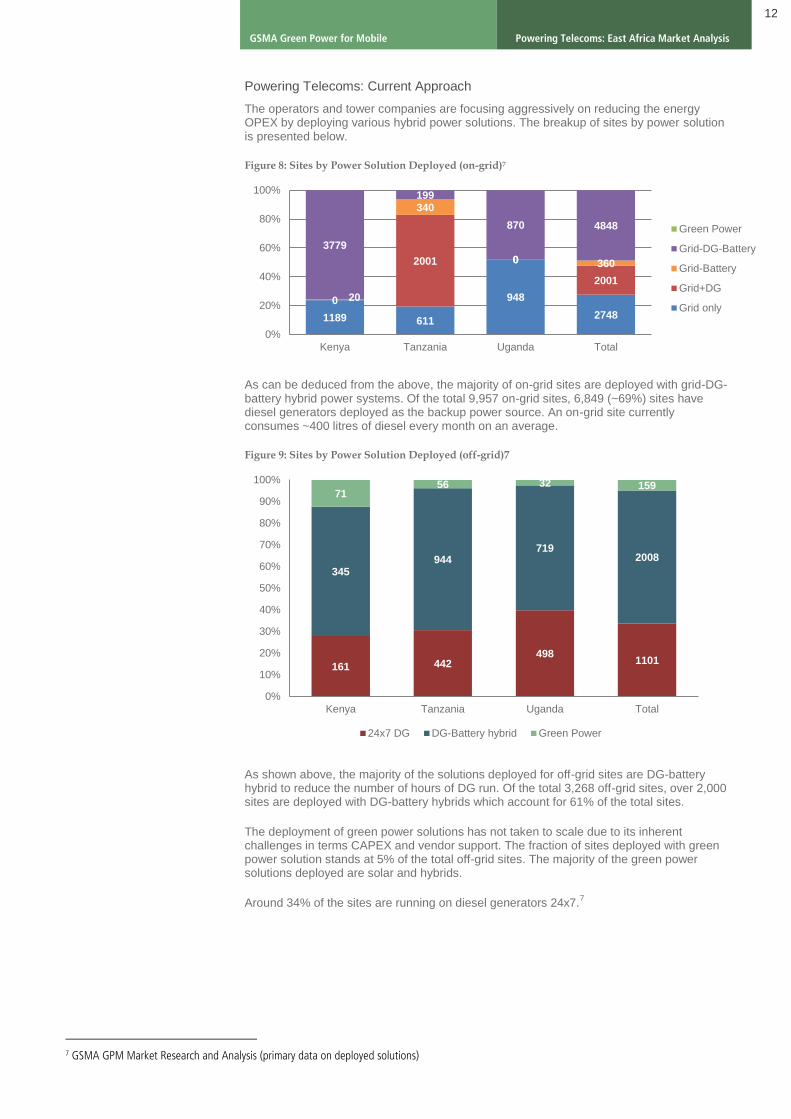
Powering Telecoms: Current Approach
The operators and tower companies are focusing aggressively on reducing the energy OPEX by deploying various hybrid power solutions. The breakup of sites by power solution is presented below.
Figure 8: Sites by Power Solution Deployed (on-grid)7
As can be deduced from the above, the majority of on-grid sites are deployed with grid-DG-battery hybrid power systems. Of the total 9,957 on-grid sites, 6,849 (~69%) sites have diesel generators deployed as the backup power source. An on-grid site currently consumes ~400 litres of diesel every month on an average.
Figure 9: Sites by Power Solution Deployed (off-grid)7
As shown above, the majority of the solutions deployed for off-grid sites are DG-battery hybrid to reduce the number of hours of DG run. Of the total 3,268 off-grid sites, over 2,000 sites are deployed with DG-battery hybrids which account for 61% of the total sites.
The deployment of green power solutions has not taken to scale due to its inherent challenges in terms CAPEX and vendor support. The fraction of sites deployed with green power solution stands at 5% of the total off-grid sites. The majority of the green power solutions deployed are solar and hybrids.
Around 34% of the sites are running on diesel generators 24x7.7
7 GSMA GPM Market Research and Analysis (primary data on deployed solutions)
1189 611
948
2748
0
2001 0
2001
20
340
0 360
3779
199
870 4848
0%
20%
40%
60%
80%
100%
Kenya Tanzania Uganda Total
Green Power
Grid-DG-Battery
Grid-Battery
Grid+DG
Grid only
161 442 498
1101
345 944
719 2008
71 56 32 159
0%
10%
20%
30%
40%
50%
60%
70%
80%
90%
100%
Kenya Tanzania Uganda Total
24x7 DG DG-Battery hybrid Green Power
13
Powering Telecoms: East Africa Market Analysis GSMA Green Power for Mobile
Figure 10: Power Solution Deployed (off-grid) - Green Power Break-up
On an average, an off-grid site consumes 1080 litres of diesel every month based on current power solutions deployed at these sites, as above.
Powering Telecoms: Context
Operational Challenges
The network operator is presented with many challenges in running the network. The poor situation of grid power infrastructure in the region adds up to the cost of powering a base station site. The reliance on diesel power for both on-grid and off-grid sites, puts pressure on the operations and increases the cost of running the network.
Aside from the energy costs, the operator is faced with operational challenges in terms of diesel pilferage, theft or tampering of equipment and damage of site security systems etc. This prevents efficient monitoring and control of the site.
Moreover, grid extension to existing off-grid sites is a challenge due to the distance of the nearby grid point from the site and implementation hurdles including the difficulty in obtaining right-of-way for extending the power line.
Grid power availability and the quality of this power supply is another challenge which increases the energy costs of running a site.
Growth Challenges
Nearly 96% of the uncovered population is rural and live in off-grid locations without access to electricity. Therefore, the future growth in network access needs to be in rural, off-grid locations. This poses huge infrastructure and operational challenges adding to the cost of running the network in rural off-grid locations.
Moreover, the lower ARPUs of rural off-grid population present challenges to the economic viability of network investments. The rural off-grid sites are higher OPEX sites due to heavy dependence on diesel generators for powering the equipment.
33.7%
61.4%
0.3%
1.9%
2.7%
4.9%
Power wise Break-up (Off-grid)
24x7 DG
DG-Battery hybrid
Solar hybrid
Solar-Wind hybrid
Solar-DG hybrid
14
Powering Telecoms: East Africa Market Analysis GSMA Green Power for Mobile
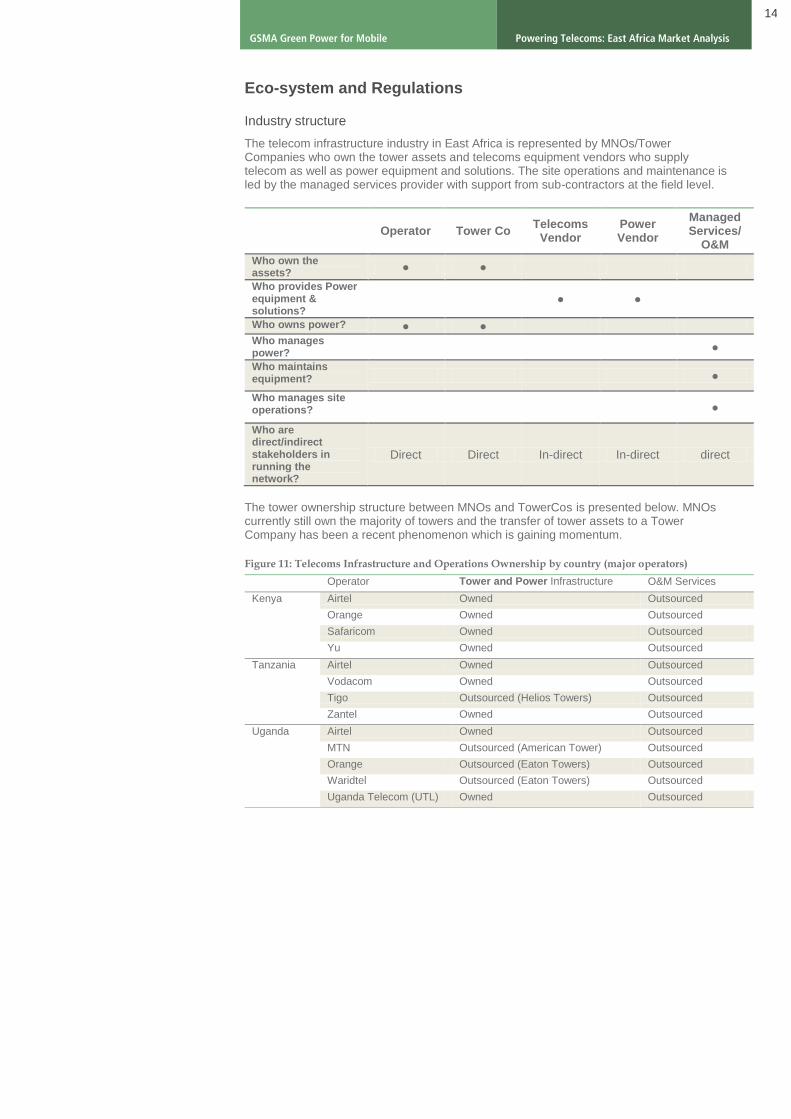
Eco-system and Regulations
Industry structure
The telecom infrastructure industry in East Africa is represented by MNOs/Tower Companies who own the tower assets and telecoms equipment vendors who supply telecom as well as power equipment and solutions. The site operations and maintenance is led by the managed services provider with support from sub-contractors at the field level.
Operator Tower Co Telecoms
Vendor Power Vendor
Managed Services/
O&M
Who own the assets?
● ●
Who provides Power equipment & solutions?
● ●
Who owns power? ● ●
Who manages power?
●
Who maintains equipment? ●
Who manages site operations? ●
Who are direct/indirect stakeholders in running the network?
Direct Direct In-direct In-direct direct
The tower ownership structure between MNOs and TowerCos is presented below. MNOs currently still own the majority of towers and the transfer of tower assets to a Tower Company has been a recent phenomenon which is gaining momentum.
Figure 11: Telecoms Infrastructure and Operations Ownership by country (major operators)
Operator Tower and Power Infrastructure O&M Services
Kenya Airtel Owned Outsourced
Orange Owned Outsourced
Safaricom Owned Outsourced
Yu Owned Outsourced
Tanzania Airtel Owned Outsourced
Vodacom Owned Outsourced
Tigo Outsourced (Helios Towers) Outsourced
Zantel Owned Outsourced
Uganda Airtel Owned Outsourced
MTN Outsourced (American Tower) Outsourced
Orange Outsourced (Eaton Towers) Outsourced
Waridtel Outsourced (Eaton Towers) Outsourced
Uganda Telecom (UTL) Owned Outsourced
15
Powering Telecoms: East Africa Market Analysis GSMA Green Power for Mobile
Regulatory Environment
A snapshot of the regulatory environment with respect to green power for the three East African countries is presented below.
Green Regulations Power sector vision
Kenya To have a Directorate who is responsible for renewable energy policies and a designated Renewable Energy Lead Agency to promote and accelerate the exploitation of renewable energy resources
The Lead Agency will provide a one stop shop for information and guidance to investors for renewable energy projects
To formulate and implement a national strategy for renewable energies
Kenya Vision 2030 identifies energy as one of the infrastructure enablers of its social and economic development
Key focus on developing sustainable, affordable and reliable energy for all citizens
Tanzania The MEM, EWURA and the REA to develop the framework for renewable energy projects.
The framework will foresee a Standardised Power Purchase Agreement (SPPA), Standardised Power Tariff Methodology, and a Standardised Power Tariff (SPT)
The 2009 Electricity Act has opened the Tanzanian electricity sector for private companies
Key focus to increase generation capacity, efficiency and access to electricity
Target to raise electrification to 30 % of total population by 2015
Uganda Renewable energy policy in place and published by the Ministry for Energy, Minerals and Development (MEMD) in 2007
Objectives include increasing access to modern, affordable and reliable energy services as a contribution to poverty eradication. This comprises general public access to electricity and enhancing the modernisation of biomass conversion technologies.
The overall policy goal is: “To increase the use of modern renewable energy, from the current 4% to 61% of the total energy consumption by the year 2017”
National Development Plan 2010-2014/15 sets forth development objectives for the energy sector
To focus on generation ramp up, transmission network extension, the promotion of energy efficiency in the supply side and the strengthening of the institutional and regulatory framework for energy
To create Energy Fund to provide a public financing source to support or leverage private sector financing, in addition to providing for the construction of hydropower projects and the associated infrastructure.
16
Powering Telecoms: East Africa Market Analysis GSMA Green Power for Mobile
Powering Telecoms: Green Telecoms and the Size
The Green Choices
The choice of green power technology between solar, wind, biomass, fuel cell and pico-hydro has been studied and analysed for fit and presented as following.
Green Choice: Solar
Solar energy is one of the most ubiquitously available sources of clean energy and the most suitable for distributed power generation bringing power generation to where it is needed, thus suits for applications such as telecoms. Unlike other sources of clean energy it is widely scalable owing to its modular technology to match future increase in load. However, solar technology presents challenges in terms of high upfront CAPEX and high space requirements for deploying the plant.
All three countries Kenya, Tanzania and Uganda have similar solar energy potential and present good opportunities for deploying solar power plants for telecom applications. The market fit for solar is presented below.
Green Fit: Availability vs. Acceptance
Country Availability Reliability Market Acceptance
Supply Chain Readiness
Kenya Very Good Good Good Good
Tanzania Very Good Good Good Good
Uganda Very Good Good Good Good
Green Fit: Potential vs. Adoption
Country Stage of Adoption Resource Potential
Barriers to Adoption
Risks of Adoption
Kenya Commercial High High initial CAPEX
Space requirements
Scarcity of external funding
Operational risk in terms of local challenges in theft and breaking of solar panels
Reliability issues due to variation in weather
Tanzania Commercial High Same as above Same as above
Uganda Commercial High Same as above Same as above
17
Powering Telecoms: East Africa Market Analysis GSMA Green Power for Mobile
Green Choice: Wind
Wind is one of the traditional green energy resources and established as a cost effective source of green energy on mW scale deployments. Its adoption for small scale distributed energy generation has been hindered due to higher regular maintenance costs, low reliability due to variability in wind speed characteristics and risks of investment. It has been adopted in combination with other green technologies such as solar for telecom applications where there is a good potential for OPEX savings.
The wind potential for Kenya, Tanzania and Uganda is pocketed in coastal regions and its adoption has not gone beyond the pilot stage. The market fit for wind is presented below.
Green Fit: Availability vs. Acceptance
Country Availability Reliability Market Acceptance
Supply Chain Readiness
Kenya Satisfactory Satisfactory Poor Good
Tanzania Satisfactory Satisfactory Poor Good
Uganda Satisfactory Satisfactory Poor Good
Green Fit: Potential vs. Adoption
Country Stage of Adoption Resource Potential
Barriers to Adoption
Risks of Adoption
Kenya Pilot Low (Except Coastal region)
Reliability of power generation
Low scalability High
investment
Operational risk in terms of variability in wind speeds and unreliable power generation characteristics
Tanzania N/A Same as above As above As above
Uganda N/A Same as above As above As above
18
Powering Telecoms: East Africa Market Analysis GSMA Green Power for Mobile
Green Choice: Biomass
Biomass falls lower in the choice in of technology, however presents good opportunity for small scale distributed energy generation. The technology is traditionally available and has been gaining adoption with innovative use of biomass options. The adoption of biomass for telecom application however, is presented with its own challenges in terms of operational complexity and scalability, supply integration and sustainability.
All three countries in the region traditionally provide good potential for adoption of biomass based energy generation owing to the availability of agricultural residues for inputs. However, the adoption for telecom application is at very initial stages and pilots are yet to be established. The market fit for biomass is presented below.
Green Fit: Availability vs. Acceptance
Country Availability Reliability Market Acceptance
Supply Chain Readiness
Kenya Satisfactory Good Poor Poor
Tanzania Good Good Poor Poor
Uganda Good Good Poor Poor
Green Fit: Potential vs. Adoption
Country Stage of Adoption
Resource Potential
Barriers to Adoption
Risks of Adoption
Kenya Pre-Pilot Medium Operational complexity
Supply challenges
Pre-pilot stage and unproven operational feasibility
Biomass supply and sustainability
Reliability issues due to breakage in supply links
Tanzania Pre-Pilot Same as above Same as above Same as above
Uganda Pre-Pilot Same as above Same as above Same as above
19
Powering Telecoms: East Africa Market Analysis GSMA Green Power for Mobile
Green Choice: Fuel Cell
Over the years, fuel cell technology has seen various innovations including the fuel types and generation technology. Fuel cells based on hydrogen as the fuel are most popular and is the cleanest fuel due to its 100% burning characteristics. However, its adoption is hindered due to high initial CAPEX, availability and supply of hydrogen fuel and high replacement cost (almost 25-30% of CAPEX) of cells every 5-6 years.
For the three countries in East Africa, reliable hydrogen fuel supply is a challenge and fuel supply chain integration is yet to be established. The market wise fit for fuel cell is presented below.
Green Fit: Availability vs. Acceptance
Country Availability Reliability Market Acceptance
Supply Chain Readiness
Kenya Poor Good Poor Poor
Tanzania Poor Good Poor Poor
Uganda Poor Good Poor Poor
Green Fit: Potential vs. Adoption
Country Stage of Adoption
Resource Potential
Barriers to Adoption
Risks of Adoption
Kenya Pre-Pilot Medium High initial CAPEX
Hydrogen fuel supply
OPEX Savings not yet established
High replacement cost of fuel cells
Reliability of fuel supply
Tanzania Pre-Pilot Same as above Same as above Same as above
Uganda Pre-Pilot Same as above Same as above Same as above
20
Powering Telecoms: East Africa Market Analysis GSMA Green Power for Mobile
Green Choice: Hydro (Pico)
Hydro power in its most traditional form of clean energy and its adoption so far at small scale distributed generation has been limited due to availability of technology and suppliers. Other challenges for telecom application include the availability of water body resources adjacent to or near to the site location. The CAPEX requirements and potential business case for telecom applications is yet to be known.
The market fit for pico-hydro is presented below.
Green Fit: Availability vs. Acceptance
Country Availability Reliability Market Acceptance
Supply Chain Readiness
Kenya Poor Good Poor Poor
Tanzania Poor Good Poor Poor
Uganda Poor Good Poor Poor
Green Fit: Potential vs. Adoption
Country Stage of Adoption
Resource Potential
Barriers to Adoption
Risks of Adoption
Kenya Pre-Pilot ? Low market awareness
Availability of water body close to tower locations
Cost of technology
Regulatory clearance
Operational risks associated with limited knowledge and readiness
Tanzania N/A Same as above Same as above Same as above
Uganda N/A Same as above Same as above Same as above
The evaluation of the various green choices versus traditional choices in terms of the OPEX savings potential for off-grid telecom sites are presented below along together with their availability and ease of adoption. The colour of the bubble indicates the greenness of solutions.
21
Powering Telecoms: East Africa Market Analysis GSMA Green Power for Mobile
Figure 12: OPEX Savings Potential vs. Ease of Adoption and Availability
As shown above, grid power presents the best possible OPEX savings potential for off-grid sites when compared with other available options. However, the availability and reliability of grid power supply in these three East African countries is limited, Kenya being leader in terms of grid power availability and reliability of supply. Additionally, due to poor grid supply infrastructure, extending grid to off-grid site locations is a challenge due to the higher CAPEX required and the implementation issues in terms of obtaining right-of-way clearance for extending the grid line.
Powering Telecoms: The Green Shades under the Tower (Current Deployments)
The use of green power for powering the telecom base station sites is still at the initial stages of commercial adoption. The barriers cited in the previous section remain as challenges for scaling the adoption of green power for telecoms.
Despite a good OPEX savings potential, very few number of the total potential sites are currently deployed with green power solutions. Currently only 4% of the total potential 4,178 sites including off-grid and unreliable grid are deployed with green power alternatives to power the telecom base station sites.
Figure 13: Green Power vs. other power solutions (current deployments)
26%
48%
4%
22% 24x7 DG
DG-Battery hybrid
Green Power
Unreliable Grid
22
Powering Telecoms: East Africa Market Analysis GSMA Green Power for Mobile
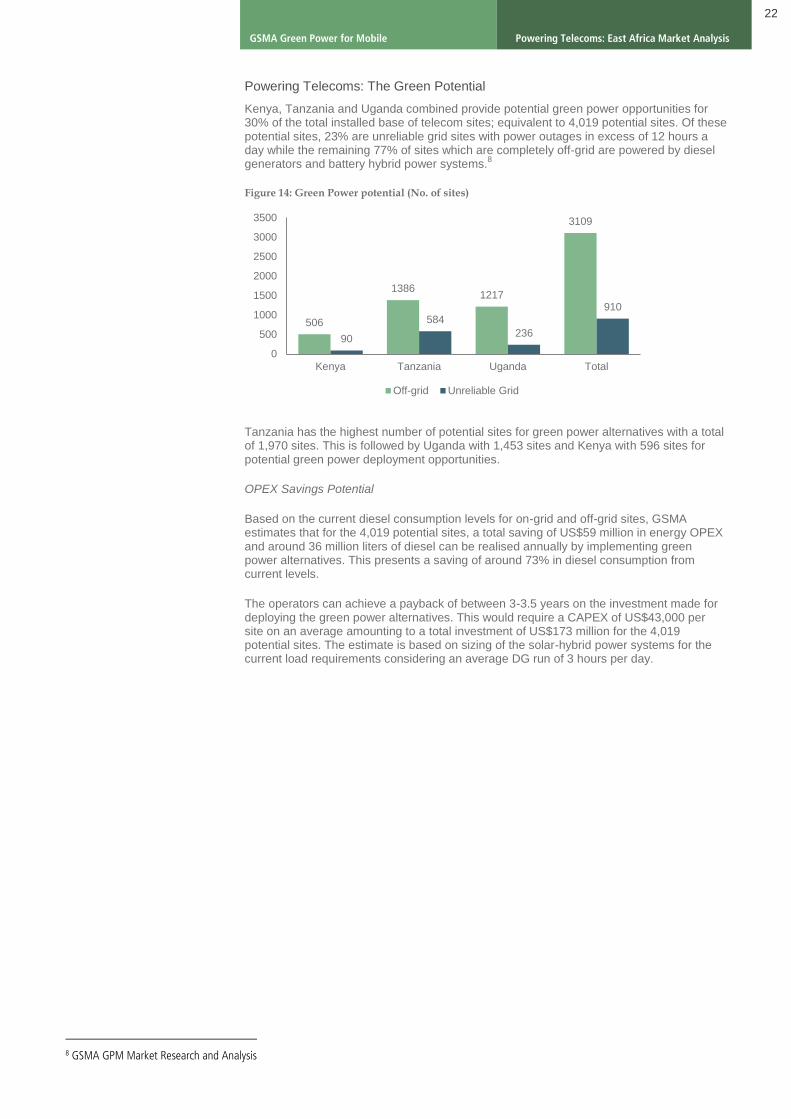
Powering Telecoms: The Green Potential
Kenya, Tanzania and Uganda combined provide potential green power opportunities for 30% of the total installed base of telecom sites; equivalent to 4,019 potential sites. Of these potential sites, 23% are unreliable grid sites with power outages in excess of 12 hours a day while the remaining 77% of sites which are completely off-grid are powered by diesel generators and battery hybrid power systems.
8
Figure 14: Green Power potential (No. of sites)
Tanzania has the highest number of potential sites for green power alternatives with a total of 1,970 sites. This is followed by Uganda with 1,453 sites and Kenya with 596 sites for potential green power deployment opportunities.
OPEX Savings Potential
Based on the current diesel consumption levels for on-grid and off-grid sites, GSMA estimates that for the 4,019 potential sites, a total saving of US$59 million in energy OPEX and around 36 million liters of diesel can be realised annually by implementing green power alternatives. This presents a saving of around 73% in diesel consumption from current levels.
The operators can achieve a payback of between 3-3.5 years on the investment made for deploying the green power alternatives. This would require a CAPEX of US$43,000 per site on an average amounting to a total investment of US$173 million for the 4,019 potential sites. The estimate is based on sizing of the solar-hybrid power systems for the current load requirements considering an average DG run of 3 hours per day.
8 GSMA GPM Market Research and Analysis
506
1386 1217
3109
90
584
236
910
0
500
1000
1500
2000
2500
3000
3500
Kenya Tanzania Uganda Total
Off-grid Unreliable Grid
23
Powering Telecoms: East Africa Market Analysis GSMA Green Power for Mobile
Powering Telecoms: The way forward
Growth forecast and Powering outlook
Short term
Based on the feedback from the operators and tower companies, GSMA estimates that in the short term the number of base station sites will increase from the current 13,225 sites to 14,560 sites by 2013 at a growth rate of around 10%. The corresponding growth in number of base station sites for each country is presented below.
9
Figure 15: Growth (No. of sites) - short term
In the short term most of the off-grid sites are expected to be powered by DG-battery hybrid power systems as an OPEX reduction measure. The short term outlook for powering the sites by solution category is presented below. The inner ring shows the current scenario and outer ring shows the expected short term powering scenario.
Figure 16: Powering Outlook - short term
The share of 24x7 DG sites reduces to 2% from the current 9% levels while increasing the share of DG-Battery hybrid by 3%, Green Power and Grid power by 2% each in the total number of sites.
10
9 GSMA GPM Market Research and Analysis (based on primary data for new rollouts) 10 GSMA GPM Market Research and Analysis (based on planned deployments data)
5,565 4,593
3,067
13,225
5,865 5,474
3,221
14,560
Kenya Tanzania Uganda Total
Growth of Base Stations
2012 2013
9%
15%
1%
75%
2%
18%
3%
77%
24x7 DG
DG-Battery hybrid
Green Power
Grid
24
Powering Telecoms: East Africa Market Analysis GSMA Green Power for Mobile
Long term
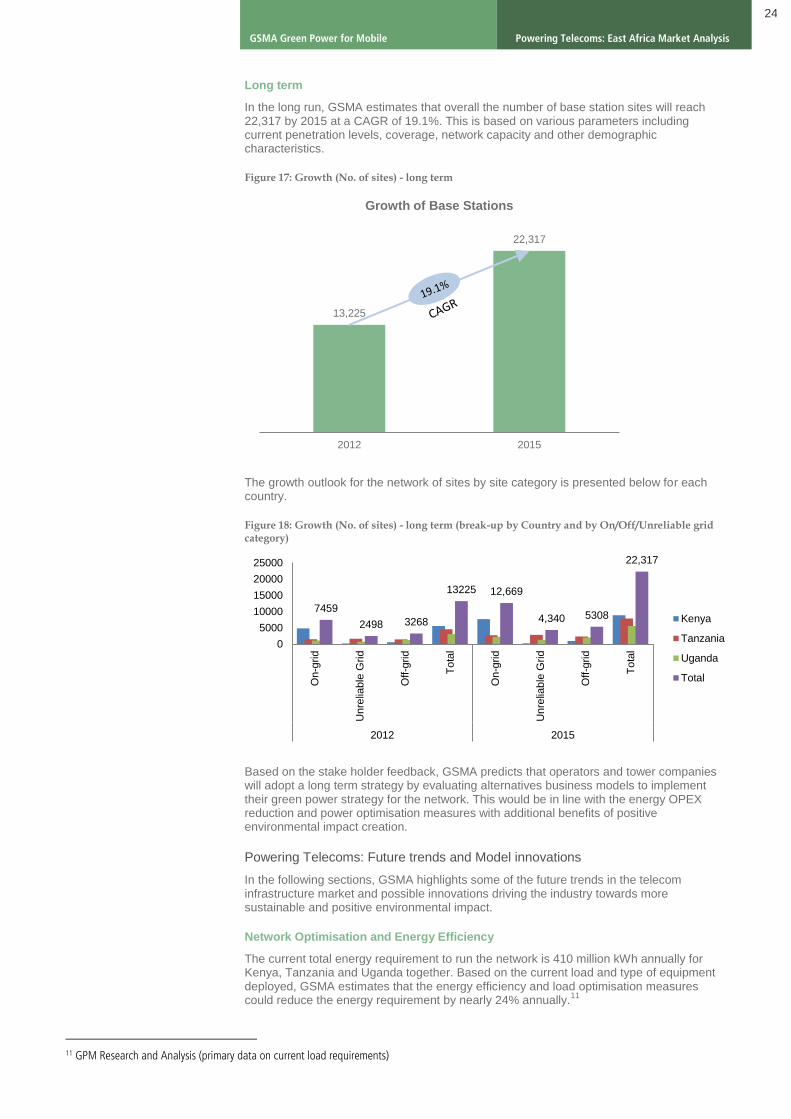
In the long run, GSMA estimates that overall the number of base station sites will reach 22,317 by 2015 at a CAGR of 19.1%. This is based on various parameters including current penetration levels, coverage, network capacity and other demographic characteristics.
Figure 17: Growth (No. of sites) - long term
The growth outlook for the network of sites by site category is presented below for each country.
Figure 18: Growth (No. of sites) - long term (break-up by Country and by On/Off/Unreliable grid category)
Based on the stake holder feedback, GSMA predicts that operators and tower companies will adopt a long term strategy by evaluating alternatives business models to implement their green power strategy for the network. This would be in line with the energy OPEX reduction and power optimisation measures with additional benefits of positive environmental impact creation.
Powering Telecoms: Future trends and Model innovations
In the following sections, GSMA highlights some of the future trends in the telecom infrastructure market and possible innovations driving the industry towards more sustainable and positive environmental impact.
Network Optimisation and Energy Efficiency
The current total energy requirement to run the network is 410 million kWh annually for Kenya, Tanzania and Uganda together. Based on the current load and type of equipment deployed, GSMA estimates that the energy efficiency and load optimisation measures could reduce the energy requirement by nearly 24% annually.
11
11 GPM Research and Analysis (primary data on current load requirements)
13,225
22,317
2012 2015
Growth of Base Stations
7459
2498 3268
13225 12,669
4,340 5308
22,317
0
5000
10000
15000
20000
25000
On-g
rid
Unre
liable
Grid
Off-g
rid
To
tal
On-g
rid
Unre
liable
Grid
Off-g
rid
To
tal
2012 2015
Kenya
Tanzania
Uganda
Total
25
Powering Telecoms: East Africa Market Analysis GSMA Green Power for Mobile
On average an indoor site consumes 43,800 kWh of energy annually while the energy requirement for an outdoor site is 23,650 kWh per year. The breakup of network in terms of number of indoor and outdoor site for the three countries is presented below.
11
Network energy optimisation could save energy OPEX considerably and prepare the operators to utilise available green power alternatives such as solar energy - a viable option for low load requirements.
Structural change: Leading to Tower Company
The tower company approach to managing the telecom assets is gaining momentum in the region with the recent acquisitions of tower assets by tower companies.
The recent acquisitions include:
Africa based Helios Towers now owns and manages the tower portfolio of Tigo
Tanzania. Helios Towers also owns and manages tower assets in South Africa, Nigeria,
Ghana, and DRC.
Eaton Towers has recently closed tower acquisition deals with Orange and Waridtel in
Uganda. Eaton Towers has established its operations in Ghana and South Africa with
plans to expand into other East African countries.
American Tower Company (ATC) has acquired the tower assets of MTN Uganda. ATC
currently owns assets and operates in South Africa, Ghana and Uganda with plans to
expand into other countries in Africa.
The Pan-Africa Airtel group also has initiated transfer of its tower portfolio to its own separate tower company to offload ownership and management of its tower assets.
The move to a tower company model brings multiple benefits to the operator by reducing the operational burden of managing the passive infrastructure and improves focus for core telecom operations.
Supply Model Innovation: Emergence of Energy Service Company (ESCo)
A new model of energy supply to telecom base station sites is gaining initial attention with the entry of a third party energy service company (ESCo) to the eco-system. The emergence of the third party ESCo model would benefit the industry in many folds with the focus on energy as a service to the MNOs and tower companies.
In the ESCo model, the energy service company would completely own onsite power generation and supply of power to the base station sites thus reducing the burden of deploying and managing the power plant which currently is the responsibility of the network operator or tower company.
2026 1795
1047
4868
3539
2798
2020
8357
Kenya Tanzania Uganda Total
Indoor Outdoor
26
Powering Telecoms: East Africa Market Analysis GSMA Green Power for Mobile
Figure 19: 3rd party ESCo business models
Different business models exist including the fixed price model, power purchase agreement (PPA) model and energy service agreement model (ESA). However, of the three models, the PPA model is the most popular and simple in terms of managing the terms and SLAs. In the PPA model the ESCo provides energy on a per kWh basis based on an agreed PPA price.
The opportunity for an ESCo model based on a PPA
The potential business opportunity for an ESCo model is presented below.
Based on the current energy and powering costs as of 2012, GSMA estimates that a potential of over 5,700 sites would be viable for the third party ESCo outsourced model.
Considering the current load requirements for the potential 5,700 sites, GSMA estimates that at a PPA rate of US$0.5 per kWh, the current market opportunity for an ESCo stands at ~ US$92 million annually. The market potential for an ESCo model would reach US$155 million per annum by 2015.
Figure 20: Market Potential - 3rd party ESCo business model
92.2
155.3
0
20
40
60
80
100
120
140
160
180
2012 2015
Mil
lio
ns
ESCo Market Value (million US $)
27
Powering Telecoms: East Africa Market Analysis GSMA Green Power for Mobile
Payback and IRR
The third party ESCo would be achieving an IRR of 22-31% for the investment into the OPEX model and for providing power based on a PPA model. The payback period for the investment would be 3-4 years based on the expected return of investment.
Services Innovation: Tapping the Community Power Potential
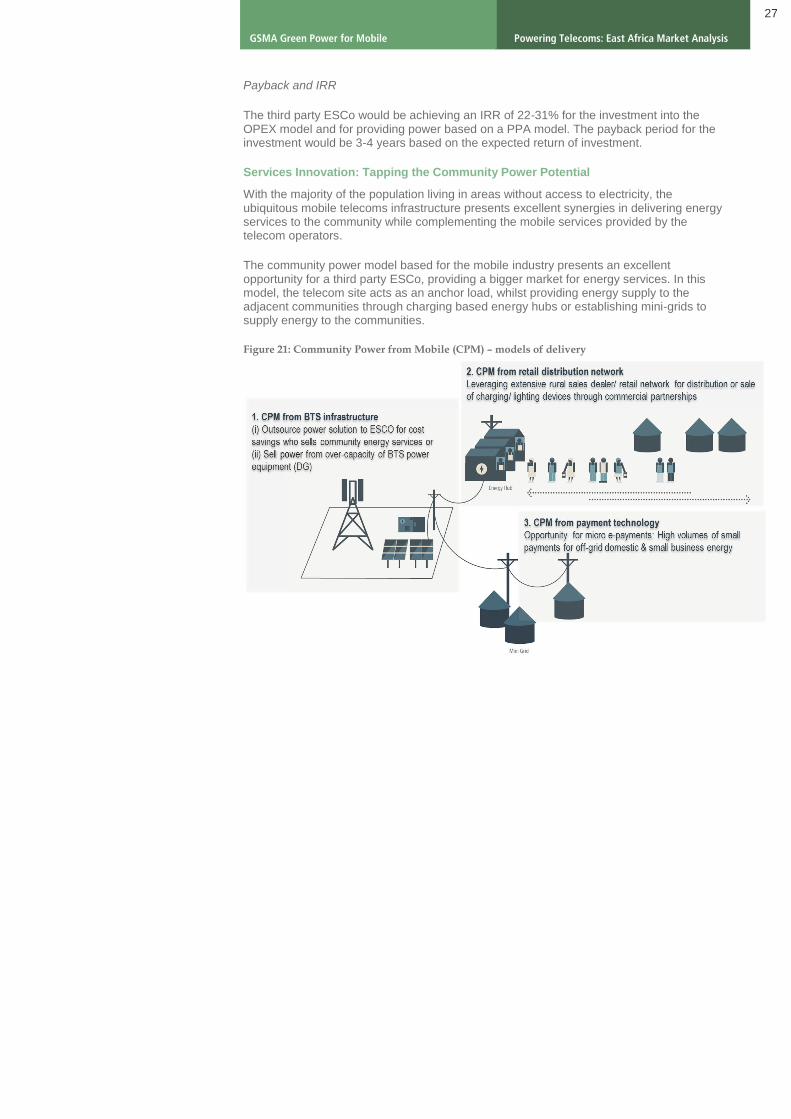
With the majority of the population living in areas without access to electricity, the ubiquitous mobile telecoms infrastructure presents excellent synergies in delivering energy services to the community while complementing the mobile services provided by the telecom operators.
The community power model based for the mobile industry presents an excellent opportunity for a third party ESCo, providing a bigger market for energy services. In this model, the telecom site acts as an anchor load, whilst providing energy supply to the adjacent communities through charging based energy hubs or establishing mini-grids to supply energy to the communities.
Figure 21: Community Power from Mobile (CPM) – models of delivery
28
Powering Telecoms: East Africa Market Analysis GSMA Green Power for Mobile
Conclusion
The MNOs and Tower Companies in Kenya, Tanzania and Uganda are presented with various challenges in terms of powering the network. The MNOs and tower companies have taken various measures to reduce the energy OPEX including the use of battery hybrids and green power alternatives. However, the adoption of green power for powering the telecoms infrastructure is at an early stage and requires regulatory support along with business model innovations to accelerate investments and promote a more sustainable approach for powering the telecoms infrastructure while reducing the energy OPEX.
About the GSM Association
The GSMA represents the interests of mobile operators worldwide. Spanning 220 countries, the GSMA unites nearly 800 of the world’s mobile operators, as well as more than 200 companies in the broader mobile ecosystem, including handset makers, software companies, equipment providers, Internet companies, and media and entertainment organisations. The GSMA also produces industry-leading events such as the Mobile World Congress and Mobile Asia Congress.
About Mobile for Development: Serving the underserved through mobile
GSMA Mobile for Development brings together our mobile operator members, the wider mobile industry and the development community to drive commercial mobile services for underserved people in emerging markets. We identify opportunities for social, economic impact and stimulate the development of scalable, life-enhancing mobile services.
For more information on the GSMA’s Green Power for Mobile, please email [email protected]