29
1 Powering Telecoms: West Africa Market Analysis GSMA Green Power for Mobile Powering Telecoms: West Africa Market Analysis Sizing the Potential for Green Telecoms in Nigeria and Ghana

1
Powering Telecoms: West Africa Market Analysis GSMA Green Power for Mobile
Powering Telecoms: West Africa Market Analysis Sizing the Potential for Green Telecoms in Nigeria and Ghana

2
Powering Telecoms: West Africa Market Analysis GSMA Green Power for Mobile
Contents
Executive Summary ........................................................................................................... 6
1. Powering Telecoms: Current State of Affairs ......................................................... 7
1.1 Telecoms: The Growth Context .................................................................................. 7
1.1.1 Subscribers, Penetration and Coverage ............................................................................ 7 1.1.2 Size of the Mobile Network ................................................................................................ 8
1.2 Power and Telecoms: Cost of Powering Telecoms..................................................... 8
1.2.1 Power Sector: Current state of power infrastructure in Ghana and Nigeria ........................ 9 1.2.2 Power and Telecoms: Impact of Power infrastructure on Telecoms ................................... 9 1.2.3 Power and Telecoms: Costs of Powering ........................................................................ 11
1.3 Powering Telecoms: Current Approach .................................................................... 12
1.4 Powering Telecoms: The Overall Context ................................................................. 13
1.4.1 The Context of Powering Telecoms in Ghana .................................................................. 13 1.4.2 The Context of Powering Telecoms in Nigeria ................................................................. 14
2. Industry and Regulations ............................................................................................ 15
2.1 Industry Structure ...................................................................................................... 15
2.1.1 Tower Outsourcing Scenario ........................................................................................... 15
2.2 Regulatory Environment ........................................................................................... 16
3. Powering Telecoms: Green Telecoms ....................................................................... 17
3.1 The Green Choices and their Market Fit for Telecoms ............................................. 17
3.1.1. Green Choice: Solar ....................................................................................................... 17 3.1.2 Green Choice: Wind ........................................................................................................ 18 3.1.3 Green Choice: Biomass ................................................................................................... 19 3.1.4 Green Choice: Fuel Cell .................................................................................................. 20 3.1.5 Green Choice: Hydro (Pico) ............................................................................................. 21
3.2 Powering Telecoms: The Green Shades under the Tower (Current Deployments) .. 22
3.2.1 The Challenges for Green Power Adoption ...................................................................... 22
3.3 Powering Telecoms: The Green Potential ................................................................ 22
3.3.1 OPEX Savings Potential .................................................................................................. 23
4. Powering Telecoms: The way forward ....................................................................... 24
4.1 Growth Forecast ....................................................................................................... 24
4.1.1 Short Term ...................................................................................................................... 24 4.1.2 Long Term ....................................................................................................................... 24 4.2.1 Network Optimisation and Energy Efficiency ................................................................... 25 4.2.2 Structural change: Leading to Tower Company ............................................................... 25 4.2.3 Supply Model Innovation: Emergence of Energy Service Company (ESCO) ................... 25 4.2.4 Services Innovation: Community Power .......................................................................... 26
Conclusion ....................................................................................................................... 28

3
Powering Telecoms: West Africa Market Analysis GSMA Green Power for Mobile
Objective
The Green Power for Mobile Market Analysis report for West Africa aims at providing market insights and highlight opportunities for telecom operators in the green power sector, in both Nigeria and Ghana.
The objectives of the report are to analyse the state of the telecom market and how networks are currently being powered in order to provide the readers with an understanding of the potential of alternative energy solutions, in particular green power. The report looks at various elements, including the industry structure, the regulatory environment and the current state of power within the telecom infrastructure, which impact the potential for green power solutions.
The report presents the current size of the market and takes a look at the future of green power for mobile as well as future trends, providing an overview of the market opportunity for 3
rd party outsourced energy model.
Approach
The Green Power Market Analysis for West Africa is based on information gathered using primary data collection through stakeholder interactions and questionnaires. The market analysis report also uses some generic market data collected through various secondary resources.

4
Powering Telecoms: West Africa Market Analysis GSMA Green Power for Mobile
Glossary
MNO: Mobile network operator or mobile operator
Tower Company: A company that manages a part or the entire assets of a telecom tower.
ESCOs: An energy service company that provides turnkey or end-to-end GPM solutions to
an operator for off-grid telecom BTS.
CAPEX Model: Mobile Operator or Tower Company invests CAPEX of their own to rollout
the renewable solution.
OPEX Model: A Renewable ESCO invests CAPEX to generator power at site level and
sells power to Mobile Operator or Tower Company.
Tenancy Ratio: A tenancy ratio is expressed as a fraction of the total number of operators
sharing towers/total number of sites present.
Off-grid site: Telecom Base Station Site which is NOT connected to the commercial Grid
power supply
On-grid site: Telecom Base Station Site which is connected to the commercial Grid power
supply
DG: Diesel Generator
IRR: Internal Rate of Return is the Rate of Return of an Investment
CAGR: Cumulative Annual Growth Rate
ARPU: Average Revenue per User of mobile services
PPA: Power Purchase Agreement
Figures and Tables
Figure 1: Subscribers and Penetration (numbers, growth)
Figure 2: Mobile Penetration vs. Network Coverage (% population, % land)
Figure 3: Current Mobile Network Size (numbers and growth)
Figure 4: The impact of reduced availability of grid power supply on Telecoms - Ghana
Figure 5: Sites by On/Off grid (numbers)
Figure 6: Sites by Grid Power Outage (On-grid)
Figure 7: Powering Cost Structure (On -grid)
Figure 8: Sites by Power Solution Deployed (on-grid)
Figure 9: Sites by Power Solution Deployed (off-grid)
Figure 10: Tower Ownership Structure: MNO vs. Tower Company
Figure 11: Solar Radiation Maps – Ghana and Nigeria
Figure 12: Wind Resource Maps – Ghana and Nigeria
Figure 13: Break-up of sites by grid status (numbers, overall %)
Figure 14: Green Power potential (No. of sites)

5
Powering Telecoms: West Africa Market Analysis GSMA Green Power for Mobile
Figure 15: Growth (No. of sites) - short term
Figure 16: Growth (No. of sites) - long term
Figure 17: 3rd party ESCO business models
Figure 18: Market Potential (Revenue) - 3rd party ESCO business model
Figure 19: Community Power from Mobile (CPM) – models of delivery
Table 1: Power Sector indicators – Ghana and Nigeria
Table 2: Telecoms Tower Ownership and Tenants
Table 3: Green Regulations and Power Sector Vision – Ghana and Nigeria

6
Powering Telecoms: West Africa Market Analysis GSMA Green Power for Mobile
Executive Summary
The mobile telecommunication market in Ghana and Nigeria has grown significantly, recording a subscription base of 24.9 and 107 million respectively. While the mobile penetration level has reached substantial levels at 99.7% and 85% respectively, the network coverage is still far from reaching the 20% of the population living in remote rural communities.
The total number of telecom towers stands at 29,835 sites providing mobile network coverage to around 80% of current population in these two countries. Nigeria has a whopping 24,252 telecom tower sites in total while Ghana has a network base of 5,583 sites.
Powering infrastructure for telecoms depends on the current state of power sector and therefore varies considerably across Ghana and Nigeria. Out of the total 24,252 telecom sites in Nigeria, around 52% of the sites are off-grid, i.e. located in places without access to grid power supply, against only 11% of in Ghana. The remaining sites are on-grid sites and have grid power supply of variable quality and reliability. Due to Nigeria’s poor grid power supply, over 81% of its on-grid sites suffer power outages for up to 6 hours a day.
Only 2% of off-grid sites are deployed with green power while the majority (~ 55% of off-grid sites) still rely heavily on diesel generator backup power, running 24x7. The remaining off-grid sites (43%) are deployed with battery hybrid solutions. Most of the on-grid sites have diesel generator as backup power source.
Based on the current network parameters, GSMA estimates that a total of 10,890 sites could convert to green power deployments in Ghana and Nigeria. Approximately
56% of these potential sites are off-grid and 44% are unreliable grid sites.
The current market opportunity for 3rd
party ESCO model stands at US$ 265 million every year at a PPA rate of 0.6 US$/kWh. The market potential is excluding the community power opportunity that an ESCO would consider as a business.
GSMA forecasts that the total number of telecom tower sites will reach 43,917 by 2015 at a CAGR of 13.8%, including Ghana and Nigeria. The ESCO market potential will reach US$405 million per annum by 2015.
7
Powering Telecoms: West Africa Market Analysis GSMA Green Power for Mobile
1. Powering Telecoms: Current State of Affairs
The telecom sector in Ghana and Nigeria has witnessed a tremendous change over the years with major multinational telecom operators venturing into these markets. Ghana, with a total of six mobile operators (including five GSM and one CDMA), has become a vibrant market reaching mobile service penetration levels close to 100% of the population. Nigeria, with an active subscriber base of over 100 million, has also been an exciting and challenging market counting a total of nine mobile operators including five GSM and four CDMA operators.
Both markets have seen stiff competition over the years characterised by declining prices, increased cost of operations and declining ARPUs. The power infrastructure in Nigeria and Ghana has played a major role in the growth of mobile telecommunications in terms of coverage and has tremendously impacted the operations and costs of running the network
In the following sections GSMA analyses the current state of the mobile telecoms sector in Nigeria and Ghana including:
The current growth context of telecoms
Powering infrastructure and its impact on growth of telecoms
Current approaches to powering telecoms
Challenges faced by telecom operators to power their networks.
1.1 Telecoms: The Growth Context
The growth context of telecoms in Kenya, Tanzania and Uganda in terms of subscribers and network coverage is presented in the following sections.
1.1.1 Subscribers, Penetration and Coverage
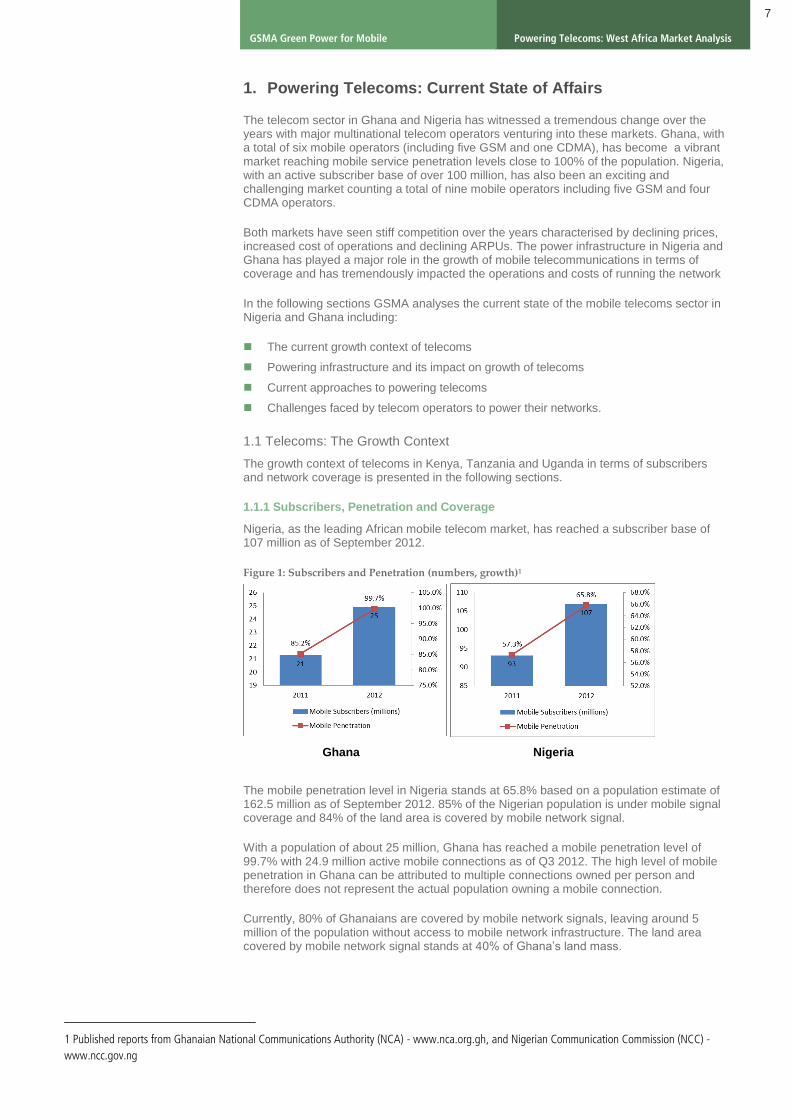
Nigeria, as the leading African mobile telecom market, has reached a subscriber base of 107 million as of September 2012.
Figure 1: Subscribers and Penetration (numbers, growth)1
The mobile penetration level in Nigeria stands at 65.8% based on a population estimate of 162.5 million as of September 2012. 85% of the Nigerian population is under mobile signal coverage and 84% of the land area is covered by mobile network signal.
With a population of about 25 million, Ghana has reached a mobile penetration level of 99.7% with 24.9 million active mobile connections as of Q3 2012. The high level of mobile penetration in Ghana can be attributed to multiple connections owned per person and therefore does not represent the actual population owning a mobile connection.
Currently, 80% of Ghanaians are covered by mobile network signals, leaving around 5 million of the population without access to mobile network infrastructure. The land area covered by mobile network signal stands at 40% of Ghana’s land mass.
1 Published reports from Ghanaian National Communications Authority (NCA) - www.nca.org.gh, and Nigerian Communication Commission (NCC) -
www.ncc.gov.ng
Ghana Nigeria

8
Powering Telecoms: West Africa Market Analysis GSMA Green Power for Mobile
Figure 2: Mobile Penetration vs. Network Coverage (% population, % land)2
Growth Context of Subscribers, Penetration and Coverage
Ghana and Nigeria recorded a subscriber growth of 17% and 14.8% respectively, relative to their 2011 subscriber base. From 2011 to 2012, the mobile penetration level has increased from 85.2% to 99.7% in Ghana, and from 57.3% in 2011 to 65.9% in Nigeria.2
The mobile network coverage for both Ghana and Nigeria has tremendously improved over the years, reaching 80% and 83% of the population under coverage respectively.
2
1.1.2 Size of the Mobile Network
The size of the mobile network, in light of the mobile coverage data provided above, can be attributed to various parameters including geographic and demographic parameters as well as the countries’ spectrum policies. The number of telecom tower sites (base station sites) and their growth across Ghana and Nigeria are illustrated below.
Figure 3: Current Mobile Network Size (numbers and growth)3
Growth of Mobile Networks
Nigeria, with a current network size of 24,252 tower sites, has grown at a rate of 15.3% from the network size of 21,043 in 2011. Ghana, for its part, recorded a growth of 27.6% reaching a current mobile network size of 5,583 tower sites in 2012.
3 The higher growth in
the number of telecom tower sites in Ghana can be attributed to the entry of its fifth GSM operator, GLO Mobile, in April 2011.
1.2 Power and Telecoms: Cost of Powering Telecoms
The growth and expansion of mobile telecom networks depends on key support infrastructure including power and transportation. Power supply infrastructure plays a major role in running the mobile network with a benchmark network uptime of 99.98% in order to maintain the reliability and quality of services.
An unreliable and poor power supply to the telecom tower sites hampers the efficient running of mobile telecom network’s operations. The key power sectors indicators and their
2 Published reports from National Communications Authority (NCA) - www.nca.org.gh, Ghana and Nigerian Communication Commission (NCC),
Nigeria - www.ncc.gov.ng
3 GSMA GPM market research and analysis

9
Powering Telecoms: West Africa Market Analysis GSMA Green Power for Mobile
impact on telecom operations in Nigeria and Ghana are presented in below sections.
1.2.1 Power Sector: Current state of power infrastructure in Ghana and Nigeria
Table 1: Key power sector indicators for Nigeria and Ghana:4
Nigeria Ghana
Generation Installed Capacity 5.8 GW 2 GW
Access to Electricity
Overall 55.2% 77.2%
Urban electrification 78% 85%
Rural electrification 23% 35%
Per Capita Consumption
kWh per year 121 265
The State of Power infrastructure in Ghana
The power infrastructure in Ghana has developed over the years reaching an electrification rate of 77.2% of the population.
5 85% of the urban population have access to electricity
against only 35% in rural areas.
The electrification rate in Ghana has improved from around 61% in 2010 to 77.2% in 2011 while generation capacity has stagnated. This has created a supply-demand gap and affected the reliability of the grid power supply due to increased outages.
The power consumption per capita in Ghana stands now at 265 kWh.
The State of Power infrastructure in Nigeria
Nigeria has one of the lowest per capita electricity consumption in the world at 121 kWh. This can be mainly attributed to extremely low power generation capacity, leading to a huge untapped power generation potential. Nigeria is endowed with tremendous natural resources that could fuel the socio-economic development of the country.
The country has reached an electrification rate of 55.2% of the total population.6 The urban
electrification stands at 78% of the urban population while only 23% of the rural population has access to electricity. Despite a reasonably good electrification rate, as compared to other African countries, the supply of electricity is very poor.
The average power availability across Nigeria’s electrified population is less than 5 hours per day
7 and the quality of power supply is a concern especially for the telecom sector.
1.2.2 Power and Telecoms: Impact of Power infrastructure on Telecoms
The reach and expansion of power infrastructure has impacted the growth of the telecom sector in Ghana and Nigeria.
Ghana’s telecom infrastructure sector has experienced a decrease in the reliability of grid power supply owing to an unbalanced growing grid infrastructure and stagnating power generation capacities.
The below graph shows the trend in usage of diesel generator power over the last two years for the grid-connected telecom tower sites.
4 IEA – World Energy Outlook 2012, Published material from Energy Commissions of Nigeria and Ghana
5 Energy Commission of Ghana - www.energycom.gov.gh
6 Energy Commission of Nigeria - www.energy.gov.ng
7 GSMA GPM market research and analysis
10
Powering Telecoms: West Africa Market Analysis GSMA Green Power for Mobile
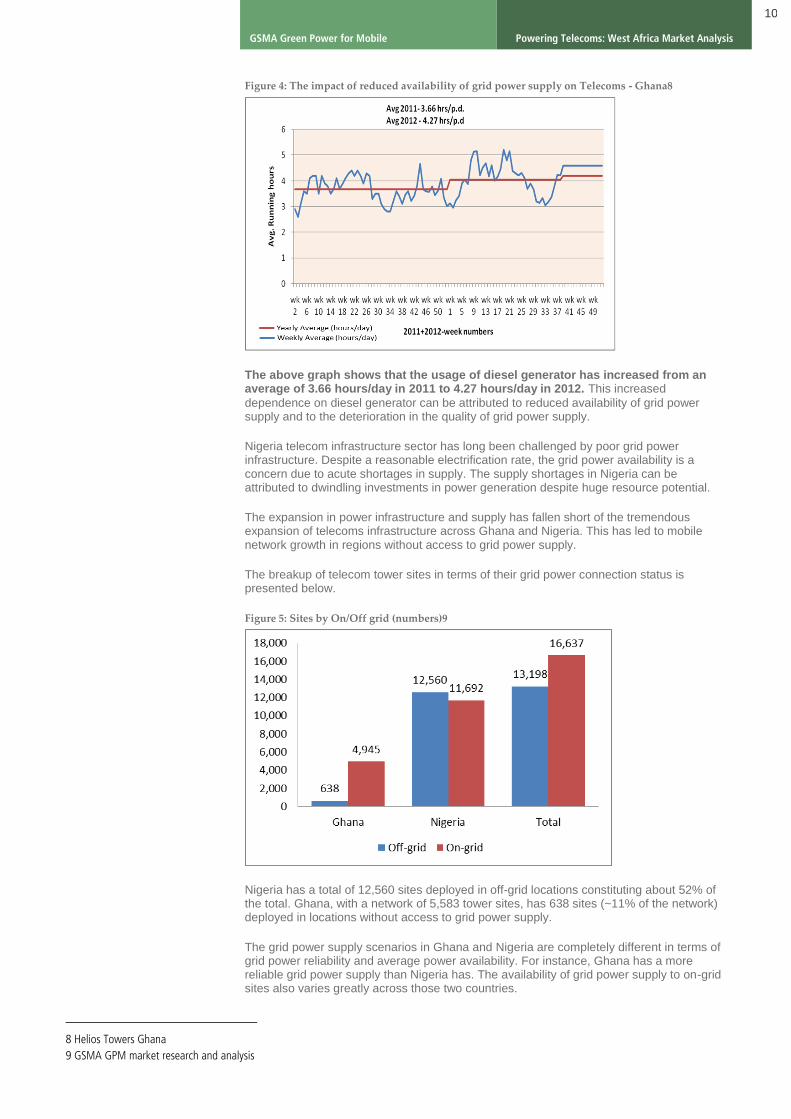
Figure 4: The impact of reduced availability of grid power supply on Telecoms - Ghana8
The above graph shows that the usage of diesel generator has increased from an average of 3.66 hours/day in 2011 to 4.27 hours/day in 2012. This increased
dependence on diesel generator can be attributed to reduced availability of grid power supply and to the deterioration in the quality of grid power supply.
Nigeria telecom infrastructure sector has long been challenged by poor grid power infrastructure. Despite a reasonable electrification rate, the grid power availability is a concern due to acute shortages in supply. The supply shortages in Nigeria can be attributed to dwindling investments in power generation despite huge resource potential.
The expansion in power infrastructure and supply has fallen short of the tremendous expansion of telecoms infrastructure across Ghana and Nigeria. This has led to mobile network growth in regions without access to grid power supply.
The breakup of telecom tower sites in terms of their grid power connection status is presented below.
Figure 5: Sites by On/Off grid (numbers)9
Nigeria has a total of 12,560 sites deployed in off-grid locations constituting about 52% of the total. Ghana, with a network of 5,583 tower sites, has 638 sites (~11% of the network) deployed in locations without access to grid power supply.
The grid power supply scenarios in Ghana and Nigeria are completely different in terms of grid power reliability and average power availability. For instance, Ghana has a more reliable grid power supply than Nigeria has. The availability of grid power supply to on-grid sites also varies greatly across those two countries.
8 Helios Towers Ghana
9 GSMA GPM market research and analysis

11
Powering Telecoms: West Africa Market Analysis GSMA Green Power for Mobile
The number of on-grid sites, along with the average daily power outage scenario, is presented below.
Figure 6: Sites by Grid Power Outage (On-grid)9
Power outages are commonly up to 6 hours a day, minimum. Therefore, Ghana, with
83% of the grid-connected sites experiencing 6-hour power outages per day are better off than in Nigeria, where 81% of sites experience power outages that last more than 6 hours.
The unreliable grid power supply in Nigeria has forced the telecom operators and Tower Companies to heavily rely on diesel power as a backup power source to run the network.
1.2.3 Power and Telecoms: Costs of Powering
The cost structure of powering a telecom tower site depends on the grid connectivity and availability of grid power supply to the site. The powering costs of a telecom tower site can be divided into direct energy costs and indirect maintenance and operations costs.
Direct costs Indirect costs
On-grid Grid power costs, Cost of grid power outage (diesel backup power costs)
Power equipment maintenance including diesel generators and other power systems components, battery maintenance, and overheads
Off-grid Diesel power costs Equipment maintenance including diesel generators, battery maintenance, and overheads
GPM has analysed the direct costs of powering a telecom tower site, off-grid and on-grid, for both Ghana and Nigeria.
The major portion of the direct costs of powering an off-grid site includes the cost of the diesel consumed to run the site. An off-grid site consumes on average 1,300 liters of diesel every month in Ghana against 1,765 liters in Nigeria.
10
A site’s diesel consumption varies according to whether the site is owned by a tower company or an MNO due to difference in tenancy. A site owned and operated by
a tower company consumes higher amount diesel on average as compared to an MNO operated site.
The cost structure of an on-grid site includes grid power costs as well as diesel power cost depending on the availability and reliability of the grid power supply. The direct costs structure of an on-grid site for both Ghana and Nigeria is presented below.
10 GSMA GPM market research and analysis

12
Powering Telecoms: West Africa Market Analysis GSMA Green Power for Mobile
Figure 7: Powering Cost Structure (On -grid)10
For Nigeria, diesel cost constitutes a major chunk (93% of the direct costs of power) of powering an on-grid site due to the poor grid power supply. Thanks to a more efficient grid power supply in Ghana, diesel cost constitutes about 58% of the total direct costs of powering an on-grid site.
1.3 Powering Telecoms: Current Approach
In this section, GPM looks at the current approach to powering the network across Ghana and Nigeria. The break-up of sites by power solution is presented below.
Figure 8: Sites by Power Solution Deployed (on-grid)11
Almost every on-grid site is deployed with diesel generator as backup power source due to unreliable grid power supplies in both the countries. None of the on-grid sites run completely on grid power supply or grid-battery hybrid power system. The majority of on-grid sites (75% of the total) have Grid-DG-Only solution. The remaining 13% are deployed with Grid-DG-Battery hybrid power solution, reducing the DG run time. Green power deployments on on-grid sites are less than 1% (only 24 sites) of the total of on-grid sites.
An on-grid site consumes an average of +1,500 liters per month in Nigeria and 450 liters per month in Ghana. The higher diesel consumption of on-grid sites in Nigeria is due to the lack of grid power supply, making the diesel generator run longer every day.
11 GSMA GPM market research and analysis

13
Powering Telecoms: West Africa Market Analysis GSMA Green Power for Mobile
Figure 9: Sites by Power Solution Deployed (off-grid)11
Off-grid sites rely on diesel generator as the primary source of power. However, MNOs and Tower Companies have pursued alternative solutions to reduce the dependence on diesel generator for off-grid sites using DG-Battery hybrid power systems.
Currently, a majority of sites are still running 24x7 on diesel generators, representing approximately 55% of off-grid sites (7,200 off-grid sites).However, about 43% of sites are deployed with battery hybrid power systems reducing the dependence on diesel generators by battery cycling. Only 2% of off-grid sites are deployed with green power alternative.
An off-grid site consumes around 1,300 litres of diesel in Ghana and over 1,700 liters in
Nigeria every month.11
The higher diesel consumption in Nigeria can be attributed in part to
the over-sizing of the diesel generator deployed at the off-grid sites.
1.4 Powering Telecoms: The Overall Context
The current state of telecoms infrastructure, along with the support infrastructure including power has implications on the operations of the existing network as well as its growth to reach country-wide coverage.
1.4.1 The Context of Powering Telecoms in Ghana
Operations Context
Ghana has a reliable grid power supply - to which most telecom tower sites are connected - compared to many other countries in the region. Excluding the regular load-shedding of grid power suppliers, the availability of grid power to the telecom tower sites is about 70% of the time, reducing the dependence on expensive and dirty diesel power of on-grid sites.
However, there has been a decline in the quality and reliability of grid power supply in recent times due to supply shortages failing to catch up with the grid’s expansion over the years. This has increased the dependence on diesel generators (an additional hour usage every day on average).
Ghana is one of the most mature tower outsourcing market, as seen from the uptake of the tower company model by MNOs: over 70% of telecom towers in the country are owned or under the management of a tower company. The average tenancy ration for Ghana is about 1.6 tenants per tower site.
12
Growth Context
Despite close to 100% mobile penetration, Ghana still has 20% of its population without access to mobile telecom services. The uncovered population is largely rural and lives in off-grid remote communities, which makes it difficult to connect to the mobile network. Bringing this population under coverage requires major investments in passive and active infrastructure with longer payback periods due to low ARPU from the rural communities. The huge cost of powering these remote off-grid tower sites hinders the operators from extending coverage to these communities.
12 GSMA GPM market analysis

14
Powering Telecoms: West Africa Market Analysis GSMA Green Power for Mobile
However, innovative solutions have been considered to extend coverage by low-power consuming smaller version of telecom site sufficient to cover the small dispersed communities. These new “lighter” sites are fit for 100% solar power instead of diesel generators.
1.4.2 The Context of Powering Telecoms in Nigeria
Operations Context
Grid power supply is a major concern in Nigeria and has affected telecom operations in terms of costs and reliability. More than half of the sites are off-grid and usually powered by diesel generators with huge OPEX. The remaining grid-connected sites suffer due to the poor quality of power supply and frequent outages lasting long hours. This has led to a heavy dependence on diesel generators for the grid-connected sites as well.
In addition to the poor grid power supply, Nigerian telecom tower operators face operation challenges. Site security, for example, is a major issue as there have been several cases of damage to tower assets across the country. This risk has hindered MNOs and Tower Companies from investing in green power alternatives for the network. Thefts of equipment and fuel pilferage have affected the OPEX of telecom sites. Also, initiatives reducing the diesel consumption have been conflicting with O&M partners’ interests, thus hampered the successful implementation of these alternatives.
The lack of support from the government in providing policy guidelines and security to telecom infrastructure adds to the operational complexity and costs of running a telecom network in Nigeria.
Growth Context
While the coverage of mobile network in Nigeria has reached more than 85% of the country’s population, mobile penetration is still low, with around 65% of the population using mobile services.
The remaining 15% of the uncovered population (~ 25 million) presents infrastructure and geographical challenges, hindering the expansion of mobile telecom services coverage.
The scattered and remote nature of these communities also makes it difficult to justify the CAPEX investments in extending the coverage. The government and regulatory support has not been up to the mark in catalysing the implementation of rural telephony to extend coverage of telecom services to the remote rural communities.

15
Powering Telecoms: West Africa Market Analysis GSMA Green Power for Mobile
2. Industry and Regulations
2.1 Industry Structure
The telecom infrastructure industry in Ghana and Nigeria is represented by Tower Companies and MNOs, as owners of telecom assets. Other key stakeholders in the industry include the telecom and power equipment vendors, managed services providers and O&M contractors.
The telecom tower ownership structure and anchor tenants’ details are presented below.
Table 2: Telecoms Tower Ownership and Tenants13
2.1.1 Tower Outsourcing Scenario
Ghana’s telecom infrastructure is dominated by Tower Companies owning and managing the tower assets while Nigeria has majority of its towers owned by MNOs. The ownership structure between MNOs and Tower Companies is presented below.
Figure 10: Tower Ownership Structure: MNO vs. Tower Company14
Nigeria’s tower ownership structure is skewed towards MNOs owning about 91% of the telecom towers while around 9% are owned by Tower Companies. In contrast, Ghana has a majority of its towers (around 63%) owned by telecom Tower Companies.
The Tower Companies in Ghana have an average tenancy ratio of 1.6 while the average tenancy ratio in Nigeria stands at 3.1 tenants per site.
14
13 GSMA GPM market research
14 GSMA GPM market research and analysis
Tower Owned/Managed Anchor Tenant Other Tenants
Ghana
Airtel (IHS Towers Africa) Airtel MTN, Tigo, Vodafone
Glo Mobile Glo Mobile None
ATC MTN Airtel, Tigo, Vodafone
Eaton Towers Vodafone Airtel, MTN, Tigo
Helios Towers Tigo Airtel, MTN, Vodafone
Nigeria
Airtel Airtel MTN, Etisalat and others
Etisalat Etisalat Airtel, MTN and others
Glo Mobile Glo Mobile None
MTN MTN Airtel, Etisalat and others
Helios Towers - Airtel, MTN, Etisalat and others
IHS Towers - Airtel, MTN, Etisalat and others
SWAPS -
Airtel, MTN, Etisalat and others

16
Powering Telecoms: West Africa Market Analysis GSMA Green Power for Mobile
2.2 Regulatory Environment
Ghana has been in the forefront in terms of providing a policy framework for addressing the energy needs of the nation. Since the starting of the energy sector’s development programme in 1996, Ghana has come up with various programmes and schemes to support the sustainable development/sustainability of the energy sector and promote the exploitation of the country’s renewable energy resources, with a goal of reaching electrification of 100% of its population by 2020.
Nigeria’s National Energy Policy and the Electric Sector Reform Act (2005) paved way to the liberalization of the power sector by separating the generation, transmission and distribution of electric power. Nigeria, with the support of UNDP, has drafted a Renewable Energy Master Plan to include renewable energy as part the national energy plan.
The highlights from the policy framework and guidelines for Ghana and Nigeria are presented below.
15
Table 3: Green Regulations and Power Sector Vision – Ghana and Nigeria
Green Regulations Power sector vision
Ghana
Renewable Energy Policy Guidelines (Chapter 4, 5, 6) as part of the National Energy Policy 2010 o Tax breaks for renewable energy
equipment o 10% of electricity generation from
renewable energy sources by 2020 The creation of a level playing field for
renewable energy by removing existing fiscal and market barriers, such as custom duty and value added tax
Development of a pricing framework that encourages utility companies to adopt renewable energy as part of their supply mix
The National Energy Policy, 2010 o To manage the growing energy
demand to support economic development by integrated energy plan and policy framework
National Electrification Scheme, 2007 o Target electrification rate of 100%
by 2016
Nigeria
Renewable Energy Master Plan, 2006 o Full harnessing of the nation’s
large- and small-hydro potential,
o The pursuit of enhanced solar energy integration into the national energy mix,
o The promotion of efficient biomass conversion technologies, and
o The commercialisation of the nation’s wind resource
The Plan advises on a number of fiscal and market incentives for the increased use of RETs o Short term incentives include a
moratorium on import duties for renewable energy technologies
o Long term incentives planned include the design of further tax credits, capital incentives and preferential loan opportunities for renewable energy projects
The National Energy Policy, 2003 Policy Theme: Optimal utilization of the nation’s energy resources; both conventional and renewable, for sustainable development, and with the active participation of the private sector Extensive development of electric
power with a goal of achieving reliable electricity access to 75% of the population by 2020 and to broaden the energy options for generating electricity
The Policy also highlights plan for renewable energy resource development and utilization
The Electric Power Sector Reform Act, 2005 o Wholesale competition model
enable distributors to directly buy electricity from the generators
o Transmission company as pure power transport enabler
o Liberalization of power generation sector with participation from IPPs
15 Policy documents and published material as cited in the table
17
Powering Telecoms: West Africa Market Analysis GSMA Green Power for Mobile
3. Powering Telecoms: Green Telecoms
The use of diesel generators as the default power backup of off-grid and grid-connected telecom tower sites comes with its implicit disadvantages in terms of high cost of power, diesel logistics and theft, as well as having a negative environmental impact due to high CO2 emission per kWh consumed.
In this section, GSMA looks at the green alternatives to power telecom tower sites and the potential size of the green power market for the telecommunications industry. The various green power choices are studied and analysed based on the country’s context.
3.1 The Green Choices and their Market Fit for Telecoms
The choice of green power technology in the telecom industry depends on its resource availability, technology supply, commercial viability and market acceptance. The qualification of various green choices suitable for telecom applications including solar, wind, biomass, fuel cell and Pico-hydro, is analysed below.
3.1.1. Green Choice: Solar
Solar energy is one of the most ubiquitously available sources of clean energy and the most suitable for distributed power generation, bringing power generation to where it is needed and thus being suitable for the telecom industry. Unlike other sources of clean energy, it is widely scalable owing to its modular technology to match future increase in load. However, solar technology presents challenges in terms of high upfront
CAPEX and high space requirements for deploying the plant.
Context for Ghana and Nigeria
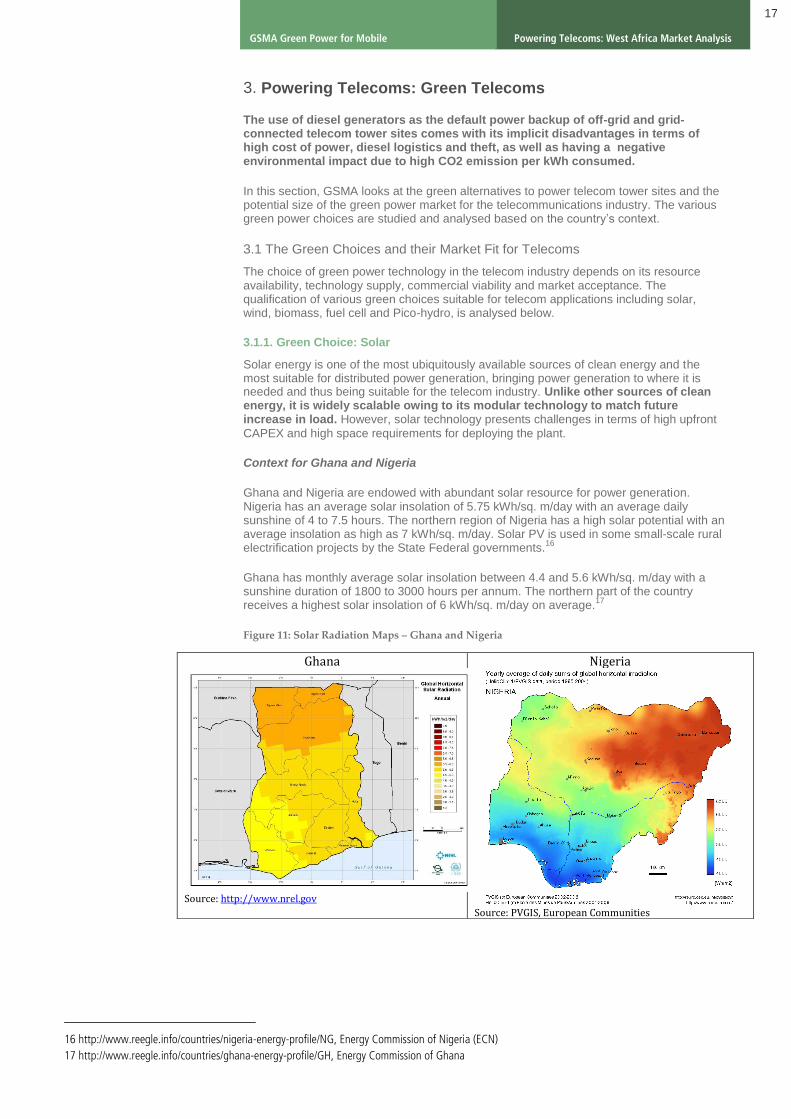
Ghana and Nigeria are endowed with abundant solar resource for power generation. Nigeria has an average solar insolation of 5.75 kWh/sq. m/day with an average daily sunshine of 4 to 7.5 hours. The northern region of Nigeria has a high solar potential with an average insolation as high as 7 kWh/sq. m/day. Solar PV is used in some small-scale rural electrification projects by the State Federal governments.
16
Ghana has monthly average solar insolation between 4.4 and 5.6 kWh/sq. m/day with a sunshine duration of 1800 to 3000 hours per annum. The northern part of the country receives a highest solar insolation of 6 kWh/sq. m/day on average.
17
Figure 11: Solar Radiation Maps – Ghana and Nigeria
16 http://www.reegle.info/countries/nigeria-energy-profile/NG, Energy Commission of Nigeria (ECN)
17 http://www.reegle.info/countries/ghana-energy-profile/GH, Energy Commission of Ghana
Ghana
Source: http://www.nrel.gov
Nigeria
Source: PVGIS, European Communities

18
Powering Telecoms: West Africa Market Analysis GSMA Green Power for Mobile
The market fit for solar is presented below.
Green Fit for Telecom: Availability vs. Acceptance
G
r
e
e
n
Green Fit for Telecom: Potential vs. Adoption
Country Stage of Adoption
Resource Potential
Barriers to Adoption
Risks of Adoption
Commercial viability
Ghana Commercial High High initial CAPEX
High space requirements
Scarcity of external funding
Operational risk in terms of local challenges in theft and breaking of solar panels
Reliability issues due to variation in weather
High
Nigeria Commercial High In addition to the above, low level of commitment and support from O&M partner post deployment
Operational risk in terms of local challenges in theft and breaking of solar panels
Reliability issues due to variation in weather
High
3.1.2 Green Choice: Wind
Wind is a cost effective source of green energy for grid-connected megawatt (MW) scale deployments. Its adoption for small scale distributed energy generation has been hindered by high regular maintenance costs, low reliability – due to the variability of wind speed – and investment risks. Wind has been adopted in combination with other green technologies such as solar where there is a good potential for OPEX savings.
Context for Ghana and Nigeria
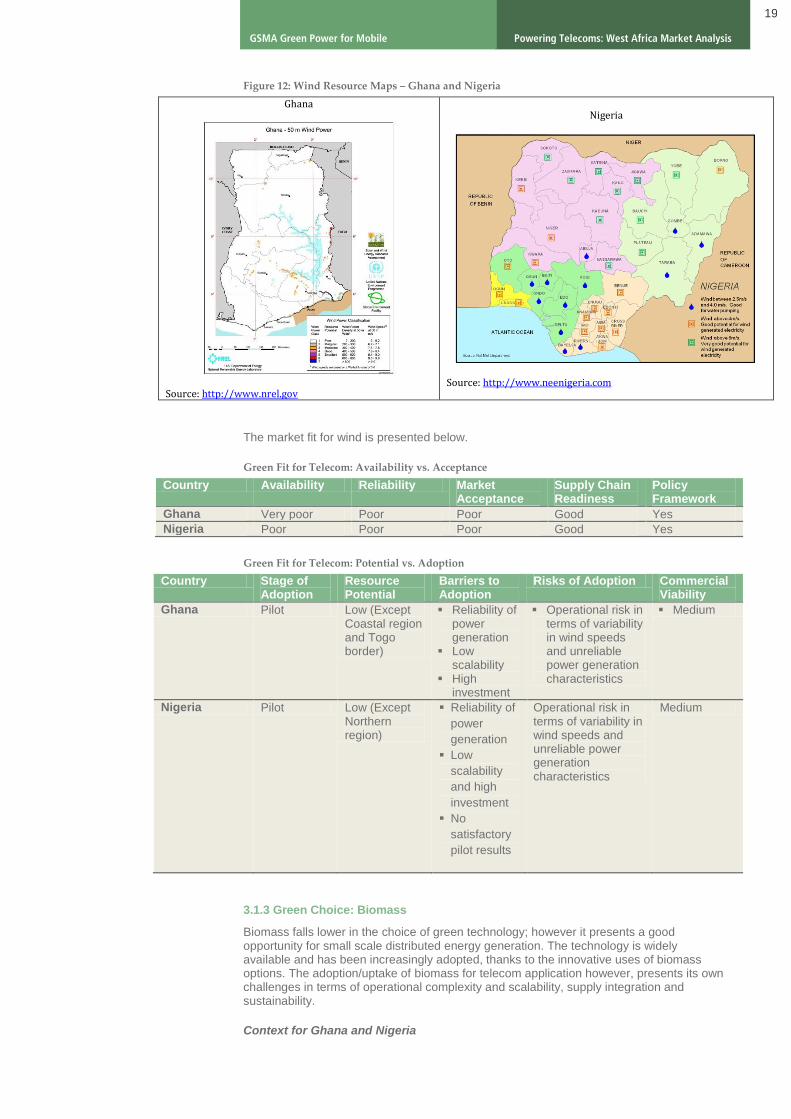
Ghana has a moderate availability of wind power resources along the coast with a monthly average wind speed of 6.8 m/s at 50m mast height, suitable for utility scale deployments. The Ghana-Togo border presents the highest wind resource region with average wind speeds of 9.0-9.9 m/s at 50m mast height. The wind resource regions along the coast and Togo border are mostly suitable for grid-connected large scale wind farms. The wind resource potential for distributed small scale applications such as telecoms is not yet exploited.
17
The wind resource in Nigeria varies by region with the extreme north region presenting good wind speeds of 4 to 5.1 m/s, suitable for small scale telecom applications. The southern region has an average wind speed of 1.4 to 3.0 m/s except for the coastal and offshore regions.
16
Country Availability Reliability Market Acceptance
Supply Chain Readiness
Policy Framework
Ghana Very Good Good Good Good Yes
Nigeria Very Good Good Good Good Yes
19
Powering Telecoms: West Africa Market Analysis GSMA Green Power for Mobile
Figure 12: Wind Resource Maps – Ghana and Nigeria
Ghana
Source: http://www.nrel.gov
Nigeria
Source: http://www.neenigeria.com
The market fit for wind is presented below.
Green Fit for Telecom: Availability vs. Acceptance
Country Availability Reliability Market Acceptance
Supply Chain Readiness
Policy Framework
Ghana Very poor Poor Poor Good Yes
Nigeria Poor Poor Poor Good Yes
Green Fit for Telecom: Potential vs. Adoption
Country Stage of Adoption
Resource Potential
Barriers to Adoption
Risks of Adoption Commercial Viability
Ghana Pilot Low (Except Coastal region and Togo border)
Reliability of power generation
Low scalability
High investment
Operational risk in terms of variability in wind speeds and unreliable power generation characteristics
Medium
Nigeria Pilot Low (Except Northern region)
Reliability of
power
generation
Low
scalability
and high
investment
No
satisfactory
pilot results
Operational risk in terms of variability in wind speeds and unreliable power generation characteristics
Medium
3.1.3 Green Choice: Biomass
Biomass falls lower in the choice of green technology; however it presents a good opportunity for small scale distributed energy generation. The technology is widely available and has been increasingly adopted, thanks to the innovative uses of biomass options. The adoption/uptake of biomass for telecom application however, presents its own challenges in terms of operational complexity and scalability, supply integration and sustainability.
Context for Ghana and Nigeria

20
Powering Telecoms: West Africa Market Analysis GSMA Green Power for Mobile
Nigeria has a moderate potential for using biomass as a source of electricity. The Energy Commission of Nigeria has put forth plans to produce bio-fuel (bio-ethanol) from sugarcane and cassava plantations with a potential production of 120-140 million liters every year. At 43.4 million tonnes of fuel wood consumption annually, However, the use of wood waste (a potential of 1.8 million tonnes of saw dust generated every year) as biomass input for energy production is relatively low.
16
Ghana is also considering growing plantations to produce biodiesel as alternative transportation fuel butte use of biomass for electricity generation is yet to be exploited.
The market fit for biomass is presented below.
Green Fit for Telecom: Availability vs. Acceptance
Country Availability Reliability Market Acceptance
Supply Chain Readiness
Policy Framework
Ghana Satisfactory Good Poor Poor Yes (bio-energy policy)
Nigeria Satisfactory Good Poor Poor Yes (REMP)
Green Fit for Telecom: Potential vs. Adoption
Country Stage of Adoption
Resource Potential
Barriers to Adoption
Risks of Adoption
Commercial Viability
Ghana Pre - Pilot Medium Operational complexity
Biomass supply and sustainability
Low
Nigeria Pre-Pilot Medium Operational complexity
Supply challenges
Pre-pilot stage and unproven operational feasibility
Biomass supply and sustainability
Reliability issues due to breakage in supply links
Low
3.1.4 Green Choice: Fuel Cell
Over the years, fuel cell technology has seen various innovations including the fuel types and generation technology. Fuel cells based on hydrogen are most popular and the cleanest due to their 100% burning characteristics. However, their adoption is hindered due to high initial CAPEX, availability and supply of hydrogen fuel as well as high replacement cost (almost 25-30% of CAPEX) of cells every 5-6 years.
On-site hydrogen fuel generation is an alternative option to consider for countries without a reliable fuel supply chain; however the technology and pilot demonstration haven’t reached the telecom application in this region. The hydrogen fuel supply chain is not yet established in both the countries (Ghana and Nigeria) s.
The market wise fit for fuel cell is presented below.
Green Fit for Telecom: Availability vs. Acceptance
Country Availability Reliability Market Acceptance
Supply Chain Readiness
Policy Framework
Ghana Poor Good Poor Poor No
Nigeria Poor Good Poor Poor No

21
Powering Telecoms: West Africa Market Analysis GSMA Green Power for Mobile
Green Fit for Telecom: Potential vs. Adoption
Country Stage of Adoption
Resource Potential
Barriers to Adoption
Risks of Adoption
Commercial Viability
Ghana Pre - Pilot Low High initial CAPEX
Hydrogen fuel supply
OPEX Savings not yet established
High replacement cost of fuel cells
Low
Nigeria Pre-Pilot Low Same as above High replacement cost of fuel cells
Reliability of fuel supply
Low
3.1.5 Green Choice: Hydro (Pico)
Hydro power is the most traditional form of clean energy for large scale (megawatt scale), grid-connected power generation and so far, its adoption at small scale distributed generation has been limited due to lack of technology and suppliers. Other challenges for telecom applications include the availability of water body resources, adjacent to or near to the site location. The CAPEX requirements and potential business case for telecom applications is yet to be known.
The potential for Pico-hydro based green energy for telecom applications is yet to be established for Ghana and Nigeria.
The market fit for Pico-hydro is presented below.
Green Fit for Telecom: Availability vs. Acceptance
Country Availability Reliability Market Acceptance
Supply Chain Readiness
Policy Framework
Ghana Poor Good Very Poor Very Poor Yes (only for Small MW scale Hydro for Grid connected)
Nigeria Poor Good Very Poor Very Poor Same as above
Green Fit: Potential vs. Adoption
Country Stage of Adoption
Resource Potential
Barriers to Adoption
Risks of Adoption
Commercial Viability
Ghana Pre - Pilot Not established Low market awareness
Availability of water body close to tower locations
Cost of technology
Regulatory clearance
Operational risks associated with limited knowledge and readiness
Not established
Nigeria Pre-Pilot Not established Same as above
Same as above
Not established
Summary of Green Choices: Potential Choice for Telecoms in Nigeria and Ghana
Solar Wind Biomass Fuell Cell Pico Hydro
High Medium to low Low Medium to low Low

22
Powering Telecoms: West Africa Market Analysis GSMA Green Power for Mobile
3.2 Powering Telecoms: The Green Shades under the Tower (Current Deployments)
The adoption of green power energy for powering telecom towers has not taken off in Ghana and Nigeria. Telecom Operators have been deploying pilots using solar-DG hybrid solutions to power off-grid telecom sites and are still at the initial stage of commercial adoption.
Currently, less than 2% of the total 13,198 off-grid sites and less than 0.2% of the total 16,637 on-grid sites are deployed with green power alternatives to power the telecom tower sites.
18
3.2.1 The Challenges for Green Power Adoption
Besides the technical barriers cited in the previous sections, various operational constraints also impede the scaling of green power for telecoms.
Informal Diesel Economy and the Value Chain
Diesel theft remains one of the biggest challenges to operating telecom assets and controlling OPEX. The diesel pilferage in Sub-Saharan Africa is estimated to be 15 to 20% of the total diesel consumption used to power the telecom tower sites.19 MNOs and Tower Companies have to rely heavily on backup diesel generators to power their sites to meet the benchmark uptime levels. Every telecom tower site in Nigeria (including the grid-connected sites) has a diesel generator as a backup power source owing to poor grid infrastructure and unreliable grid power supply.
Any initiatives from MNOs and Tower Companies towards reducing the dependence on diesel would conflict with the interests of the diesel value chain which has grown strong as telecom infrastructure expanded.
Equipment Theft and Vandalism
Theft and sabotage of equipment has been a major concern for telecom operators in Nigeria and Ghana. The sabotage of monitoring equipment has resulted in discrepancies in the reporting of diesel consumption including for renewable energy sites and DG-battery hybrid sites, which are supposed to reduce diesel consumption. Theft of solar panels has been a concern for telecom operators and has slowed down the investments in solar deployments despite OPEX saving potential.
3.3 Powering Telecoms: The Green Potential
The separation between off-grid, unreliable grid and reliable grid in terms of the numbers of sites, for Ghana and Nigeria, is presented below. Overall 83% of the total sites in Ghana and Nigeria combined are either off the grid or have unreliable grid power supply with power outages for more than 6 hours a day - including 44% off-grid and 39% unreliable grid sites.
Figure 13: Break-up of sites by grid status (numbers, overall %)20
Based on the above division, GPM estimated that around 10,890 sites are potential candidates for green power deployment for telecoms in Nigeria and Ghana. This represents about 44% of the total of 24,676 sites which are off-grid and unreliable grid
18 GSMA GPM market research and analysis
19 GSMA GPM Bi-annual report December 2011
20 GSMA GPM market research and analysis

23
Powering Telecoms: West Africa Market Analysis GSMA Green Power for Mobile
sites. The estimate is based on parameters including the average site load characteristics of the networks and average tenancy ratios in Ghana and Nigeria.
Approximately 56% of potential sites are off-grid and 44% are unreliable grid sites. The number of sites with green power potential in Ghana and Nigeria is presented below.
Figure 14: Green Power potential (No. of sites)21
3.3.1 OPEX Savings Potential
GPM estimates that the implementation of the green power alternatives for 10,890 potential sites would save around US$192 million in OPEX and reduce diesel consumption by approximately 76% from current levels. The payback period would be around 2.7 years with an initial investment of approximately US$47,500 per site.21
The estimate is based on sizing of the solar-hybrid power systems for the current load requirements considering an average DG run of 4 hours per day.
21 GSMA GPM Analysis

24
Powering Telecoms: West Africa Market Analysis GSMA Green Power for Mobile
4. Powering Telecoms: The way forward
4.1 Growth Forecast
4.1.1 Short Term
In the short term, the total number of telecom tower sites is expected to reach 32,418 by 2013 from the current base of 29,835 sites. The corresponding growth in number of tower sites for both the countries is presented below.
22
Figure 15: Growth (No. of sites) - short term22
The short term outlook for powering telecom towers varies from country to country and according to tower ownership. With the expected expansion of grid power infrastructure, Tower Companies in Ghana anticipate an extension of the grid connection to the existing off-grid sites.
The MNOs are also expected to move from the 24x7 diesel power to DG-battery hybrid solution and green alternatives to reduce the dependence on diesel generators. However, Tower Companies in the short term would continue to rely on diesel power due to high load multi-tenant scenario.
4.1.2 Long Term
The long term growth outlook for telecom tower sites is presented below. The number of sites is estimated to reach a total of 37,651 sites from the current numbers at a cumulative annual growth rate (CAGR) of 8.1%.
23 The estimate is based on the long term market
outlook for both Ghana and Nigeria taking into account current penetration levels, coverage, network capacity and other demographic characteristics including population levels and density of population.
Figure 16: Growth (No. of sites) - long term23
Energy efficiency and alternative energy solutions are considered as part of the long term strategy to reduce energy OPEX and CO2 emissions.
22 GSMA GPM market research and analysis 23 GSMA GPM Analysis
25
Powering Telecoms: West Africa Market Analysis GSMA Green Power for Mobile
4.2 Powering Telecoms: Future trends and Model innovations
In the following sections, GSMA highlights some of the future trends in the telecom infrastructure market and possible innovations driving the industry towards a more sustainable and positive environment
4.2.1 Network Optimisation and Energy Efficiency
Energy efficiency, as part of the long term strategy, can provide operators and tower companies with an estimated 29% OPEX saving on running a site.
24 Some of MNOs and
Tower Companies have invested in energy efficiency and site optimization measures and have realised benefits.
Network energy efficiency is a key element of the green power strategy to reduce dependence on diesel power thereby reducing OPEX and having a positive environmental impact.
4.2.2 Structural change: Leading to Tower Company
The tower outsourcing model of managing telecom assets is very much established in Ghana with more than 70% of the towers under ownership or management of Tower Companies.
Nigeria still has a majority of telecom towers owned by MNOs. Although the country has been one of the first markets in Africa to introduce the tower outsourcing model, it has not taken off yet. With three Tower Companies competing in the market, their market share, in terms of overall owned towers, still remains low compared to the size of the market.
4.2.3 Supply Model Innovation: Emergence of Energy Service Company (ESCO)
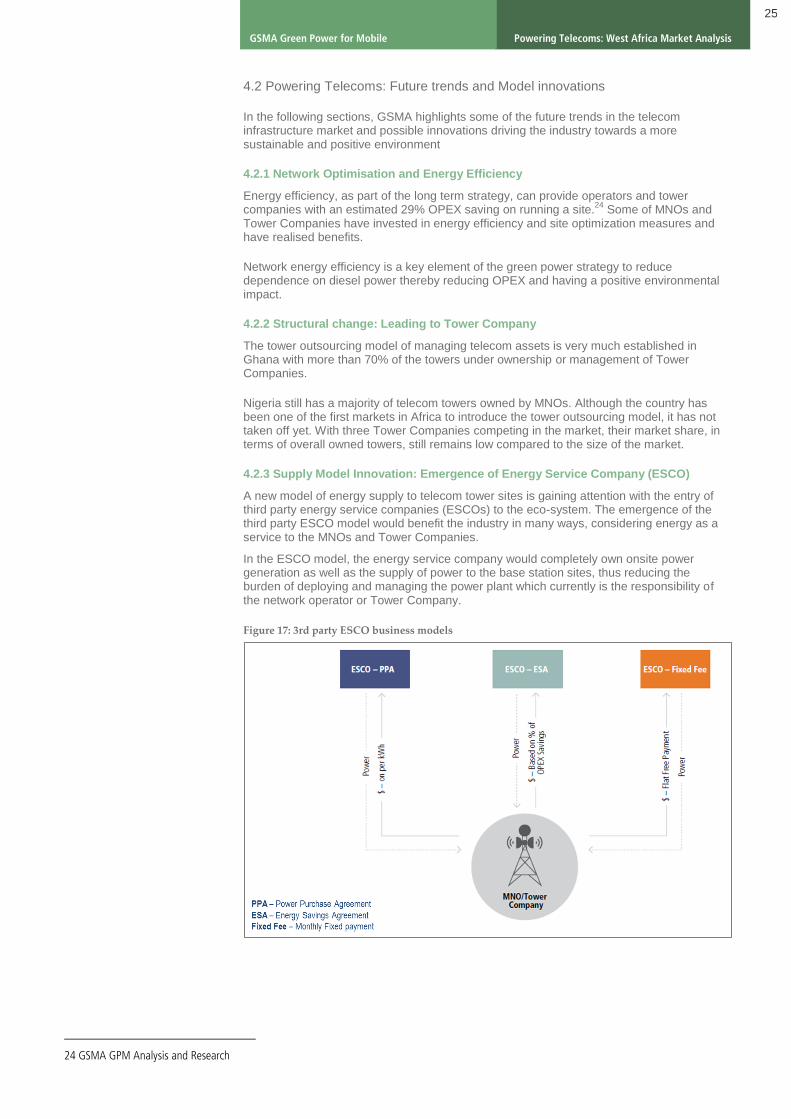
A new model of energy supply to telecom tower sites is gaining attention with the entry of third party energy service companies (ESCOs) to the eco-system. The emergence of the third party ESCO model would benefit the industry in many ways, considering energy as a service to the MNOs and Tower Companies.
In the ESCO model, the energy service company would completely own onsite power generation as well as the supply of power to the base station sites, thus reducing the burden of deploying and managing the power plant which currently is the responsibility of the network operator or Tower Company.
Figure 17: 3rd party ESCO business models
24 GSMA GPM Analysis and Research
26
Powering Telecoms: West Africa Market Analysis GSMA Green Power for Mobile
Different business models exist including the fixed price model, power purchase agreement (PPA) model and energy service agreement model (ESA). Of the three models, the PPA model is the most popular and simple in terms of managing the contractual obligations and SLAs. With the PPA model, the ESCO provides energy on a per kWh basis based on an agreed PPA price.
The Revenue Opportunity for an ESCO model based on PPA
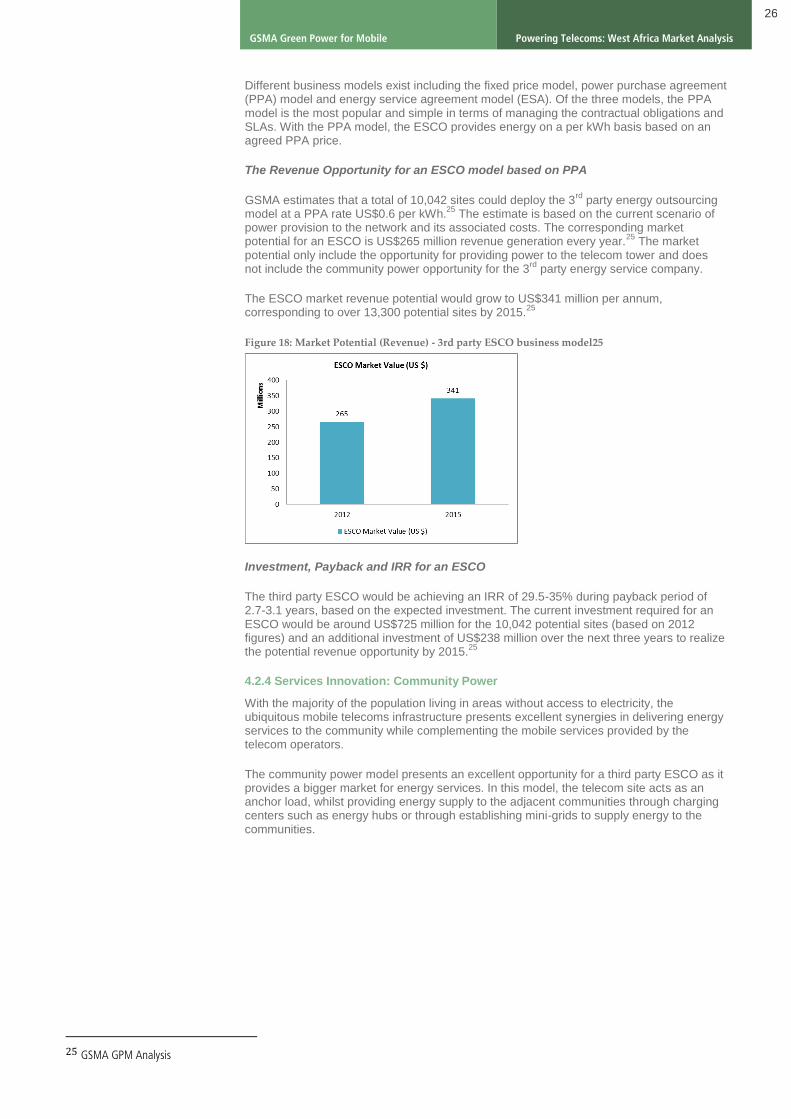
GSMA estimates that a total of 10,042 sites could deploy the 3rd
party energy outsourcing model at a PPA rate US$0.6 per kWh.
25 The estimate is based on the current scenario of
power provision to the network and its associated costs. The corresponding market potential for an ESCO is US$265 million revenue generation every year.
25 The market
potential only include the opportunity for providing power to the telecom tower and does not include the community power opportunity for the 3
rd party energy service company.
The ESCO market revenue potential would grow to US$341 million per annum, corresponding to over 13,300 potential sites by 2015.
25
Figure 18: Market Potential (Revenue) - 3rd party ESCO business model25
Investment, Payback and IRR for an ESCO
The third party ESCO would be achieving an IRR of 29.5-35% during payback period of 2.7-3.1 years, based on the expected investment. The current investment required for an ESCO would be around US$725 million for the 10,042 potential sites (based on 2012 figures) and an additional investment of US$238 million over the next three years to realize the potential revenue opportunity by 2015.
25
4.2.4 Services Innovation: Community Power
With the majority of the population living in areas without access to electricity, the ubiquitous mobile telecoms infrastructure presents excellent synergies in delivering energy services to the community while complementing the mobile services provided by the telecom operators.
The community power model presents an excellent opportunity for a third party ESCO as it provides a bigger market for energy services. In this model, the telecom site acts as an anchor load, whilst providing energy supply to the adjacent communities through charging centers such as energy hubs or through establishing mini-grids to supply energy to the communities.
25 GSMA GPM Analysis

27
Powering Telecoms: West Africa Market Analysis GSMA Green Power for Mobile
Figure 19: Community Power from Mobile (CPM) – models of delivery
28
Powering Telecoms: West Africa Market Analysis GSMA Green Power for Mobile
Conclusion
The potential for green power deployment by telecom operators varies from Ghana to Nigeria. Ghana, with a relatively good grid power infrastructure, presents a limited opportunity for green power as many tower sites are connected or planned to be connected to the grid. However, the next phase of growth into the rural areas would open up an opportunity l to include green power as part of the core power strategy of telecom operators.
Nigeria presents a big opportunity for green power deployments for telecoms, as the grid power supply is highly unreliable and more than half of the total network is off-grid. Despite a huge opportunity to tap the green power potential, Nigerian telecom operators and Tower Companies are yet to achieve scale in the deployment of green power alternatives.
Besides addressing the technical barriers, MNOs and Tower Companies need to look at strengthening the operational processes and site security in order to address the operational barriers to help scale the adoption of green power for telecoms. By including green power to their strategic thinking, not only will they have a positive environmental impact, but they will also achieve e long term OPEX efficiency.

29
Powering Telecoms: West Africa Market Analysis GSMA Green Power for Mobile
About Green Power for Mobile
Green Power for Mobile is a joint IFC and GSMA Mobile for Development programme which, in partnership with the Ministry of Foreign Affairs of the Netherlands, promotes the use of green power, such as solar and wind, at mobile network tower sites in remote rural areas around the world, where there is limited or no grid power. There are about 640,000 off-grid sites globally, primarily powered by diesel generators, out of which 120,000 could be eligible for green power solutions. IFC, a member of the World Bank Group, is the largest global development institution focused exclusively on the private sector.
GSMA is the industry association which represents the interests of nearly 800 mobile operators worldwide, serving more than 6 billion connections and 4 billion individual subscribers.
About the GSM Association
The GSMA represents the interests of mobile operators worldwide. Spanning 220 countries, the GSMA unites nearly 800 of the world’s mobile operators, as well as more than 200 companies in the broader mobile ecosystem, including handset makers, software companies, equipment providers, Internet companies, and media and entertainment organisations. The GSMA also produces industry-leading events such as the Mobile World Congress and Mobile Asia Congress.
About Mobile for Development: Serving the underserved through mobile
GSMA Mobile for Development brings together our mobile operator members, the wider mobile industry and the development community to drive commercial mobile services for underserved people in emerging markets. We identify opportunities for social, economic impact and stimulate the development of scalable, life-enhancing mobile services.
For more information on the GSMA’s Green Power for Mobile, please email [email protected]
©2013. GSMA Head Office Seventh Floor, 5 New Street Square, New Fetter Lane, London EC4A 3BF UK


