35
March 2017
March 2017

Forward-looking Statements
Statements and information herein that are not historical facts are "forward-looking information". Words such as “plans”, “intends”, “outlook”, “expects”, “anticipates”, “estimates”, “believes”, "likely", “should”, "could", "will", "may" and similar expressions often identify forward-looking information and statements. Forward looking statements and information may include, without limitation, statements regarding the operations, business, financial condition, liquidity, expected financial results, performance, obligations, market conditions, prospects, opportunities, priorities, targets, goals, ongoing objectives, strategies and outlook of Toromont and its business units.
Forward-looking information and statements contained herein are based on, among other things, Toromont management's current assumptions, expectations, estimates, objectives, plans and intentions regarding projected revenues and expenses, the economic, industry and regulatory environments in which Toromont operates or which could affect its activities, Toromont's ability to attract and retain customers as well as Toromont's operating costs and raw materials supply. By their nature, forward-looking information and statements, and the factors upon which they are based, are subject to risks and uncertainties which may be beyond Toromont's ability to control or predict. Actual results or events could differ materiallyfrom those expressed or implied by forward-looking information and statements. Factors that could cause actual results or events to differ from current expectations include, among others: business cycle risk, including general economic conditions in the countries in which Toromont operates; risk of commodity price changes including precious and base metals; risk of changes in foreign exchange rates, including the Cdn$/US$ exchange ate; risk of the termination of distribution or original equipment manufacturer agreements; risk of equipment product acceptance and availability of supply; risk of increased competition; credit risk related to financial instruments; risk of additional costs associated with warranties and maintenance contracts; interest rate risk on financing arrangements; risk of availability of financing; risk of environmental regulation.Additional information on these factors and other risks and uncertainties that could cause actual results or events to differfrom current expectations can be found in the “Risks and Risk Management” and “Outlook” section of Toromont’s annual MD&A for 2016 contained in the 2016 Toromont Annual Report. Other factors, risks and uncertainties not presently known to Toromont or that Toromont currently believes are not material could also cause actual results or events to differ materially from those expressed or implied by forward-looking information and statements.
Forward-looking information and statements contained herein about prospective results of operations, financial position or cash flows are presented for the purpose of assisting Toromont's shareholders in understanding managements' current view regarding those future outcomes and may not be appropriate for other purposes. Readers are cautioned not to place undue reliance on the forward-looking information and statements contained herein, which are given as of the date of this document, and not to use such information and statements for anything other than their intended purpose. Toromont disclaims any obligation or intention to update or revise any forward-looking information or statement, whether the result of new information, future events or otherwise, except as required by applicable law.
2

Investment Highlights
Market Leading Brands And Position
Product Support Provides Stability
Superior Financial Track Record
Strong Balance Sheet
Growth Opportunities In Diversified Segments
49 Year Dividend Record, 28 Of Consecutive Growth
Continuous Focus on Operational Excellence
3

Safety
4
Be Fit For Duty
Assess All Hazards
ControlHazardous
Energy
Proper PPE for Work
Area/ Task
Immediate Incident
Reporting

Multiple Growth Platforms
Construction Industries
Resource Industries
5
EQU
IPM
ENT
GR
OU
P

GROWTH FUELED BY:► Expanded Markets and New Branches
► Expanded Service Offerings
► Increased Population and Larger Equipment Fuels Product Support
Growth In Revenue
Revenue presented is based on trailing 12 months. Installed units based on management estimates for Toromont CAT. 6
0
5,000
10,000
15,000
20,000
25,000
30,000
0
250
500
750
1,000
1,250
1,500
2002 2003 2004 2005 2006 2007 2008 2009 2010 2011 2012 2013 2014 2015 2016
Esti
mat
ed
In
stal
led
Bas
e (
Un
its)
Re
ven
ue
($
mil
lio
ns)
Product Support Sales Equipment Sales Rental Estimated Installed Base

Strong Dealer Network
33 Toromont CAT BranchesHistory of Successful Consolidation
>250 Brands >28,000 Items42 Stores Serving
14,500 Customers
Newfoundland & Labrador
Ontario
Nunavut
Musselwhite
Meadowbank
Porcupine
Voisey’s Bay
VictorDetour
Lake
2
3
4
5
6
Manitoba
Toromont CAT Mine Site Branches
1. Agnico Eagle2. Goldcorp3. DeBeers4. Detour Gold5. Goldcorp6. Vale7. Baffinland
Toromont CAT Branches
DEDICATED TEAM DELIVERSSPECIALIZED EQUIPMENTAND MUCH MORE
Remote mine sites contributed $1,400MM over past decade
1
Mary River7
+2,700 Members
75 Locations
IN NEWFOUNDLAND & LABRADOR, ONTARIO, MANITOBA AND NUNAVUT
7
Equipment Group

8
11
Large
Contractor
24%
Local
Contractor
16%
Mining
24%
Industrial
6%
Equipment
Services
6%
Other
19%
Quarry &
Aggregate
5%
Large & Local Contractors 40%
Source: Internal data Toromont Cat total sales for the three years ended Dec. 31.16
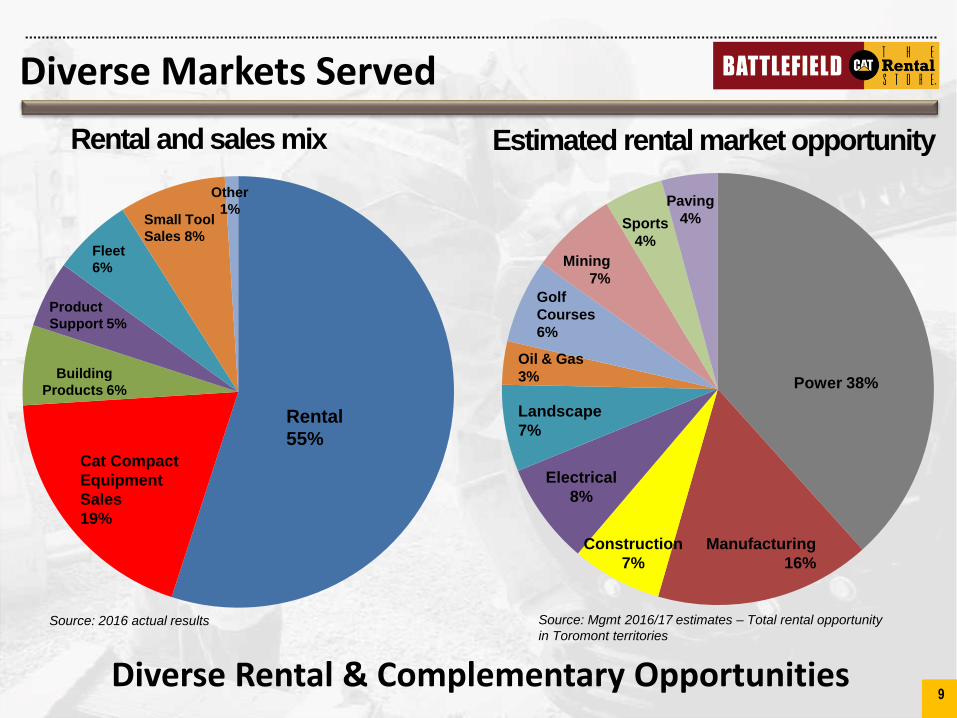
Diverse Markets Served
DIVERSE MARKETS WITH EMPHASIS ON INFRASTRUCTURE
Infrastructure
Road
Construction
15%
Residential
3%
Other
12%
Utilities
4%
Excavation &
Earthmoving
4%
9
11
Cat Compact
Equipment
Sales
19%
Rental
55%
Building
Products 6%
Product
Support 5%
Fleet
6%
Other
1%Small Tool
Sales 8%
Power 38%
Manufacturing
16%
Golf
Courses
6%
Landscape
7%
Construction
7%
Electrical
8%
Diverse Markets Served
Oil & Gas
3%
Mining
7%
Sports
4%
Paving
4%
Rental and sales mix Estimated rental market opportunity
Source: 2016 actual results Source: Mgmt 2016/17 estimates – Total rental opportunity
in Toromont territories
Diverse Rental & Complementary Opportunities9

Substantial Infrastructure Deficit
$388 billion*
79 % infrastructure
ffailing
The Greater Toronto and Hamilton Area is one of the fastest-growing regions in North America.
Approximately 100,000 new residents per year.
9 million35% of assets in need of attention*
• $141 billion in very poor and poor conditions
• $247 billion in fair physical condition
*Source: 2016 Canadian Infrastructure Report Card, Federation of Canadian Municipalities
Roads, municipal buildings, sport and recreational facilities and public transit are the asset classes most in need of attention
Continued need demands continued investment – recognized by all levels of government (Municipal, Provincial, Federal) 10
people
by 2031

Infrastructure Commitment Ontario
11
Source: 2016 Ontario Budget
Infrastructure Ontario plans $137 billion ten-year spend (up $3B from plans announced in the prior year)

12
Infrastructure Commitment Federal
• Including pre-existing programs and commitments in the 2016 Budget and Fall Economic Statement, total committed spend add up to an unprecedented $186 billion over 12 years
• To-date, specific projects have been slower to release leading to reluctance for customers to pull the trigger on equipment investment and rental commitments
Source: Fall Economic Statement 2016, The Government of Canada

Rental Market
HEAVY RENTS
LIGHT EQUIPMENT
POWER GENERATION
13
Equipment Group
0
50
100
150
200
250
2007 2008 2009 2010 2011 2012 2013 2014 2015 2016
R12 R
even
ue (
$m
illio
ns)
Light Equipment Heavy Equipment Power Generation Rent with a Purchase Option Rental - Used

$1,000
$200
$40
$1,240
$150 $25 $11186
0
200
400
600
800
1,000
1,200
1,400
Battlefield Heavy Rent Power Total
Total market* Toromont revenue
Rental Market OpportunityR
enta
l Rev
enu
es $
Mill
ion
s
15% 12% 28% 15%
R’12 Revenues to Dec. 31/16* Market Size based on internal management estimates
SUBSTANTIAL ROOM FOR CONTINUED GROWTH
Significantgrowthopportunity
14
Equipment Group
($ Millions) Battlefield Heavy Rent Power Total
Fleet at Original 314.2$ 112.1$ 46.4$ 472.7$

Mining Opportunities
CAT 6060FS Diesel Shovel Loads 795F AC Truck CAT R2900G
► Good diversity of commodities in Toromont territories
► Gold has been a significant contributor
► Opportunities continue – albeit tight market
► Significant increase in installed base increases product support opportunity.
► Large geography in safe jurisdiction
Resource Industries
15

Growth In Mining Installed Base
SUBSTANTIAL INCREASE IN MINING EQUIPMENT INSTALLEDBASE CREATES INCREASED PRODUCT SUPPORT OPPORTUNITY
Replacement value based on current pricing. Installed units based on management estimates.
Resource Industries
16
0
200
400
600
800
1000
1200
1400
0.0
200.0
400.0
600.0
800.0
1,000.0
1,200.0
1,400.0
1,600.0
1,800.0
2003 2004 2005 2006 2007 2008 2009 2010 2011 2012 2013 2014 2015 2016
Inst
alle
d B
ase
(Un
its)
Cu
rre
nt
Re
pla
cem
en
t V
alu
e o
f Fle
et
($M
M)
Other Underground Mining Trucks Shovels Number of Units

0
200
400
600
800
1000
1200
$-
$100
$200
$300
$400
$500
$600
Dec'03
Jun'04
Dec'04
Jun'05
Dec'05
Jun'06
Dec'06
Jun'07
Dec'07
Jun'08
Dec'08
Jun'09
Dec'09
Jun'10
Dec'10
Jun'11
Dec'11
Jun'12
Dec'12
Jun'13
Dec'13
Jun'14
Dec'14
Jun'15
Dec'15
Jun'16
Dec'16
Nu
mb
er
of
Tech
nic
ian
s
Trai
ling
12
mo
nth
Pro
du
ct
Sup
po
rt R
eve
nu
es
($M
M)
Product Support Revenues Number of Technicians
Product Support
► Technician recruitment continues
17

Expanded Product Support Offering
Largest opportunity
2nd largest and expanding opportunity
Larger customers adverse to holding facilities or techs
18

Equipment Management Solutions Advancing
► Increasing focus on EM and CM (condition monitoring) solutions
► Provides further opportunity for differentiation and customer service
► Toromont CAT currently has over 3,500 contracted service agreements in place (PMs and MARCs)
19

Complementary Products Supplement Growth
Machine Control & Guidance Systems Mobile Crushing & Screening Products
20
-
2,000
4,000
6,000
8,000
10,000
12,000
14,000
2008 2009 2010 2011 2012 2013 2014 2015 2016
Sale
s ($
000'
s)
-
5,000
10,000
15,000
20,000
25,000
30,000
35,000
40,000
2008 2009 2010 2011 2012 2013 2014 2015 2016
Re
ve
nu
e (
$0
00
's)

Power Systems Growth Opportunities
► Increasing share of higher investment in CHP & alternative energies (MWM)
► Large power plants for remote mine sites (MaK)
► Natural gas-fueled distributed power (District Energy)
► Expanded products – Toshiba UPS & Switch Gear offering, Gorman pumps
► Rental – industrial, commercial & special events
29%
26%
20%
20%
5%
Electric Power
Industrial
Prime Power
Rental
Marine21Based on 2016 Sales

Growth Platform In Manitoba
22
Six locations :► Elie► Portage la Prairie► Neepawa► Brandon► Steinbach► Morden
96 employees including34 technicians
Manitoba

Product Range
Market Share
Parts & Service
Construction
Power Systems
Mining
ORGANIC GROWTH
How WillThe Equipment Group Continue To Grow?
23

CIMCO
► 100+ year history
► Strong industrial customer base
► Leader in recreational systems
► U.S. growth opportunity
24

AR
AL
FL
Revenue Split(2016)
WI
IL
MS GA
SC
NC
PA
ME
VTNH
RI
VAVW
MI
DENJ
MA
Over 100 Years Of Serving Refrigeration Markets
25
Recreational
20%Product Support
42%
Industrial
38%
Note: Total of 22 CIMCO locations not reflected in map above due to overlapping markets resulting from close proximity of locations.
► Strong industrial customer base
► Leader in recreational systemsUS Sales Coverage400 Mile Sales Ring

Excellent Growth Opportunities
EXPAND MARKETS – TECHNOLOGY & VALUE-ADDED SERVICES► Increase application of Eco Chill into Industrial Applications
► Expand scope of work – related HVAC, automation & bldg controls
► Application of heat pump systems
► Develop of Ammonia/CO2 solutions
EXPAND TERRITORIES AND CUSTOMERS► Expand U.S. footprint by building product support network – secured
largest food services refrigeration CSA in U.S. – and adding points of presence (service and sales offices)
► Add to Canadian service locations
► Penetrate new customer accounts (new technologies)
26

DELIVERINGRESULTS
27

High Performance Capital Management
18.9*
Return on Opening Shareholders’ Equity (%)
Net Debt-to-Capitalization Ratio
* Excludes goodwill, intangibles and transaction costs* * Continuing operations from 2011
(%)
21.6 21.5
15.5
9.1
29.928.9
25.7
23.09.1
2007 2008 2009 2010 2011 2012 2013 2014 2015 2016
21.6
20.0
18.9*0.16
0.05
-0.06
0.17
0.13
0.25
0.10
0.06
0.10
-0.04
2007 2008 2009 2010 2011 2012 2013 2014 2015 2016
28

0.00
0.10
0.20
0.30
0.40
0.50
0.60
0.70
0.80
2007 2008 2009 2010 2011 2012 2013 2014 2015 2016 2017
Div
ide
nd
s P
er
Shar
e $
Sustained Growth In Dividends Since 1989
Annual Dividends Per Share(Cents)
49 Year Dividend Record, 28 Of
Consecutive Growth
Note: Historic pro forma based on Butterfly proportion 56.4%* 2017 estimated based on current quarterly rate of $0.19
Ten Year CAGR 10.9%
29

Growth And Profitability Throughout The Cycle
Pro Forma Net Earnings from Continuing Operations (Millions)
155.7
119.5
83.1
59.4
76.7
102.7
123.0
145.7
133.2
2007 2008 2009 2010 2011 2012 2013 2014 2015 2016
73.0
30

472.0REVENUES
$ millions except EPS
61.7OPERATING INCOME
44.4NET EARNINGS
0.57EPS (BASIC)
480.7
62.9
45.5
0.58
2016 2015
2
3
2
% Change
Q4 Results
2
31

1,802.2REVENUES
$ millions except EPS
204.5OPERATING INCOME
145.7NET EARNINGS
1.88EPS (BASIC)
1,867.3
216.6
155.7
1.99
2016 2015
6
7
6
% Change
DECEMBER YTD Results
4
32

Experienced Management
E X E C U T I V E T E A M
► Collective 148 years with Toromont (21 yr avg), 214 years career (31 yr avg)
► Significant experience in operating units with similar stats
► Detailed succession plans in place with good depth of talent
SCOTT J. MEDHURSTPresident and Chief Executive Officer
29 years with Toromont29 year career
Randy B. CassonPresident Construction Industries
40 years with Toromont / 40 year career
Paul R. JewerExecutive Vice President & Chief Financial Officer
12 years with Toromont / 31 year career
David A. MalinauskasPresident CIMCO
18 years with Toromont / 22 year career
Jennifer J. CochraneVice President Finance
14 years with Toromont / 27 year career
Mike P. CuddyVice PresidentChief Information Officer
22 years with Toromont / 37 year career
David C. WetheraldVice PresidentHuman Resources & Legal
13 years with Toromont / 28 year career
33

Equity Ownership
O W N E R S H I P :
EQUITY OWNERSHIP KEY REQUIREMENT ► Defined minimums for senior executives (3x CEO, 2x CFO, 1.5x VPs)
► For option participation – annual option grants limited to ownership
► Employee participation in ESPP – 50%
Units $MM %
Board 2,688,128 $ 113.8 3.4
Senior Management 927,011 39.3 1.2
Employees (ESPP) 1,393,242 59.0 1.8
TOTAL 5,008,381 $ 212.1 6.4
Balances as at December 31, 2016 with closing price $42.35Units include shares and DSUs, both of which are purchased
34

March 2017


