42
May 2015
| Date post: | 01-May-2018 |
| Category: |
Documents |
| Upload: | truongduong |
| View: | 214 times |
| Download: | 2 times |

May 2015

2
FORWARD LOOKING STATEMENTS
We are making some forward looking statements today that
use words like “outlook” or “target” or similar predictive
words. Such forward looking statements involve risks and
uncertainties detailed in our recent periodic reports as filed in
accordance with the Securities and Exchange Act of 1934.
These risks and uncertainties may cause actual results to
differ materially from our statements today.
Visit www.tupperwarebrands.com or download our Investor Relations app

3
OUR GOING FORWARD OBJECTIVE
Sustain Tupperware Brands position as
the premier, relationship-based global
marketer of quality innovative products
and brands.

4
POWERFUL
BUSINESS MODEL
EMERGING MARKETS PENETRATION OPPORTUNITY
STRATEGY TO INCREASE SALES
FORCE AND ACTIVE SELLERS
OPERATING LEVERAGE TO INCREASE
PROFITABILITY
EXPERIENCED GLOBAL
MANAGEMENT TEAM
SIGNIFICANT RETURN OF CAPITAL TO
SHAREHOLDERS
INVEST IN TUPPERWARE BRANDS

5
COMMONLY ASKED QUESTIONS
• Organizational structure
o How are you organized, by country, by region and globally?
o What is your level of visibility into the business?
• Levers for sustainable growth and to mitigate
external forces
• Opportunities for growth…near term…next decade
• Uses of cash

Market: Managing Director
• Head of Sales • Head of Marketing • Head of Finance
3 Global Regions: • Americas • Europe Africa & Middle East • Asia Pacific
Group President Heads of major functional areas
Corporate: CEO – Leadership Development & Strategic focus COO – Day to day operations Heads of major functional areas
Visibility
Weekly: Reporting & Calls from markets
Monthly: Monthly Performance Review, Formalized calls with markets
Weekly / Daily contact Managing Directors
Daily contact Sales Force
Decentralized Structure
>
>
>
HOW THE BUSINESS IS ORGANIZED
6
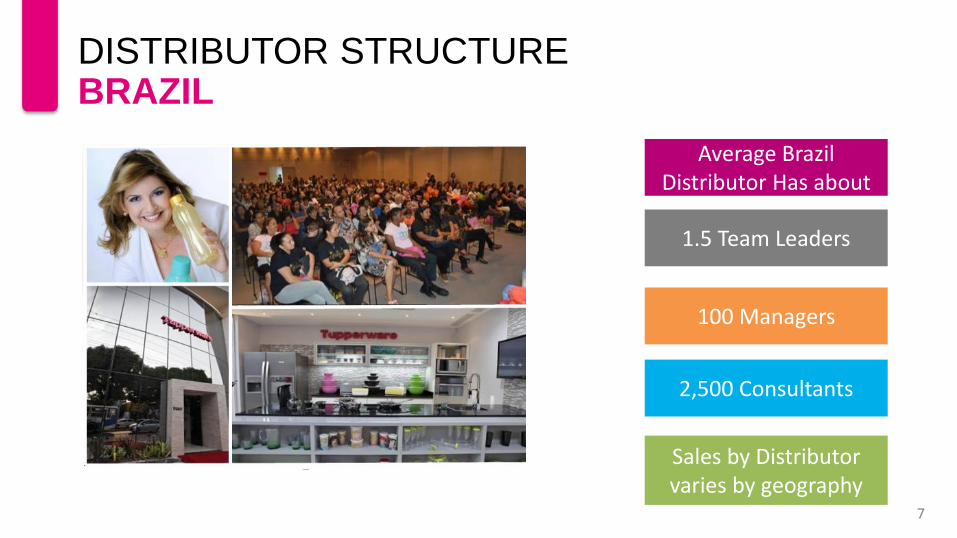
Average Brazil Distributor Has about
1.5 Team Leaders
100 Managers
2,500 Consultants
Sales by Distributor varies by geography
DISTRIBUTOR STRUCTURE BRAZIL
7
8
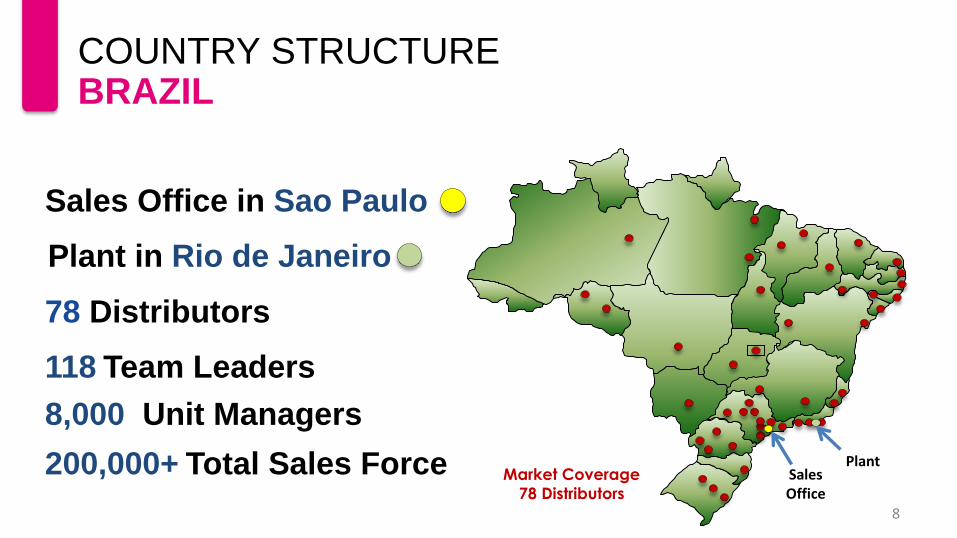
Sales Office in Sao Paulo
78 Distributors
118 Team Leaders
8,000 Unit Managers
200,000+ Total Sales Force
Plant in Rio de Janeiro
Market Coverage
78 Distributors
Plant Sales Office
COUNTRY STRUCTURE BRAZIL

9
SALES
FORCE SIZE Recruit MORE
Retain MORE
Activate MORE Sell to MORE Customers
Sell HIGHER Priced Products
ACTIVATION PRODUCTIVITY
SALES GROWTH FORMULA MORE SELLERS, SELLING MORE

10
LEVERS FOR SUSTAINABLE GROWTH POWERFUL BUSINESS MODEL
Relationship
Based
Selling
Method
Direct to
Consumer
Fundamentals
Brand &
Product
Real
Opportunity
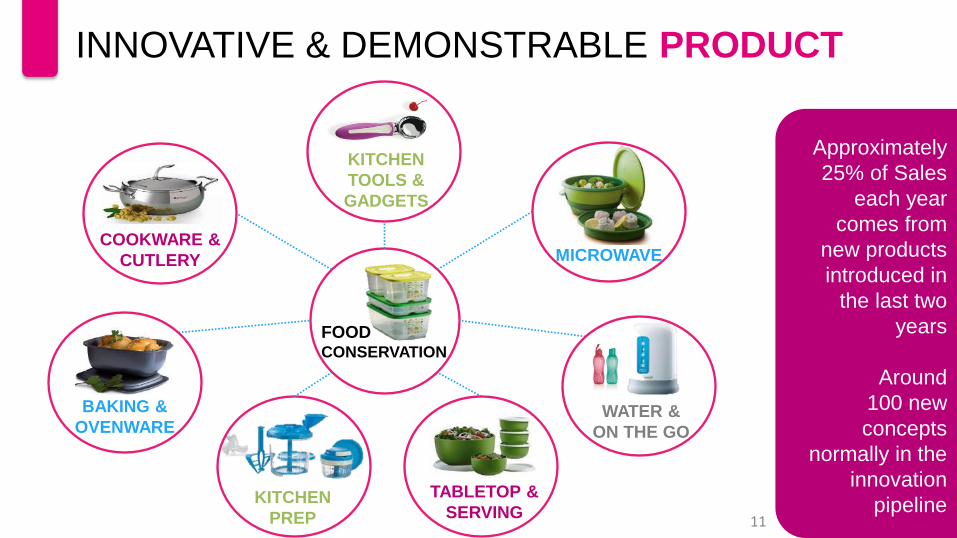
INNOVATIVE & DEMONSTRABLE PRODUCT
COOKWARE &
CUTLERY
BAKING &
OVENWARE
KITCHEN
TOOLS &
GADGETS
MICROWAVE
WATER &
ON THE GO
TABLETOP &
SERVING KITCHEN
PREP
FOOD CONSERVATION
Approximately
25% of Sales
each year
comes from
new products
introduced in
the last two
years
Around
100 new
concepts
normally in the
innovation
pipeline
11

12
A group selling situation or party
is held every
1.3 sec
Rent Advertising
RELATIONSHIP BASED SELLING METHOD

Earnings Opportunity Career Opportunity
13
Part-time
Supplemental
Income
Super
Seller
Demonstrator
Unit Manager
Team Leader
Distributor
REAL & COMPELLING SALES FORCE OPPORTUNITY

• Training
• Recognition
• Competition
• Motivation
14
DIRECT TO CONSUMER FUNDAMENTALS

15
RECRUIT
MORE
SELLERS
MORE
ACTIVE &
PRODUCTIVE
STAY
LONGER
STRENGTHEN THE CORE
THROUGH
16
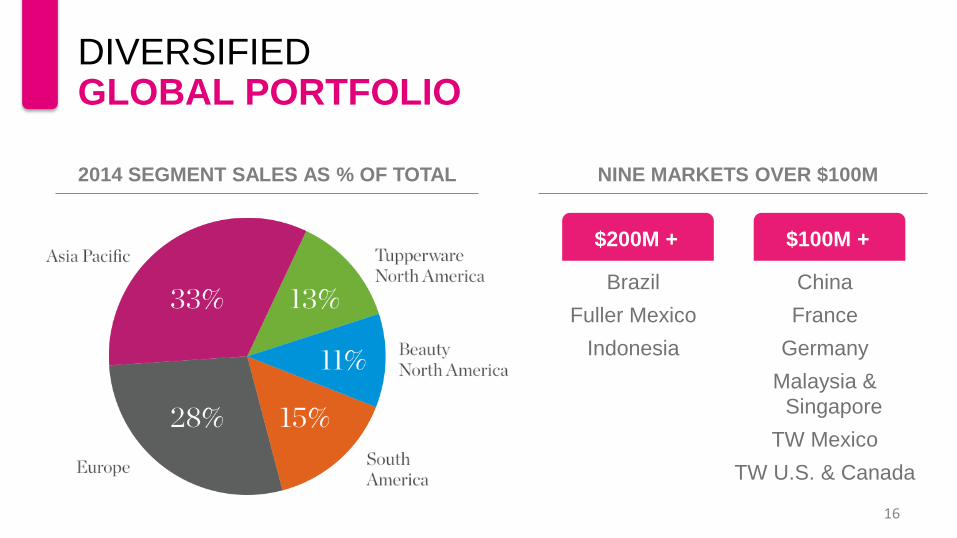
DIVERSIFIED GLOBAL PORTFOLIO
2014 SEGMENT SALES AS % OF TOTAL NINE MARKETS OVER $100M
Brazil
Fuller Mexico
Indonesia
$200M +
China
France
Germany
Malaysia &
Singapore
TW Mexico
TW U.S. & Canada
$100M +

EMERGING AND ESTABLISHED MARKETS
Established
Markets
14% of World’s Population
34% of 2014 Sales
17
Emerging
Markets
86% of World’s Population
66% of 2014 Sales
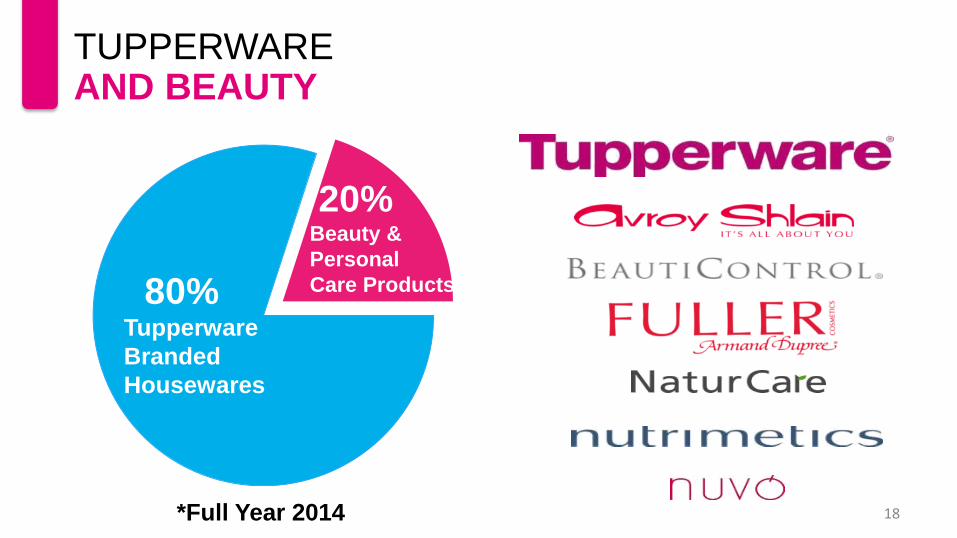
18 *Full Year 2014
80% Tupperware
Branded
Housewares
20% Beauty &
Personal
Care Products
TUPPERWARE AND BEAUTY
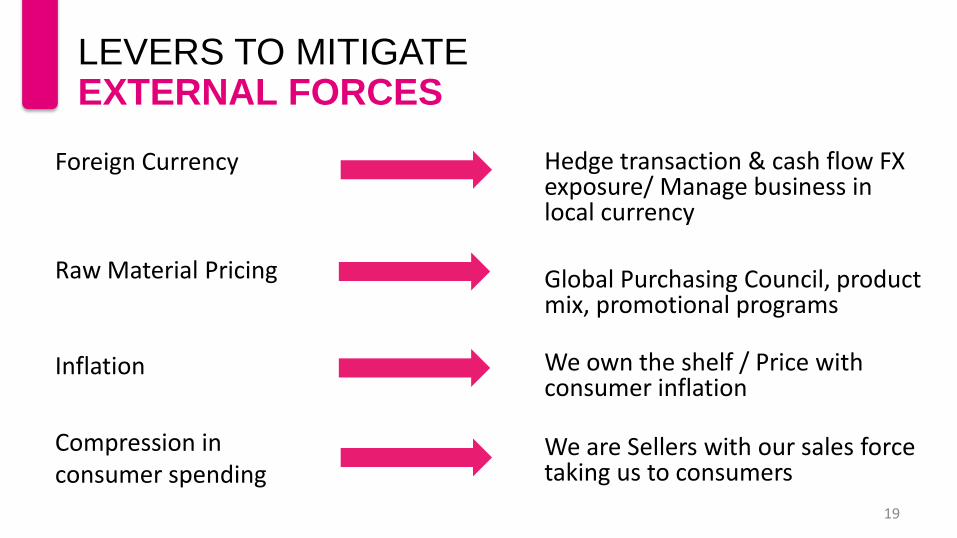
Foreign Currency
Raw Material Pricing Inflation
Compression in consumer spending
Hedge transaction & cash flow FX exposure/ Manage business in local currency
Global Purchasing Council, product mix, promotional programs
We own the shelf / Price with consumer inflation
We are Sellers with our sales force taking us to consumers 19
LEVERS TO MITIGATE EXTERNAL FORCES
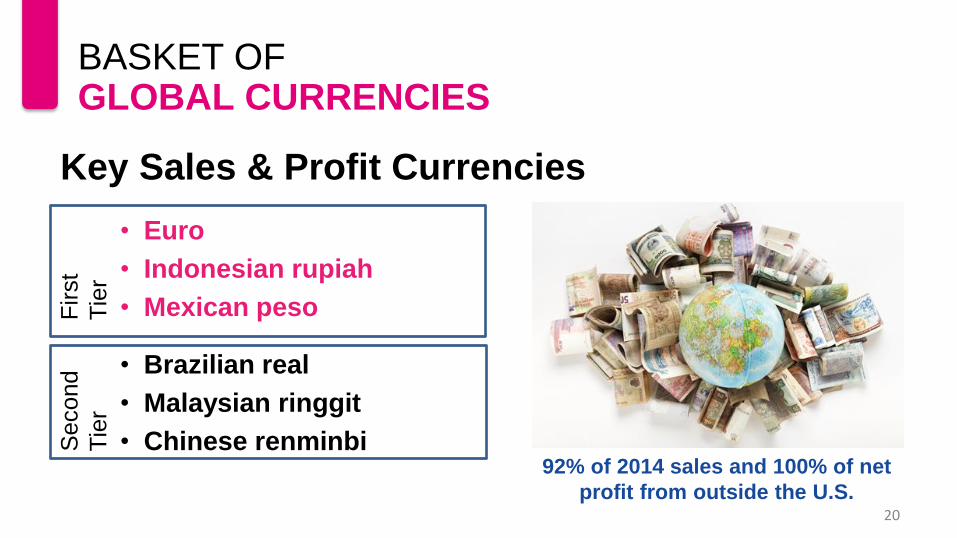
20
Key Sales & Profit Currencies
• Euro
• Indonesian rupiah
• Mexican peso
• Brazilian real
• Malaysian ringgit
• Chinese renminbi
92% of 2014 sales and 100% of net
profit from outside the U.S.
BASKET OF GLOBAL CURRENCIES
First
Tie
r
Second
Tie
r
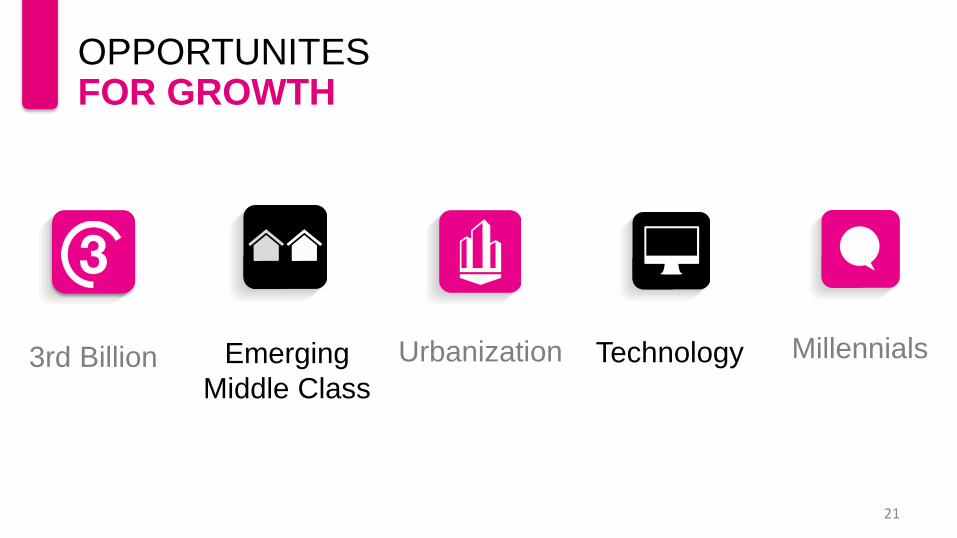
21
OPPORTUNITES FOR GROWTH
Technology Millennials Emerging
Middle Class
Urbanization 3rd Billion
22
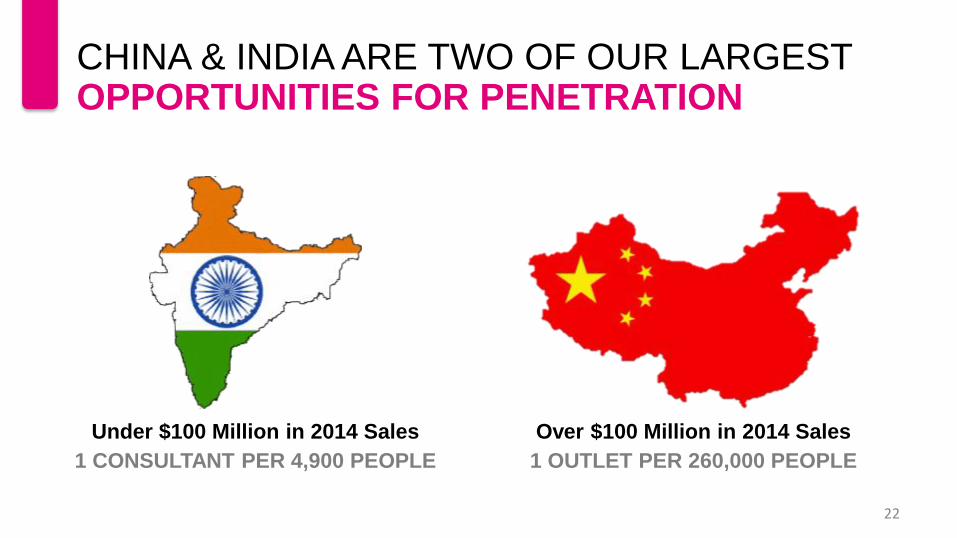
Over $100 Million in 2014 Sales
1 OUTLET PER 260,000 PEOPLE
Under $100 Million in 2014 Sales
1 CONSULTANT PER 4,900 PEOPLE
CHINA & INDIA ARE TWO OF OUR LARGEST OPPORTUNITIES FOR PENETRATION
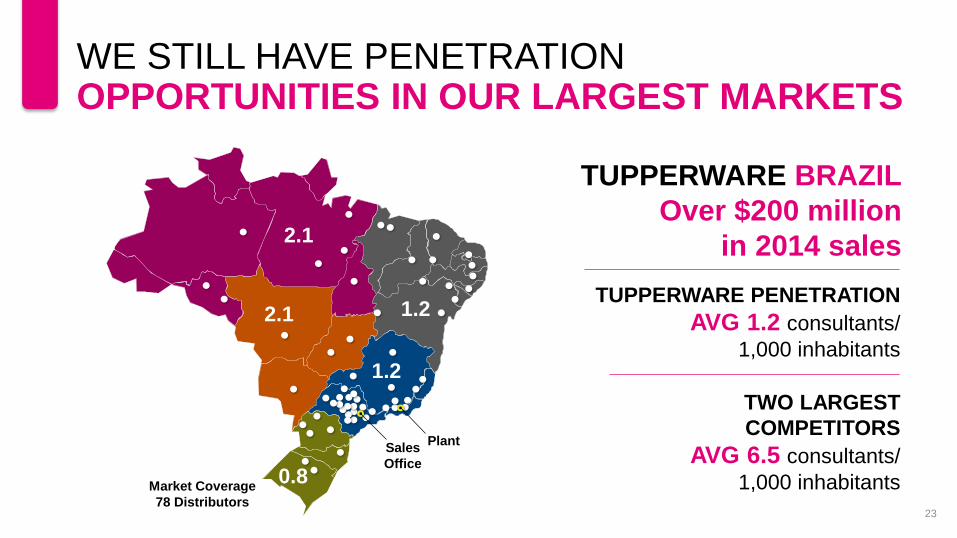
23
TUPPERWARE PENETRATION
AVG 1.2 consultants/
1,000 inhabitants
TUPPERWARE BRAZIL
Over $200 million
in 2014 sales
Market Coverage
78 Distributors
Plant Sales
Office
1.2
2.1
2.1
1.2
0.8
NORTH
NORTHEAST
SOUTHEAST
SOUTH
CENTERWEST
TWO LARGEST
COMPETITORS
AVG 6.5 consultants/
1,000 inhabitants
WE STILL HAVE PENETRATION OPPORTUNITIES IN OUR LARGEST MARKETS

LEVERAGING TECHNOLOGY TO ENABLE THE SALES FORCE
24
ENGAGE
MILLENNIALS
ENHANCE SALES
FORCE DIGITAL
TOOLS
REACH MORE
CONSUMERS

25
VALUE
STRONG RECORD of
GROWTH and of RETURNING
26
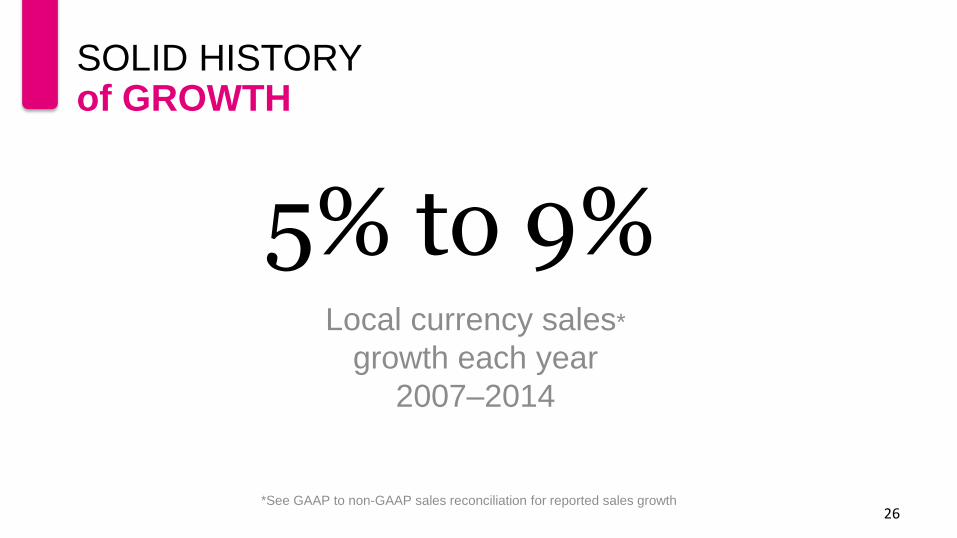
Local currency sales*
growth each year
2007–2014
*See GAAP to non-GAAP sales reconciliation for reported sales growth
SOLID HISTORY of GROWTH
5% to 9%
27
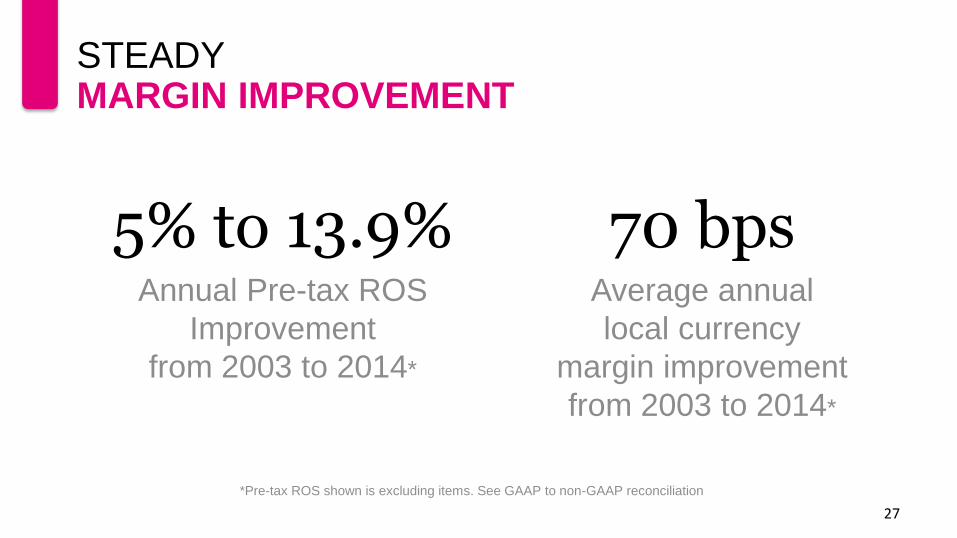
Annual Pre-tax ROS
Improvement
from 2003 to 2014*
5% to 13.9%
*Pre-tax ROS shown is excluding items. See GAAP to non-GAAP reconciliation
Average annual
local currency
margin improvement
from 2003 to 2014*
70 bps
STEADY MARGIN IMPROVEMENT
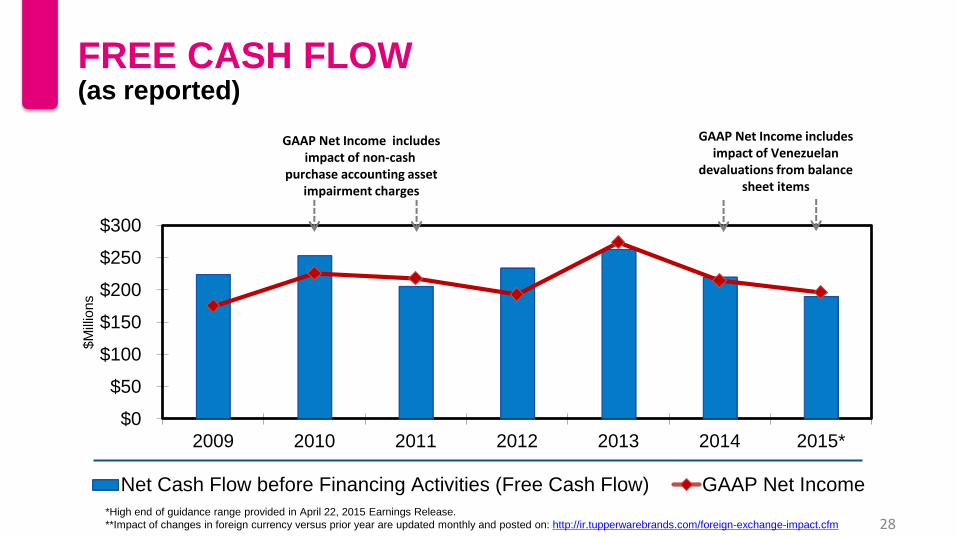
$0
$50
$100
$150
$200
$250
$300
2009 2010 2011 2012 2013 2014 2015*
$M
illio
ns
Net Cash Flow before Financing Activities (Free Cash Flow) GAAP Net Income
28 *High end of guidance range provided in April 22, 2015 Earnings Release.
**Impact of changes in foreign currency versus prior year are updated monthly and posted on: http://ir.tupperwarebrands.com/foreign-exchange-impact.cfm
GAAP Net Income includes impact of non-cash
purchase accounting asset impairment charges
GAAP Net Income includes impact of Venezuelan
devaluations from balance sheet items
FREE CASH FLOW (as reported)
29
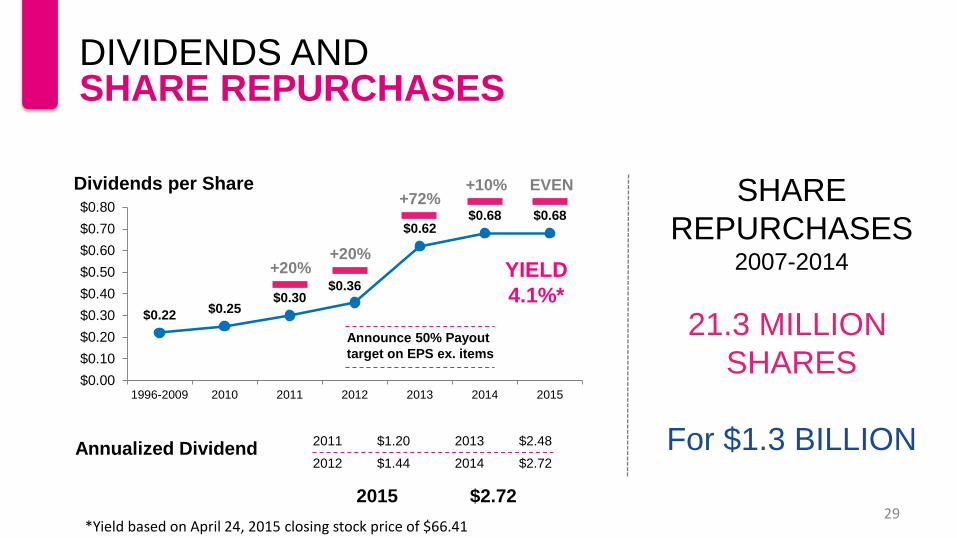
DIVIDENDS AND SHARE REPURCHASES
Annualized Dividend 2011
2012
$1.20
$1.44
2013
2014
$2.48
$2.72
2015 $2.72
$0.22 $0.25
$0.30 $0.36
$0.62 $0.68 $0.68
$0.00
$0.10
$0.20
$0.30
$0.40
$0.50
$0.60
$0.70
$0.80
1996-2009 2010 2011 2012 2013 2014 2015
Dividends per Share
+20%
Announce 50% Payout
target on EPS ex. items
YIELD
4.1%*
+20%
+72% +10% EVEN
*Yield based on April 24, 2015 closing stock price of $66.41
SHARE
REPURCHASES 2007-2014
21.3 MILLION
SHARES
For $1.3 BILLION
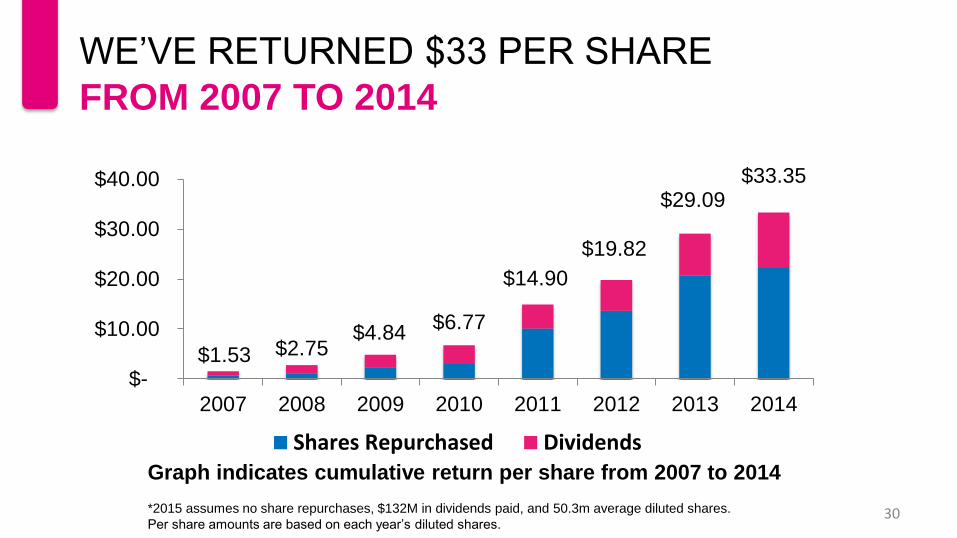
WE’VE RETURNED $33 PER SHARE FROM 2007 TO 2014
30
$1.53 $2.75 $4.84
$6.77
$14.90
$19.82
$29.09 $33.35
$-
$10.00
$20.00
$30.00
$40.00
2007 2008 2009 2010 2011 2012 2013 2014
Shares Repurchased Dividends
*2015 assumes no share repurchases, $132M in dividends paid, and 50.3m average diluted shares.
Per share amounts are based on each year’s diluted shares.
Graph indicates cumulative return per share from 2007 to 2014
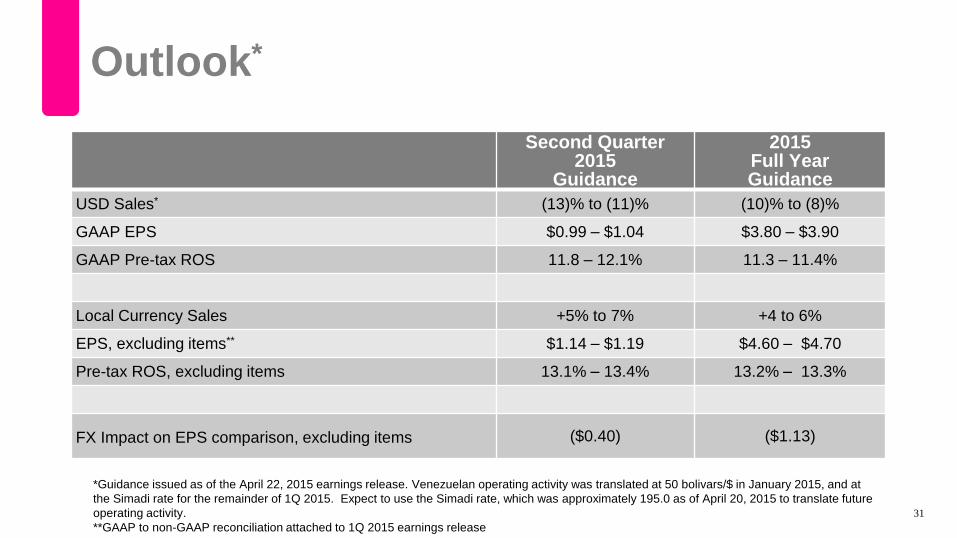
Outlook*
31
Second Quarter 2015
Guidance
2015 Full Year Guidance
USD Sales* (13)% to (11)% (10)% to (8)%
GAAP EPS $0.99 – $1.04 $3.80 – $3.90
GAAP Pre-tax ROS 11.8 – 12.1% 11.3 – 11.4%
Local Currency Sales +5% to 7% +4 to 6%
EPS, excluding items** $1.14 – $1.19 $4.60 – $4.70
Pre-tax ROS, excluding items 13.1% – 13.4% 13.2% – 13.3%
FX Impact on EPS comparison, excluding items ($0.40) ($1.13)
*Guidance issued as of the April 22, 2015 earnings release. Venezuelan operating activity was translated at 50 bolivars/$ in January 2015, and at
the Simadi rate for the remainder of 1Q 2015. Expect to use the Simadi rate, which was approximately 195.0 as of April 20, 2015 to translate future
operating activity.
**GAAP to non-GAAP reconciliation attached to 1Q 2015 earnings release
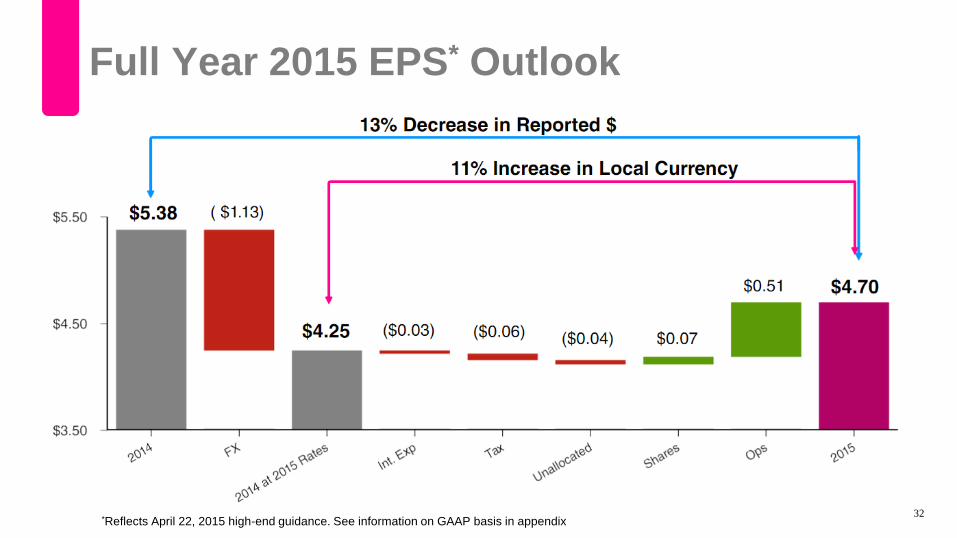
Full Year 2015 EPS* Outlook
32 *Reflects April 22, 2015 high-end guidance. See information on GAAP basis in appendix

Pre-Tax ROS, excluding items: 13.3% GAAP pre-tax ROS 11.4%
2014 Pre-Tax ROS 13.9%
2015 vs. 2014 translation FX -125 bp 2014 Pre-Tax ROS in Local Currency 12.7% 2015 LC Operating Margin Improvement +60
Incremental 2015 interest -8
Other/ Rounding 10
2015 High end pretax ROS 13.3%
33 *Pre-tax ROS reflects high end April 22, 2015 guidance
Impact of changes in foreign currency versus prior year are updated monthly and posted on: http://ir.tupperwarebrands.com/foreign-exchange-impact.cfm
2015 FULL YEAR ROS OUTLOOK*

Double Digit EPS Growth driven by:
•Local Currency Sales: +6% to 8% • Emerging markets about 10% • Established markets low single digit
•Pre-Tax ROS, excluding items:
• 50 bps improvement per year into the mid- to high-teens
•Some offset from tax rate: • Going to 27-28% over time
•CAPEX $70 - $80 million a year
•Share repurchases
34
LONG RANGE OUTLOOK
35
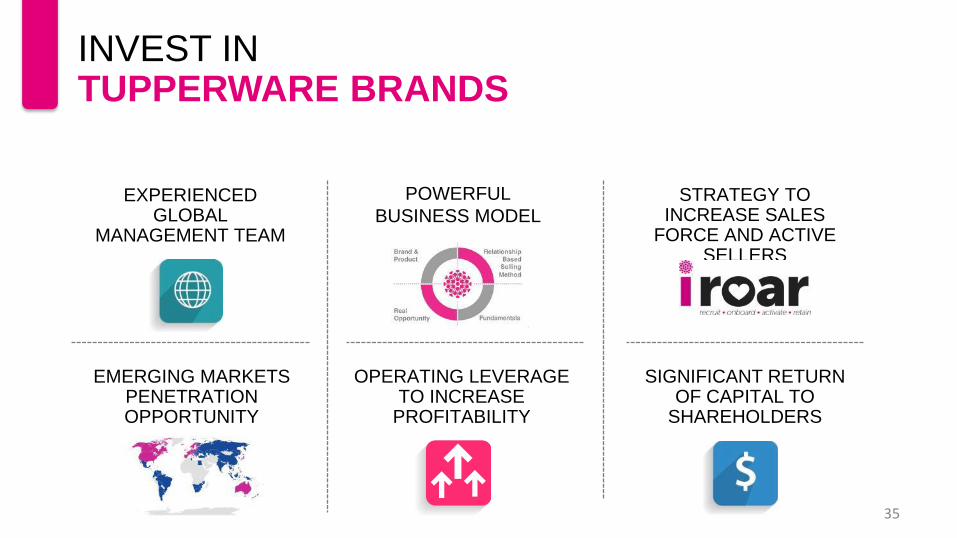
POWERFUL
BUSINESS MODEL
EMERGING MARKETS PENETRATION OPPORTUNITY
STRATEGY TO INCREASE SALES
FORCE AND ACTIVE SELLERS
OPERATING LEVERAGE TO INCREASE
PROFITABILITY
EXPERIENCED GLOBAL
MANAGEMENT TEAM
SIGNIFICANT RETURN OF CAPITAL TO
SHAREHOLDERS
INVEST IN TUPPERWARE BRANDS

APPENDIX

$0
$1
$2
$3
$4
$5
$6
$7
$0
$500
$1,000
$1,500
$2,000
$2,500
$3,000
2009 2010 2011 2012 2013 2014 2015*
Sales Diluted EPS Adjusted Diluted EPS37
Sales
$million
Diluted EPS includes impact of non-cash
purchase accounting asset impairment charges
EPS
$Dollar
*High end of guidance range provided in April 22, 2015 Earnings Release.
Impact of changes in foreign currency versus prior year are updated monthly and posted on: http://ir.tupperwarebrands.com/foreign-exchange-impact.cfm
Diluted EPS includes impact from balance
sheet items of Venezuelan
devaluations
CONSISTENTLY GROWING SALES & EPS
38
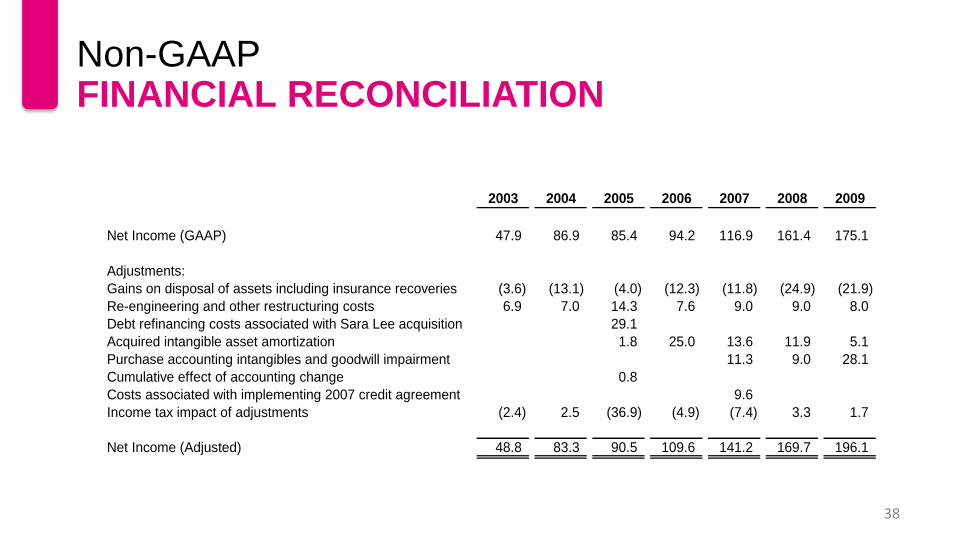
Non-GAAP FINANCIAL RECONCILIATION
2003 2004 2005 2006 2007 2008 2009 2010*
Net Income (GAAP) 47.9 86.9 85.4 94.2 116.9 161.4 175.1 221.2
Adjustments:
Gains on disposal of assets including insurance recoveries (3.6) (13.1) (4.0) (12.3) (11.8) (24.9) (21.9)
Re-engineering and other restructuring costs 6.9 7.0 14.3 7.6 9.0 9.0 8.0 10.0
Debt refinancing costs associated with Sara Lee acquisition 29.1
Acquired intangible asset amortization 1.8 25.0 13.6 11.9 5.1 3.8
Purchase accounting intangibles and goodwill impairment 11.3 9.0 28.1
Cumulative effect of accounting change 0.8
Costs associated with implementing 2007 credit agreement 9.6
Income tax impact of adjustments (2.4) 2.5 (36.9) (4.9) (7.4) 3.3 1.7 (4.0)
Net Income (Adjusted) 48.8 83.3 90.5 109.6 141.2 169.7 196.1 231.0
* High end of 2010 outlook provided in July 19, 2010 Earnings Release

39
2010 2011 2012 2013 Q4 2014 2014 Q1 2015 Q2 2015* 2015*
Net Income (GAAP) $225.6 $218.3 $193.0 $274.2 $79.9 $212.0 $29.5 $52.3 $196.6
ADJUSTMENTS:
Gains on disposal of assets including insurance
recoveries (0.2) (3.8) (7.9) (0.7) (0.4) (2.7) (0.6) (0.7)
Re-engineering and other restructuring costs 7.6 9.6 22.1 9.3 2.8 13.4 16.2 3.6 24.6
Impact of Venezuelan bolivar devaluation from
balance sheet positions 4.2 0.2 42.4
9.3 1.0 10.3
Swap impairment and debt cost write-off 19.8
Acquired intangible asset amortization 3.9 2.9 2.1 4.8 2.9 11.9 2.7 2.7 10.9
Purchase accounting intangibles and goodwill
impairment 4.3 36.1 76.9
Income tax impact of adjustments (3.3) (9.6) (4.8) (3.5) 1.4 (2.4) (5.9) 0.2 (5.3)
Net Income (Adjusted) $237.9 $273.3 $281.4 $288.3 $86.8 $274.6 $51.2 $59.8 $236.4
Adjusted ROS 13.9% 13.9% 14.1% 14.1% 16.9% 13.9 % 11.8% 12.1% 13.3%
Average number of diluted shares (millions) 61.4 61.4 56.4 53.1 50.6 51.0 50.3 50.3 50.3
*High end of guidance range provided in April 22, 2015 Earnings Release.
Impact of changes in foreign currency versus prior year are updated monthly and posted on: http://ir.tupperwarebrands.com/foreign-exchange-impact.cfm
Non-GAAP FINANCIAL RECONCILIATION
40
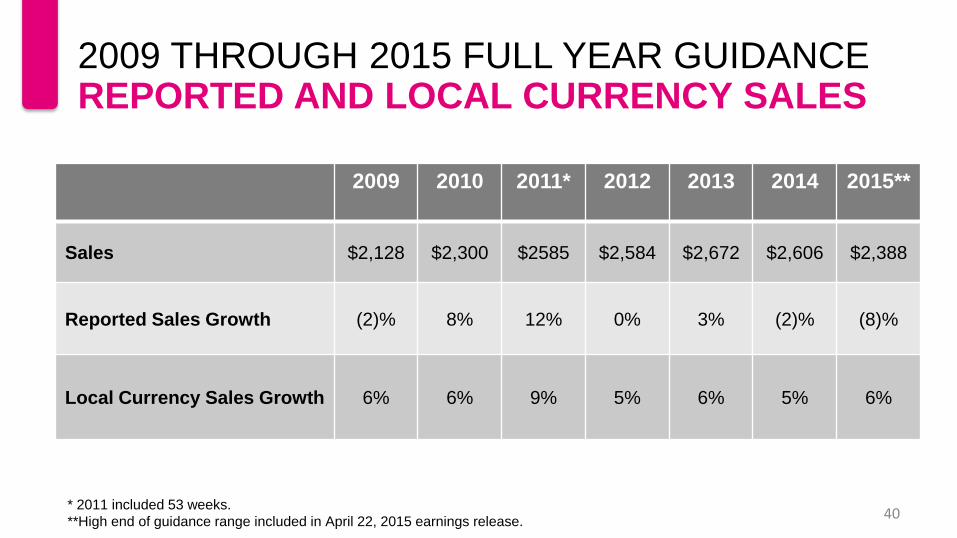
2009 2010 2011* 2012 2013 2014 2015**
Sales $2,128 $2,300 $2585 $2,584 $2,672 $2,606 $2,388
Reported Sales Growth (2)% 8% 12% 0% 3% (2)% (8)%
Local Currency Sales Growth 6% 6% 9% 5% 6% 5% 6%
*2011 had 53 weeks compared with 52 weeks in 2010
**2015 assumes the high-end of local currency sales growth
2009 THROUGH 2015 FULL YEAR GUIDANCE REPORTED AND LOCAL CURRENCY SALES
* 2011 included 53 weeks.
**High end of guidance range included in April 22, 2015 earnings release.
1H – 2014
Q3 – 2014
Q4 – 2014
FY 2014
Q1 – 2015(1)
Q2 – 2015(1)
FY 2015(1)
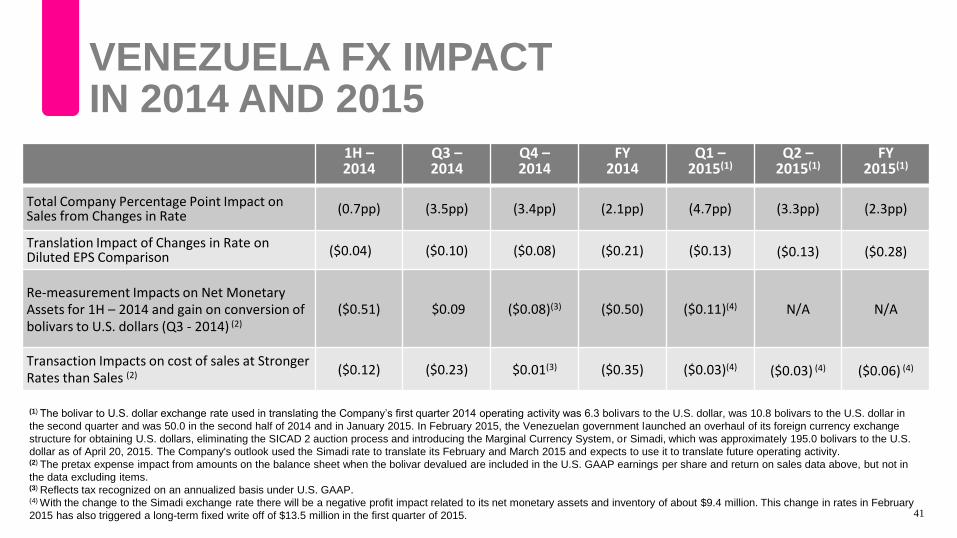
Total Company Percentage Point Impact on Sales from Changes in Rate
(0.7pp) (3.5pp) (3.4pp) (2.1pp) (4.7pp) (3.3pp) (2.3pp)
Translation Impact of Changes in Rate on Diluted EPS Comparison ($0.04) ($0.10) ($0.08) ($0.21) ($0.13) ($0.13) ($0.28)
Re-measurement Impacts on Net Monetary Assets for 1H – 2014 and gain on conversion of bolivars to U.S. dollars (Q3 - 2014) (2)
($0.51) $0.09 ($0.08)(3) ($0.50) ($0.11)(4) N/A N/A
Transaction Impacts on cost of sales at Stronger Rates than Sales (2) ($0.12) ($0.23) $0.01(3) ($0.35) ($0.03)(4) ($0.03) (4) ($0.06) (4)
(1) The bolivar to U.S. dollar exchange rate used in translating the Company’s first quarter 2014 operating activity was 6.3 bolivars to the U.S. dollar, was 10.8 bolivars to the U.S. dollar in
the second quarter and was 50.0 in the second half of 2014 and in January 2015. In February 2015, the Venezuelan government launched an overhaul of its foreign currency exchange
structure for obtaining U.S. dollars, eliminating the SICAD 2 auction process and introducing the Marginal Currency System, or Simadi, which was approximately 195.0 bolivars to the U.S.
dollar as of April 20, 2015. The Company's outlook used the Simadi rate to translate its February and March 2015 and expects to use it to translate future operating activity. (2) The pretax expense impact from amounts on the balance sheet when the bolivar devalued are included in the U.S. GAAP earnings per share and return on sales data above, but not in
the data excluding items. (3) Reflects tax recognized on an annualized basis under U.S. GAAP. (4) With the change to the Simadi exchange rate there will be a negative profit impact related to its net monetary assets and inventory of about $9.4 million. This change in rates in February
2015 has also triggered a long-term fixed write off of $13.5 million in the first quarter of 2015.
VENEZUELA FX IMPACT IN 2014 AND 2015
41

May 2015


