18
First Capital Research Feb 2019

First Capital Research
Feb 2019

Feb 2019First Capital Research 2
• Inflation……………………………………………………………………………………………… 3
• M2B & Sector Credit…………………………………………………………………................… 5
• Reserves & Liquidity………………………………………………………………………............ 6
• Currency Movement…………………………………………………………………................... 7
• Government Securities……………………………………………………………….................. 8
• Finance Sector Rate Movement……………………………………………………………..... … 11
• External Sector…………………………………………………………………………………….. 12
• Tourist Arrivals…………………………………………………………………………………….. 16
• Global Markets…………………………………………………………………………………….. 17

• MoM increase in inflation by0.9% was due to theexpenditure value decreaseof Food items by 0.75% andincrease of Non Food items by1.66%. Price decline inVegetable led the valuedecrease in the food category,while in Non Food Category,increase was mainly led byHousing Water Electricity Gasand Other Fuels (0.89%).
• The YoY inflation increased to3.7% in January 2019 from2.8% reported in Decemberas a result of increase in valueof Non Food Group.
First Capital Research 3
5.8%
4.5% 4.2%
3.8%4.0%
4.4%
5.4%
5.9%
4.3%
3.1%3.3%
2.8%
3.7%3.5% 3.5%
3.4%
3.5%3.2%
3.4%
3.9%
3.7%3.8%
3.8%
3.4%
3.1%
5.5%
2.0%
3.0%
4.0%
5.0%
6.0%
7.0%
Inflation YoY Core Inflation YoY
Source: Dept. Census and Statistics Feb 2019

• NCPI for November 2018decreased to 0.4% from 1.0%recorded in November 2018.
• YoY inflation of food group hasdecreased to -4.5% inDecember 2018 while NonFood Group decreased to 4.7%compared to 5.2% recorded inNovember 2018.
First Capital Research4
7.3%
5.4%
3.2%
2.8%
1.6%
2.1%
2.5%
3.4%
2.5%
0.9%
0.1%
1.0%
0.4%
2.7%
2.1% 2.0% 1.9% 1.9% 1.7% 1.8%
2.3%
2.7%
3.1%3.4%
3.1% 3.1%
0.0%
1.0%
2.0%
3.0%
4.0%
5.0%
6.0%
7.0%
8.0%
NCPI YoY Core NCPI YoY
Source: Dept. Census and StatisticsFeb 2019
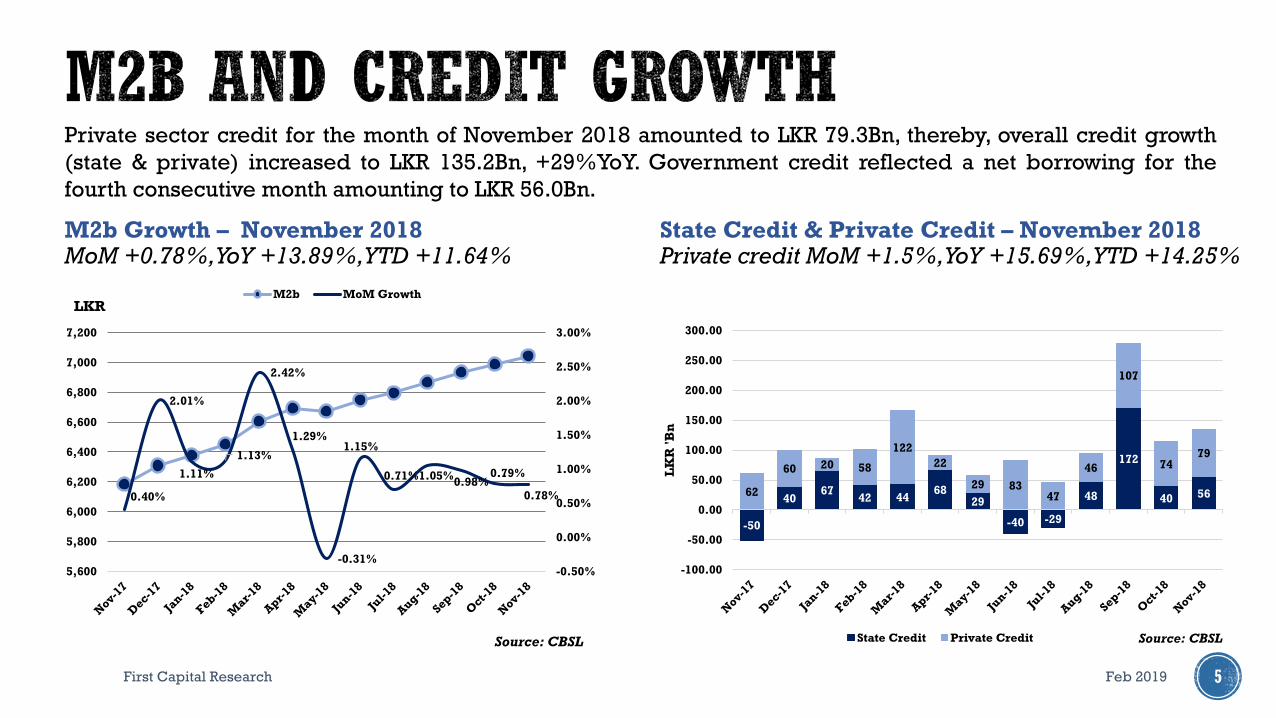
M2b Growth – November 2018MoM +0.78%, YoY +13.89%, YTD +11.64%
First Capital Research 5
Private sector credit for the month of November 2018 amounted to LKR 79.3Bn, thereby, overall credit growth
(state & private) increased to LKR 135.2Bn, +29%YoY. Government credit reflected a net borrowing for the
fourth consecutive month amounting to LKR 56.0Bn.
State Credit & Private Credit – November 2018 Private credit MoM +1.5%, YoY +15.69%, YTD +14.25%
-50
4067
42 4468
29
-40 -29
48
172
40 5662
60 20 58
122
22
29 8347
46
107
7479
-100.00
-50.00
0.00
50.00
100.00
150.00
200.00
250.00
300.00
LK
R '
Bn
State Credit Private Credit Source: CBSL
0.40%
2.01%
1.11%
1.13%
2.42%
1.29%
-0.31%
1.15%
0.71%1.05%0.98%
0.79%
0.78%
-0.50%
0.00%
0.50%
1.00%
1.50%
2.00%
2.50%
3.00%
5,600
5,800
6,000
6,200
6,400
6,600
6,800
7,000
7,200
M2b MoM Growth
Source: CBSL
LKR
Feb 2019
First Capital Research 6
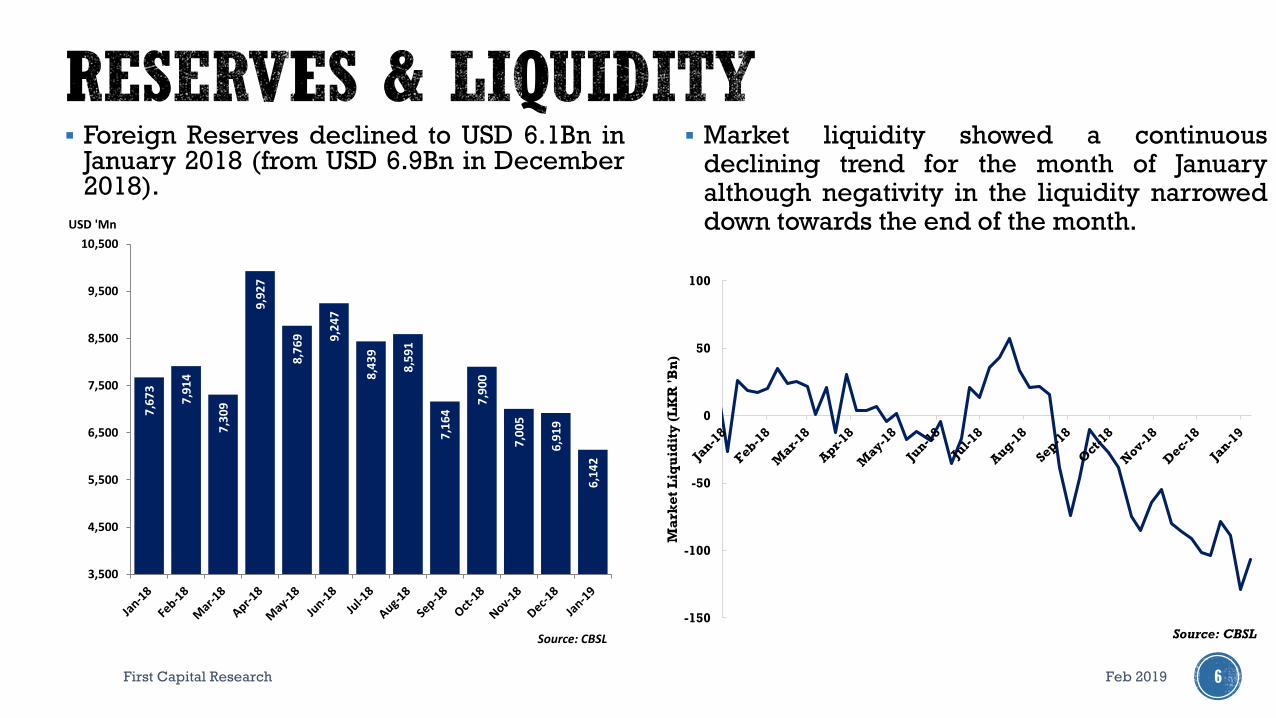
▪ Foreign Reserves declined to USD 6.1Bn inJanuary 2018 (from USD 6.9Bn in December2018).
▪ Market liquidity showed a continuousdeclining trend for the month of Januaryalthough negativity in the liquidity narroweddown towards the end of the month.
-150
-100
-50
0
50
100
Ma
rke
t L
iqu
idit
y (
LK
R '
Bn
)
Source: CBSL
Feb 2019
7,6
73
7,9
14
7,3
09
9,9
27
8,7
69 9,2
47
8,4
39
8,5
91
7,1
64
7,9
00
7,0
05
6,9
19
6,1
42
3,500
4,500
5,500
6,500
7,500
8,500
9,500
10,500
USD 'Mn
Source: CBSL

USD:LKR Movement Sri Lankan Rupee vs Global Currencies
First Capital Research 7
Source: CBSLJa
nu
ar
y
20
19
YT
D 2
01
9
179.5
180.5
181.5
182.5
183.5
Source: CBSL
Feb 2019
3.4%
1.6%
1.1%
0.1%
-1.0%
-1.3%
-1.8%
-2.1%
-3.0% -2.0% -1.0% 0.0% 1.0% 2.0% 3.0% 4.0%
India Rupee
US Dollar
Euro
Japan YEN
China Renminbi
Aus Dollar
UK Pound
Can Dollar
3.4%
1.6%
1.1%
0.1%
-1.0%
-1.3%
-1.8%
-2.1%
-3.0% -2.0% -1.0% 0.0% 1.0% 2.0% 3.0% 4.0%
India Rupee
US Dollar
Euro
Japaneese yen
China Renminbi
Aus Dollar
UK Pound
Can Dollar

First Capital Research 8
Week EndingBills
('Mn)
Bonds
('Mn)Total
04-Jan-19 15,500 15,500
11-Jan-19 20,000 20,000
18-Jan-19 26,000 98,000 124,000
25-Jan-19 23,500 23,500
Total Issued 183,000
January 2018 YTD
Maturities 149,846 149,846
New Issues 183,000 183,000
Excess/(Deficit) 33,154 33,154
CBSL Holdings of Gov. Securities YTD
As at End Jan.2018 177,093
As at End Dec. 2018 45,797
Increase/ (Decrease) 131,296 131,296
Feb 2019

First Capital Research 9
-200
-150
-100
-50
0
50
100
150
200
Jan-18 Feb-18 Mar-18 Apr-18 May-18 Jun-18 Jul-18 Aug-18 Sep-18 Oct-18 Nov-18 Dec-18 Jan-19
Excess Liquidity CBSL Holdings of Gov. Securities Source: CBSL
Feb 2019
First Capital Research 10
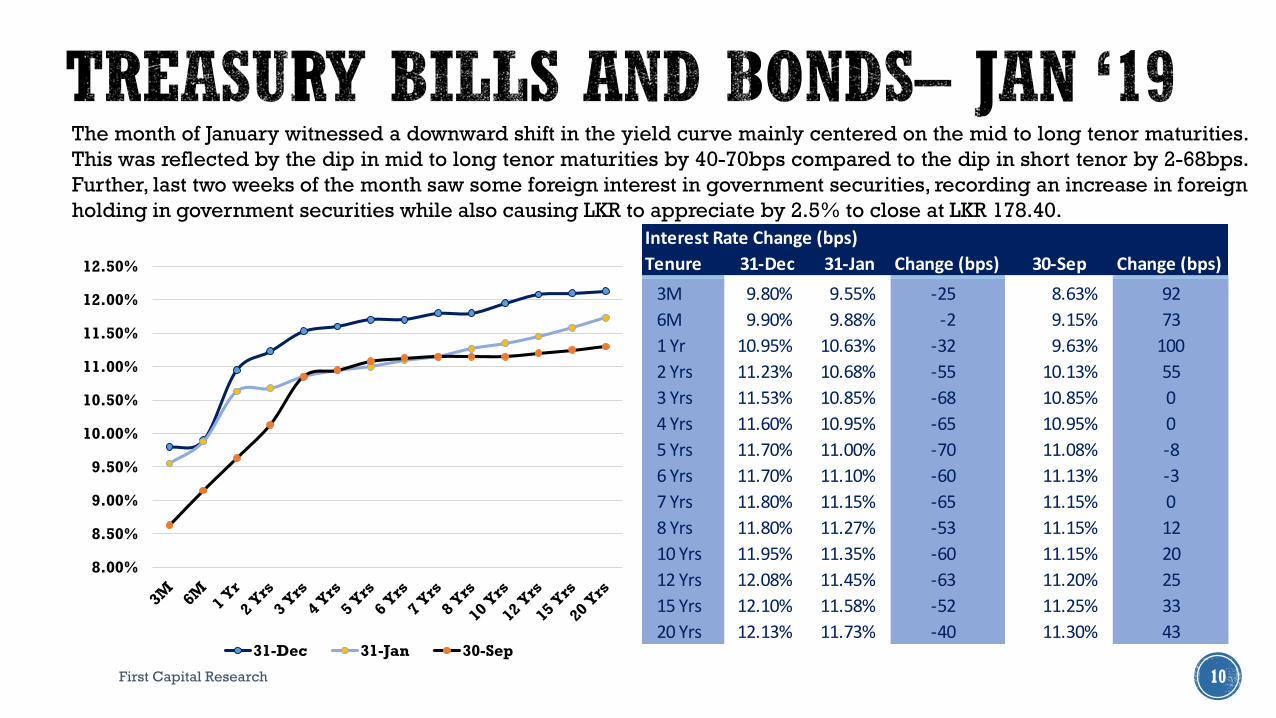
The month of January witnessed a downward shift in the yield curve mainly centered on the mid to long tenor maturities.
This was reflected by the dip in mid to long tenor maturities by 40-70bps compared to the dip in short tenor by 2-68bps.
Further, last two weeks of the month saw some foreign interest in government securities, recording an increase in foreign
holding in government securities while also causing LKR to appreciate by 2.5% to close at LKR 178.40.
8.00%
8.50%
9.00%
9.50%
10.00%
10.50%
11.00%
11.50%
12.00%
12.50%
31-Dec 31-Jan 30-Sep
Interest Rate Change (bps)
Tenure 31-Dec 31-Jan Change (bps) 30-Sep Change (bps)
3M 9.80% 9.55% -25 8.63% 92
6M 9.90% 9.88% -2 9.15% 73
1 Yr 10.95% 10.63% -32 9.63% 100
2 Yrs 11.23% 10.68% -55 10.13% 55
3 Yrs 11.53% 10.85% -68 10.85% 0
4 Yrs 11.60% 10.95% -65 10.95% 0
5 Yrs 11.70% 11.00% -70 11.08% -8
6 Yrs 11.70% 11.10% -60 11.13% -3
7 Yrs 11.80% 11.15% -65 11.15% 0
8 Yrs 11.80% 11.27% -53 11.15% 12
10 Yrs 11.95% 11.35% -60 11.15% 20
12 Yrs 12.08% 11.45% -63 11.20% 25
15 Yrs 12.10% 11.58% -52 11.25% 33
20 Yrs 12.13% 11.73% -40 11.30% 43
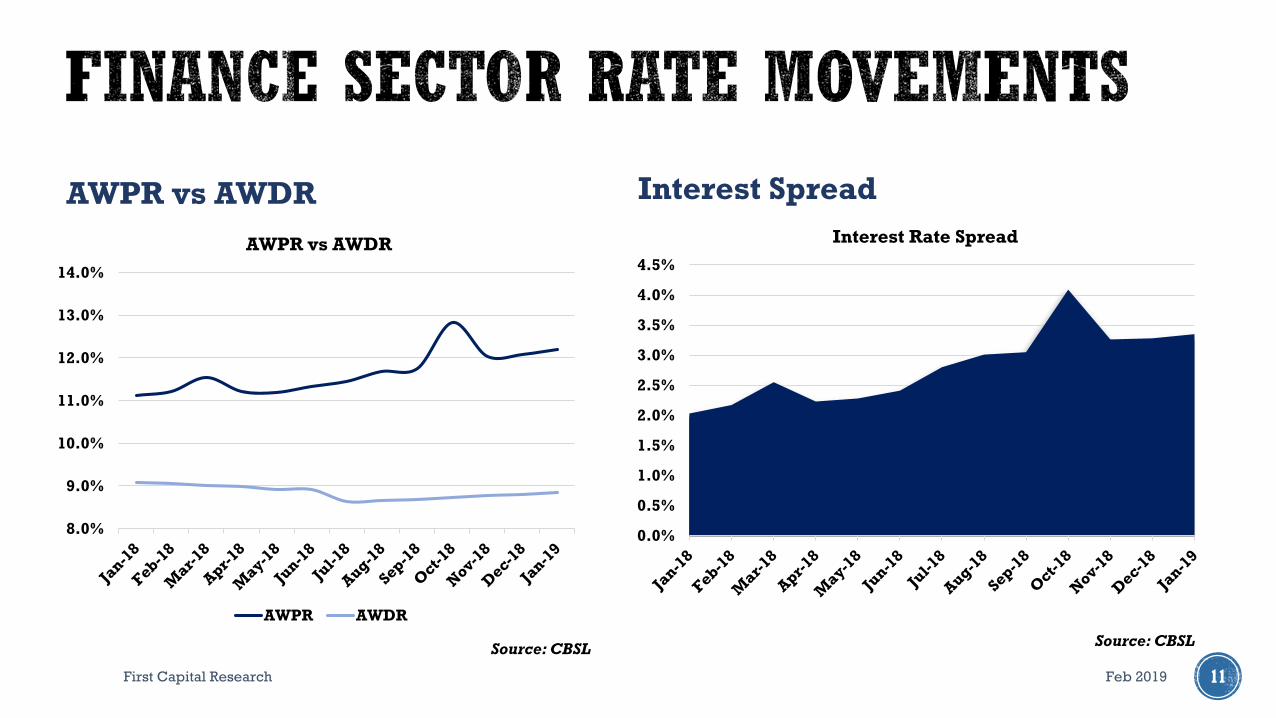
AWPR vs AWDR Interest Spread
First Capital Research 11
Source: CBSLSource: CBSL
Source: CBSL
0.0%
0.5%
1.0%
1.5%
2.0%
2.5%
3.0%
3.5%
4.0%
4.5%
Interest Rate Spread
8.0%
9.0%
10.0%
11.0%
12.0%
13.0%
14.0%
AWPR vs AWDR
AWPR AWDR
Feb 2019

First Capital Research 12
Exports for the month of Nov was recorded at USD 980Mn,+4.1%YoY basis, mainly contributed
by Industrial Exports (+10.4%YoY) which was largely driven by Textiles and garments
(+45.5%YoY). Meanwhile, earnings from agricultural exports declined in Nov 2018 as well due
to weakened earnings in tea, spices, coconut and sea food .
Category 2017
(USD ‘Mn)
2018
(USD ‘Mn)
Change
(%)
Industrial Exports
- Nov
- YTD
713.5
7745.6
787.9
8444.9
10.4
9.0
Agricultural
- Nov
- YTD
224.1
2,547.5
187.8
2,362.7
(16.2)
(7.3)
Mineral and other
- Nov
- YTD
3.3
47.8
3.9
48.6
17.2
1.6
Total
- Nov
- YTD
940.9
10,340.9
979.6
10,856.2
4.1
5.0
86
5
86
8
1,0
42
79
5
84
1
98
7
1,0
16
1,0
01
1,0
11
97
6
94
1
1,0
20
96
5
91
6
1,1
08
79
5
92
4
1,0
24 1
,07
3
1,0
37
1,0
55
97
9
98
0
700
750
800
850
900
950
1,000
1,050
1,100
1,150
USD 'Mn
2017 2018 Source: CBSL
Feb 2019
First Capital Research 13
Category 2017
(USD ‘Mn)
2018
(USD ‘Mn)
Change
(%)
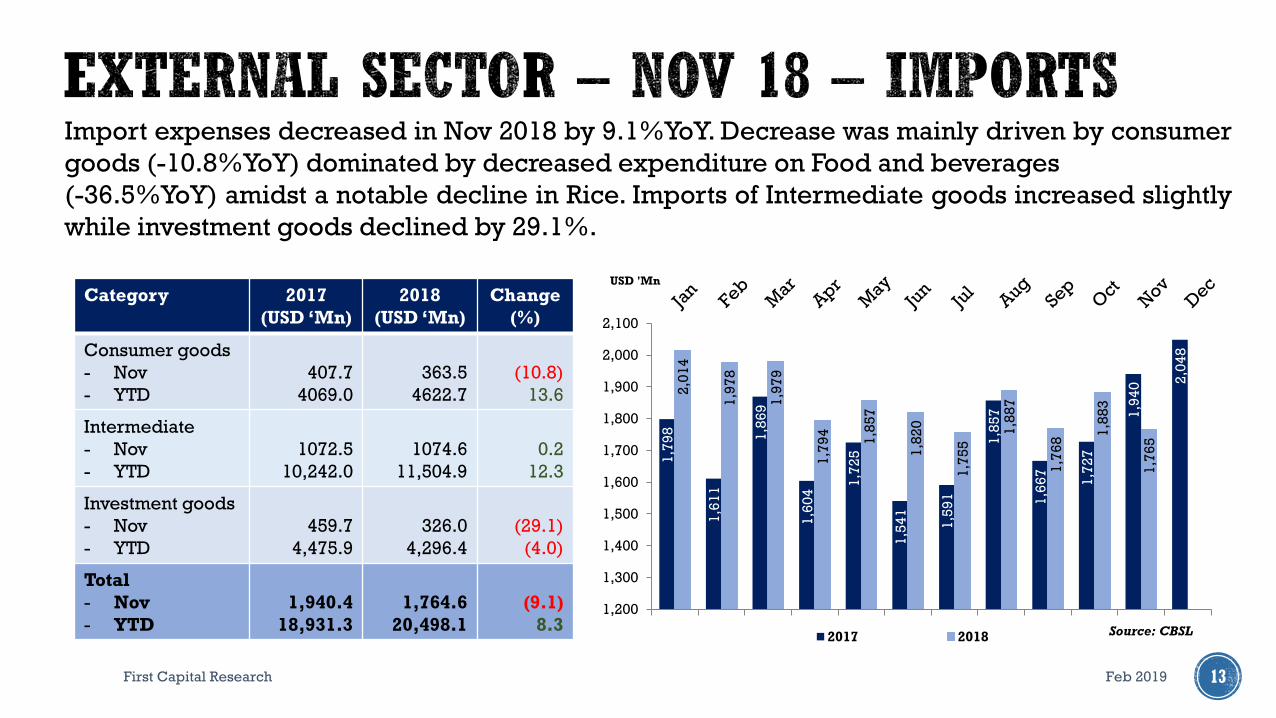
Consumer goods
- Nov
- YTD
407.7
4069.0
363.5
4622.7
(10.8)
13.6
Intermediate
- Nov
- YTD
1072.5
10,242.0
1074.6
11,504.9
0.2
12.3
Investment goods
- Nov
- YTD
459.7
4,475.9
326.0
4,296.4
(29.1)
(4.0)
Total
- Nov
- YTD
1,940.4
18,931.3
1,764.6
20,498.1
(9.1)
8.3
1,7
98
1,6
11
1,8
69
1,6
04
1,7
25
1,5
41
1,5
91
1,8
57
1,6
67
1,7
27
1,9
40 2
,04
8
2,0
14
1,9
78
1,9
79
1,7
94
1,8
57
1,8
20
1,7
55
1,8
87
1,7
68
1,8
83
1,7
65
1,200
1,300
1,400
1,500
1,600
1,700
1,800
1,900
2,000
2,100
2017 2018 Source: CBSL
USD 'Mn
Import expenses decreased in Nov 2018 by 9.1%YoY. Decrease was mainly driven by consumer
goods (-10.8%YoY) dominated by decreased expenditure on Food and beverages
(-36.5%YoY) amidst a notable decline in Rice. Imports of Intermediate goods increased slightly
while investment goods declined by 29.1%.
Feb 2019

First Capital Research 14
-1,000
-1,028
-1,049
-1,062
-871
-999
-933
-795
-681
-850
-713
-903
-785
-1,200 -1,000 -800 -600 -400 -200 0
Balance of Trade
Source: Central Bank
Feb 2019
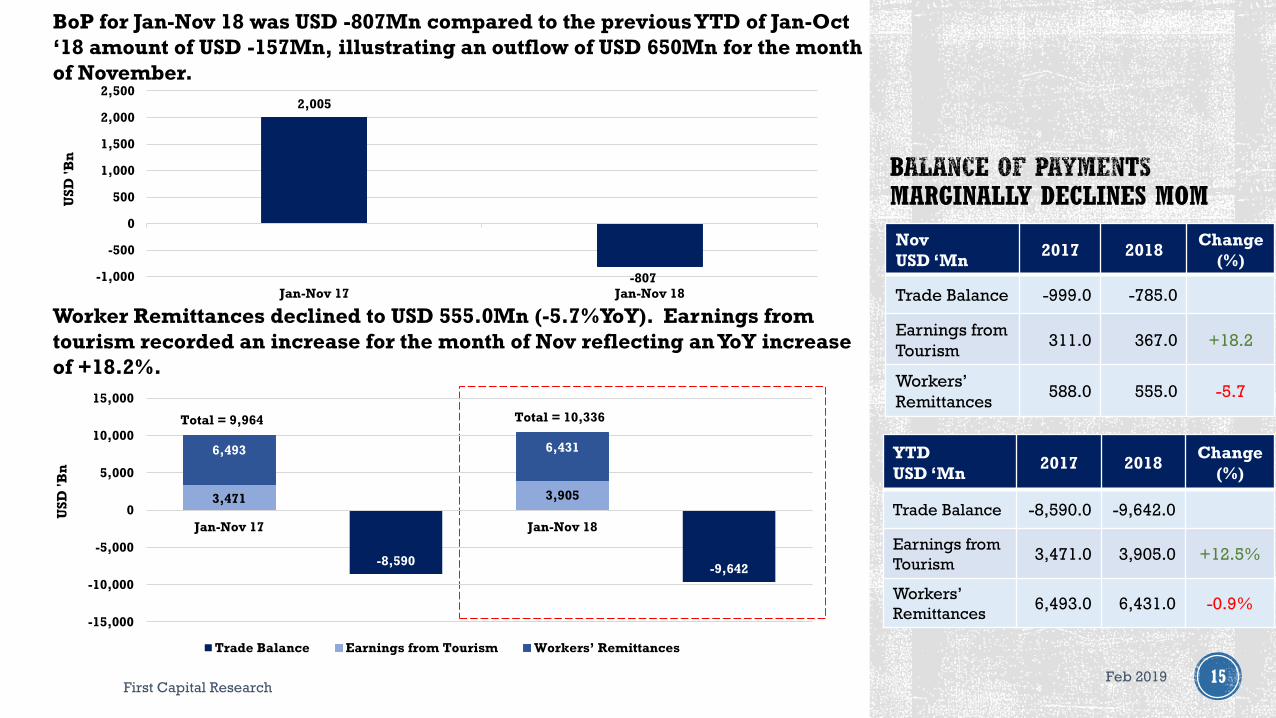
MARGINALLY DECLINES MOM
Nov
Trade Balance -13.2%
First Capital Research15
Nov
USD ‘Mn2017 2018
Change
(%)
Trade Balance -999.0 -785.0
Earnings from
Tourism311.0 367.0 +18.2
Workers’
Remittances588.0 555.0 -5.7
YTD
USD ‘Mn2017 2018
Change
(%)
Trade Balance -8,590.0 -9,642.0
Earnings from
Tourism3,471.0 3,905.0 +12.5%
Workers’
Remittances6,493.0 6,431.0 -0.9%
Worker Remittances declined to USD 555.0Mn (-5.7%YoY). Earnings from
tourism recorded an increase for the month of Nov reflecting an YoY increase
of +18.2%.
BoP for Jan-Nov 18 was USD -807Mn compared to the previous YTD of Jan-Oct
‘18 amount of USD -157Mn, illustrating an outflow of USD 650Mn for the month
of November.U
SD
'B
n
2,005
-807-1,000
-500
0
500
1,000
1,500
2,000
2,500
Jan-Nov 17 Jan-Nov 18
-8,590-9,642
3,471 3,905
6,493 6,431
-15,000
-10,000
-5,000
0
5,000
10,000
15,000
Jan-Nov 17 Jan-Nov 18
Trade Balance Earnings from Tourism Workers’ Remittances
US
D '
Bn
Total = 9,964 Total = 10,336
Feb 2019
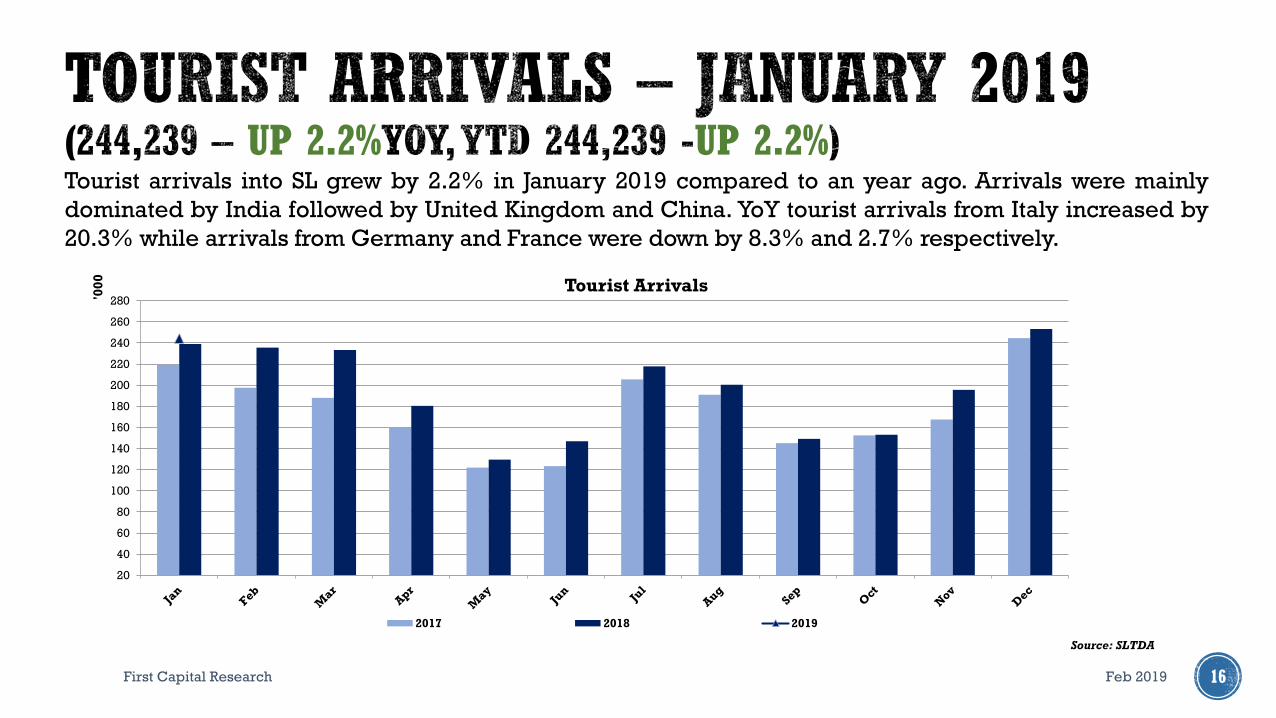
UP 2.2% UP 2.2%
First Capital Research 16
Tourist arrivals into SL grew by 2.2% in January 2019 compared to an year ago. Arrivals were mainly
dominated by India followed by United Kingdom and China. YoY tourist arrivals from Italy increased by
20.3% while arrivals from Germany and France were down by 8.3% and 2.7% respectively.
Feb 2019
20
40
60
80
100
120
140
160
180
200
220
240
260
280'00
0
Tourist Arrivals
2017 2018 2019
Source: SLTDA

First Capital Research 17
The U.S. trade deficit with China is set to balloon again: President
Donald Trump underscored his desire to reduce the trade gap with
China in his State of the Union speech, yet the deficit is on track to
balloon again this year as a solid economy boosts American demand
for imports. The total U.S. deficit in goods with China jumped by USD
37.6Bn, or 10.9%, in the first 11 months of 2018 compared with a year
earlier, according to Commerce Department figures that were updated
with November data. www.bloomberg.com
No quick fix for citizen rights under no-deal Brexit, says EU
official: Nearly 5Mn British and EU citizens could be stuck in limbo
after a no-deal Brexit, a senior EU official has warned, who said it could
take several years “to pick up the pieces” of the UK crashing out of the
bloc. Politicians on both sides of the Brexit divide have urged
negotiators to ringfence the existing agreement on citizens’ rights if
the UK leaves without a deal on 29 March. The Brexit withdrawal
agreement protects most of the rights of the 3.4Mn EU citizens in the
UK and the 1.3Mn British people in the EU. But since MPs rejected the
agreement by a crushing majority last month, these protections have
been thrown into doubt. www. theguardian.com.com
Oil scores best January on record as supply cuts revive market:
Oil closed lower but still scored its best January gain on record, after a
month in which OPEC’s emergency supply cuts started to take root and
panic eased about the global economy. Futures in New York dived
0.8% late on 31.01.19, after a government report that U.S. production
had swelled to an all-time high in November. www.bloomberg.comSource: Bloomberg
-6.00% -1.00% 4.00% 9.00%
Nikkei 225
S&P 500
Dow Jones
KSE100
Euro Stoxx 50
VN Index
FTSE 100
Nifty
Feb 2019

First Capital Research
Feb 2019


