51
| Date post: | 30-Mar-2018 |
| Category: |
Documents |
| Upload: | duongkhuong |
| View: | 215 times |
| Download: | 2 times |


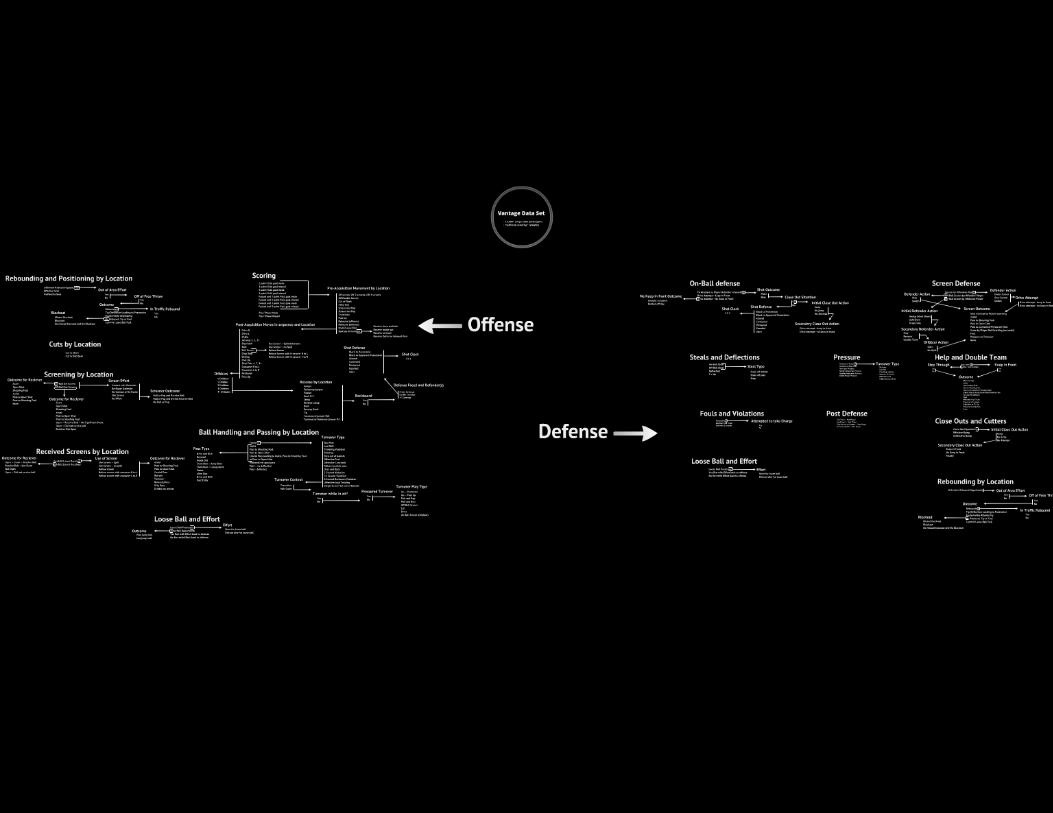
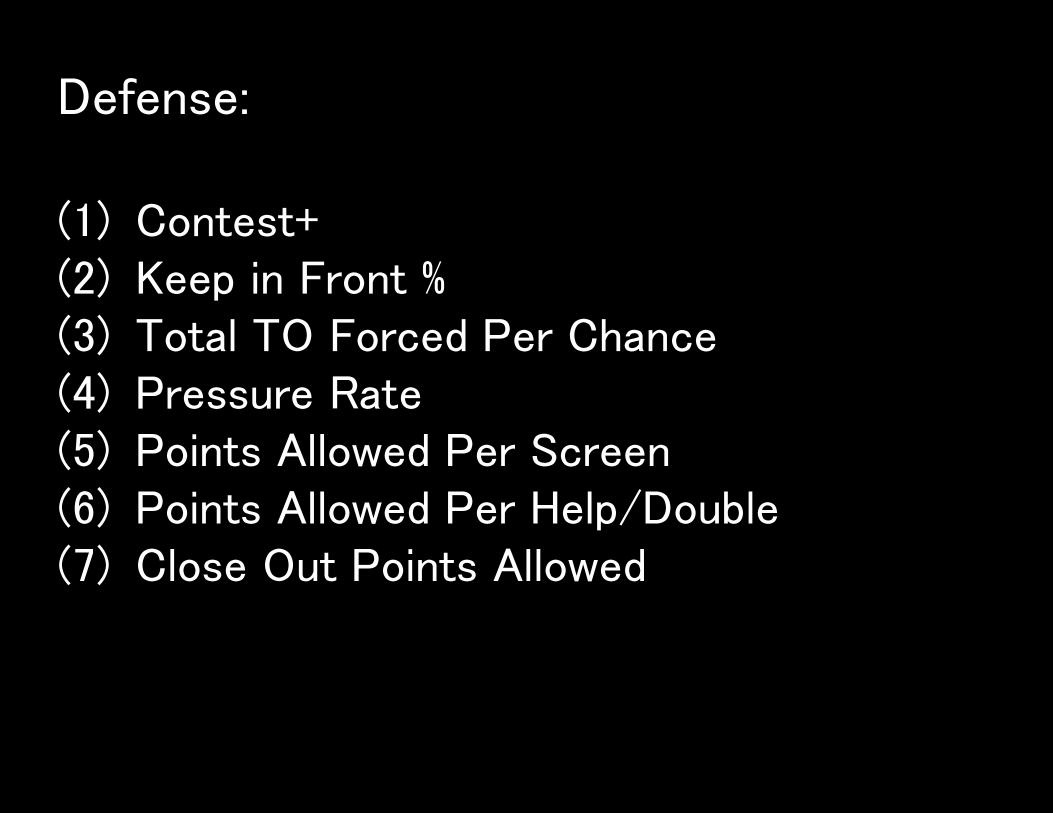
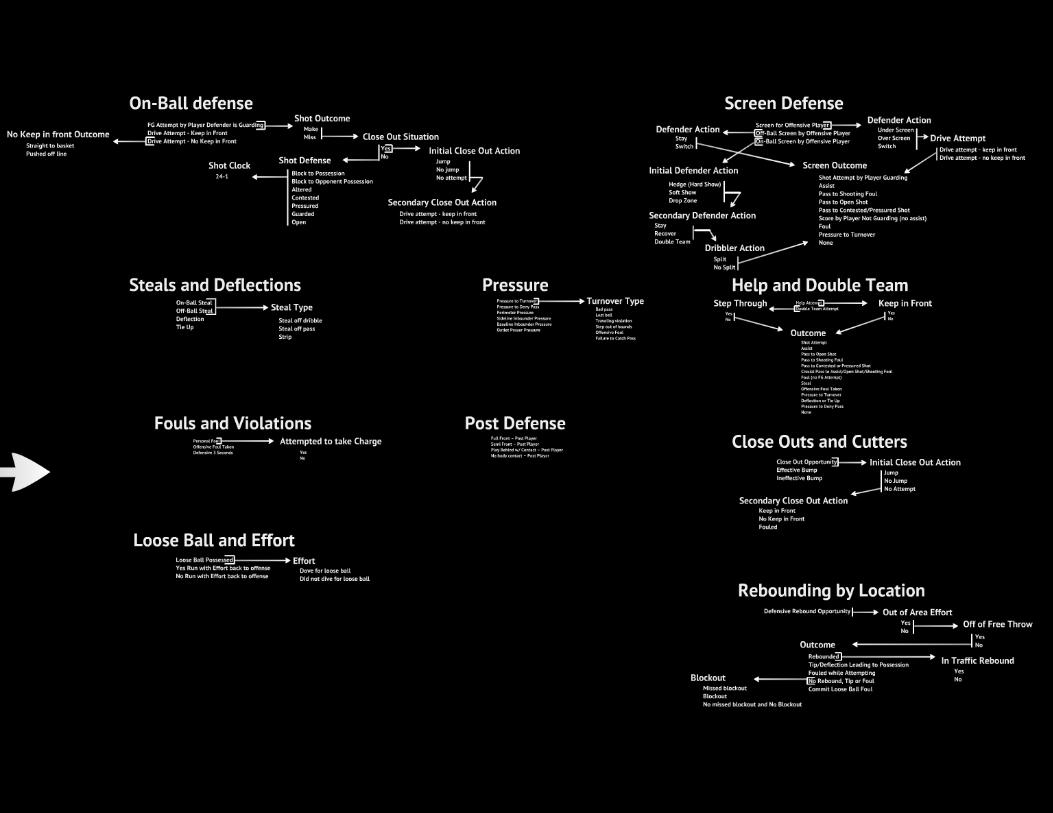
Defense: (1) Contest+ (2) Keep in Front % (3) Total TO Forced Per Chance (4) Pressure Rate (5) Points Allowed Per Screen (6) Points Allowed Per Help/Double (7) Close Out Points Allowed

Offense: (1) Points Per Chance (2) Contest+ FG% (3) Touches Per Chance (4) Assist+ (5) True Facilitation (6) Received Screen Outcome Efficiency (7) Set Screen Points Per Chance (8) OReb+ (9) Blockout Rate

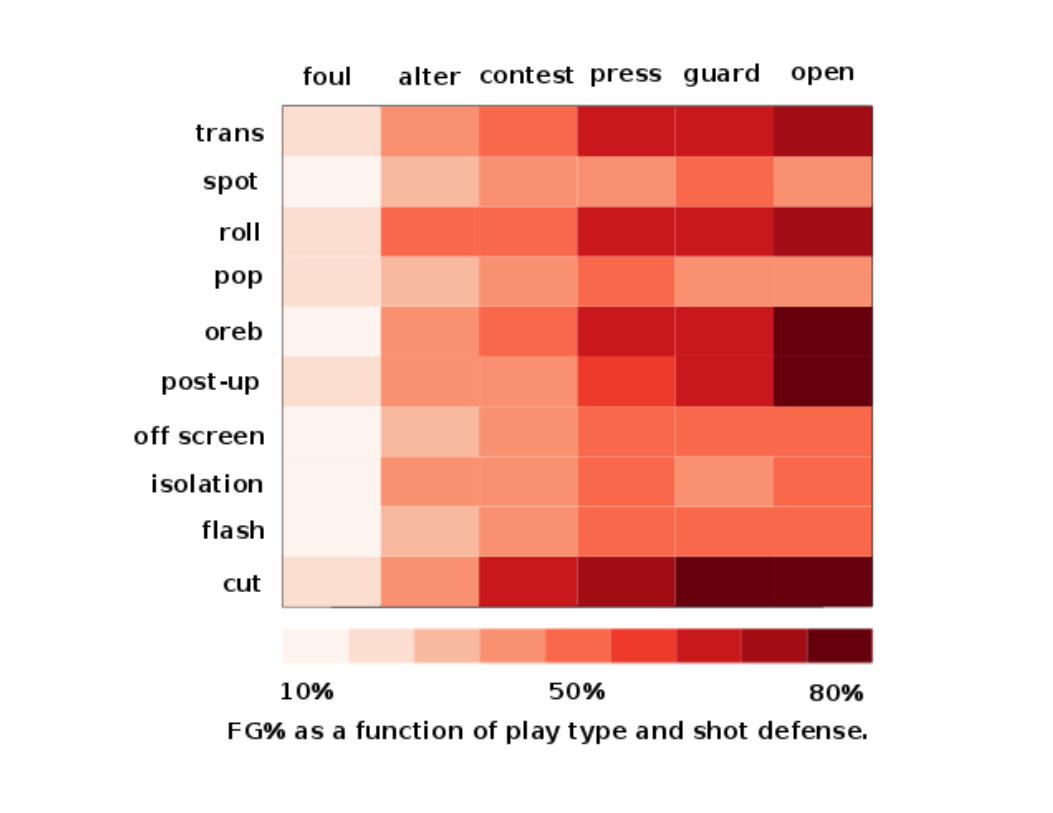
Defense: (1) Contest+
- Percentage of shots defended where player
blocks, alters or contests shot


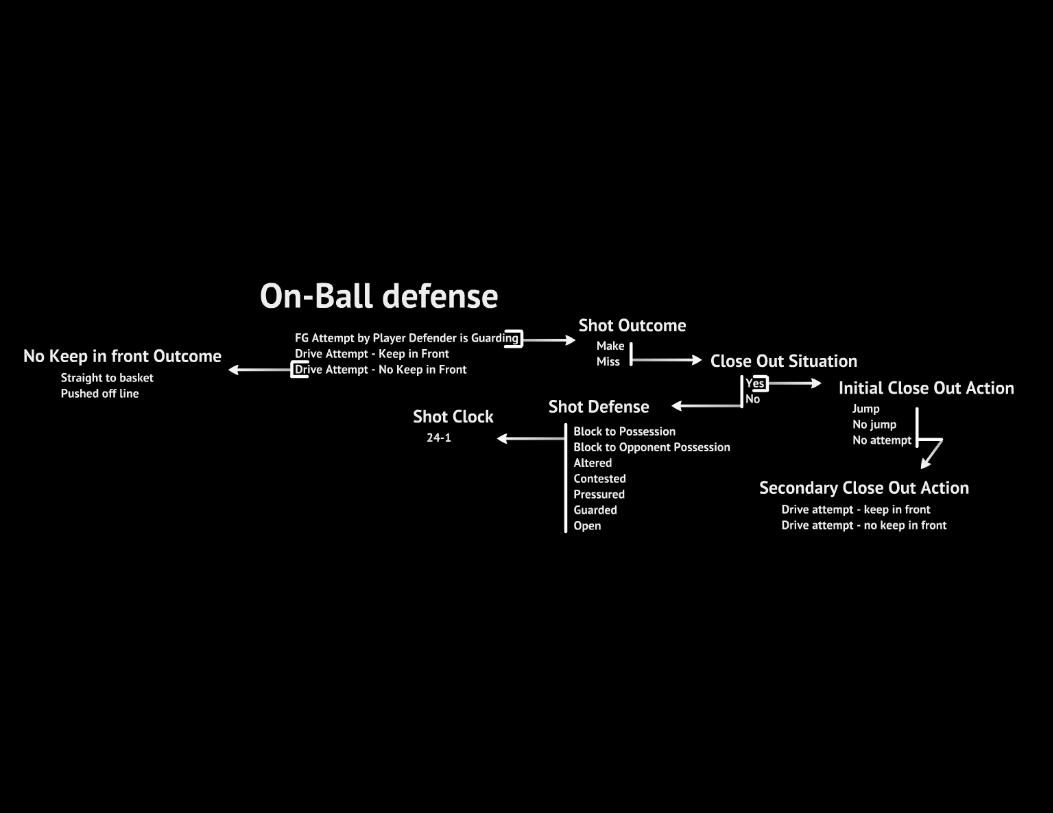
Defense: (2) Keep in Front %
- Percentage of drive attempts where player
keeps himself between the basket and the offensive player
- NBA mean/median: 51%/53%


Defense: (3) Total TO Forced Per Chance
- Number of forced turnovers including steals, deflections to steal, defensive loose balls possessed, offensive fouls taken, pressures to turnover and blocks to possession
Defense: (4) Pressure Rate
- Number of pressures applied per 100
defensive chances
- NBA mean/median: 3.3/2.9


Defense: (5) Points Allowed Per Screen
- Number of points allowed per screen
defended

Defense: (6) Points Allowed Per Help/Double
- Number of points allowed per help attempt and number of points allowed per double team attempt
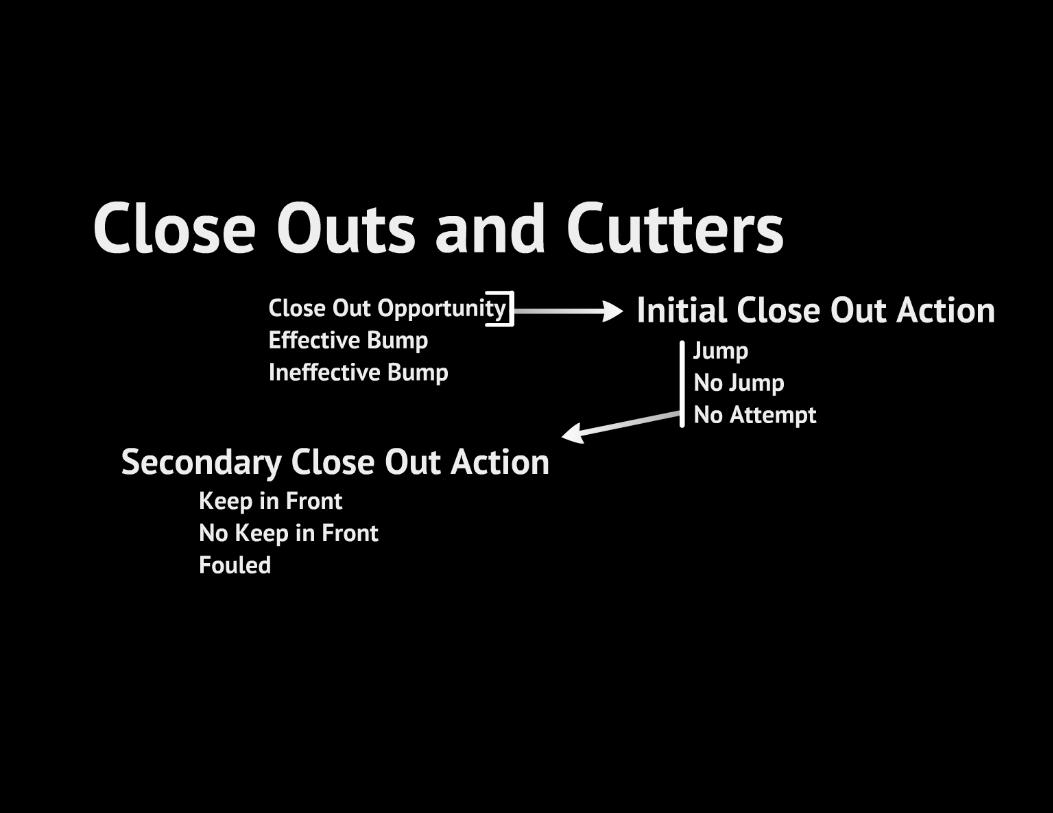

Defense: (7) Close Out Points Allowed
- Number of points allowed per close out opportunity

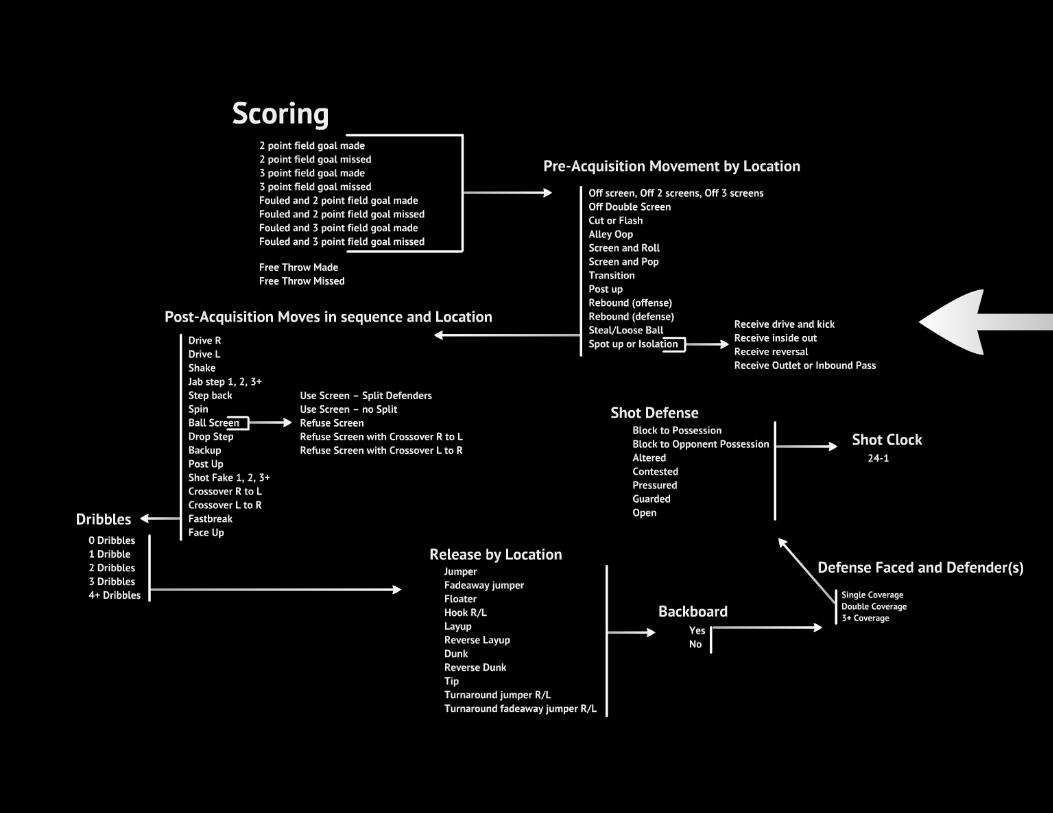

Offense: (1) Points Per Chance
- Scoring efficiency number normalized by the amount of offensive “chances” - Isolates positive/negative effect of rebounding on PPP


Offense: (2) Contest+ FG%
- NBA mean - 31.1% - NBA median – 34.2%
Tony Allen – 26.7% Kemba Walker – 28% Tim Duncan – 45.5% Al Jefferson – 45.5%

Using the Building Blocks to Determine Optimal Shot Time/Defense

Offense: (3) Touches Per Chance
- Number of times player touches ball per offensive chance
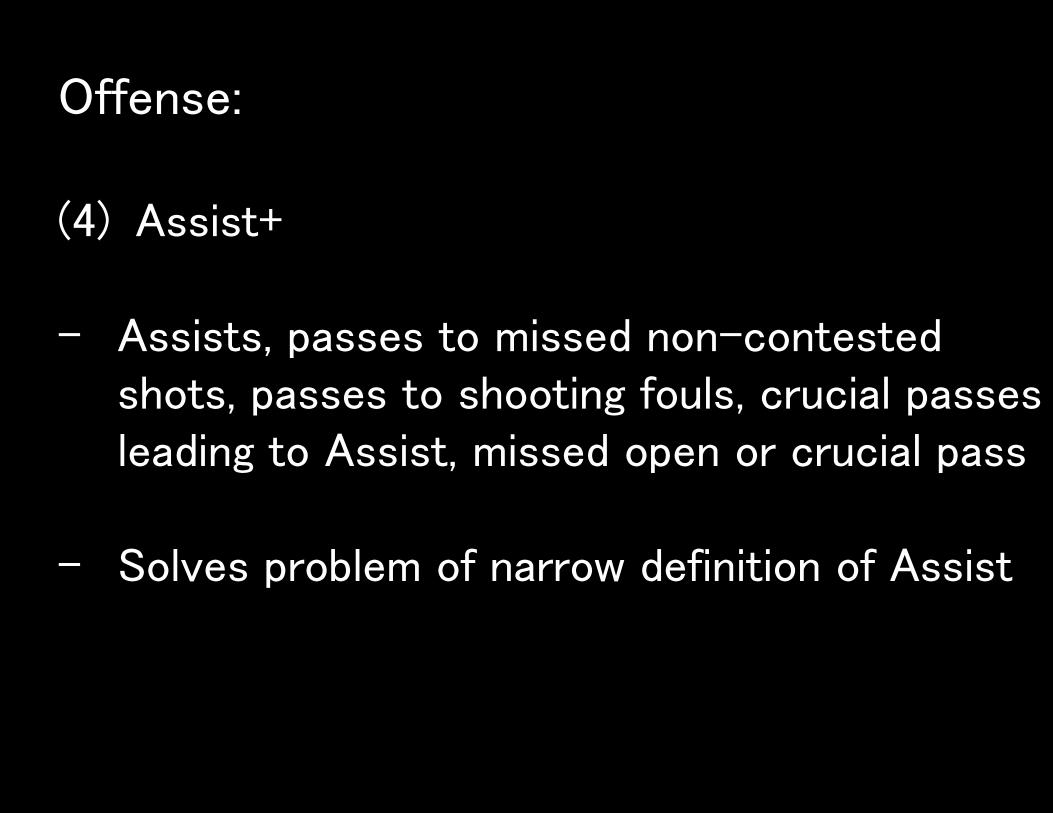
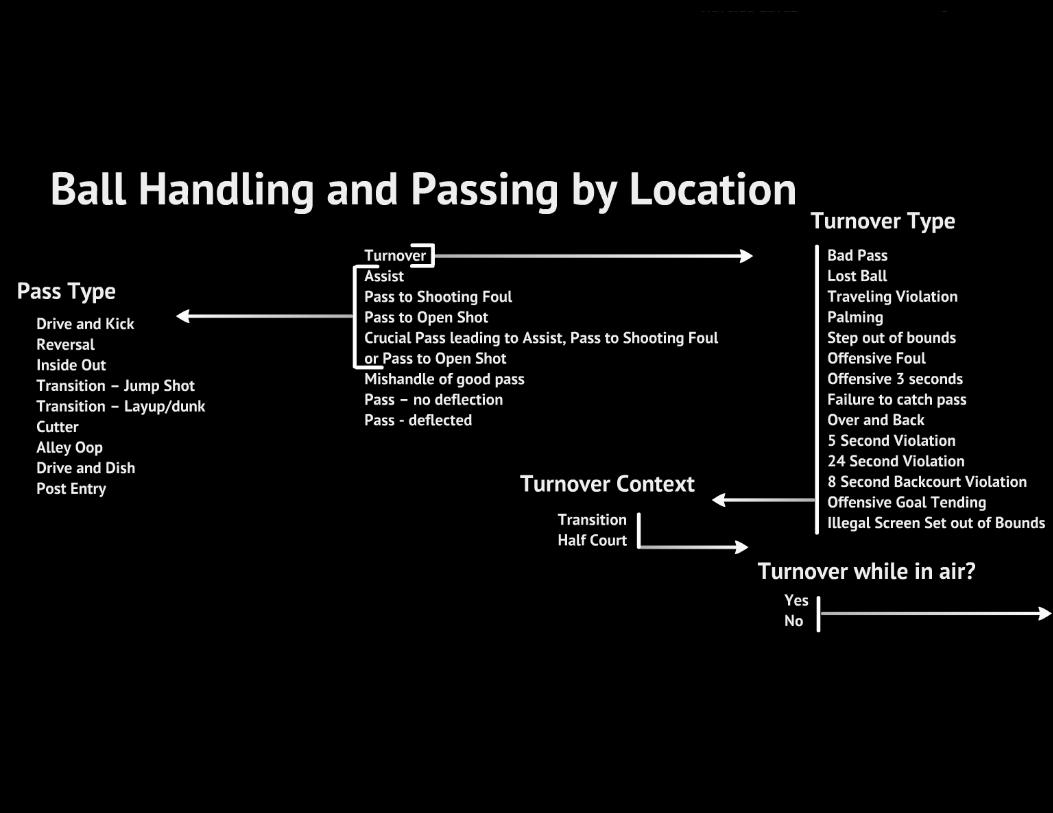
Offense: (4) Assist+
- Assists, passes to missed non-contested
shots, passes to shooting fouls, crucial passes leading to Assist, missed open or crucial pass
- Solves problem of narrow definition of Assist
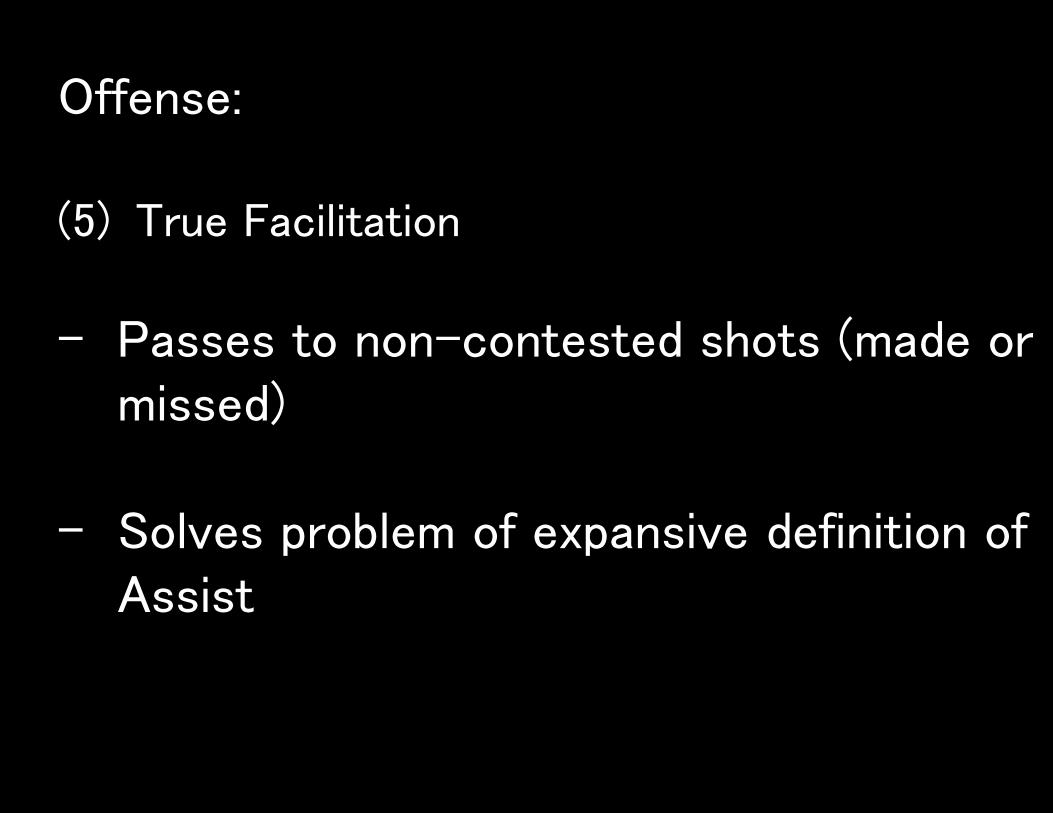
Offense: (5) True Facilitation
- Passes to non-contested shots (made or missed)
- Solves problem of expansive definition of
Assist
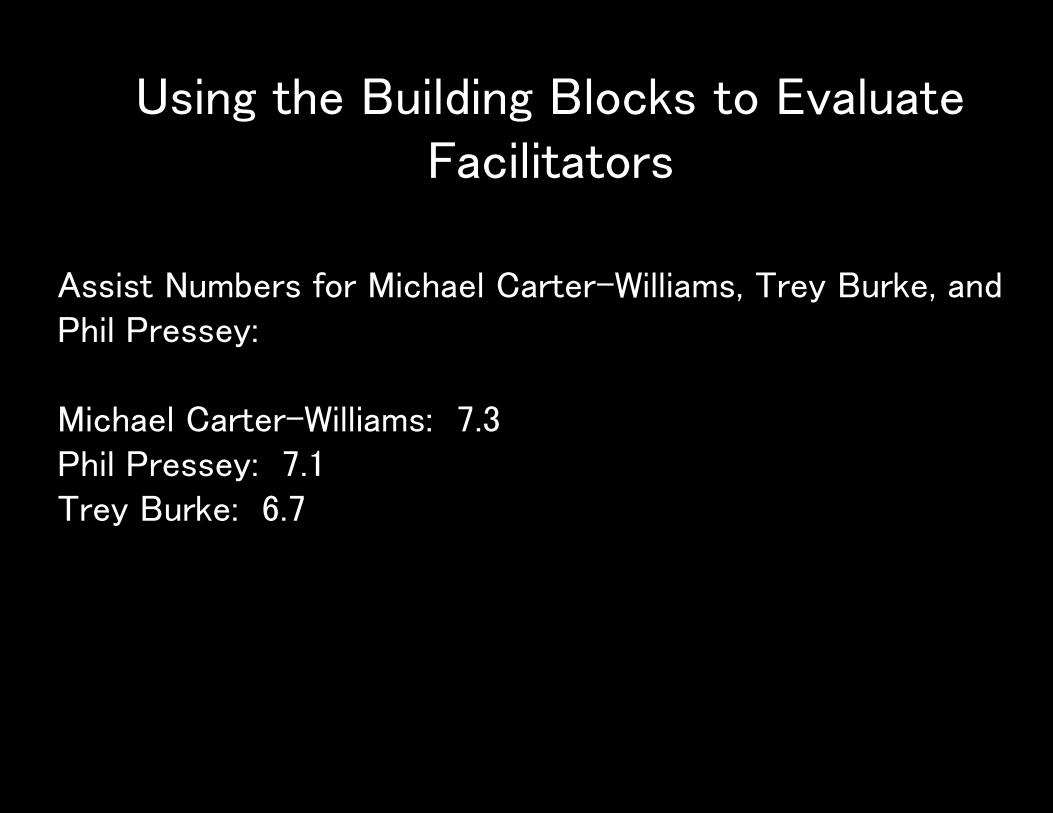
Using the Building Blocks to Evaluate Facilitators
Assist Numbers for Michael Carter-Williams, Trey Burke, and Phil Pressey: Michael Carter-Williams: 7.3 Phil Pressey: 7.1 Trey Burke: 6.7

Assist+ Per 100 Chances
Phil Pressey: 14.2 Michael Carter-Williams: 11.5 Trey Burke: 11.1

True Facilitation
Trey Burke: 3.05 (#1 in TF) Phil Pressey: 2.2 (#2 in TF) Michael Carter-Williams: .738 (#23 in TF)


Offense: (6) Received Screen Outcome Efficiency - Percentage of screens received where player produces “positive” outcome (score, assist+, shooting foul)

Offense: (7) Set Screen Points Per Chance - Number of points per chance from set
screens

Analysis using a Bootstrapped Regression verified that screens are significant predictors of Offensive Efficiency (present in at least 70% of models built). Across the models they were presented with a relative importance as follows: Set Screens Points Per Chance - .92 Screens Received Per Chance - .82


Offense: (8) OReb+
- Includes rebounds, tips to possession and fouls drawn while attempting rebound - Normalized per chance or per rebound opportunity

Offense: (9) Blockout Rate - Number of blockouts per 100 defensive reb opportunities


The Future
• Vantage is committed to the democratization of the insights available through our data
• Get in Touch and Stay Tuned
Email: [email protected] Company twitter: @vantagesports


