19
FINANCIAL RESULTS PRESENTATION FY2019 March 2020
FINANCIAL RESULTS PRESENTATION FY2019
March 2020
2
❑ FY2019 Results Highlights
❑ Summary Financial Results
❑ Business Units Performance
PRESENTATION
3
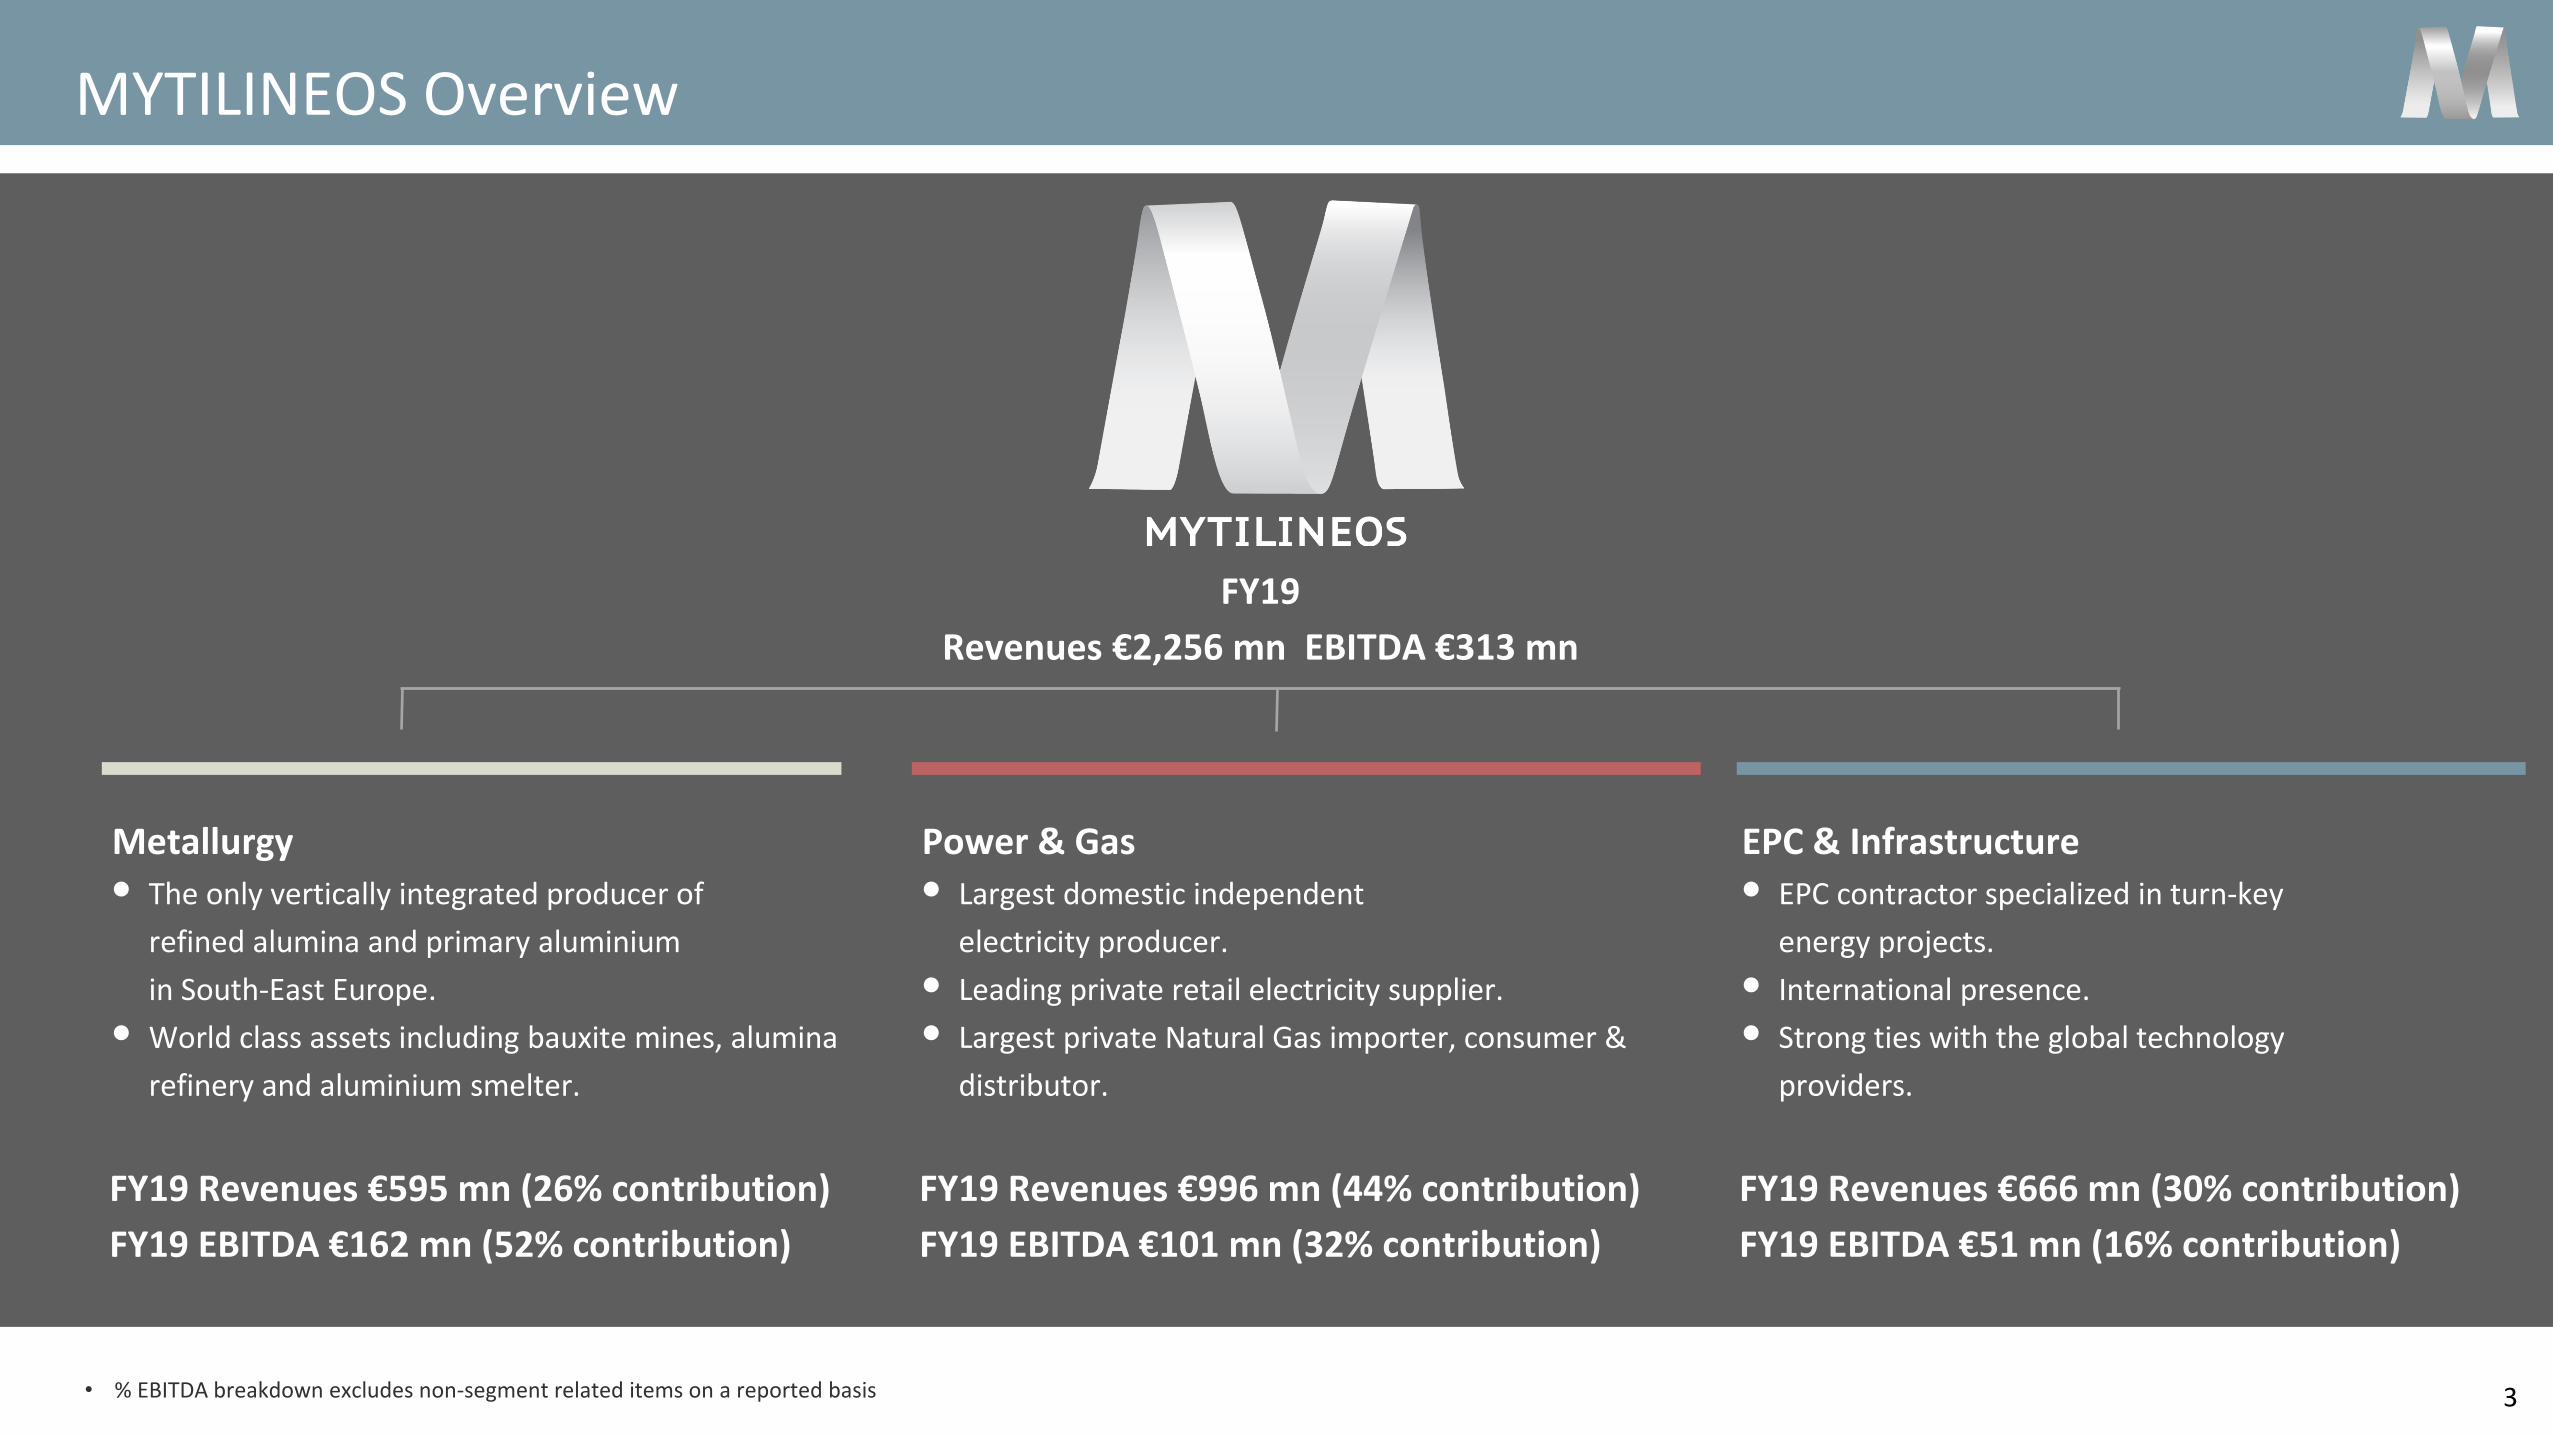
MYTILINEOS Overview
Metallurgy
• The only vertically integrated producer of
refined alumina and primary aluminium
in South-East Europe.
• World class assets including bauxite mines, alumina
refinery and aluminium smelter.
FY19 Revenues €595 mn (26% contribution)
FY19 EBITDA €162 mn (52% contribution)
Power & Gas
• Largest domestic independent
electricity producer.
• Leading private retail electricity supplier.
• Largest private Natural Gas importer, consumer &
distributor.
FY19 Revenues €996 mn (44% contribution)
FY19 EBITDA €101 mn (32% contribution)
EPC & Infrastructure
• EPC contractor specialized in turn-key
energy projects.
• International presence.
• Strong ties with the global technology
providers.
FY19 Revenues €666 mn (30% contribution)
FY19 EBITDA €51 mn (16% contribution)
• % EBITDA breakdown excludes non-segment related items on a reported basis
FY19
Revenues €2,256 mn EBITDA €313 mn
4
FY19 Results Highlights
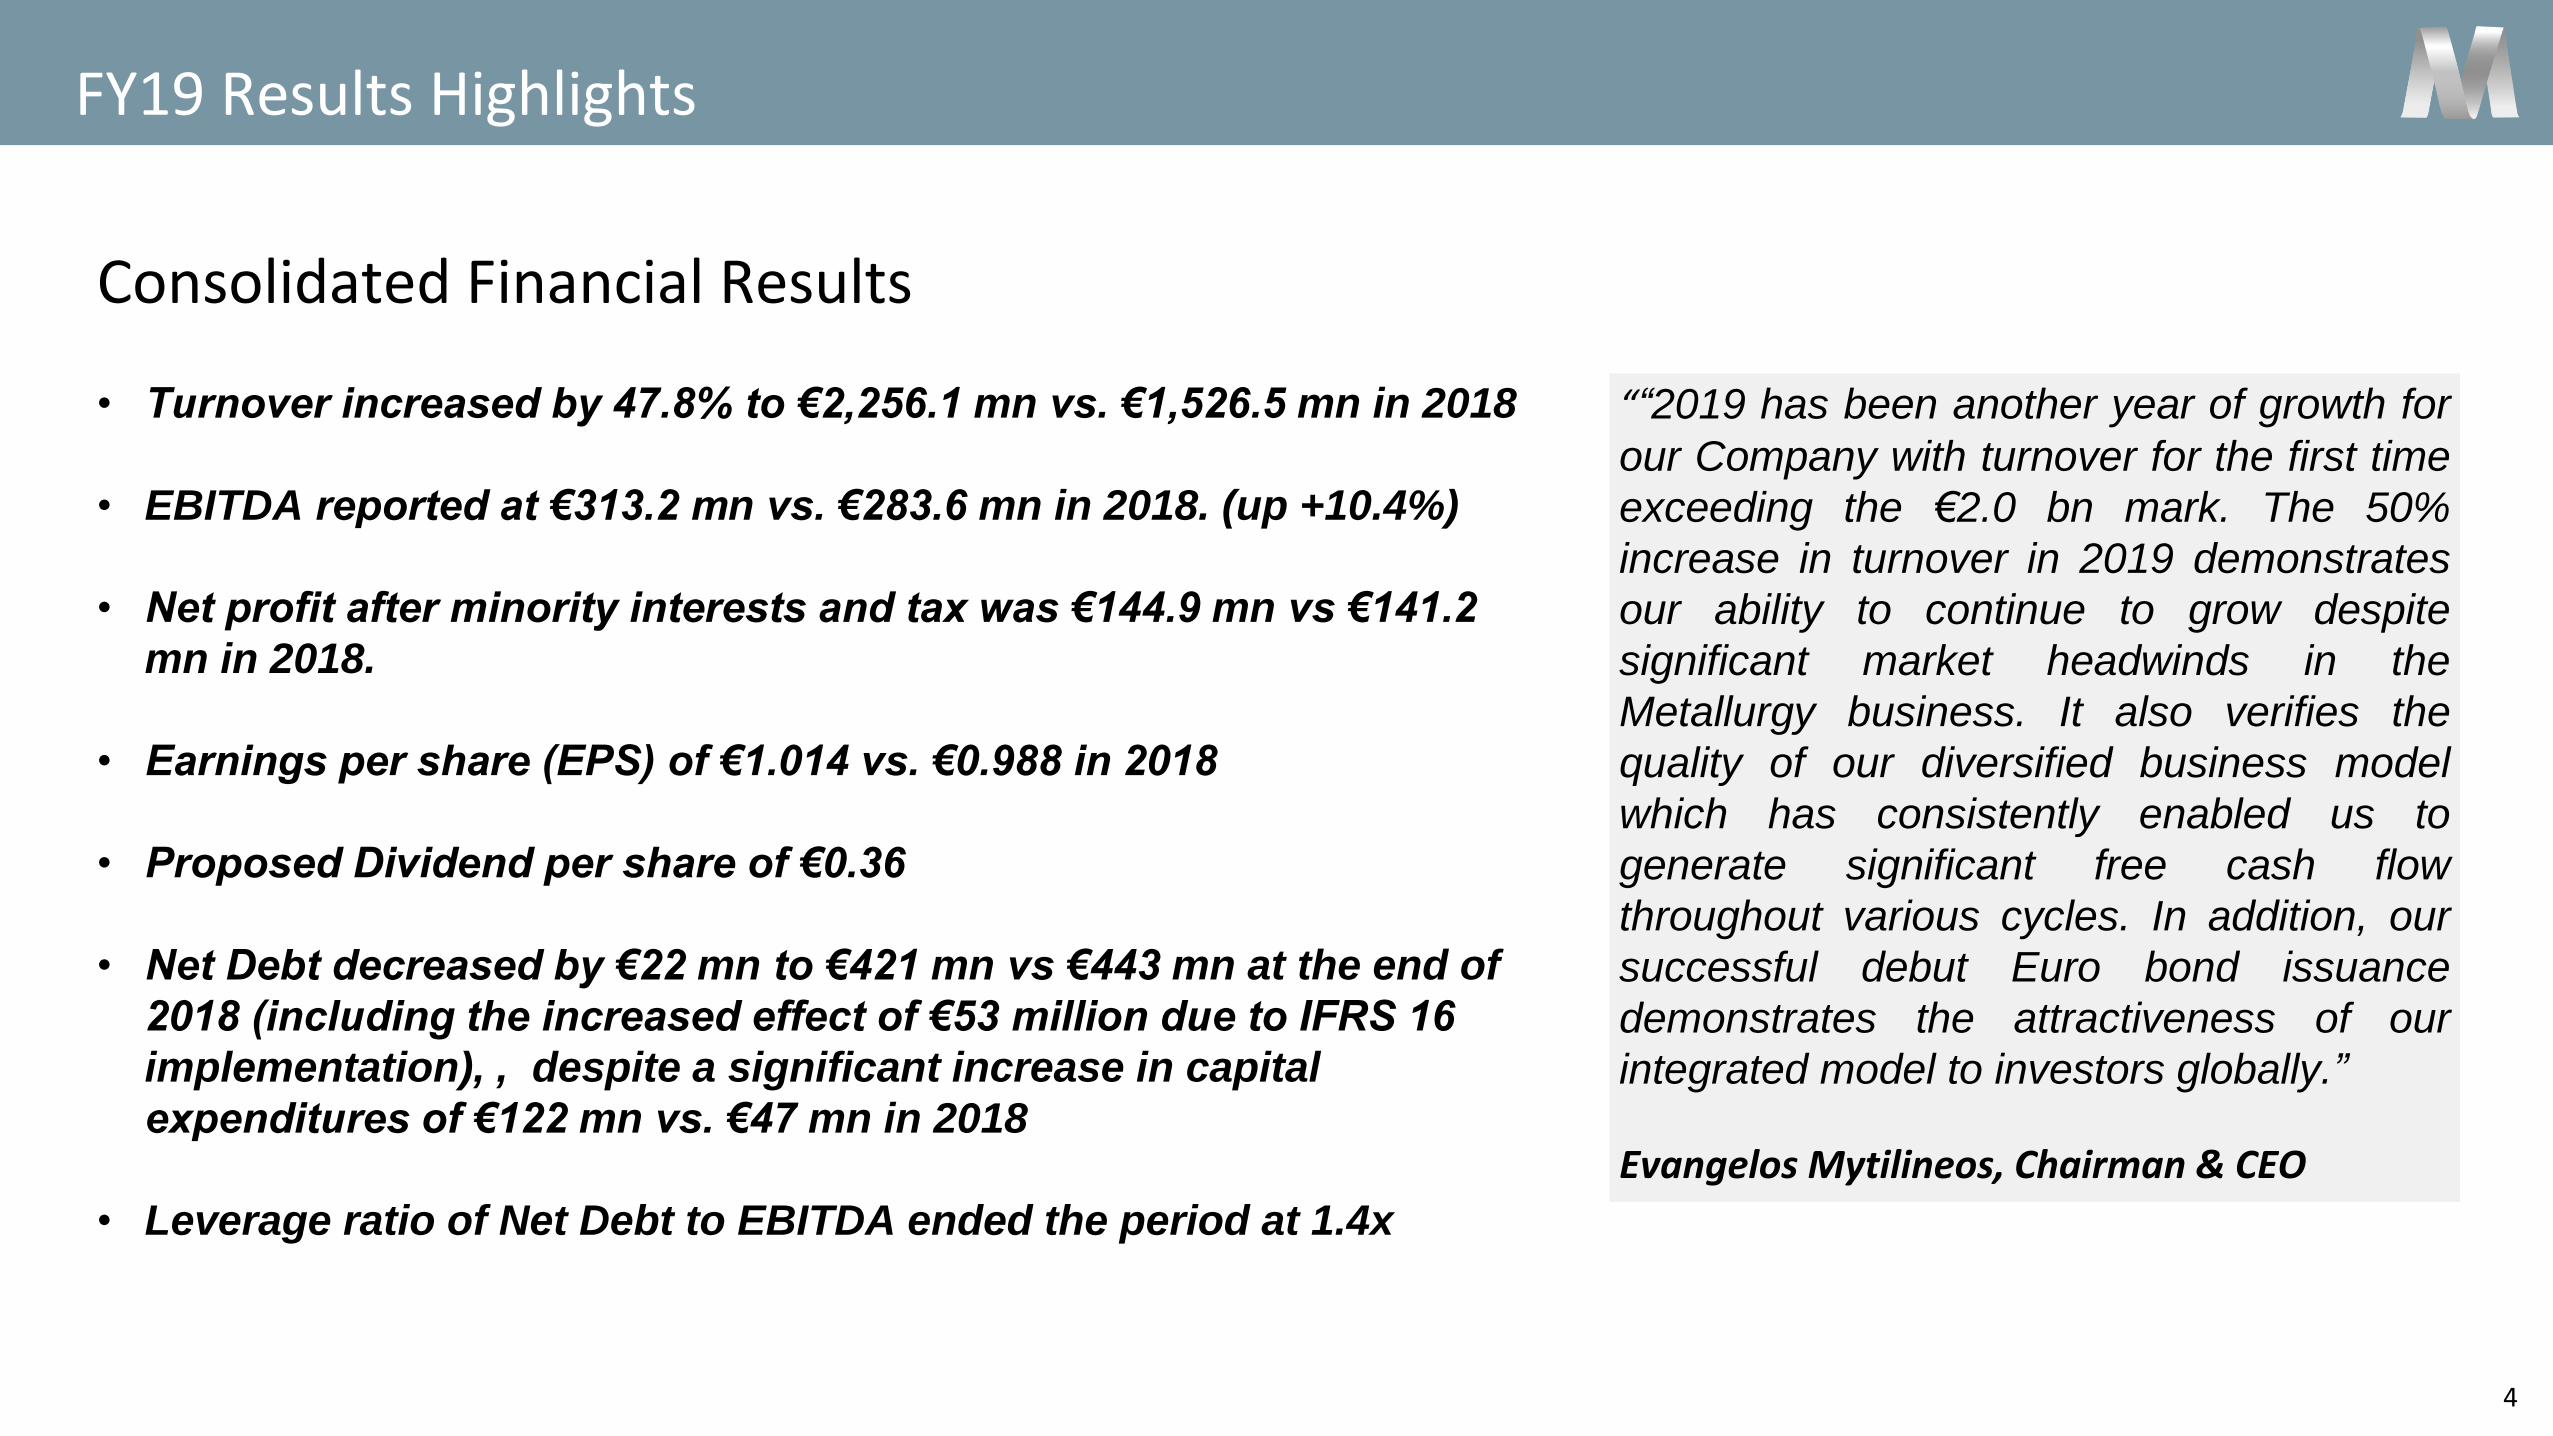
Consolidated Financial Results
• Turnover increased by 47.8% to €2,256.1 mn vs. €1,526.5 mn in 2018
• EBITDA reported at €313.2 mn vs. €283.6 mn in 2018. (up +10.4%)
• Net profit after minority interests and tax was €144.9 mn vs €141.2
mn in 2018.
• Earnings per share (EPS) of €1.014 vs. €0.988 in 2018
• Proposed Dividend per share of €0.36
• Net Debt decreased by €22 mn to €421 mn vs €443 mn at the end of
2018 (including the increased effect of €53 million due to IFRS 16
implementation), , despite a significant increase in capital
expenditures of €122 mn vs. €47 mn in 2018
• Leverage ratio of Net Debt to EBITDA ended the period at 1.4x
““2019 has been another year of growth for
our Company with turnover for the first time
exceeding the €2.0 bn mark. The 50%
increase in turnover in 2019 demonstrates
our ability to continue to grow despite
significant market headwinds in the
Metallurgy business. It also verifies the
quality of our diversified business model
which has consistently enabled us to
generate significant free cash flow
throughout various cycles. In addition, our
successful debut Euro bond issuance
demonstrates the attractiveness of our
integrated model to investors globally.”
Evangelos Mytilineos, Chairman & CEO
5
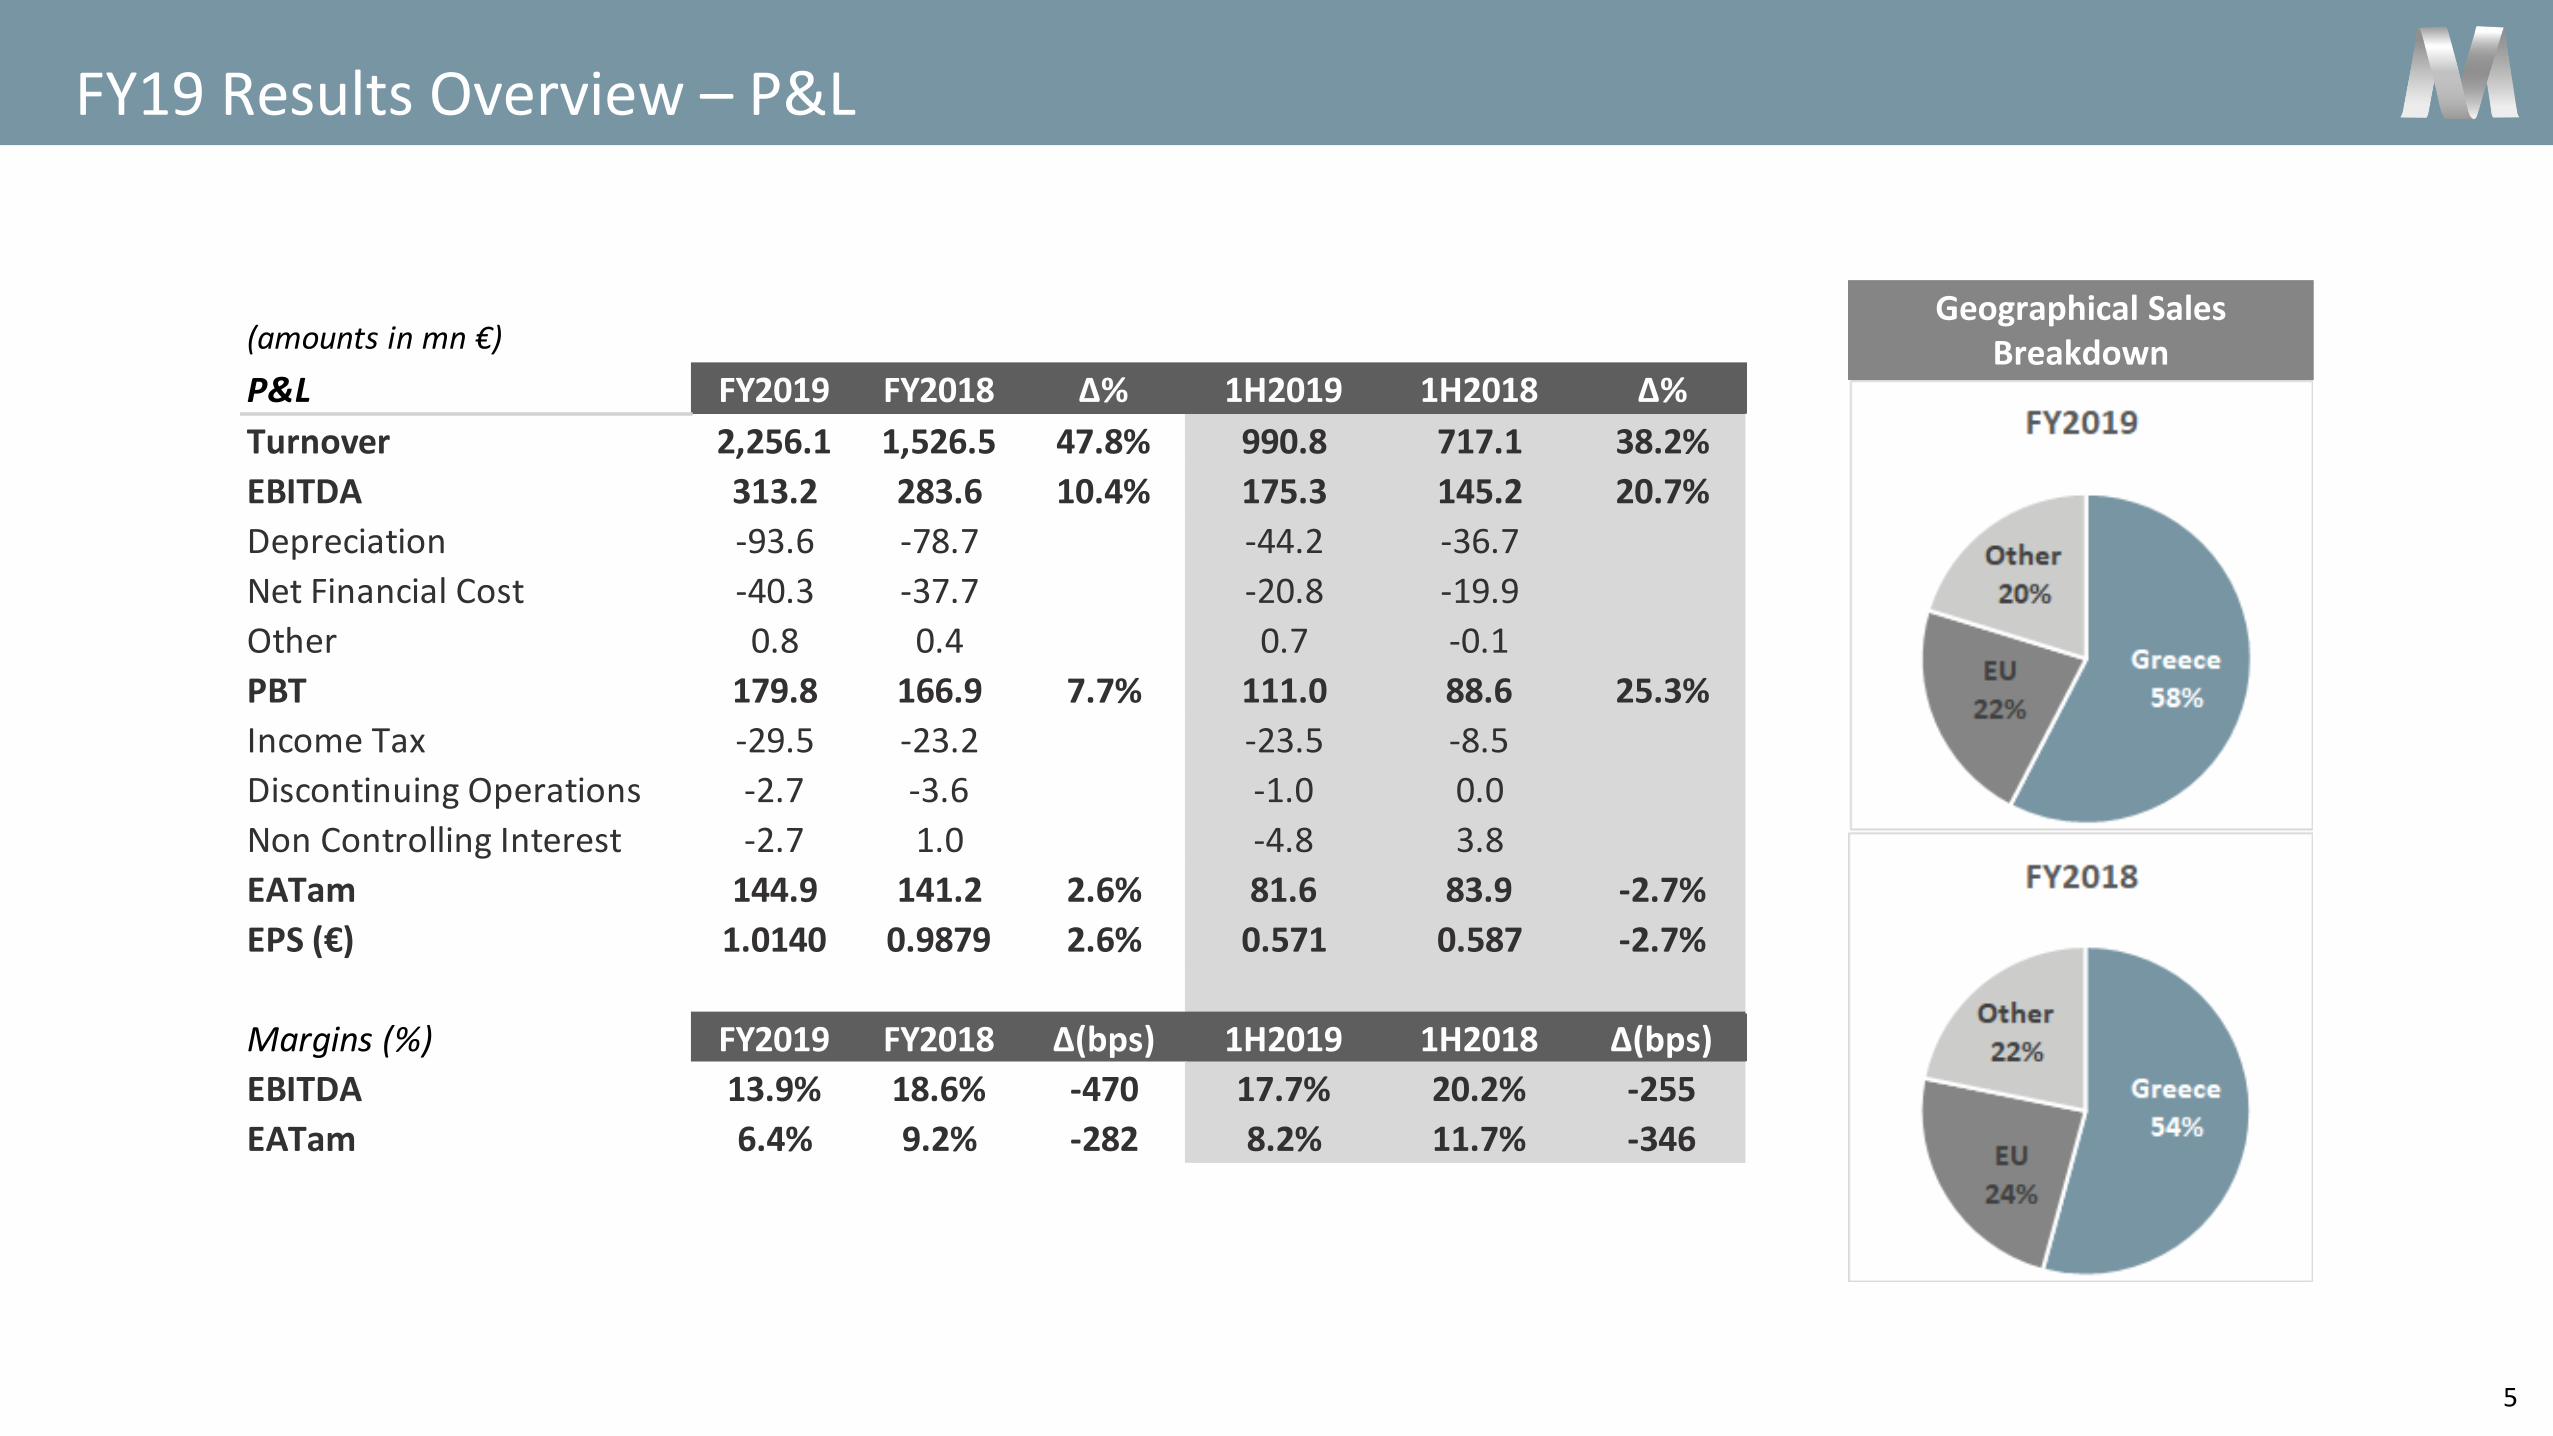
FY19 Results Overview – P&L
Geographical Sales Breakdown(amounts in mn €)
P&L FY2019 FY2018 Δ% 1H2019 1H2018 Δ%
Turnover 2,256.1 1,526.5 47.8% 990.8 717.1 38.2%
EBITDA 313.2 283.6 10.4% 175.3 145.2 20.7%
Depreciation -93.6 -78.7 -44.2 -36.7
Net Financial Cost -40.3 -37.7 -20.8 -19.9
Other 0.8 0.4 0.7 -0.1
PBT 179.8 166.9 7.7% 111.0 88.6 25.3%
Income Tax -29.5 -23.2 -23.5 -8.5
Discontinuing Operations -2.7 -3.6 -1.0 0.0
Non Controlling Interest -2.7 1.0 -4.8 3.8
EATam 144.9 141.2 2.6% 81.6 83.9 -2.7%
EPS (€) 1.0140 0.9879 2.6% 0.571 0.587 -2.7%
Margins (%) FY2019 FY2018 Δ(bps) 1H2019 1H2018 Δ(bps)
EBITDA 13.9% 18.6% -470 17.7% 20.2% -255
EATam 6.4% 9.2% -282 8.2% 11.7% -346

6
FY19 Results Overview – Balance Sheet
ROCE & ROE calculations are available in FY2019 Financial Results Notes
*
Net Debt decreased by 22 mn
* Due to the application of IFRS 16 since Jan. 1, 2019, FY19 Debt includes €53 mn of leases
Note: 2019 BOT spending amounted c. €50mn

7
EBITDA Gap Analysis
283,6
22,4 11,7 1,8 10,2 3,5 3
-1,4
-45,5 -40
16,8
-8,8 -1,9
5,4
-14 -1,6 -3,2
71,2
313,2EB
ITD
A 2
01
8
Nat
ura
l Gas
New
RES
Oth
er
Pri
or
year
s C
O2
reb
ate
Pri
ce r
evie
w o
f B
OTA
S ga
s in
20
18
resu
lts
of
Po
wer
& G
as
Pri
ce r
evie
w o
f B
OTA
S ga
s in
20
18
resu
lts
of
Met
allu
rgy
Oth
er
Alu
min
ium
Alu
min
a
€/$
rat
e ef
fect
-M
etal
lurg
y
€/$
rat
e ef
fect
-Po
wer
& G
as
€/$
rat
e ef
fect
-EP
C
CO
2 M
etal
lurg
y
CO
2 P
ow
er &
Gas
Cap
acit
y p
aym
ents
Oth
er
Hed
gin
g
EBIT
DA
20
19
Intrinsic Effect€35.9mn
One-Off Items€15.3mn
Market Effect€-92.8mn
Hedging€71.2mn
8
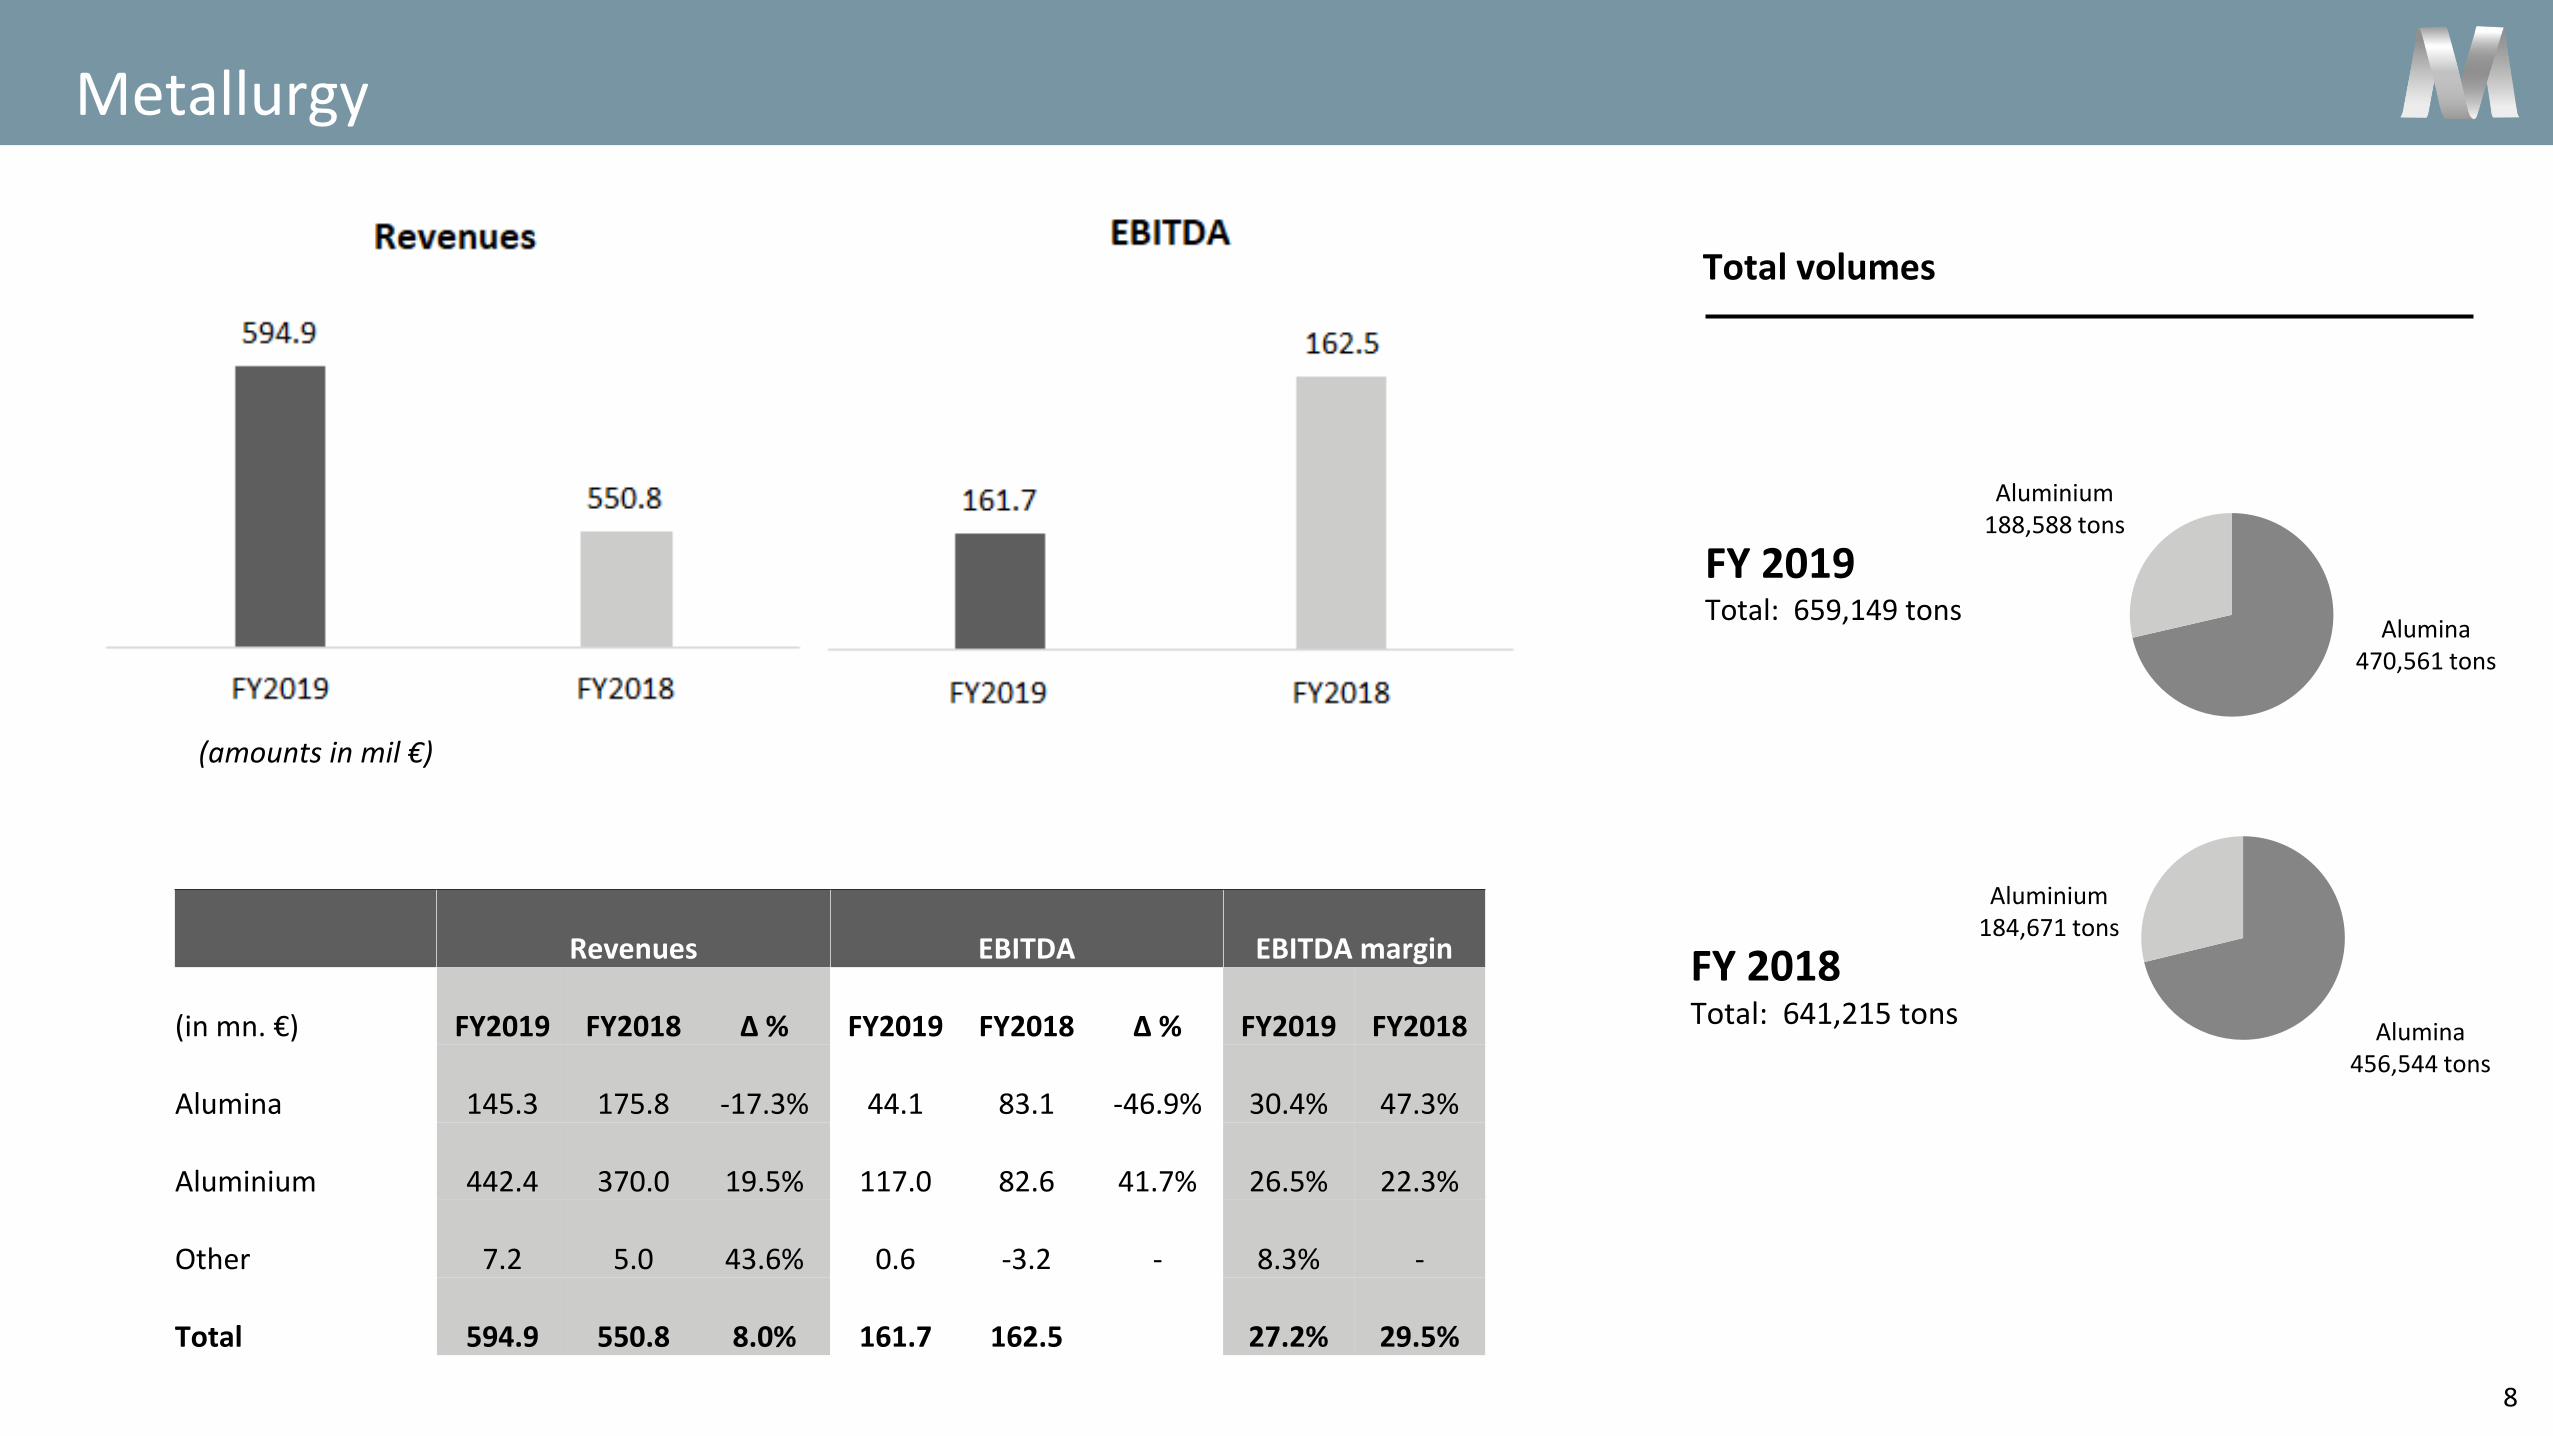
Metallurgy
FY 2019Total: 659,149 tons
FY 2018Total: 641,215 tons
Total volumes
Aluminium188,588 tons
Alumina470,561 tons
Aluminium184,671 tons
Alumina456,544 tons
(amounts in mil €)
Revenues EBITDA EBITDA margin
(in mn. €) FY2019 FY2018 Δ % FY2019 FY2018 Δ % FY2019 FY2018
Alumina 145.3 175.8 -17.3% 44.1 83.1 -46.9% 30.4% 47.3%
Aluminium 442.4 370.0 19.5% 117.0 82.6 41.7% 26.5% 22.3%
Other 7.2 5.0 43.6% 0.6 -3.2 - 8.3% -
Total 594.9 550.8 8.0% 161.7 162.5 27.2% 29.5%
9
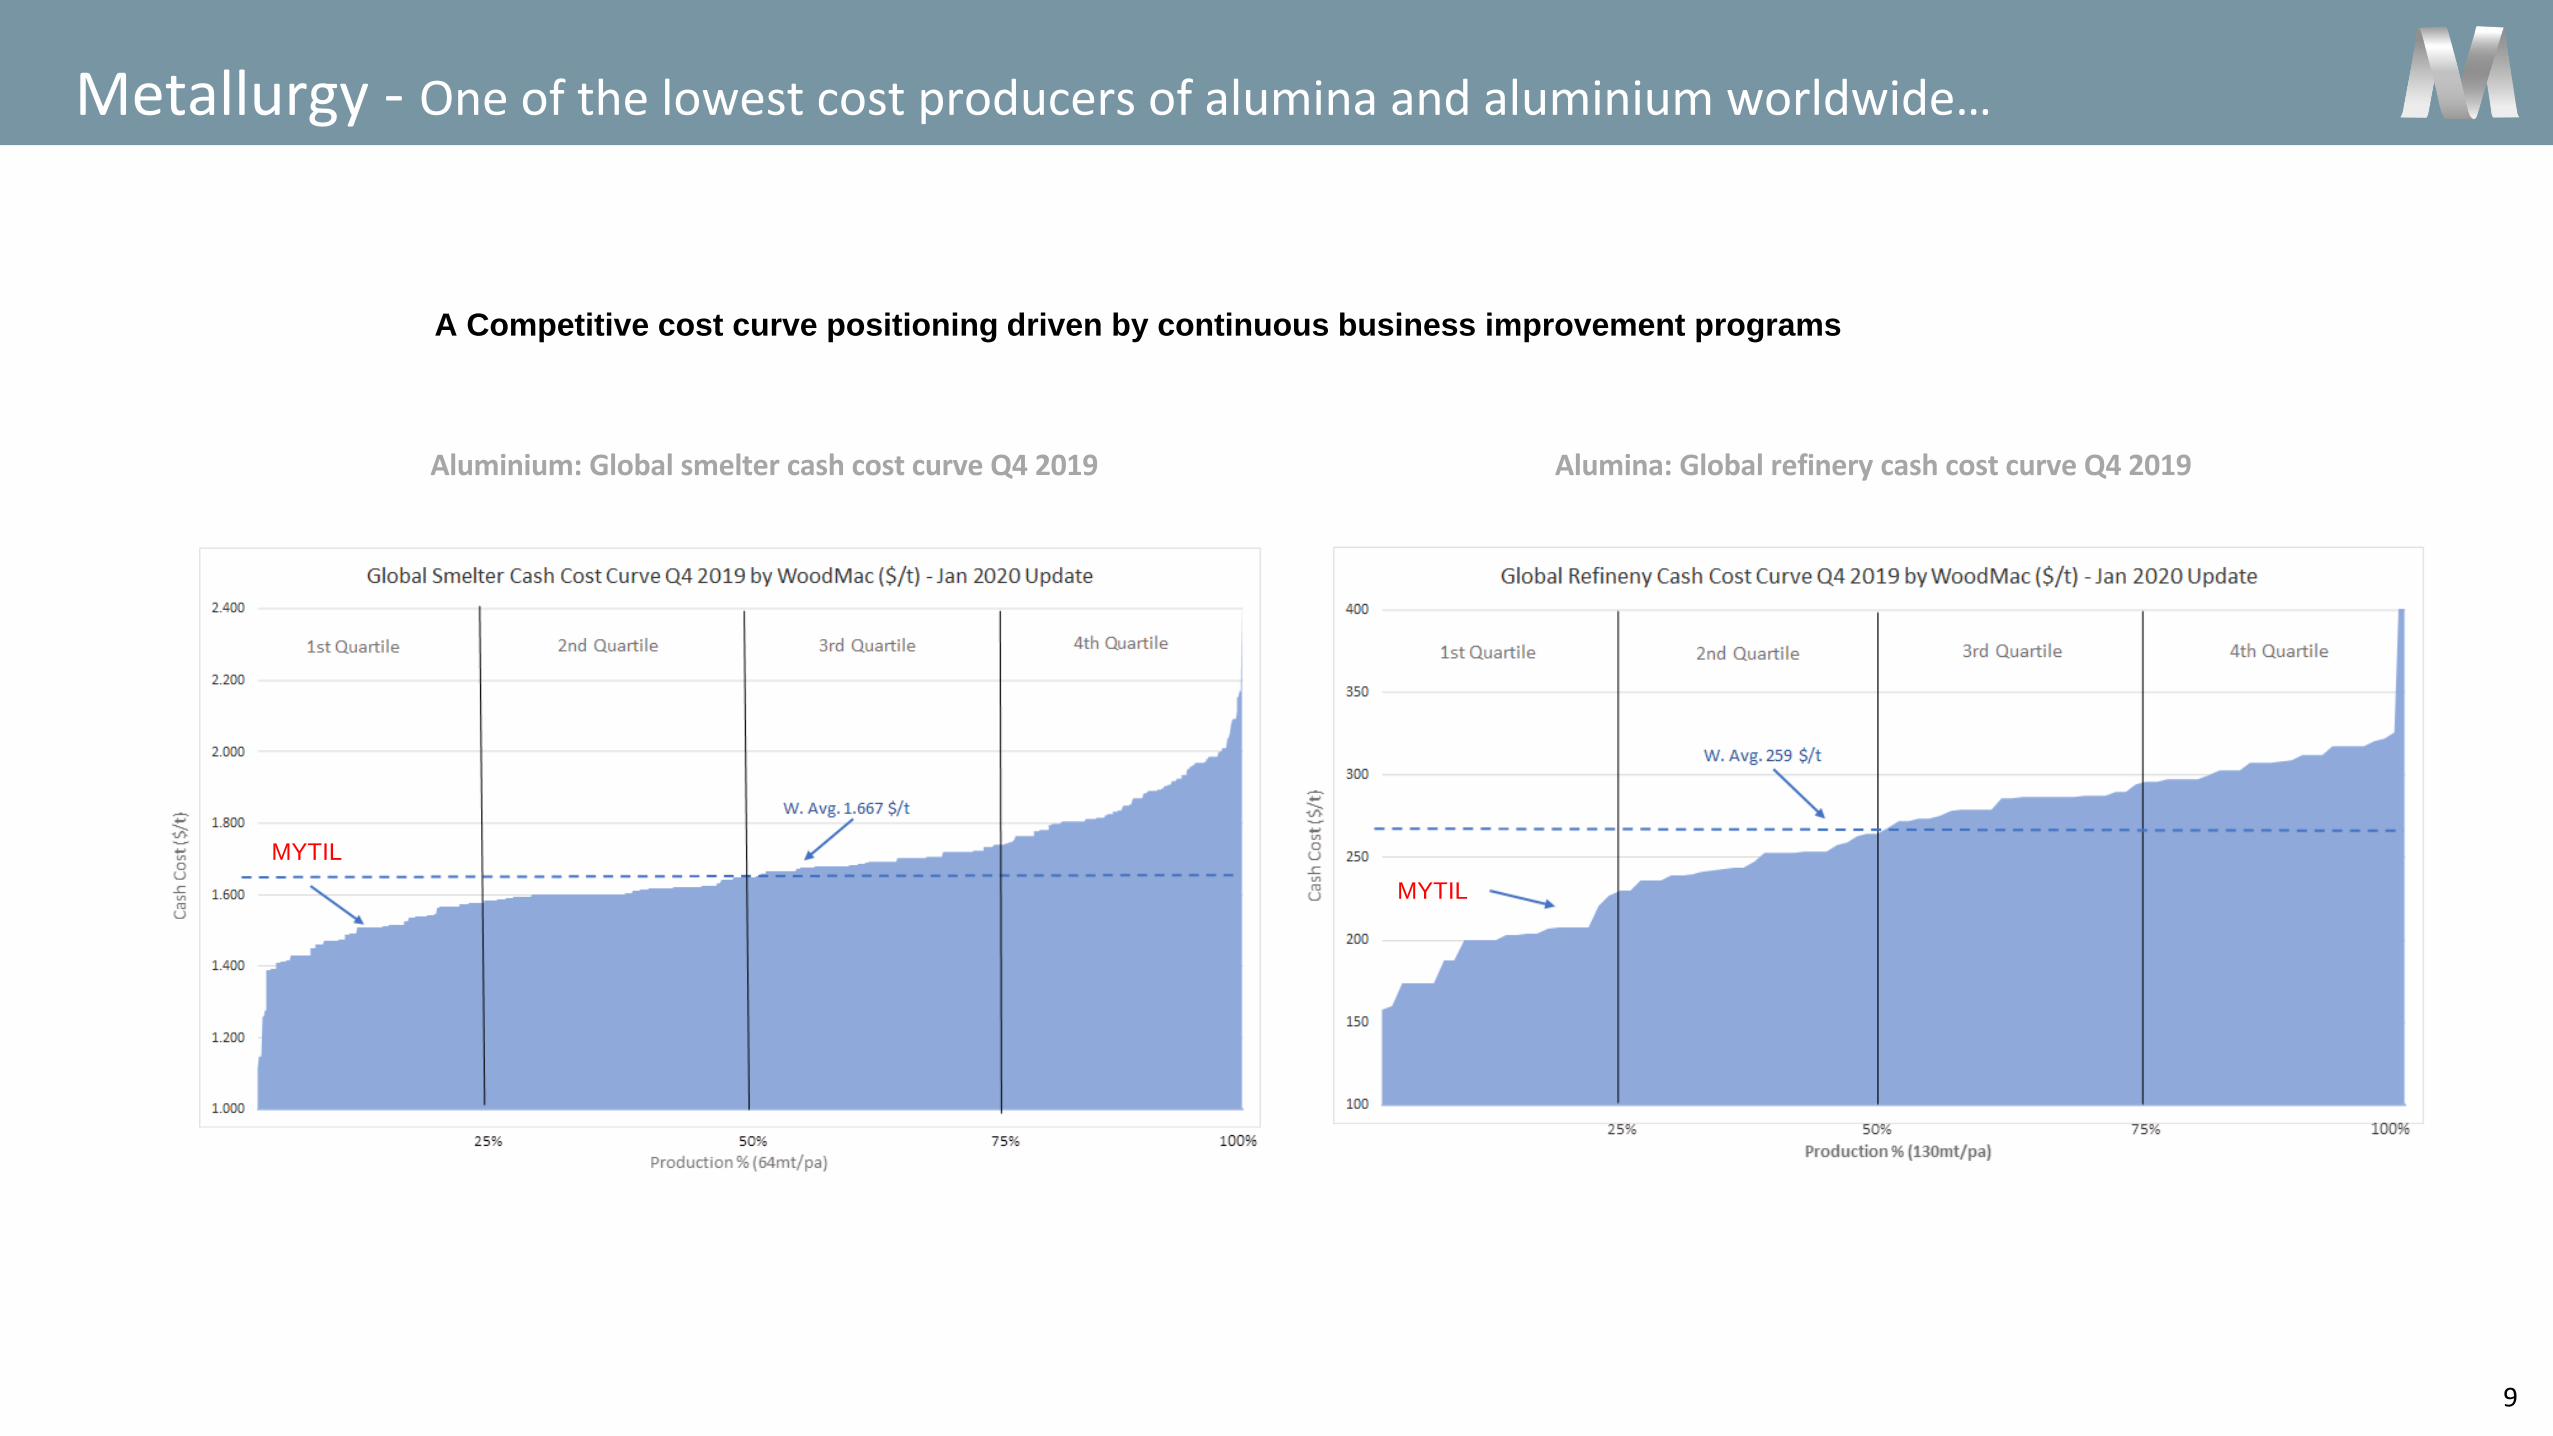
Metallurgy - One of the lowest cost producers of alumina and aluminium worldwide…
Alumina: Global refinery cash cost curve Q4 2019
A Competitive cost curve positioning driven by continuous business improvement programs
Aluminium: Global smelter cash cost curve Q4 2019
MYTIL
MYTIL

10
Metallurgy - ...with successful and continuous cost optimisation initiatives
Over €230mn of cumulative cost
savings were identified and
achieved since 2012
Total saving: €119mn Total saving: €78mn Total saving: €35mn
2012 – 2014 2015 – 2016 2017 – 2018
Improved operations from 4th quartile
to the 2nd quartile
Focused on raw material
supply and natural gas
cost
Continuous improvements
to remain 1st quartile
“Mellon” “Excellence”
34%
26%
17%
8%
8%7% Electricity
CHP
Operational
Other
Natural gas
Raw materials
2242
87 98 84124
166
1.500
1.750
2.000
2.250
2.500
020406080
100120140160180
2012 2013 2014 2015 2016 2017 2018
EBITDA €mm All-in Aluminium Sales Price $/tn
Hephaestus initiative
July 2019 – 2021
Cost base optimization and improving
refinery & smelter productivity
Total Targeting Savings: €60mn
(50% one-off - 50% recurring)
“The Best”
Initiatives aimed at expanding alumina & aluminium output, optimising procurement of
raw materials and other input costs, with continuous operational improvements
12
14
16
18
20
22
24
26
28
30
100
200
300
400
500
600
700
Dec
-13
Mar
-14
Jun
-14
Sep
-14
Dec
-14
Mar
-15
Jun
-15
Sep
-15
Dec
-15
Mar
-16
Jun
-16
Sep
-16
Dec
-16
Mar
-17
Jun
-17
Sep
-17
Dec
-17
Mar
-18
Jun
-18
Sep
-18
Dec
-18
Mar
-19
Jun
-19
Sep
-19
Dec
-19
Alumina Price % of LME
11
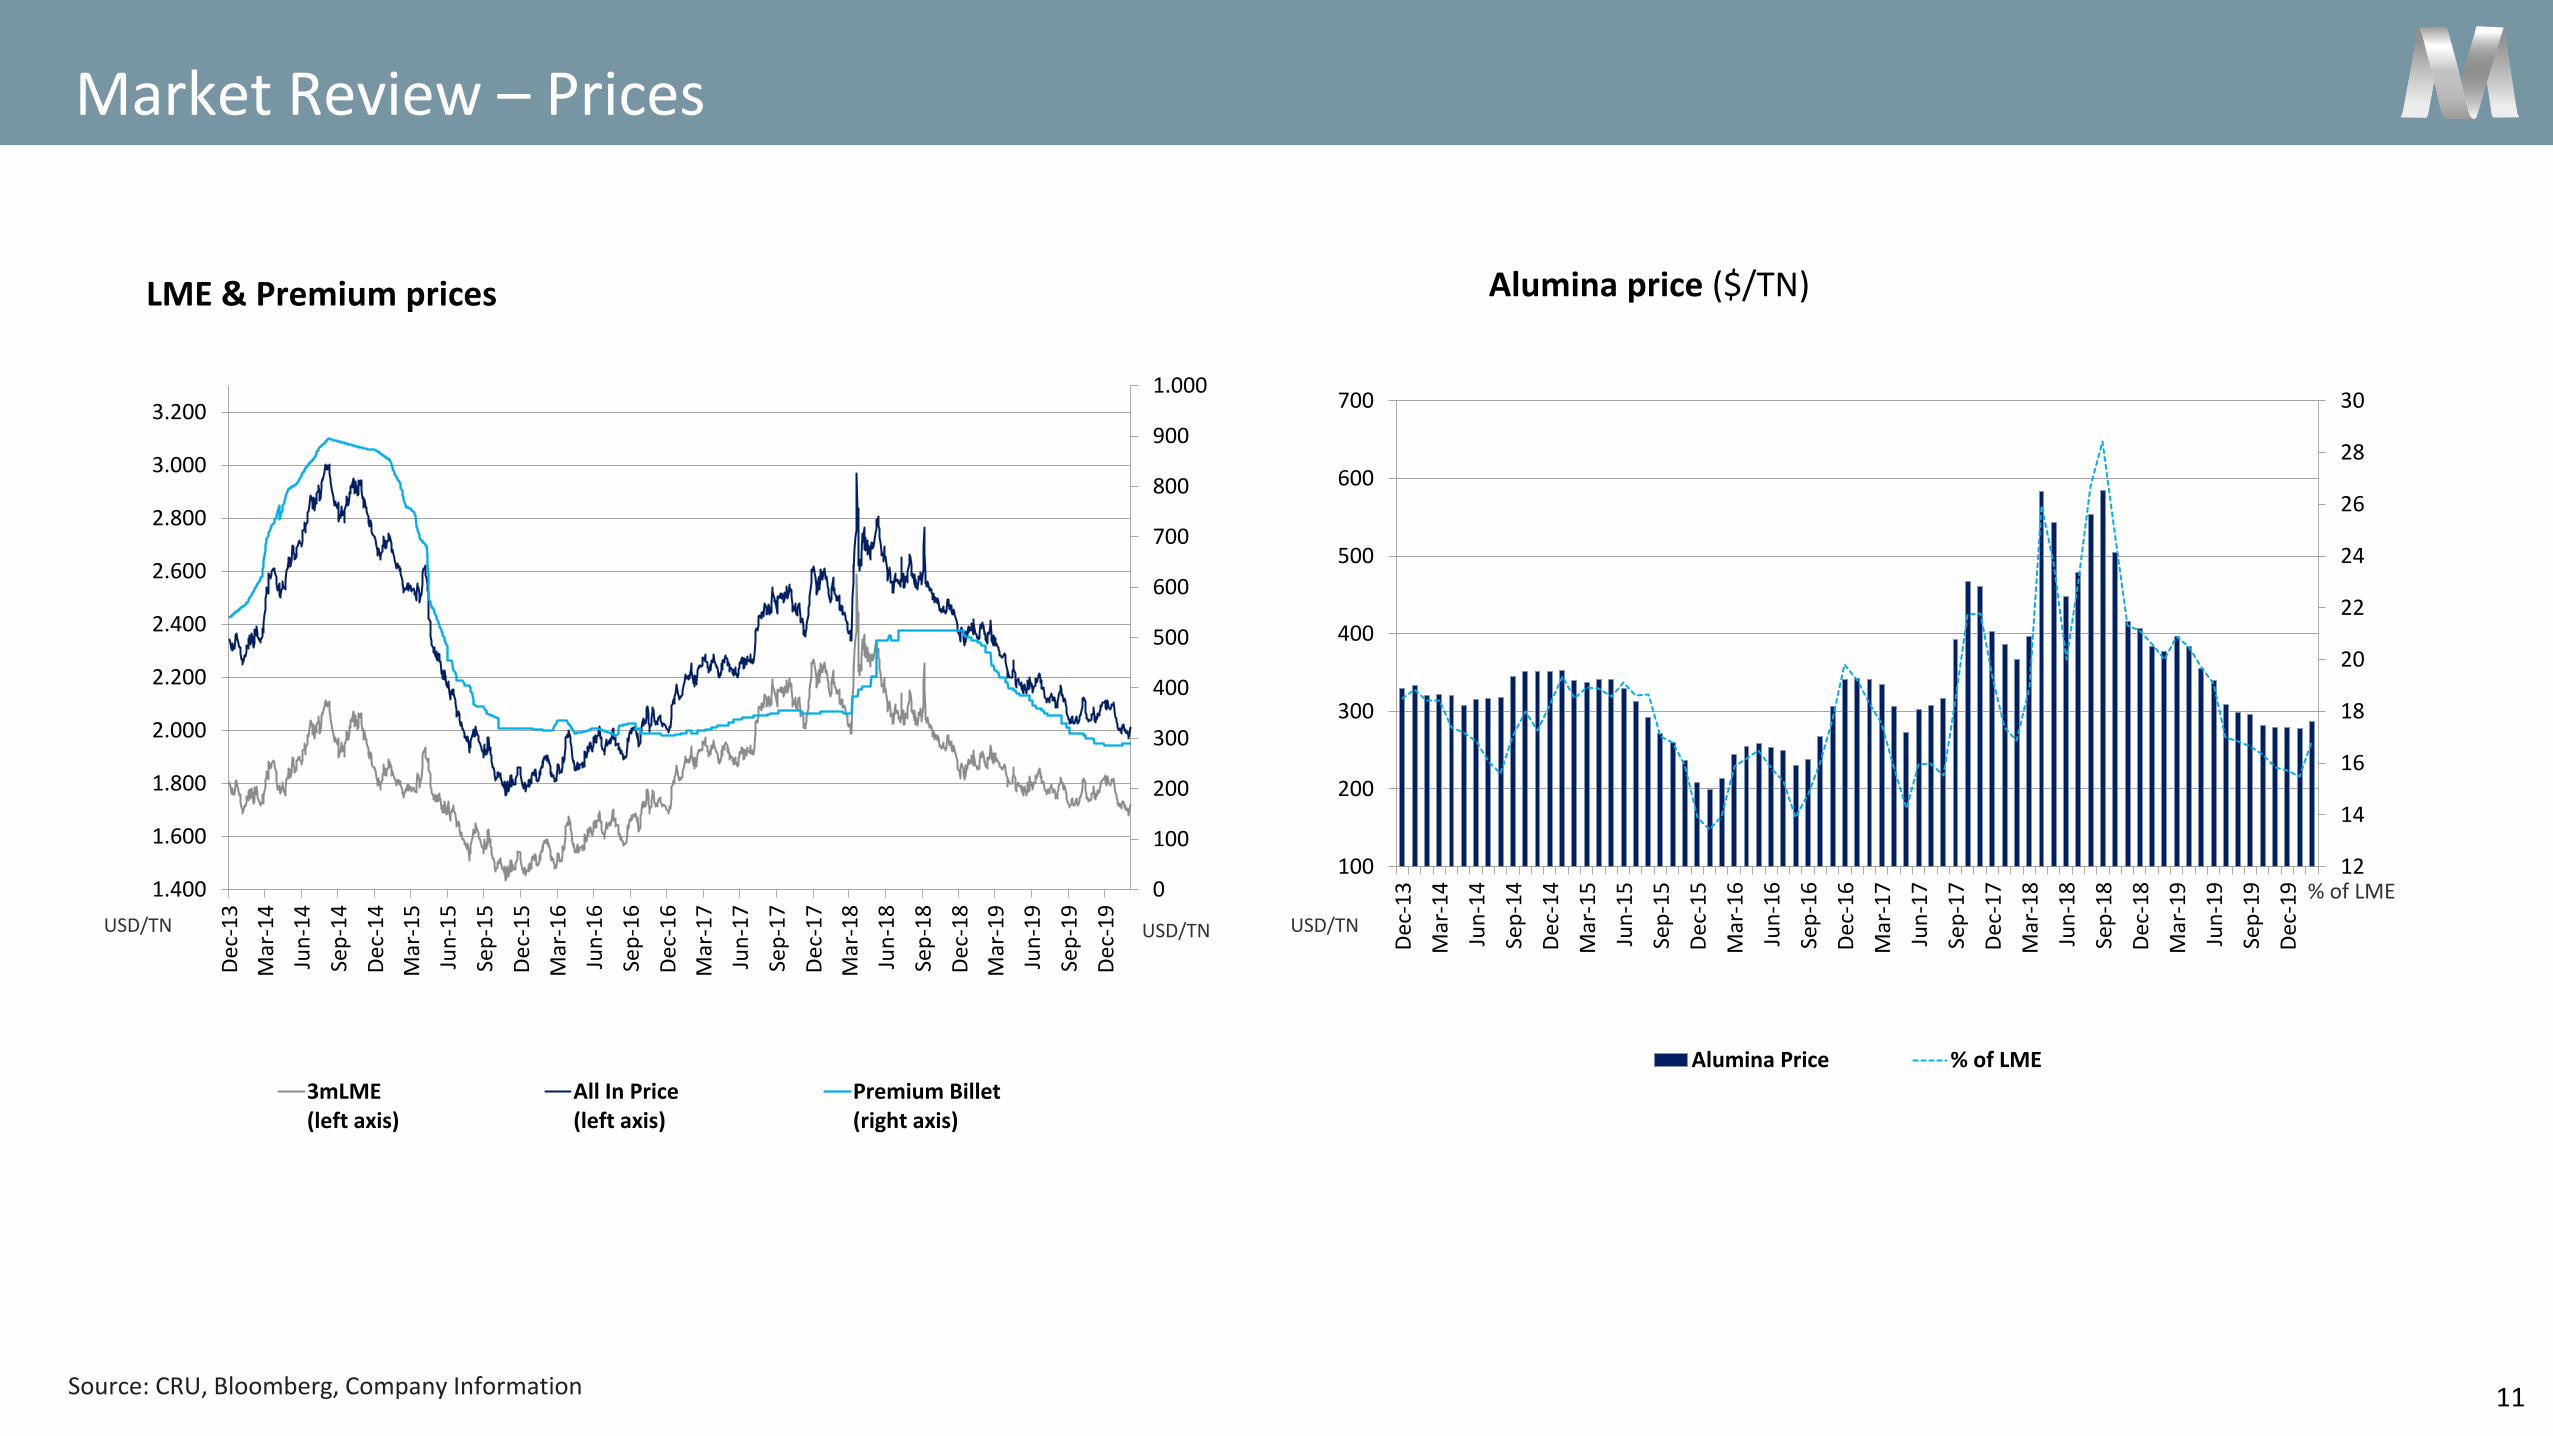
Market Review – Prices
Source: CRU, Bloomberg, Company Information
LME & Premium prices
USD/TNUSD/TN
Alumina price ($/TN)
% of LME
USD/TN
0
100
200
300
400
500
600
700
800
900
1.000
1.400
1.600
1.800
2.000
2.200
2.400
2.600
2.800
3.000
3.200
Dec
-13
Mar
-14
Jun
-14
Sep
-14
Dec
-14
Mar
-15
Jun
-15
Sep
-15
Dec
-15
Mar
-16
Jun
-16
Sep
-16
Dec
-16
Mar
-17
Jun
-17
Sep
-17
Dec
-17
Mar
-18
Jun
-18
Sep
-18
Dec
-18
Mar
-19
Jun
-19
Sep
-19
Dec
-19
3mLME(left axis)
All In Price(left axis)
Premium Billet(right axis)
12
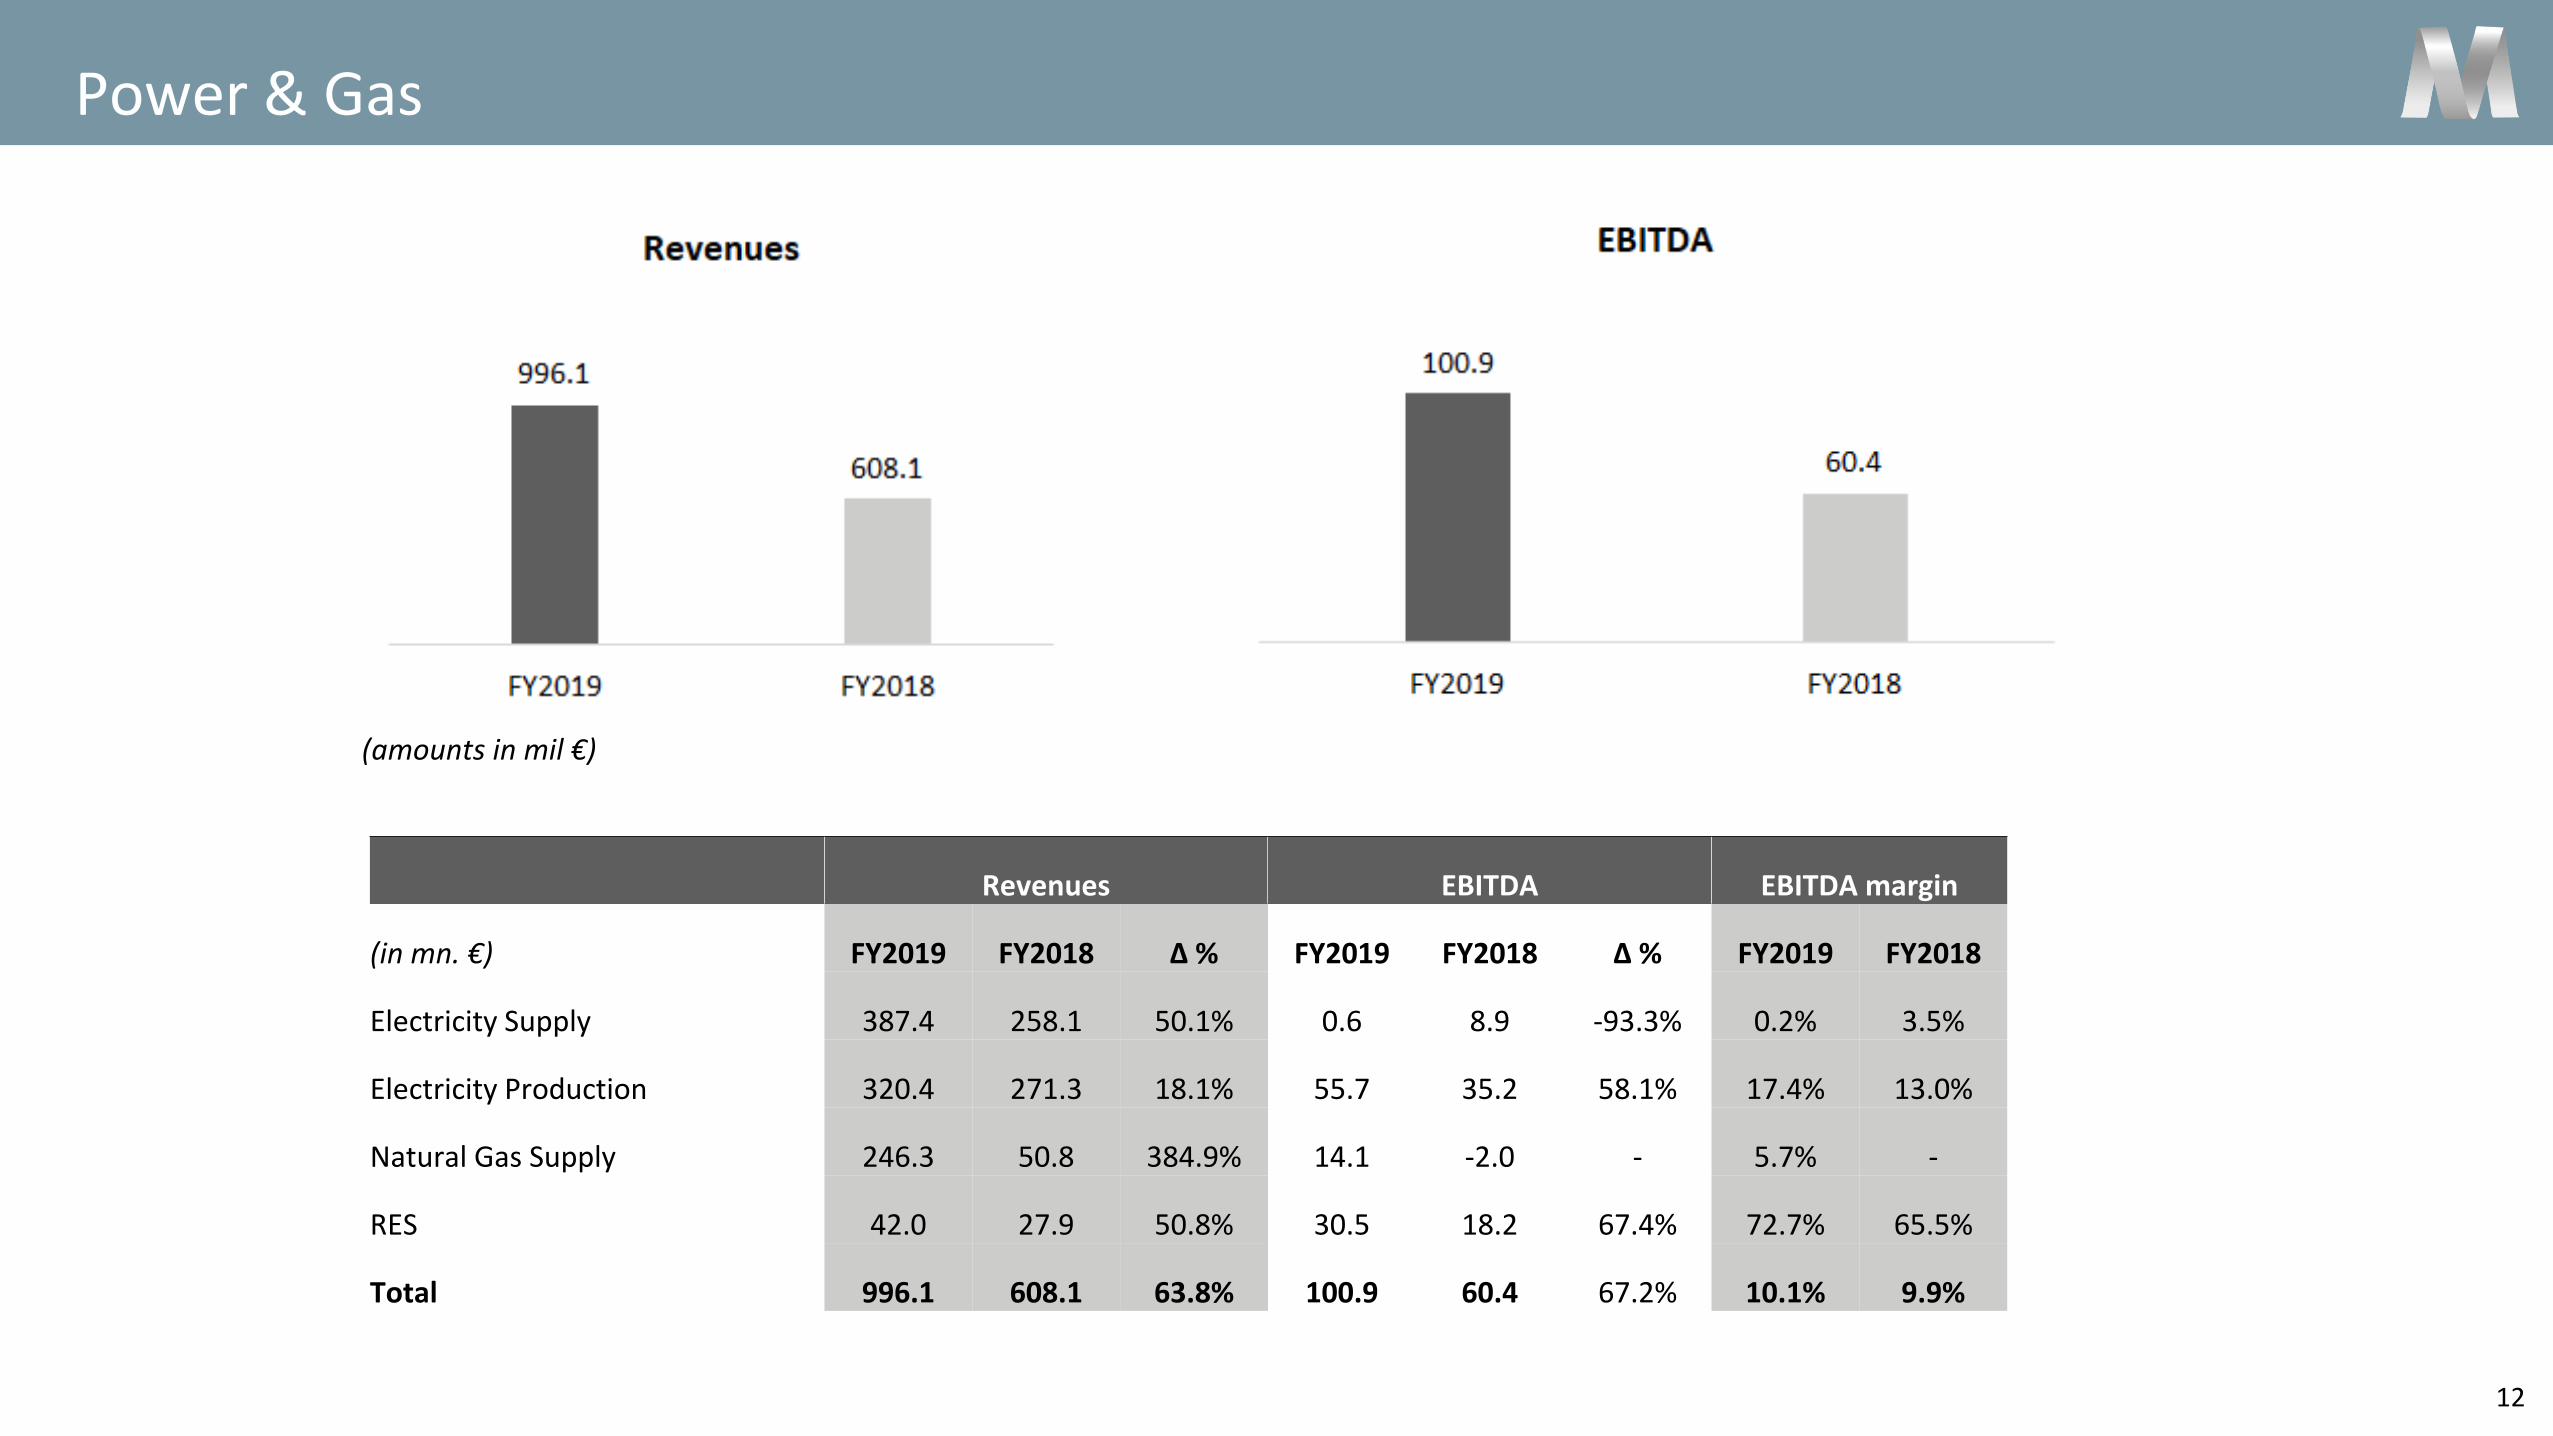
Power & Gas
(amounts in mil €)
Revenues EBITDA EBITDA margin
(in mn. €) FY2019 FY2018 Δ % FY2019 FY2018 Δ % FY2019 FY2018
Electricity Supply 387.4 258.1 50.1% 0.6 8.9 -93.3% 0.2% 3.5%
Electricity Production 320.4 271.3 18.1% 55.7 35.2 58.1% 17.4% 13.0%
Natural Gas Supply 246.3 50.8 384.9% 14.1 -2.0 - 5.7% -
RES 42.0 27.9 50.8% 30.5 18.2 67.4% 72.7% 65.5%
Total 996.1 608.1 63.8% 100.9 60.4 67.2% 10.1% 9.9%
13
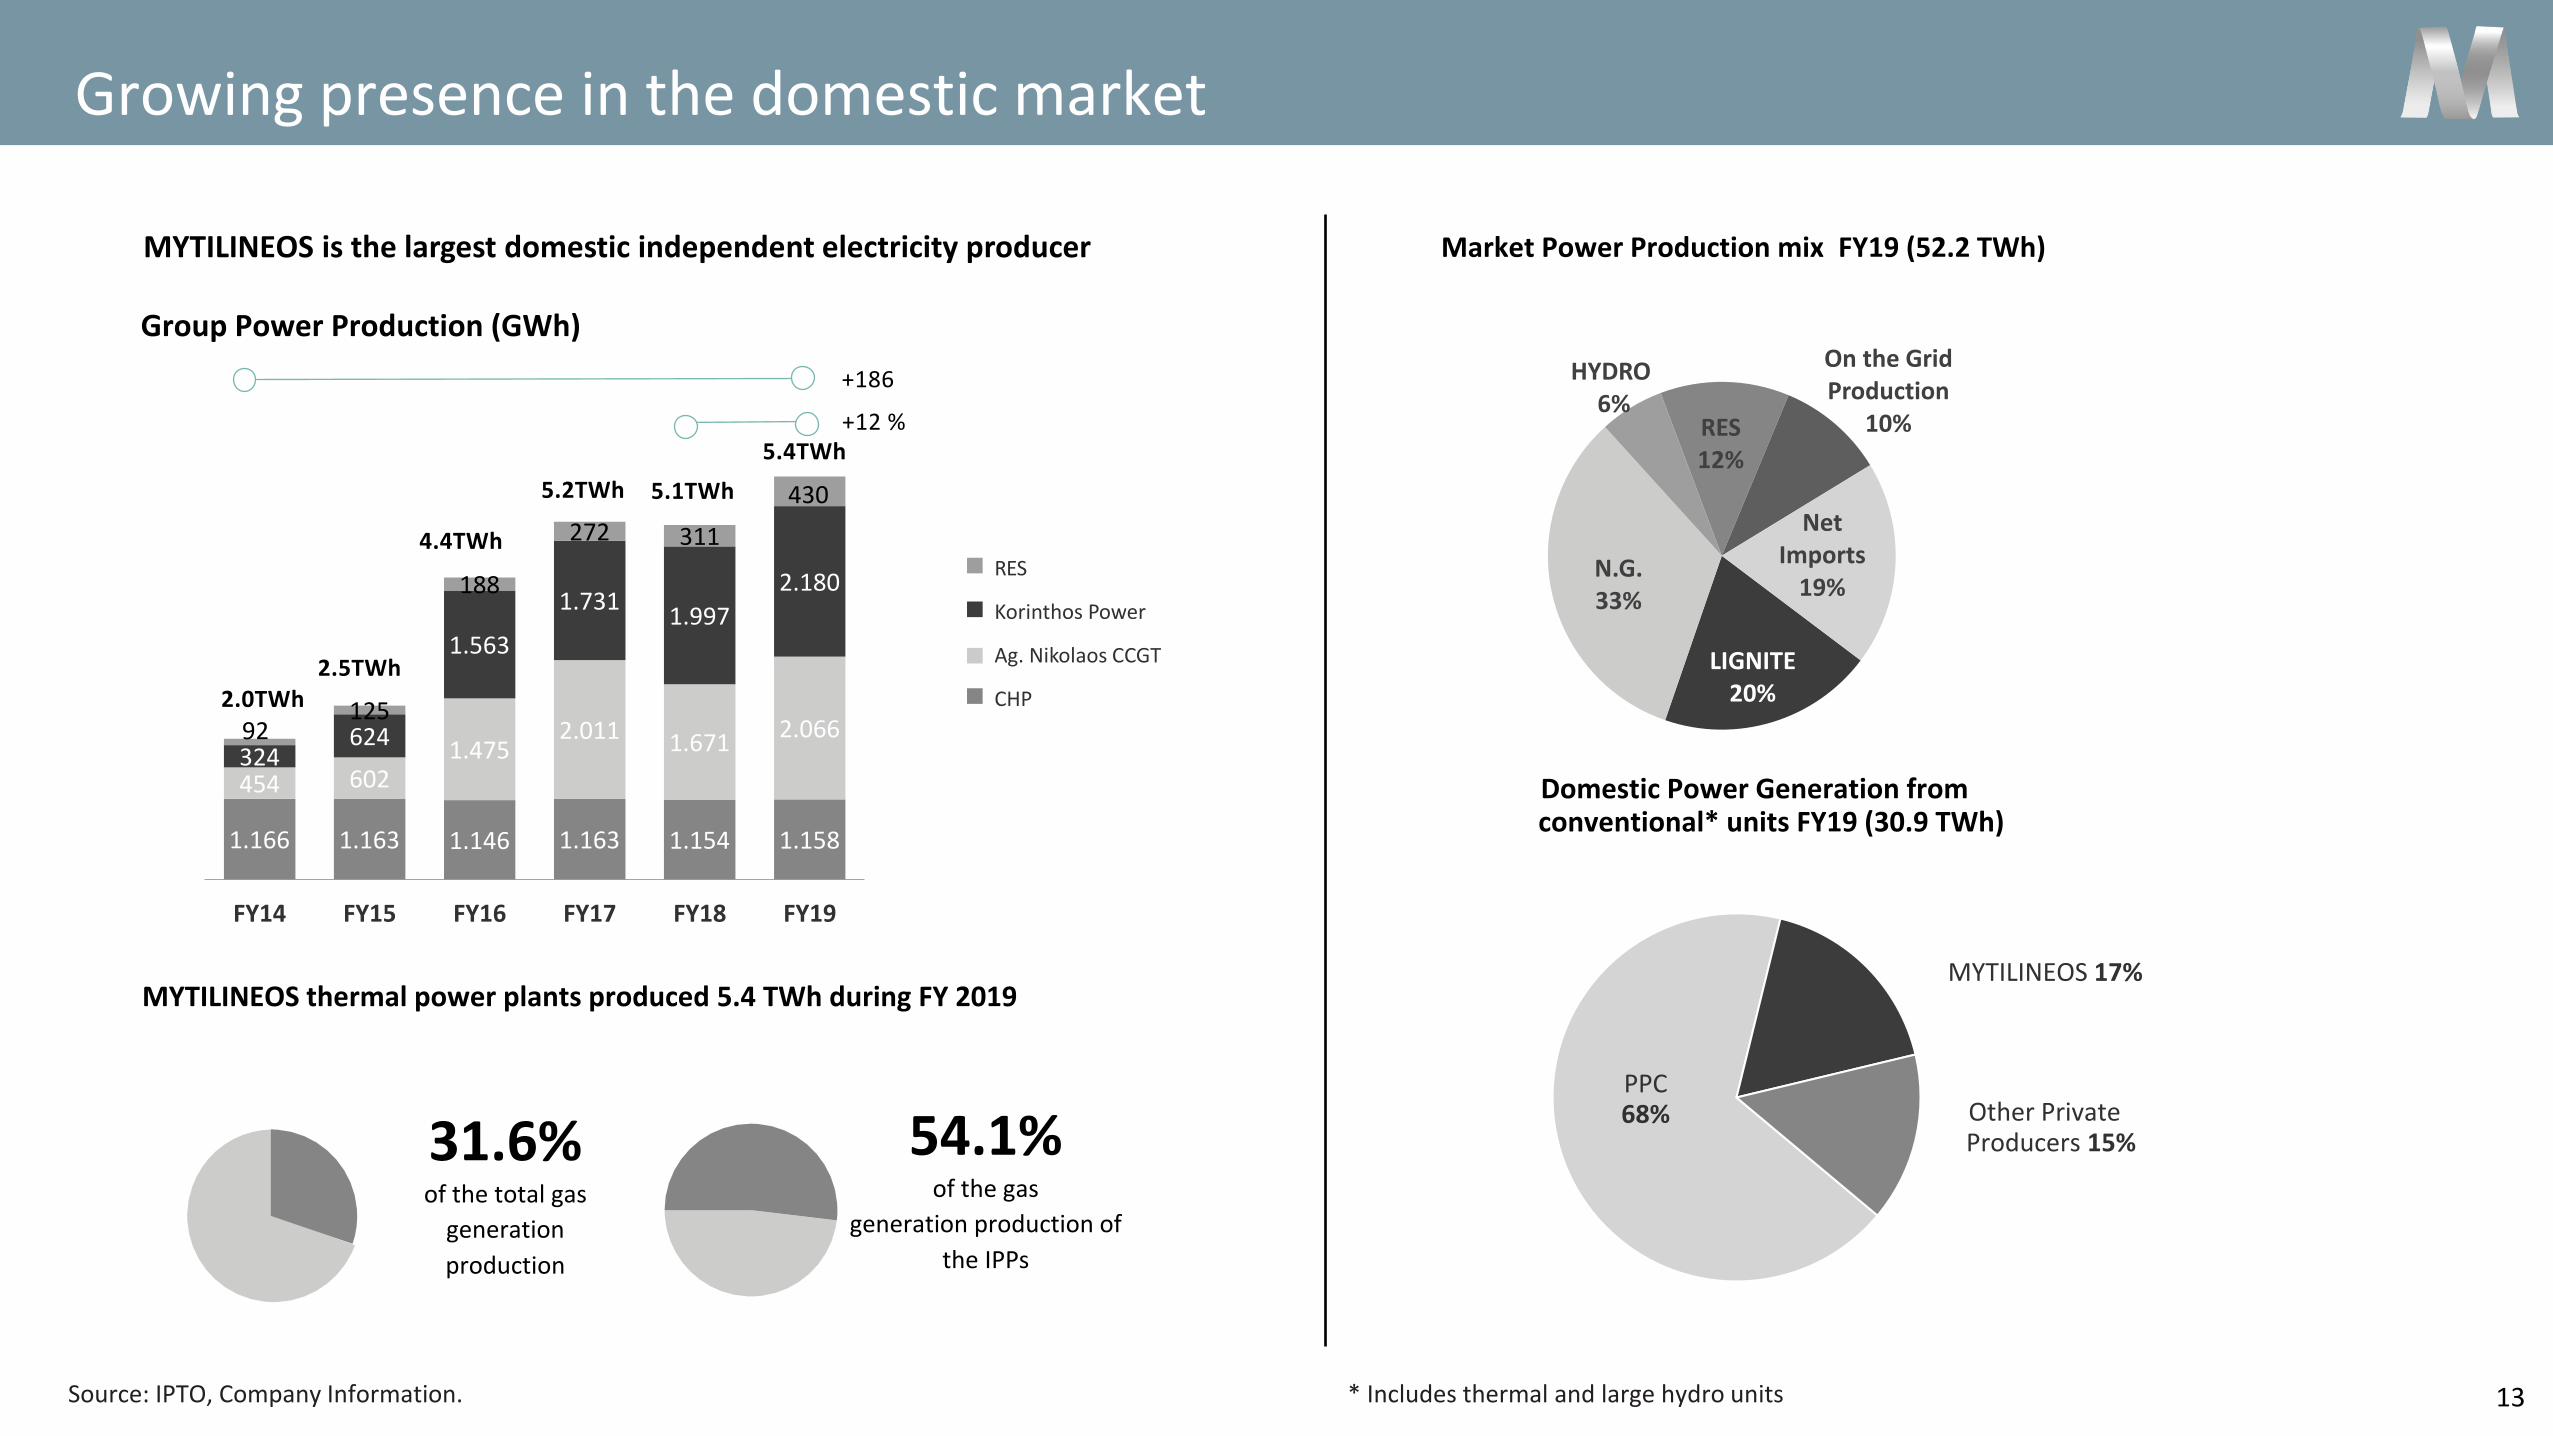
Growing presence in the domestic market
MYTILINEOS is the largest domestic independent electricity producer
1.166 1.163 1.146 1.163 1.154 1.158
454 6021.475
2.011 1.6712.066
324624
1.563
1.7311.997
2.180
92125
188
272 311
430
FY14 FY15 FY16 FY17 FY18 FY19
Group Power Production (GWh)
RES
+186
2.0TWh2.5TWh
4.4TWh
Ag. Nikolaos CCGT
CHP
Korinthos Power
5.2TWh 5.1TWh
PPC68%
MYTILINEOS 17%
Other Private Producers 15%
Domestic Power Generation from conventional* units FY19 (30.9 TWh)
Market Power Production mix FY19 (52.2 TWh)
MYTILINEOS thermal power plants produced 5.4 TWh during FY 2019
Source: IPTO, Company Information. * Includes thermal and large hydro units
+12 %
54.1%of the gas
generation production of
the IPPs
31.6%of the total gas
generation
production
5.4TWh
LIGNITE20%
N.G.33%
HYDRO6%
RES12%
On the Grid Production
10%
Net Imports
19%

56,0 56,859,2 59,2 59,7
62,8 64,0 65,3 65,3 66,369,7 70,2 70,5
73,776,8 77,6 77,7 78,0
81,4 82,6 82,8 83,4 83,7 83,8
0
10
20
30
40
50
60
70
80
90
Fuel + Variable O&M Cost (€/MWh) CO2 Cost (€/MWh) Bid (€/MWh) Avg SMP (€/MWh)
14
Merit Order: MYTILINEOS continues to rank first among thermal energy producers
Merit Order based on Bids – FY 2019
AVG SMP: 63.82 €/MWhPrice Makers Total Hours
% of Hoursper Fuel Type 2019
Lignite 1,652 18.9%
Gas 5,038 57.5%
Hydro 401 4.6%
Imports 1,080 12.3%
Exports 521 5.9%
Pumping 68 0.8%
Total 8,760 100.0%
Avg effective CO2: 24,71 €/tn
15
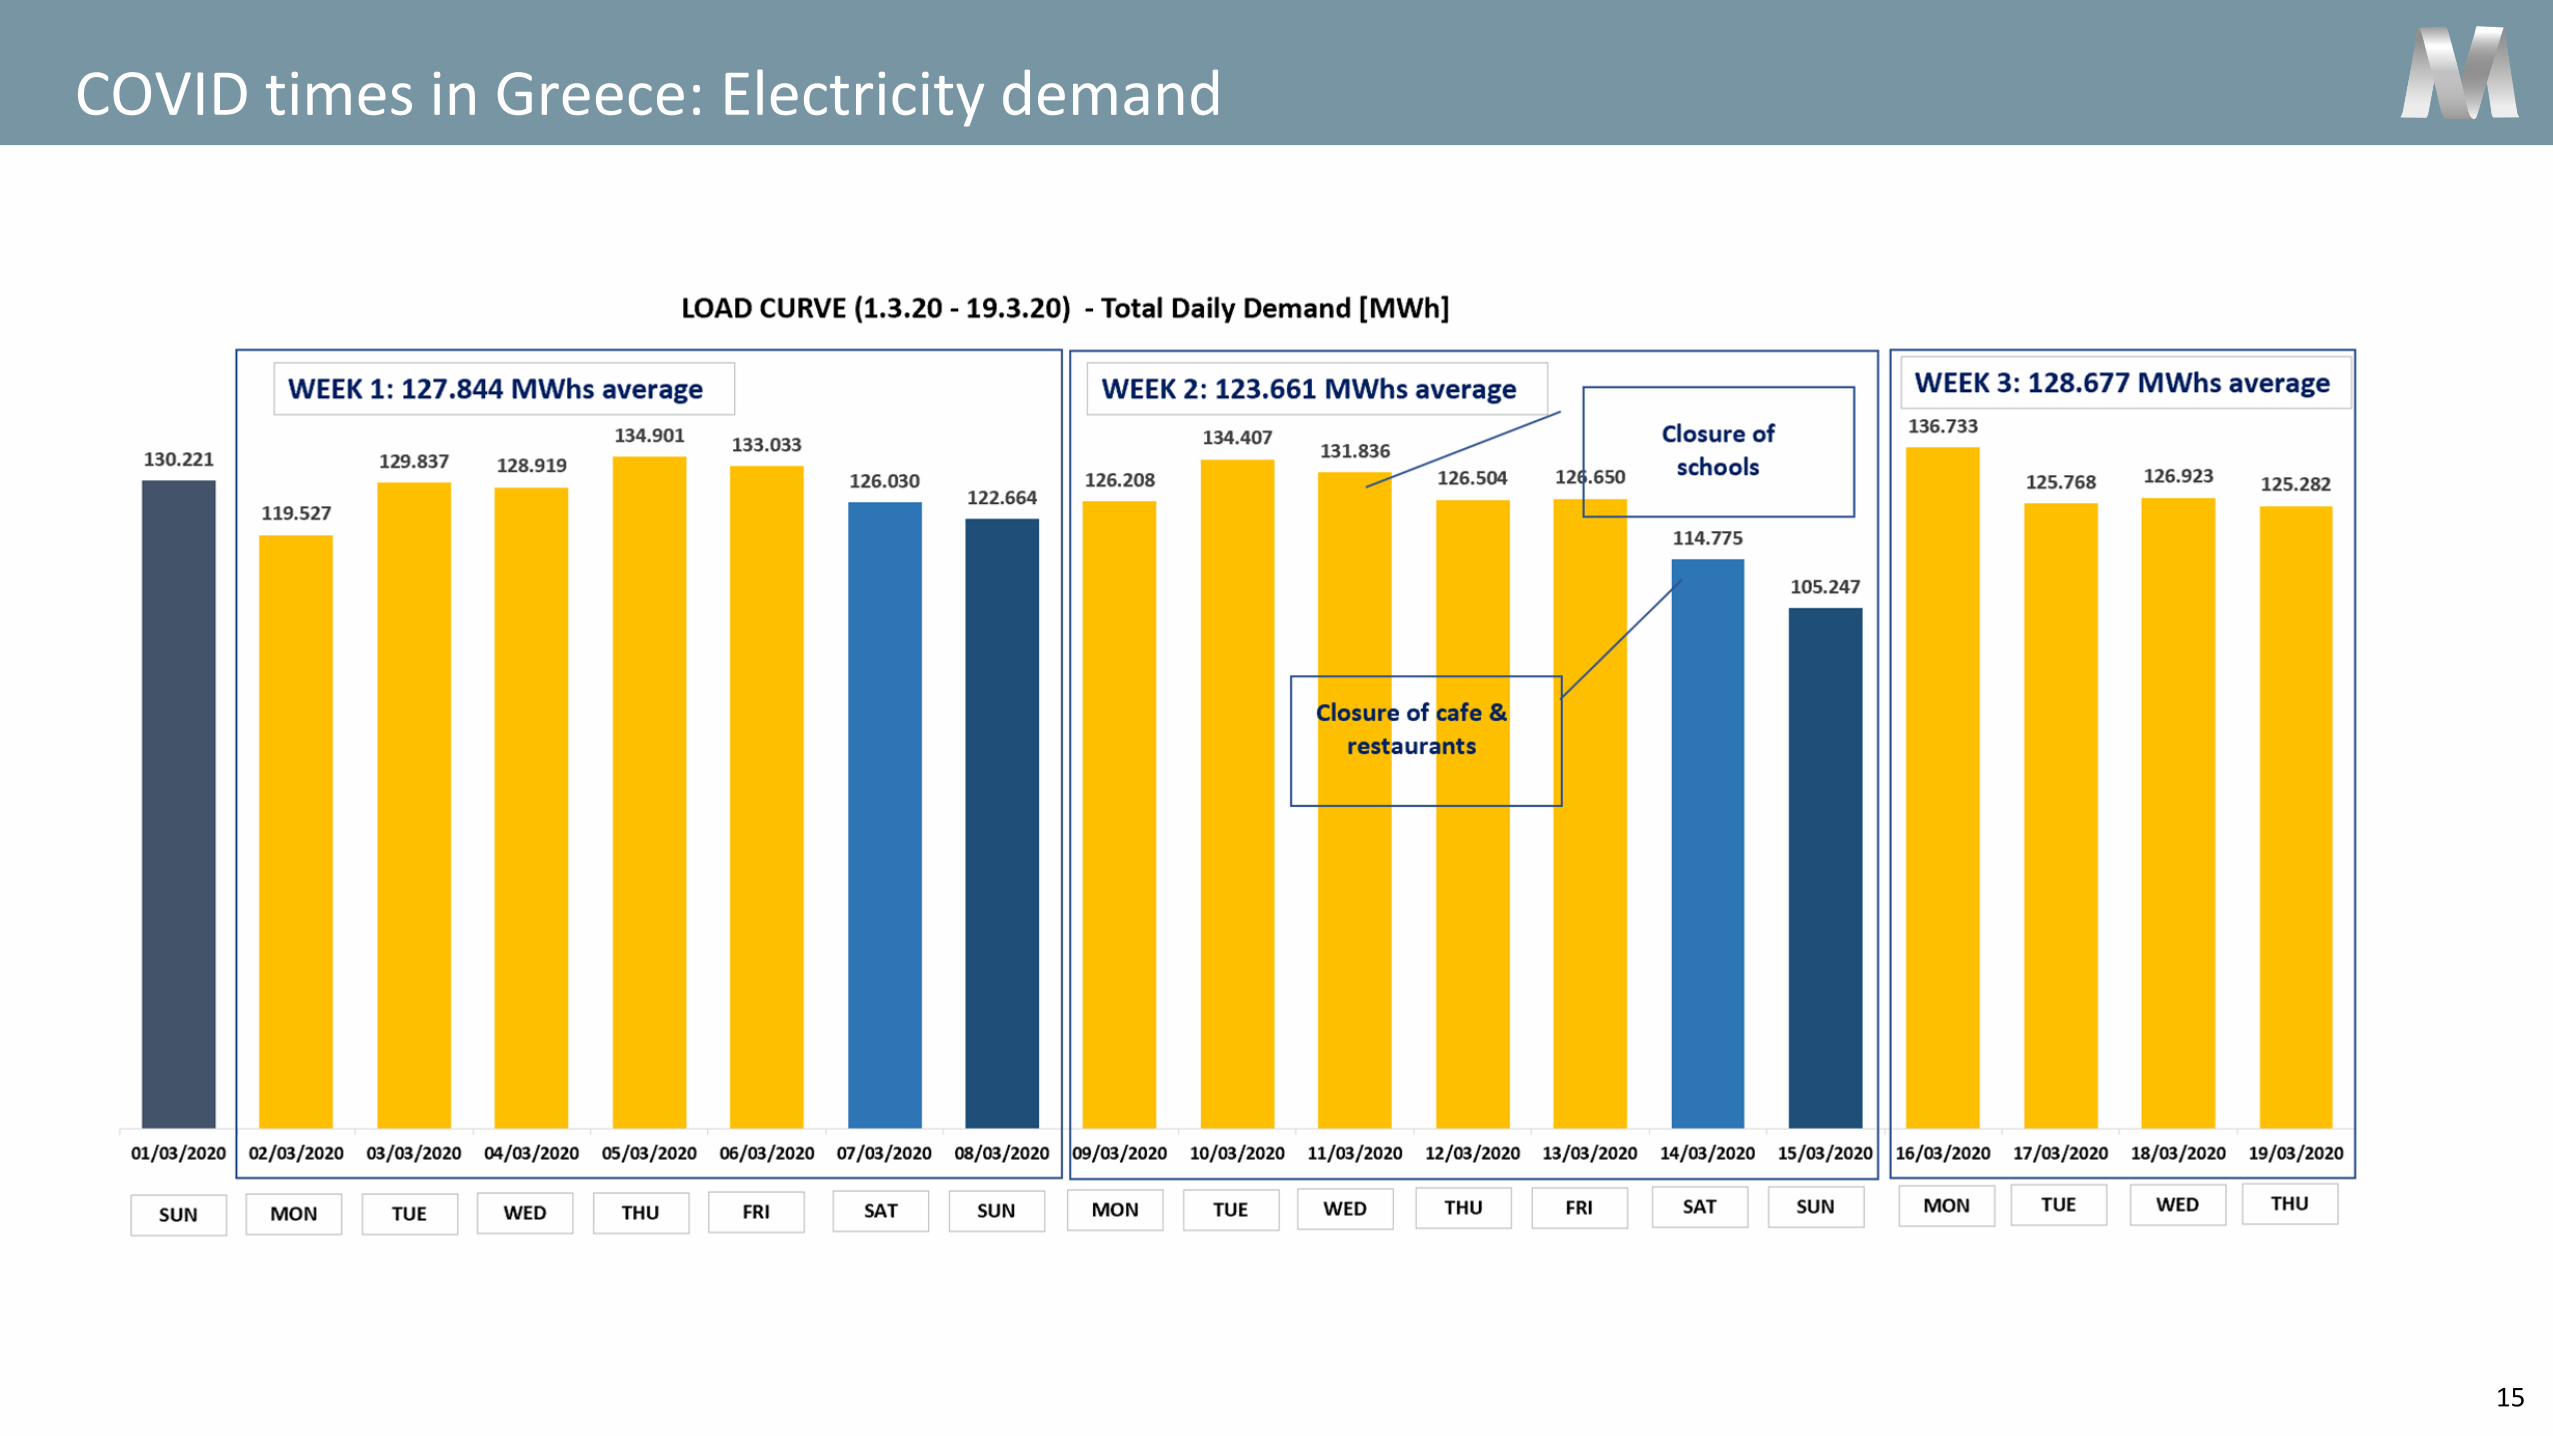
COVID times in Greece: Electricity demand

15,00
16,00
17,00
18,00
19,00
20,00
21,00
22,00
23,00
24,00
25,00
26,00
27,00
28,00
29,00
30,00
31,00
32,00
33,00
€ /
ΜW
h
WA Gas Price (€/MWh)
MYT Gas Price Indication (€/MWh)
-8%
-9%-12%
-11% -12%-11%
-13%
-18%
-10%
-7%-9% -6%
-18%
-26%-15%
-26%
-37%
-25%-27%
-35%
-19%
-33%
-37%
-26%
16
Power & Gas: Sourcing of natural gas at below weighted average gas prices for electricity in 2019
Source: LAGIE

(mn. €)up to 1
year1-3 years 3-5 years Total
Ghana 52.0 1.1 - 53.1
Libya 0 347.1 - 347.1
Greece 82.3 66.0 51.1 199.5
UK 60.7 - - 60.7
Spain 61.2 - - 61.2
Slovenia 88.2 24.2 - 112.4
Other 39.3 40.6 - 79.9
Total 383.8 479.1 73.7 914.0
17
EPC & Infrastructure
Backlog
(amounts in mil €)
Revenues EBITDA EBITDA margin
(in mn. €) FY2019 FY2018 Δ % FY2019 FY2018 Δ % FY2019 FY2018
EPC & Infrastructure 254.2 242.5 4.8% 20.3 41.4 -50.9% 8.0% 17.1%
Solar Parks 388.2 85.2 355.8% 29.1 4.5 547.4% 7.5% 5.3%
Maintenance Services & Other 23.4 39.7 -41.1% 1.9 9.0 -79.3% 8.0% 22.7%
Total 665.8 367.3 81.2% 51.2 54.9 -6.6% 7.7% 14.9%
18
Contact Information
Cleo Lymberis
IR DirectorT: +30 210 6877 412F: +30 210 6877 400E: [email protected]
Dimitris Katralis
IR OfficerT: +30 210 6877 476F: +30 210 6877 400E: [email protected]
MYTILINEOS S.A.8 Artemidos Str.
15125 Maroussi Athens GreeceT: +30 210 6877 300F: +30 210 6877 400