21
FC Research May 2017

FC Research
May 2017

• Monetary Policy Review…………..……………………………………………………...............
• $1.5Bn International Sovereign Bond…………………………………………………………….
3
4
• Inflation…………………………………………………………………………………….............. 5
• M2B & Sector Credit…………………………………………………………………............... … 7
• Reserves & Liquidity………………………………………………………………………............ 8
• Currency Movement…………………………………………………………………................... 9
• Government Securities……………………………………………………………….................. 11
• Finance Sector Rate Movement……………………………………………………………..... … 13
• External Sector……………………………………………………………………………………... 14
• Tourist Arrivals……………………………………………………………………………………... 18
• Global Markets……………………………………………………………………………………... 19
May 2017FC Research 2
Policy rates unchanged
Private sector credit growth decelerated gradually to 21.0% in February 2017 and20.4% in March 2017. The Earlier tightening of monetary policy by central bank andresultant increase in interest rates impacted the credit growth.
Combined impact of the decline in export earning and increased expenditure onimports as a result of the drought conditions expanded Trade deficit to USD 1.7Bn tillFebruary 2017.
Gross official reserves dipped to USD 5.1Bn by end April 2017 from USD 6.0Bn by end2016. Both the government securities market and the Colombo Stock Exchangeexperienced foreign inflows in recent months.
Accordingly policy rates were increased,
Standing Deposit Facility Rate – 7.25%
Standing Lending Facility Rate – 8.75%
Statutory Reserve Ratio (SRR) – 7.50%
May 2017FC Research 3

May 2017FC Research 4
The Central Bank of Sri Lanka, on behalf of the Government of Sri Lanka, successfully priceda new US $1.5Bn 10-year International Sovereign Bond on May 4th, 2017. The Bonds havebeen rated ‘B1’, ‘B+’ and ‘B+' by Moody's Investors Service, Standard and Poor’s and FitchRatings respectively.
Sri Lanka has narrowed the country's risk premium by 1.475% thus the bond was priced at6.20%,lower than the initial price guidance of 6.625%. Last sold 10-yr SL sovereign bond on11 July 2016 priced at 6.825%. On July 12,the US 10-yr bond yield at 1.530%, indicating arisk premium of 5.345% at the time. The US 10-yr bond yield is now about 2.330%, indicatinga risk premium over the US yield of only 3.870%
Date
10-Yr SL
Sovereign bond
10-Yr US
Treasury Yield Risk Premium
12-Jul-2016 6.875% 1.530% 5.345%
04-May-2017 6.200% 2.330% 3.870%
Change 0.675% (0.800%) (1.475%)

• Increase of food items by -
1.7%MoM and non-food
items by 0.1%MoM.
• On YoY basis inflation starts to
decline with food inflation
dipping to 8.6% and Non
Food to 6.3% compare with
March 2017 9.2% and 6.5%
respectively.
May 2017FC Research 5
3.4%
4.8%
5.5% 5.8%
4.4%4.2%
4.1% 4.0%
4.5%
5.5%
6.8%
7.3%6.9%
3.5%
5.6%5.4%
5.0%
3.8%
3.7% 3.8%
4.8%
5.8%
7.0%7.1%
7.3%
6.8%
0.0%
1.0%
2.0%
3.0%
4.0%
5.0%
6.0%
7.0%
8.0%
Inflation YoY Core Inflation YoY
Source: Dept. Census and Statistics

• NCPI for March 2017
increased to 8.6% from 8.2%
in February 2017.
• On YoY basis inflation started
to accelerate with food
inflation climbing to 11.2%
while Non Food to 6.7%.
May 2017FC Research 6
2.2%
4.3%
5.3%
6.4%
5.8%
4.5%
4.7%
5.0%
4.1%
4.2%
6.5%
8.2%
8.6%
0.0%
1.0%
2.0%
3.0%
4.0%
5.0%
6.0%
7.0%
8.0%
9.0%
10.0%
Source: Dept. Census and Statistics
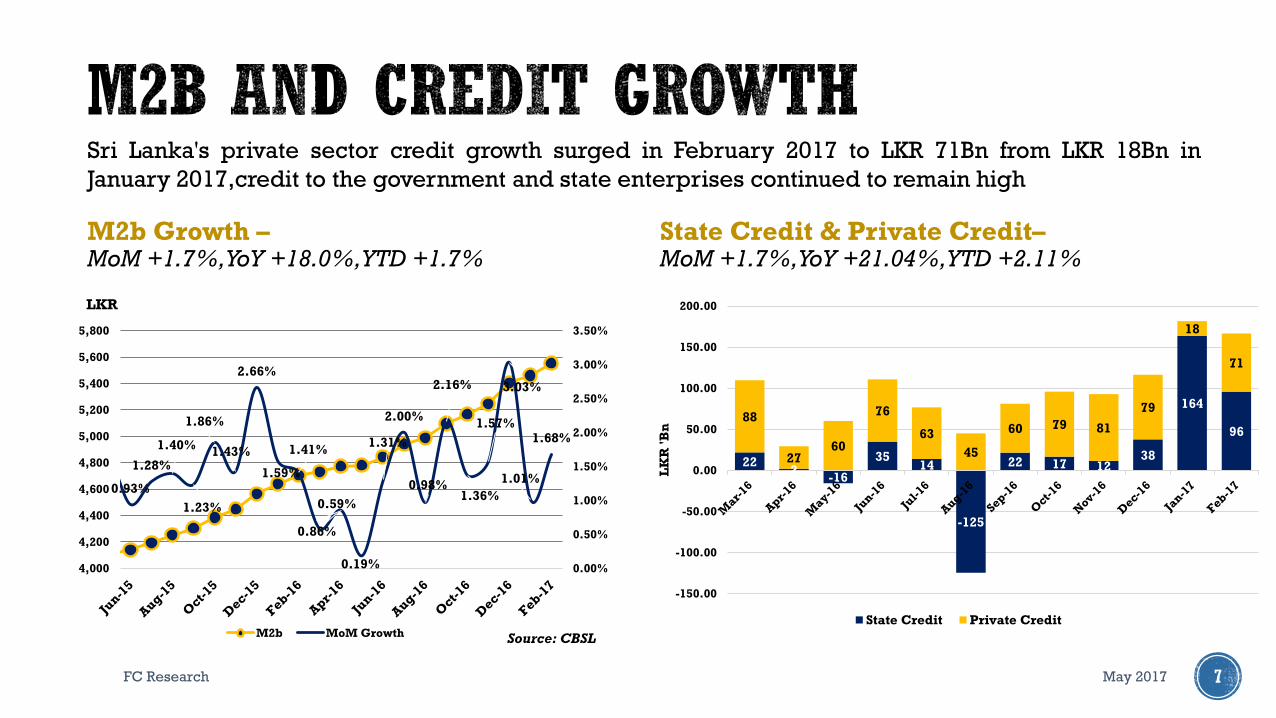
M2b Growth –MoM +1.7%, YoY +18.0%, YTD +1.7%
May 2017FC Research 7
Sri Lanka's private sector credit growth surged in February 2017 to LKR 71Bn from LKR 18Bn in
January 2017,credit to the government and state enterprises continued to remain high
0.93%
1.28%
1.40%
1.23%
1.86%
1.43%
2.66%
1.59%
1.41%
0.59%
0.86%
0.19%
1.31%
2.00%
0.98%
2.16%
1.36%
1.57%
3.03%
1.01%
1.68%
0.00%
0.50%
1.00%
1.50%
2.00%
2.50%
3.00%
3.50%
4,000
4,200
4,400
4,600
4,800
5,000
5,200
5,400
5,600
5,800
M2b MoM Growth Source: CBSL
LKR
State Credit & Private Credit–MoM +1.7%, YoY +21.04%, YTD +2.11%
222
-16
3514
-125
22 17 1238
164
9688
2760
76
63
45
60 79 81
79
18
71
-150.00
-100.00
-50.00
0.00
50.00
100.00
150.00
200.00
LK
R '
Bn
State Credit Private Credit

May 2017FC Research 8
Foreign Reserves continue to dip sharply falling to a 84 month (6.9 years) low
Money market continued to stay in deficit due to heavy foreign debt repayments .
650
700
750
800
850
900
950
1000
-80.00
-60.00
-40.00
-20.00
0.00
20.00
40.00
60.00
80.00
100.00
CB
SL
Re
se
rve
s (L
KR
'Bn
)
Ms
rke
t L
iqu
idit
y (
LK
R '
Bn
)
Market Liquidity
CBSL ReservesSource: CBSL
6,4
81
7,2
81
7,3
04
6,2
94
6,5
73
6,2
25
6,0
69
5,6
45
5,2
92
6,4
89
6,5
99
6,4
56
6,0
54
5,6
64
6,0
19
5,4
52 5,6
19
5,1
20
5,0
46
4,500
5,000
5,500
6,000
6,500
7,000
7,500USD 'Mn
Gross Official Reserves (USD mn) Source: CBSL

USD:LKR MovementSri Lankan Rupee vs Global Currencies
May 2017FC Research 9
Source: CBSL
Ap
r 2
01
7Y
TD
20
17
Source: CBSL
-3.5%
-1.9%
-1.3%
-0.9%
-0.1%
0.0%
2.1%
2.1%
UK Pound
Euro
India Rupee
Japan YEN
US Dollar
China Renmiibi
Can Dollar
Aus Dollar
-7.4%
-6.5%
-6.2%
-4.7%
-4.6%
-2.4%
-1.4%
-0.2%
India Rupee
UK Pound
Japan YEN
Aus Dollar
Euro
China Renmiibi
US Dollar
Can Dollar
151.80
152.00
152.20
152.40
152.60

May 2017FC Research 10
-100
-50
0
50
100
150
200
250
300
350
Apr-16 May-16 Jun-16 Jul-16 Aug-16 Sep-16 Oct-16 Nov-16 Dec-16 Jan-17 Feb-17 Mar-17 Apr-17
Excess Liquidity CBSL Holdings of Gov. Securities Source: CBSL

May 2017FC Research 11
Week EndingBills
('Mn)
Bonds
('Mn)Total
07-Apr-17 25,000 11,480 36,480
12-Apr-17 23,092 23,092
21-Apr-17 21,413 21,413
28-Apr-17 29,500 25,000 54,500
Total Issued 135,485
Apr 2017 YTD
Maturities 126,872 643,332
New Issues 135,485 499,902
Excess/(Deficit) 8,613 -143,430
CBSL Holdings of Gov. Securities YTD
As at End Mar 2017 263,197
As at End Apr 2017 273,544
Increase/ (Decrease) 10,347 -56,534

Interest Rate Change (bps)
Tenure 31-Mar 30-Apr Change (bps) 31-Mar Change (bps)
3M 9.68% 9.73% 5 9.68% 5
6M 10.68% 10.30% -38 10.68% -38
1 Yr 11.03% 10.58% -45 11.03% -45
2 Yrs 11.58% 11.00% -58 11.58% -58
3 Yrs 11.95% 11.45% -50 11.95% -50
4 Yrs 12.55% 11.70% -85 12.55% -85
5 Yrs 12.75% 11.75% -100 12.75% -100
6 Yrs 12.80% 11.80% -100 12.80% -100
8 Yrs 12.80% 12.00% -80 12.80% -80
10 Yrs 12.83% 12.05% -78 12.83% -78
15 Yrs 12.95% 12.38% -57 12.95% -57
20 Yrs 13.18% 12.63% -55 13.18% -55
30 Yrs 13.25% 12.63% -62 13.25% -62
May 2017FC Research 12
Sudden increase in the market liquidity towards the last two weeks the month and renewed
foreign and local buying interest resulted in yields dipping by 50-100bps specifically in the 2 year
to 15 year bonds. The increasing activity during latter part of the month saw an overall net foreign
inflow of LKR 7.25Bn April 2017.
9.00%
10.00%
11.00%
12.00%
13.00%
14.00%
31-Mar 30-Apr Source: CBSL

AWPR vs AWDR Interest Spread
May 2017FC Research 13
Source: CBSLSource: CBSL
Source: CBSL
5.0%
6.0%
7.0%
8.0%
9.0%
10.0%
11.0%
12.0%
13.0%
AWPR AWDR
0.0%
0.5%
1.0%
1.5%
2.0%
2.5%
3.0%
3.5%
4.0%
4.5%
5.0%

May 2017FC Research 14
Exports decline by 3.8%YoY during Jan 2017 reflecting subdued performance mainly in
earning from industrial exports declined by 6.7%YoY, from textiles and garments, rubber
products and gems, diamonds and jewelry.
Exports
Category 2016
(USD ‘Mn)
2017
(USD ‘Mn)
Change
(%)
Industrial Exports
- Jan
- YTD
716.2
716.2
668.0
668.0
(6.7)
(6.7)
Agricultural
- Jan
- YTD
179.5
179.5
193.7
193.7
7.9
7.9
Mineral and other
- Dec
- YTD
2.9
2.9
3.0
3.0
3.7
3.7
Total
- Dec
- YTD
898.6
898.6
864.7
864.7
(3.8)
(3.8)
89
9
88
8
94
5
70
7
77
6
89
7
89
1
86
6
89
8
85
5
81
0
85
9
86
5
600
650
700
750
800
850
900
950
1,000
USD 'Mn
2016 2017Source: CBSL

Imports
May 2017FC Research 15
Import expenses grew by 13.2% during Jan 2017 Dec 2016 despite 2.6% decline in an
investment goods. The expenditure on intermediate and Consumer goods was driven
mainly by expenditure on refined petroleum, sugar and confectionary, dairy products and
seafood.
Category 2016
(USD ‘Mn)
2017
(USD ‘Mn)
Change
(%)
Consumer goods
- Jan
- YTD
343.5
343.5
358.8
358.8
4.4
4.4
Intermediate
- Jan
- YTD
801.2
801.2
950.1
950.1
18.6
18.6
Investment goods
- Jan
- YTD
443.9
443.9
432.2
432.2
(2.6)
(2.6)
Total
- Jan
- YTD
1,589.1
1,589.1
1,798.4
1,798.4
13.2
13.2
1,5
89
1,4
39
1,5
66
1,4
61
1,5
90 1
,67
6
1,4
33
1,6
49
1,5
43
1,9
06
1,7
32 1
,81
6
1,7
98
1,200
1,300
1,400
1,500
1,600
1,700
1,800
1,900
2,000
2016 2017Source: CBSL

May 2017FC Research 16
-725
-733
-791
-630
-824
-695
-552
-621
-754
-814
-779
-542
-783
-645
-1,051
-922
-957
-934
-1,200 -1,000 -800 -600 -400 -200 0
Balance of Trade
Source: Central Bank

Nov
Trade Balance -13.2%
May 2017FC Research 17
January
USD ‘Mn
2016 2017 Change
(%)
Trade Balance -690.5 -933.7 +35.2%
Earnings from
Tourism333.3 376.7
+12.9%
Workers’
Remittances563.4 571.6
+1.4%
YTD
USD ‘Mn
2016 2017 Change
(%)
Trade Balance -690.5 -933.7 +35.2%
Earnings from
Tourism333.3 376.7
+12.9%
Workers’
Remittances563.4 571.6
+1.4%
Balance of Payments remains negative
Tourism Earnings and Worker Remittances together reach USD
10.7Bn (+8.0%)
-619
-212
-700
-600
-500
-400
-300
-200
-100
0
Jan-16 Jan-17
-691
-934
333 376
563 572
-1,500
-1,000
-500
0
500
1,000
1,500
Jan-16 Jan-17
Trade Balance Earnings from Tourism Workers’ Remittances
US
D '
Bn
UP 17.5% UP 6.1%
May 2017FC Research 18
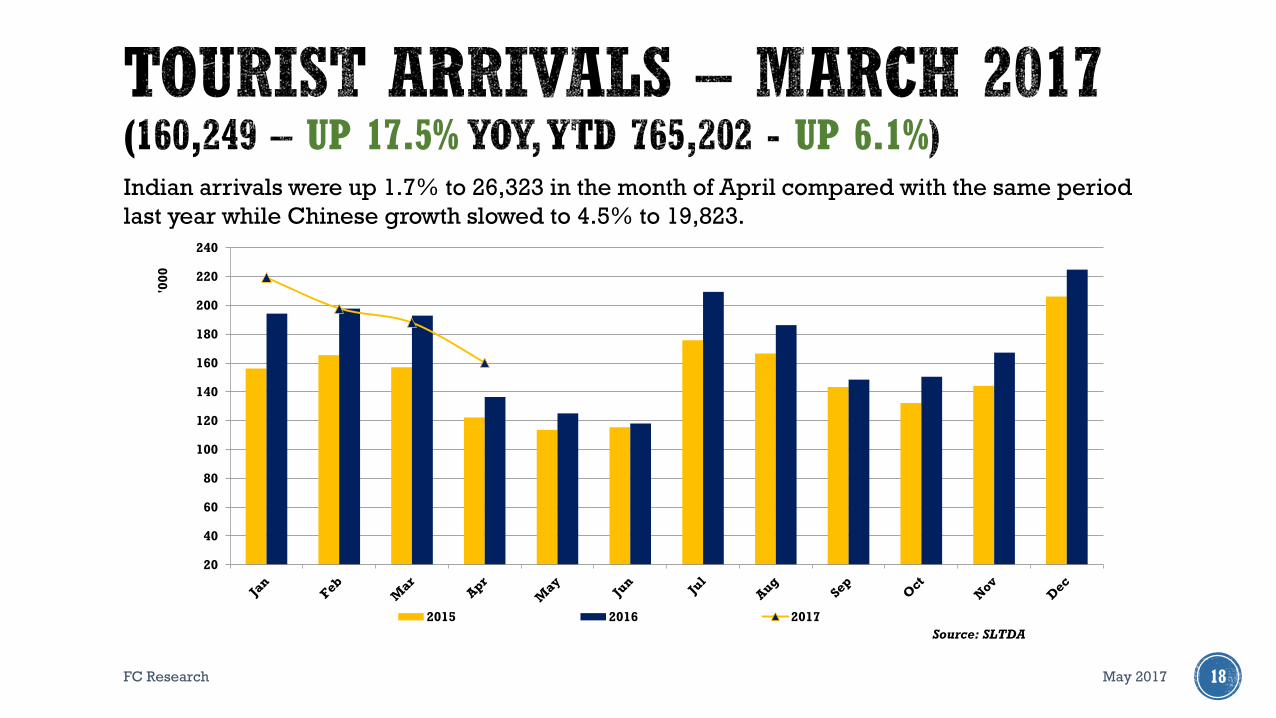
Indian arrivals were up 1.7% to 26,323 in the month of April compared with the same period
last year while Chinese growth slowed to 4.5% to 19,823.
20
40
60
80
100
120
140
160
180
200
220
240
'00
0
2015 2016 2017
Source: SLTDA

FC Research 19
China March Industry Profits Narrowed On Higher Input
Prices: The profitability of Chinese industrial companies rose
more slowly in March compared to earlier in the year because of a
rapid rise in input prices and a higher basis for comparison, data
from the National Bureau of Statistics (NBS) released.
https://www.marketnews.com
Japan Exports Post 4th Straight Rise in Mar, Down in FY2016:
Japan's March exports +12.0% on year (the MNI median
economist forecast: +6.6%), the fourth straight rise after +11.3%
in February, led by higher shipments of auto parts, optical
equipment and steel on a gradual pickup in global demand
http://www.marketnews.com
Euro zone money markets see more chance of ECB hike in
early 2018 after French vote: Euro zone money markets on
Monday priced in a higher chance of a rise in European Central
Bank interest rates after Emmanual Macron won the first round of
the French presidential election.
http://www.reuters.comSource: Bloomberg
May 2017
-2.50% -1.50% -0.50% 0.50% 1.50% 2.50%
FTSE 100
VN Index
S&P 500
Dow Jones
Nifty
Nikkei 225
Euro Stoxx 50
KSE100

FC Research 20
This Review is prepared and issued by First Capital Holdings PLC. based on information in the public domain, internallydeveloped and other sources, believed to be correct. Although all reasonable care has been taken to ensure the contents ofthe review are accurate, First Capital Holdings PLC and/or its Directors, employees, are not responsible for the correctness,usefulness, reliability of same. First Capital Holdings PLC may act as a Broker in the investments which are the subject of thisdocument or related investments and may have acted on or used the information contained in this document, or the researchor analysis on which it is based, before its publication. First Capital Holdings PLC and/or its principal, theirrespective Directors, or Employees may also have a position or be otherwise interested in the investments referred to in thisdocument. This is not an offer to sell or buy the investments referred to in this document. This Review may contain data whichare inaccurate and unreliable. You hereby waive irrevocably any rights or remedies in law or equity you have or may haveagainst First Capital Holdings PLC with respect to the Review and agree to indemnify and hold First Capital Holdings PLCand/or its principal, their respective directors and employees harmless to the fullest extent allowed by law regarding allmatters related to your use of this Review. No part of this document may be reproduced, distributed or published in whole orin part by any means to any other person for any purpose without prior permission.
May 2017

CONTACT
FC Research +94 11 2639 898
• Amanda Lokugamage +94 11 2639 868
• Michelle Weerasinghe +94 11 2639 866
• Dimantha Mathew +94 11 2639 853
• Atchuthan Srirangan +94 11 2639 863
• Hansinee Beddage +94 11 2639 864
21


