Dealing with Seismic Interference in a busy North Sea Season by Per Eivind Dhelie, David Harrison-Fox (PGS) Espen Prytz Erlandsen, Muhammad Faheem Abbasi (Statoil) FORCE Geophysical Methods network Seminar: “How to reduce time sharing” 20. September 2012 – Stavanger, Norway www.force.org
Transcript
Dealing with
Seismic Interference
in a busy North Sea Season
by
Per Eivind Dhelie, David Harrison-Fox (PGS)
Espen Prytz Erlandsen, Muhammad Faheem Abbasi (Statoil)
FORCE Geophysical Methods network
Seminar: “How to reduce time sharing”
20. September 2012 – Stavanger, Norway
www.force.org
Outline
• Introduction – How large is the SI challenge in the North Sea?
• Method for removal of seismic interference
• Case study of SI
• Conclusions & recommendations
Outline
• Introduction – How large is the SI challenge in the North Sea?
• Method for removal of seismic interference
• Case study of SI
• Conclusions & recommendations
Active seismic vessels in the North Sea - 2011
= Radius of 40km
= Radius of 70km
With more than 20 seismic vessels operating in
the North Sea during the summer of 2011, a lot
of lost time is incurred whilst time-sharing
Source: NPD
May 2011 June 2011 July 2011
Active seismic vessels in the North Sea - 2012
May 2012 June 2012 July 2012
= Radius of 40km
= Radius of 70km
With more than 20 seismic vessels operating in
the North Sea during the summer of 2012, a lot
of lost time is incurred whilst time-sharing
Source: NPD
Outline
• Introduction – How large is the SI challenge in the North Sea?
• Method for removal of seismic interference
• Case study of SI
• Conclusions & recommendations
Method for removing seismic interference
• Current best practice for SI removal in production processing:
– Pre-conditioning of shots (removal of random/swell noise)
– Forward Tau-P transform on shots (CPU intensive)
– Sort to common P (slowness) / FFID (shot) ensembles
– Time and frequency dependent anomalous noise attenuation - using
windowed anomalous amplitude detection followed by iterative F-X
prediction to reconstruct coherent signal (SWOOP) (parameter testing)
– Subtraction of filtered data from Tau-P input (isolate noise)
– Sort back to Tau-P domain FFID gathers
– Inverse Tau-P transform to give TX model of SI-noise (CPU Intensive)
– Adaptive subtraction of SI-noise model from TX input data (parameter
testing)
• For On-Board Processing line evaluation, SWOOP in common P
traces followed by inverse Tau-P transform of results is proposed to
save time (obtain 95% results)
“Tau-P common-P” SI removal flow
Shearwater line 18651135
T-X shot gathers Tau-P shot gathers
Transform using
linear Radon and set
a flag at the end of
every shot cable
pair
Sort data on
SEQNO and shot
cable pair
Tau-P common-P ensembles
“Tau-P common-P” SI removal flow
Shearwater line 18651135
Puffin line 1988008
T-X shot gathers Tau-P shot gathers
Sort data on
SEQNO and shot
cable pair
Swoop
Generate difference
Tau-P common-P ensembles
Transform using
linear Radon and set
a flag at the end of
every shot cable
pair
“Tau-P common-P” SI removal flow
Shearwater line 18651135
Puffin line 1988008
T-X shot gathers Tau-P shot gathers
Sort data on
SEQNO and shot
cable pair
Swoop
back to the T-X
domain
QC displays Generate difference
back to the T-X
domain
Noise Model
Tau-P common-P ensembles
Transform using
linear Radon and set
a flag at the end of
every shot cable
pair
“Tau-P common-P” SI removal flow
Shearwater line 18651135
Puffin line 1988008
T-X shot gathers Tau-P shot gathers
Sort data on
SEQNO and shot
cable pair
Swoop
back to the T-X
domain
QC displays Generate difference
back to the T-X
domain
Adaptive
subtraction
from original
input data
Noise Model
(avoids
transforming
the real data)
Tau-P common-P ensembles
Transform using
linear Radon and set
a flag at the end of
every shot cable
pair
Modeling cases – No SI
150m water depth 300m water depth 500m water depth
L1 L1
L1
L2 L2
L2
L3
L3
L3
L1= 1km @ 1800m/s
L2= 1km @ 2200m/s
L3= >1km @ 2400m/s
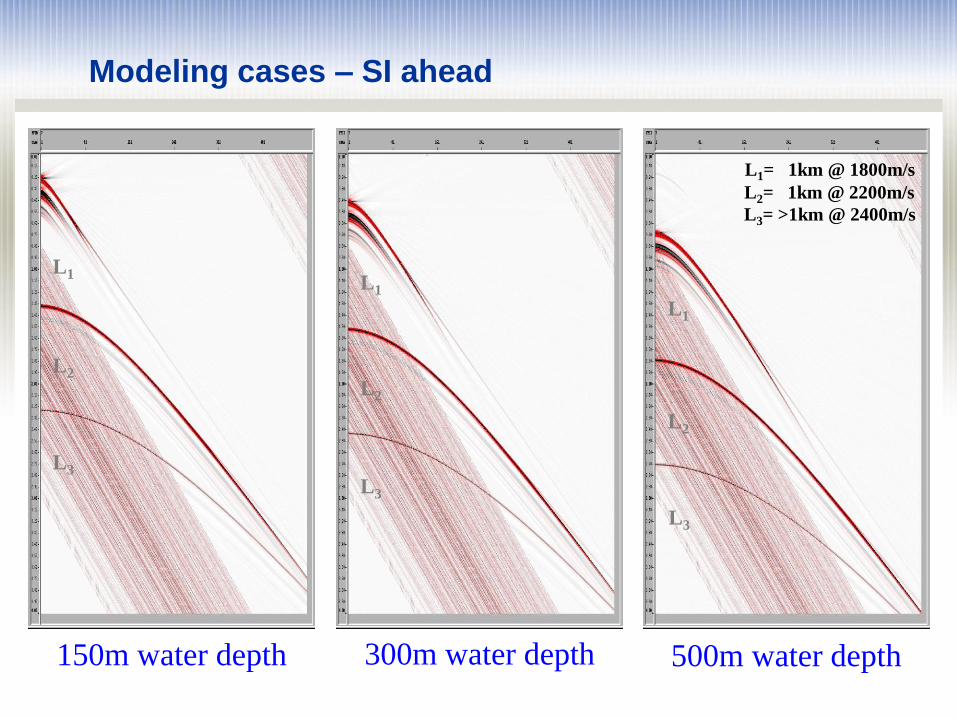
Modeling cases – SI ahead
150m water depth 300m water depth 500m water depth
L1 L1
L1
L2 L2
L2
L3
L3
L3
L1= 1km @ 1800m/s
L2= 1km @ 2200m/s
L3= >1km @ 2400m/s
Modeling cases – SI abeam
150m water depth 300m water depth 500m water depth
L1 L1
L1
L2 L2
L2
L3
L3
L3
L1= 1km @ 1800m/s
L2= 1km @ 2200m/s
L3= >1km @ 2400m/s
Modeling cases – SI astern
150m water depth 300m water depth 500m water depth
L1 L1
L1
L2 L2
L2
L3
L3
L3
L1= 1km @ 1800m/s
L2= 1km @ 2200m/s
L3= >1km @ 2400m/s
Modeling cases – Shots in tau-p domain – no SI
L1
L2
L3
L1
L2
L3
L1
L2
L3
150m water depth 300m water depth 500m water depth Linear tau-p transform – modeling 4501 p traces (slowness) at reference offset of 6100m.
Modeling range is -4500 to +4500ms (equivalent to +/- 1350m/s). Modeling 0-250Hz at 2ms
1 4501 p-traces 1 4501 p-traces 1 4501 p-traces
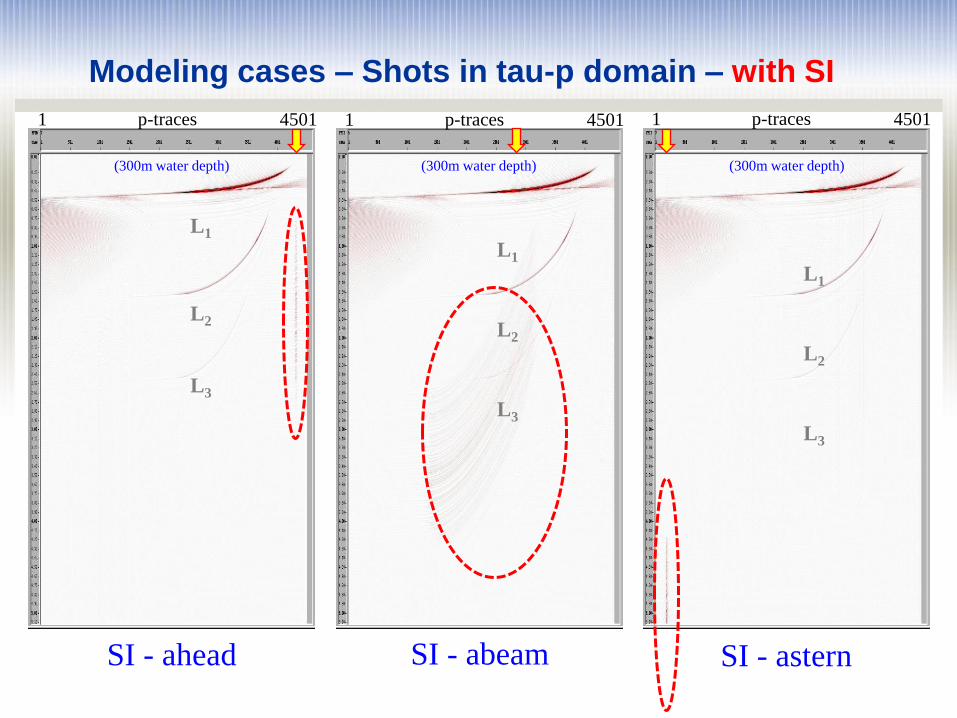
Modeling cases – Shots in tau-p domain – with SI
SI - ahead SI - abeam SI - astern
L1
L2
L3
L1
L2
L3
L1
L2
L3
(300m water depth) (300m water depth) (300m water depth)
1 4501 p-traces 1 4501 p-traces 1 4501 p-traces
SI aliasing @ 1480m/s – at 60Hz with 12.5m groups
Aliased SI – 12.5m group spacing Interpolate – 6.25m group spacing
Spatial anti-alias filter Drop traces – back to 12.5m spacing SI aliasing is dependent on the apparent velocity of the SI hitting the receivers. 1480 is the worst case – astern or
ahead. SI coming from abeam will have much higher apparent velocity and no aliasing problem
Modeling cases – Shots in tau-p domain – with SI
SI - ahead SI - abeam SI - astern
L1
L2
L3
L1
L2
L3
L1
L2
L3
(300m water depth) (300m water depth) (300m water depth)
1 4501 p-traces 1 4501 p-traces 1 4501 p-traces
“Common p-plots” – with SI
SI - ahead SI - abeam SI - astern NOTE: Showing only 3 p-traces (4315, 2800 & 193) out of a total of 4501
4315 p-trace 2800 193
The SI noise becomes
random in this
domain
“Common p-plots” – after SI removal
SI - ahead SI - abeam SI - astern NOTE: Showing only 3 p-traces (4315, 2800 & 193) out of a total of 4501
4315 p-trace 2800 193
“Common p-plots” – difference before/after SI removal
SI - ahead SI - abeam SI - astern NOTE: Showing only 3 p-traces (4315, 2800 & 193) out of a total of 4501
4315 p-trace 2800 193
10 shots with SI – ahead – abeam & astern S
I-ah
ead
S
I-ab
eam
S
I-ast
ern
10 shots after SI removal – ahead – abeam & astern S
I-ah
ead
S
I-ab
eam
S
I-ast
ern
Real data – MC3D 2012 – 0-125 Hz Before SI removal
Real data – MC3D 2012 – 0-125 Hz After SI removal
Before SI removal
0-125Hz 0-15Hz 15-40Hz 40-125Hz
After SI removal
0-125Hz 0-15Hz 15-40Hz 40-125Hz
Outline
• Introduction – How large is the SI challenge in the North Sea?
• Method for removal of seismic interference
• Case study of SI
• Conclusions & recommendations
A real field trial of Seismic Interference
1. Pre-study – Demonstrate the SI removal toolbox – and define a
plan and procedure including a set processing flow for on-board-
processing to evaluate and eliminate SI
2. Field trial – Shoot one single full sail line of data with and without
SI and prove you can remove the SI to an acceptable limit – is
there a limit – and what is that limit – microbars/distance/direction
– define the SI acceptance criteria for the rest of the survey
3. Shoot two large commercial seismic surveys “on top of each other”
using the new acceptability criteria and on-board processing SI
removal flows – whilst minimizing the need for time-sharing
Shoot more – wait less – save money
The field trial – location – North Sea
PL360 Lupin West and MC3D-SVG2011
Atlantic Explorer
Ramform Vanguard
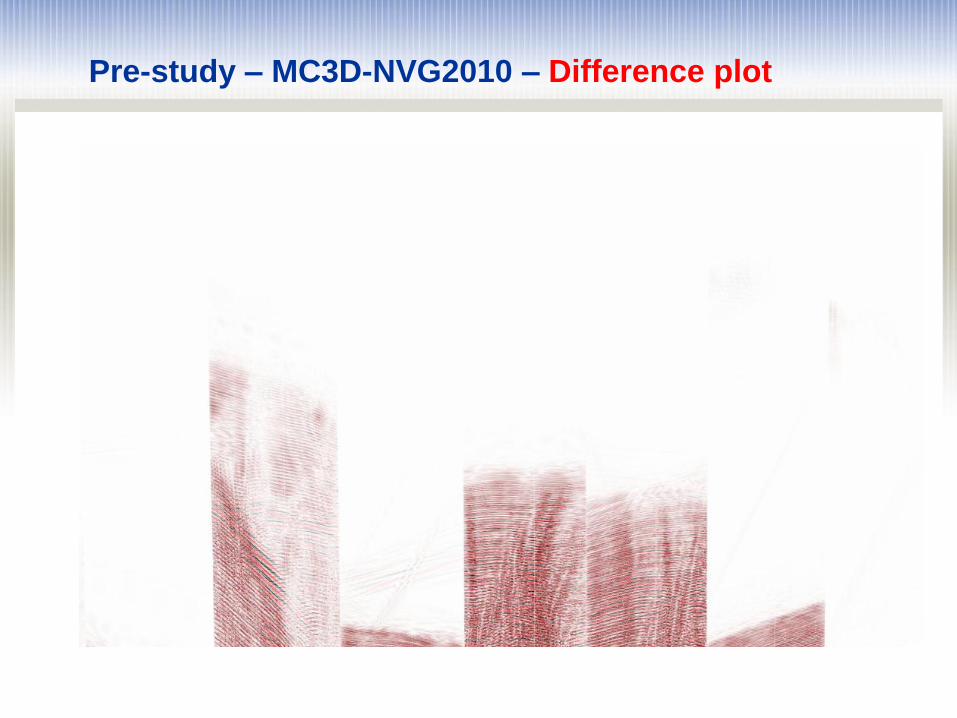
Pre-study – MC3D-NVG2010 – Input data
Pre-study – MC3D-NVG2010 – Output data
Pre-study – MC3D-NVG2010 – Difference plot
Pre-study – MC3D-NVG2010 – Input data
Pre-study – MC3D-NVG2010 – Output data
Pre-study – MC3D-NVG2010 – Difference plot
A real field trial of Seismic Interference
1. Pre-study – Demonstrate the SI removal toolbox – and define a
plan and procedure including a set processing flow for on-board-
processing to evaluate and eliminate SI
2. Field trial – Shoot one single full sail line of data with and without
SI and prove you can remove the SI to an acceptable limit – is
there a limit – and what is that limit – microbars/distance/direction
– define the SI acceptance criteria for the rest of the survey
3. Shoot two large commercial seismic surveys “on top of each other”
using the new acceptability criteria and on-board processing SI
removal flows – whilst minimizing the need for time-sharing
Shoot more – wait less – save money
Distances 50, 40 and 32 km
32 km
50 km
40 km
50km min distance:
Time-share, maybe
not 100%, but close
40km min distance.
Limited amount of
time-sharing, if good
forward planning is
in place to optimize
each line between
the 2 vessels.
32km min distance:
Both vessels could
more or less shoot
unaffected by each
other.
Field trial – attribute plots
Full offset stack – pick horizon
Near offset stack – RMS / SI
Far offset stack – RMS / SI
Deep window RMS bef/aft
Mid frequency amp bef/aft Deep window RMS bef/aft
X-plot near vs. far after SI
X-plot near vs. far before SI
Near RMS in/out & ratio
Far RMS in/out & ratio
Ratio of ratio RMS in/out Distance & azimuth
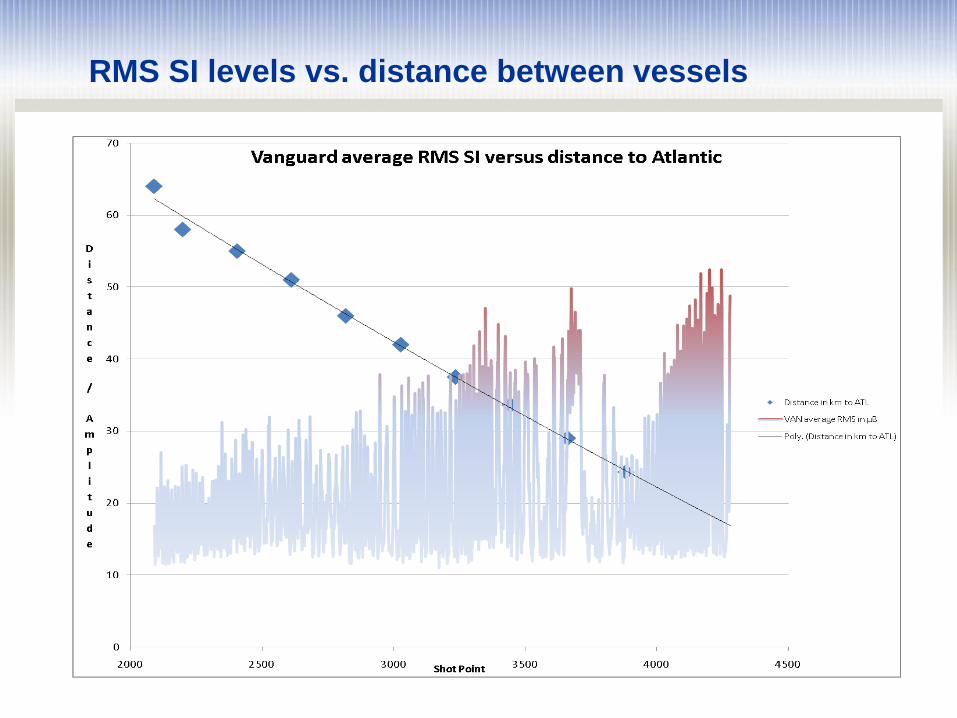
RMS SI levels vs. distance between vessels
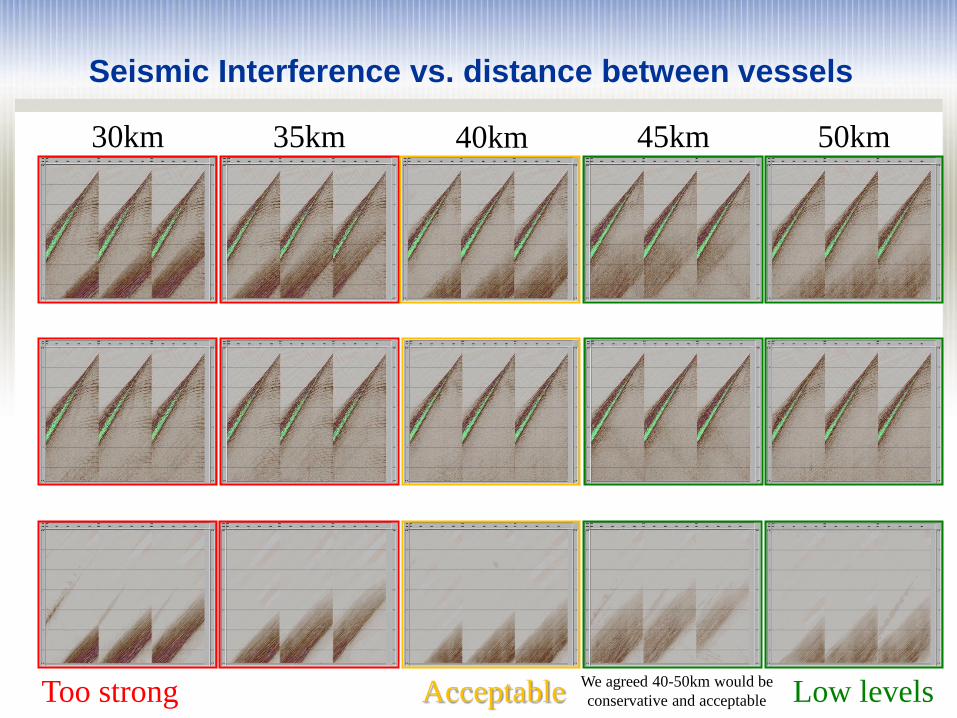
Seismic Interference vs. distance between vessels
30km 35km 40km 45km 50km
Too strong Acceptable Low levels We agreed 40-50km would be
conservative and acceptable
A real field trial of Seismic Interference
1. Pre-study – Demonstrate the SI removal toolbox – and define a
plan and procedure including a set processing flow for on-board-
processing to evaluate and eliminate SI
2. Field trial – Shoot one single full sail line of data with and without
SI and prove you can remove the SI to an acceptable limit – is
there a limit – and what is that limit – microbars/distance/direction
– define the SI acceptance criteria for the rest of the survey
3. Shoot two large commercial seismic surveys “on top of each other”
using the new acceptability criteria and on-board processing SI
removal flows – whilst minimizing the need for time-sharing
Shoot more – wait less – save money
Shooting two surveys with min. distance ~20km
PL360 Lupin West and MC3D-SVG2011
Atlantic Explorer
Ramform Vanguard
Video of how the two vessels optimized production
This is a 2min video: Click on the picture to start the video.
Outline
• Introduction – How large is the SI challenge in the North Sea?
• Method for removal of seismic interference
• Case study of SI
• Conclusions & recommendations
Conclusions & recommendations (1 of 3)
• The “Tau-P common-P” SI removal technique has been demonstrated
to work very efficiently
• The method uses no a-priori information and can handle SI from
several vessels at the same time
• There are some pitfalls in the flow (aliasing/wraparound/swell noise) –
that must be avoided – and good QC is essential
• The method is capable of removing very large amounts of SI – but will
reach a point when we can no longer recover the underlying signal
• From the case study we are able to demonstrate that the SI and SI
removal has no discernible effect on attributes of the data, such as
near vs. far – high vs. low frequency etc.
• From the case study we found that direction had little impact on the SI
removal – as expected from the modeling (limited exposure)
• We also found that distance and microbars is an effective measure for
planning and steering the seismic operations to minimize the impact of
SI and time-sharing
Conclusions & recommendations (2 of 3)
• A pre-study in close collaboration with the clients is highly
recommended. This will sharpen all pencils.
• Random swell noise removal is a pre-requisite for the tau-p common p
flow to work. High amplitude low frequency bursts will smear in the
tau-p domain and cause artifacts and wraparound effects.
• You are able to remove quite large amounts of SI without degrading
the overall quality of your seismic data.
• Timing is crucial for line acceptance – therefore you need pre-defined
workflows and highly skilled OBP staff to run them and also to
generate material that can be used to make the final call. Consider
having extra on-shore staff to assist the OBP teams during the SI QC
process.
Conclusions & recommendations (3 of 3)
• This SI project was a success:
– Two surveys acquired almost simultaneously in close proximity
– SI removal and OBP line acceptance kept up with production
– Reduced distance between vessels from ~70km down to ~40km (40μbar)
– 5 weeks simultaneous acquisition incurred only 8 hours of SI standby time
– Saved 3-4 days production time for both vessels
– Experience from production processing of PL360 was that there were
challenges especially with swell and SI. Both were handled successfully and
data result is of very good quality. Removal of swell noise was very
important for removal of SI
– Method will be used for further surveys where SI may be a challenge
Acknowledgment
• FORCE group for inviting me to present the work
• Statoil and PGS for permission to publish this work
• My co-authors for all their valuable help and input
• Liw and Taha onboard the vessels for testing all the SI removal flows
• Terje for his vessel monitoring
• Magnus for the SI modeling work
• A lot of hard working people in Data Processing for coming up with
new “cool” tools to effectively remove Seismic Interference


![Record of Amendments and Corrigenda Use of... · Web viewFUA Manual Template FUA Manual Template Preamble ... CAA/ANSP/DGCA/AIR FORCE/NAVY/ARMY/…etc.,] It is aimed at providing](https://static.documents.pub/doc/80x56/5b4bf72a7f8b9aa82c8d1c01/record-of-amendments-and-use-of-web-viewfua-manual-template-fua-manual-template.jpg)

