Industrials M&A Report Q2 2016 HYDE PARK CAPITAL Member FINRA/SIPC Investment Banking | Mergers & Acquisitions | Capital Raising Hyde Park Capital Advisors, LLC 701 N. Franklin Street Tampa, FL 33602 Tel: 813-383-0202 www.hydeparkcapital.com John Hill Senior Managing Director [email protected](813) 383-0205 John McDonald Senior Managing Director [email protected](813) 383-0206 Keith Hodgdon Managing Director [email protected](813) 383-0208 Greg Bosl Vice President [email protected](813) 597-2649 Jami Gold Vice President [email protected](813) 383-0203 Jeffrey Hendricks Vice President [email protected](678) 523-3073 Kenneth Burnside Business Development Officer [email protected](864) 905-9633
Transcript
Industrials M&A Report
Q2 2016
HYDE PARK CAPITAL
Member FINRA/SIPC
Investment Banking | Mergers & Acquisitions | Capital Raising
Hyde Park Capital Advisors, LLC 701 N. Franklin Street
05/11/16 SiteOne Landscape Supply, Inc. Materials IPO $210
06/09/16 Atkore International Group, Inc. Electrical Equipment IPO $192
05/25/16 GMS, Inc. Industrial Services IPO $147
80%
90%
100%
110%
Jun-15 Sep-15 Dec-15 Mar-16 Jun-16
S&P 500 S&P Global Industrials Sector Index Nasdaq
Capital Markets Overview
2
Public Market Performance (LTM)
Select Public Offerings – Industrials (Q2 2016)
Public Company Market Performance by Sector
Source: S&P Capital IQ
The S&P Global Industrials Sector Index rose 2.2% over the last 12 month period ended June 30, 2016, while the Nasdaq declined 3.4% and the S&P 500 increased 1.0%.
IPO activity in the Industrials industry improved in Q2 2016 after
none were completed during Q1 2016. Reliance Worldwide Corp. (ASX: RWC), which provides water control and plumbing solutions, raised $700 million in the largest IPO during the quarter.
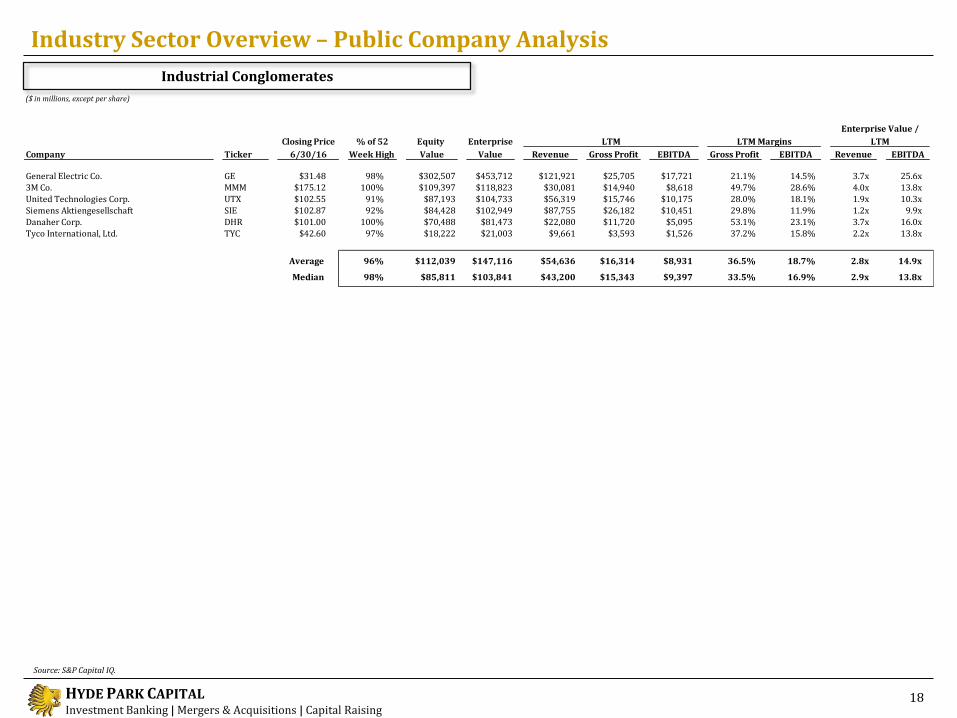
The Industrial Conglomerates and Electrical Equipment sectors were the industry’s leaders with respect to valuation during Q2 2016, trading at EBITDA multiples of 13.7x and 12.1x, respectively.
Commentary
2.2%
($ in millions)
3.4%
1.0%
HYDE PARK CAPITAL Investment Banking | Mergers & Acquisitions | Capital Raising
Deal Size Volume Value Volume Value Volume Value
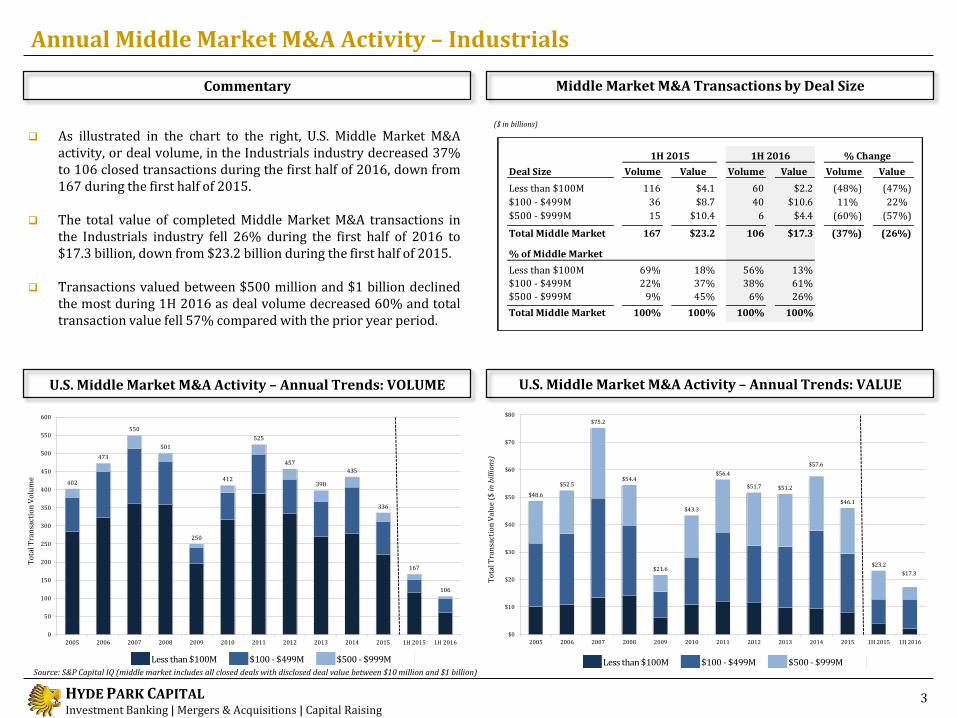
Less than $100M 116 $4.1 60 $2.2 (48%) (47%)
$100 - $499M 36 $8.7 40 $10.6 11% 22%
$500 - $999M 15 $10.4 6 $4.4 (60%) (57%)
Total Middle Market 167 $23.2 106 $17.3 (37%) (26%)
U.S. Middle Market M&A Activity – Annual Trends: VOLUME U.S. Middle Market M&A Activity – Annual Trends: VALUE
To
tal T
ran
sact
ion
Vo
lum
e
To
tal T
ran
sact
ion
Val
ue
($ i
n b
illi
ons)
Annual Middle Market M&A Activity – Industrials
3
As illustrated in the chart to the right, U.S. Middle Market M&A activity, or deal volume, in the Industrials industry decreased 37% to 106 closed transactions during the first half of 2016, down from 167 during the first half of 2015.
The total value of completed Middle Market M&A transactions in the Industrials industry fell 26% during the first half of 2016 to $17.3 billion, down from $23.2 billion during the first half of 2015.
Transactions valued between $500 million and $1 billion declined the most during 1H 2016 as deal volume decreased 60% and total transaction value fell 57% compared with the prior year period.
Commentary
Source: S&P Capital IQ (middle market includes all closed deals with disclosed deal value between $10 million and $1 billion)
($ in billions)
Less than $100M $100 - $499M $500 - $999M Less than $100M $100 - $499M $500 - $999M
U.S. Middle Market M&A Activity – Quarterly Trends: VALUE U.S. Middle Market M&A Activity – Quarterly Trends: VOLUME
Middle Market M&A Transactions by Deal Size
($ in billions)
To
tal T
ran
sact
ion
Vo
lum
e
To
tal T
ran
sact
ion
Val
ue
($ i
n b
illi
ons)
4
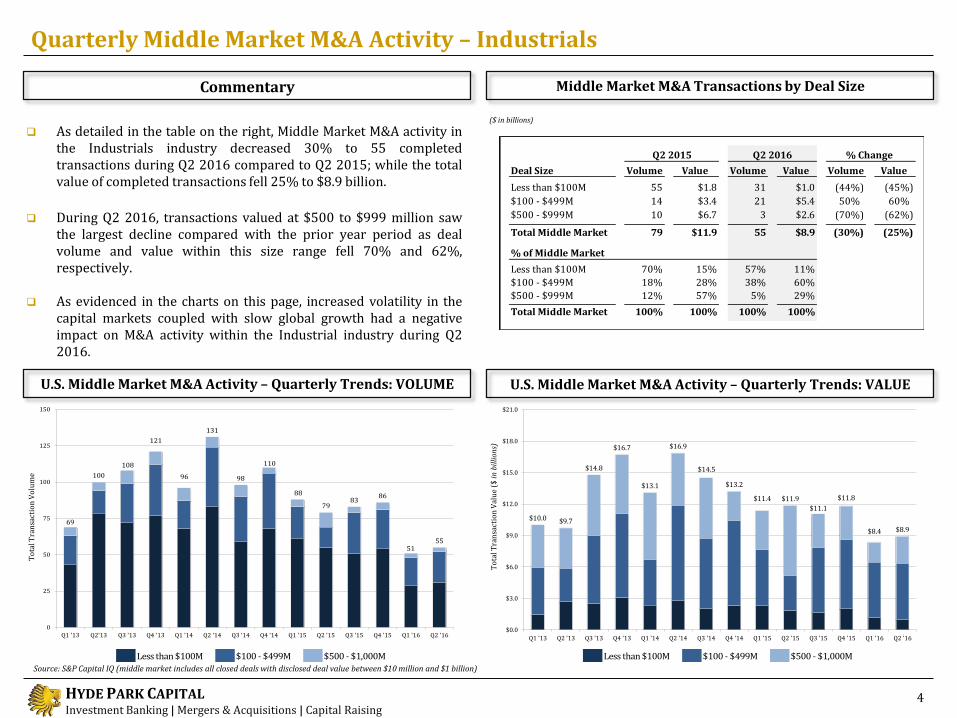
As detailed in the table on the right, Middle Market M&A activity in the Industrials industry decreased 30% to 55 completed transactions during Q2 2016 compared to Q2 2015; while the total value of completed transactions fell 25% to $8.9 billion.
During Q2 2016, transactions valued at $500 to $999 million saw
the largest decline compared with the prior year period as deal volume and value within this size range fell 70% and 62%, respectively.
As evidenced in the charts on this page, increased volatility in the
capital markets coupled with slow global growth had a negative impact on M&A activity within the Industrial industry during Q2 2016.
Commentary
Source: S&P Capital IQ (middle market includes all closed deals with disclosed deal value between $10 million and $1 billion)
Less than $100M $100 - $499M $500 - $1,000MLess than $100M $100 - $499M $500 - $1,000M
HYDE PARK CAPITAL Investment Banking | Mergers & Acquisitions | Capital Raising
Recent M&A Activity – Industrials
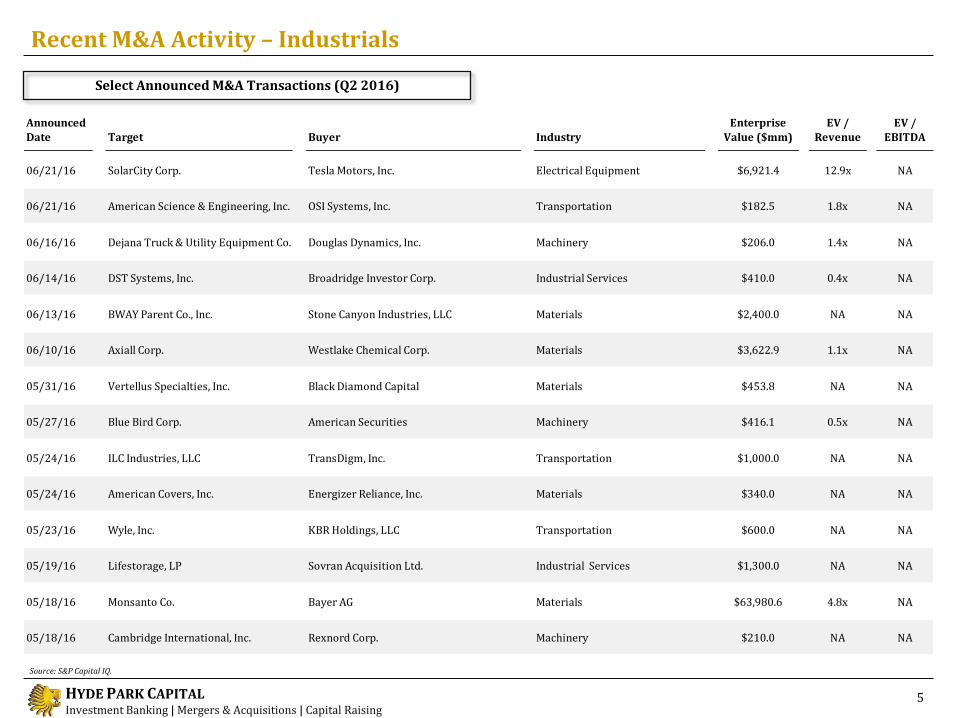
Select Announced M&A Transactions (Q2 2016)
5
Source: S&P Capital IQ.
Announced
Date Target Buyer Industry
Enterprise
Value ($mm)
EV /
Revenue
EV /
EBITDA
06/21/16 SolarCity Corp. Tesla Motors, Inc. Electrical Equipment $6,921.4 12.9x NA
06/21/16 American Science & Engineering, Inc. OSI Systems, Inc. Transportation $182.5 1.8x NA
06/16/16 Dejana Truck & Utility Equipment Co. Douglas Dynamics, Inc. Machinery $206.0 1.4x NA
06/14/16 DST Systems, Inc. Broadridge Investor Corp. Industrial Services $410.0 0.4x NA
06/13/16 BWAY Parent Co., Inc. Stone Canyon Industries, LLC Materials $2,400.0 NA NA
06/10/16 Axiall Corp. Westlake Chemical Corp. Materials $3,622.9 1.1x NA
05/31/16 Vertellus Specialties, Inc. Black Diamond Capital Materials $453.8 NA NA
05/27/16 Blue Bird Corp. American Securities Machinery $416.1 0.5x NA
05/24/16 ILC Industries, LLC TransDigm, Inc. Transportation $1,000.0 NA NA
05/24/16 American Covers, Inc. Energizer Reliance, Inc. Materials $340.0 NA NA
05/23/16 Wyle, Inc. KBR Holdings, LLC Transportation $600.0 NA NA
05/19/16 Lifestorage, LP Sovran Acquisition Ltd. Industrial Services $1,300.0 NA NA
05/18/16 Monsanto Co. Bayer AG Materials $63,980.6 4.8x NA
05/18/16 Cambridge International, Inc. Rexnord Corp. Machinery $210.0 NA NA
HYDE PARK CAPITAL Investment Banking | Mergers & Acquisitions | Capital Raising
Recent M&A Activity – Industrials
Select Announced M&A Transactions (Q2 2016)
6
Source: S&P Capital IQ.
Announced Date Target Buyer Industry
Enterprise Value ($mm)
EV / Revenue
EV / EBITDA
05/17/16 Herndon Aerospace & Defense Co. KLX, Inc. Transportation $210.0 1.6x NA
05/16/16Terex Corp. (material handlingand port solutions business)
Konecranes Plc Machinery $1,332.3 0.9x 11.9x
05/16/16 Armed Forces Services Corp. Magellan Healthcare, Inc. Industrial Services $127.5 0.9x NA
05/13/16 Great Plains Manufacturing, Inc. Kubota U.S.A., Inc. Machinery $430.0 NA NA
05/12/16 The Climate Control Group, Inc. NIBE Energy Systems, Inc. Machinery $364.0 1.3x 14.6x
05/05/16 NRG EV Services, LLC Capricorn Investment Group Electrical Equipment NA NA NA
04/30/16 Emerald Performance Materials, LLC DyStar LP Materials $245.0 NA NA
04/29/16 Power Service, Inc. NOW, Inc. Machinery $90.0 NA NA
04/26/16 Kaydon Corp. Stabilus S.A. Machinery $339.0 2.8x NA
04/25/16 Ball Corp. Ardagh Group S.A. Materials NA NA NA
04/04/16 Heritage Bag Co. Novolex Materials NA NA NA
04/04/16 Virgin America, Inc. Alaska Air Group, Inc. Transportation $2,432.4 1.6x 11.5x
04/01/16 Downhole Technology, LLC Schoeller-Bleckmann Oilfield Equipment AG Machinery $151.5 3.5x NA
HYDE PARK CAPITAL Investment Banking | Mergers & Acquisitions | Capital Raising
20
5
30
22
5
12
62
19
46
17
0
17
0 10 20 30 40 50 60 70
Materials
Transportation
Industrial Services
Machinery
Electrical Equipment
Construction
1H 2015 1H 2016
$3.1
$0.8
$4.3
$3.5
$1.1
$2.5
$6.9
$2.7
$5.3
$2.0
$0.0
$1.6
$0.0 $1.0 $2.0 $3.0 $4.0 $5.0 $6.0 $7.0 $8.0
Materials
Transportation
Industrial Services
Machinery
Electrical Equipment
Construction
1H 2015 1H 2016
M&A Activity by Industrial Sector
% Change
% Change
U.S. Middle Market M&A Activity by Industrial Sector: VALUE
7
Source: S&P Capital IQ (includes all closed deals with disclosed deal value between $10 million and $1 billion). Screen excludes Aerospace and Defenses and Professional Services.
U.S. Middle Market M&A Activity by Industrial Sector: VOLUME
19%
70%
30%
35%
74%
68%
($ in billions)
N/A
29%
56%
58%
73%
N/A
HYDE PARK CAPITAL Investment Banking | Mergers & Acquisitions | Capital Raising
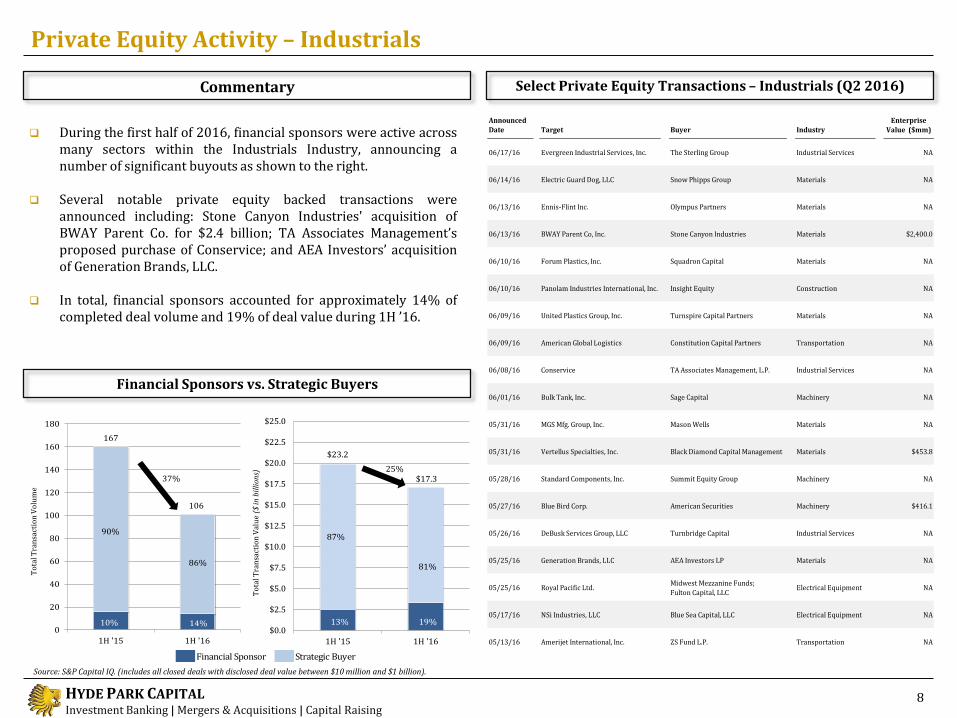
During the first half of 2016, financial sponsors were active across many sectors within the Industrials Industry, announcing a number of significant buyouts as shown to the right.
Several notable private equity backed transactions were
announced including: Stone Canyon Industries' acquisition of BWAY Parent Co. for $2.4 billion; TA Associates Management’s proposed purchase of Conservice; and AEA Investors’ acquisition of Generation Brands, LLC.
In total, financial sponsors accounted for approximately 14% of completed deal volume and 19% of deal value during 1H ’16.
Source: S&P Capital IQ. (includes all closed deals with disclosed deal value between $10 million and $1 billion).
To
tal T
ran
sact
ion
Val
ue
($ in
bil
lion
s)
To
tal T
ran
sact
ion
Vo
lum
e
Financial Sponsor Strategic Buyer
$0.0
$2.5
$5.0
$7.5
$10.0
$12.5
$15.0
$17.5
$20.0
$22.5
$25.0
1H '15 1H '16
$23.2
25%$17.3
81%
13% 19%
87%
167
106
0
20
40
60
80
100
120
140
160
180
1H '15 1H '16
10%
90%
14%
86%
37%
Announced
Date Target Buyer Industry
Enterprise
Value ($mm)
06/17/16 Evergreen Industrial Services, Inc. The Sterling Group Industrial Services NA
06/14/16 Electric Guard Dog, LLC Snow Phipps Group Materials NA
06/13/16 Ennis-Flint Inc. Olympus Partners Materials NA
06/13/16 BWAY Parent Co, Inc. Stone Canyon Industries Materials $2,400.0
06/10/16 Forum Plastics, Inc. Squadron Capital Materials NA
06/10/16 Panolam Industries International, Inc. Insight Equity Construction NA
06/09/16 United Plastics Group, Inc. Turnspire Capital Partners Materials NA
06/09/16 American Global Logistics Constitution Capital Partners Transportation NA
06/08/16 Conservice TA Associates Management, L.P. Industrial Services NA
06/01/16 Bulk Tank, Inc. Sage Capital Machinery NA
05/31/16 MGS Mfg. Group, Inc. Mason Wells Materials NA
05/31/16 Vertellus Specialties, Inc. Black Diamond Capital Management Materials $453.8
05/28/16 Standard Components, Inc. Summit Equity Group Machinery NA
05/27/16 Blue Bird Corp. American Securities Machinery $416.1
05/26/16 DeBusk Services Group, LLC Turnbridge Capital Industrial Services NA
05/25/16 Generation Brands, LLC AEA Investors LP Materials NA
05/25/16 Royal Pacific Ltd.Midwest Mezzanine Funds;
Fulton Capital, LLCElectrical Equipment NA
05/17/16 NSi Industries, LLC Blue Sea Capital, LLC Electrical Equipment NA
05/13/16 Amerijet International, Inc. ZS Fund L.P. Transportation NA
HYDE PARK CAPITAL Investment Banking | Mergers & Acquisitions | Capital Raising
70%
80%
90%
100%
110%
Jun-15 Sep-15 Dec-15 Mar-16 Jun-16
S&P 500 Machinery
70%
80%
90%
100%
110%
Jun-15 Sep-15 Dec-15 Mar-16 Jun-16
S&P 500 Electrical Equipment
80%
90%
100%
110%
120%
Jun-15 Sep-15 Dec-15 Mar-16 Jun-16
S&P 500 Construction
Industry Sector Overview – Recent Stock Price Performance
Electrical Equipment
Commentary
9
Construction
Machinery
Source: S&P Capital IQ
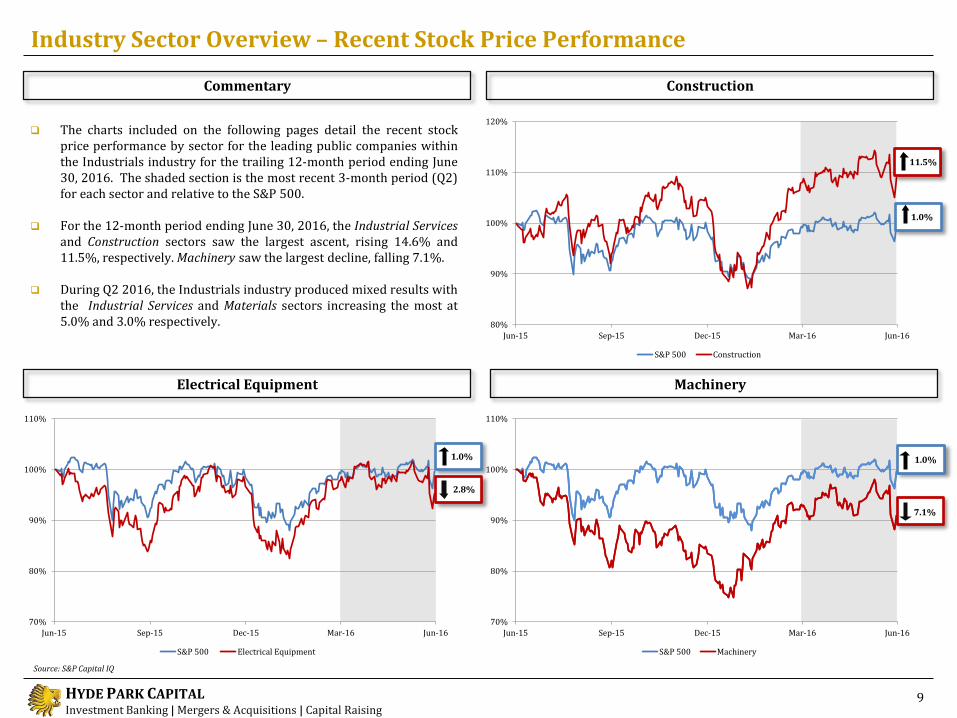
The charts included on the following pages detail the recent stock price performance by sector for the leading public companies within the Industrials industry for the trailing 12-month period ending June 30, 2016. The shaded section is the most recent 3-month period (Q2) for each sector and relative to the S&P 500.
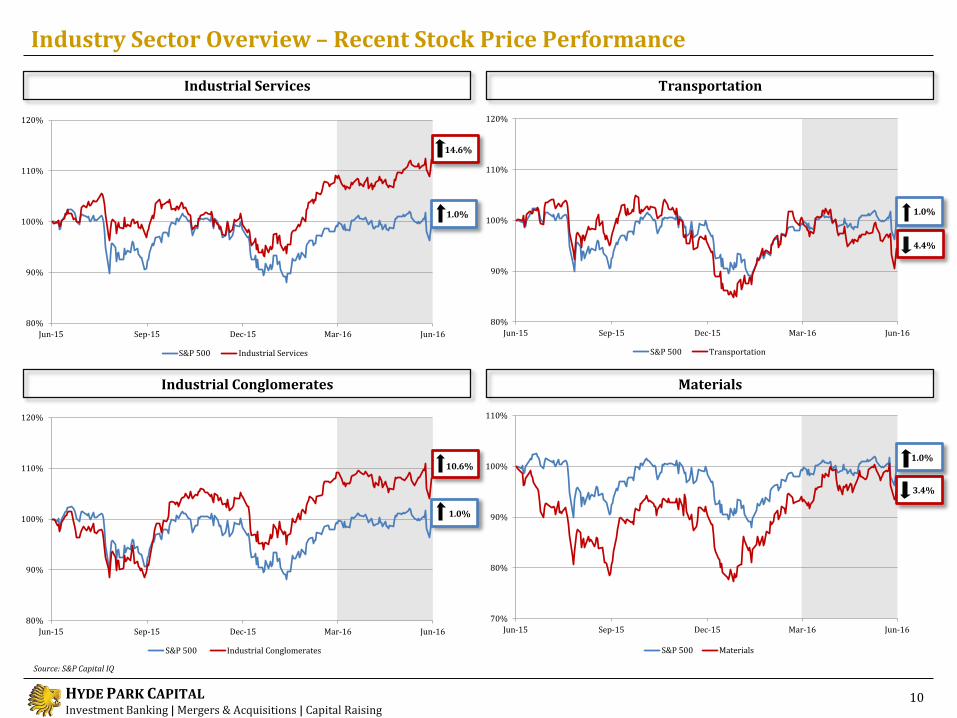
For the 12-month period ending June 30, 2016, the Industrial Services and Construction sectors saw the largest ascent, rising 14.6% and 11.5%, respectively. Machinery saw the largest decline, falling 7.1%.
During Q2 2016, the Industrials industry produced mixed results with the Industrial Services and Materials sectors increasing the most at 5.0% and 3.0% respectively.
11.5%
1.0%
1.0% 1.0%
7.1%
2.8%
HYDE PARK CAPITAL Investment Banking | Mergers & Acquisitions | Capital Raising
80%
90%
100%
110%
120%
Jun-15 Sep-15 Dec-15 Mar-16 Jun-16
S&P 500 Transportation
80%
90%
100%
110%
120%
Jun-15 Sep-15 Dec-15 Mar-16 Jun-16
S&P 500 Industrial Conglomerates
70%
80%
90%
100%
110%
Jun-15 Sep-15 Dec-15 Mar-16 Jun-16
S&P 500 Materials
80%
90%
100%
110%
120%
Jun-15 Sep-15 Dec-15 Mar-16 Jun-16
S&P 500 Industrial Services
Industry Sector Overview – Recent Stock Price Performance
Industrial Conglomerates
Industrial Services
10
Transportation
Source: S&P Capital IQ
Materials
4.4%
10.6%
1.0%
1.0%
3.4%
14.6%
1.0%
1.0%
HYDE PARK CAPITAL Investment Banking | Mergers & Acquisitions | Capital Raising
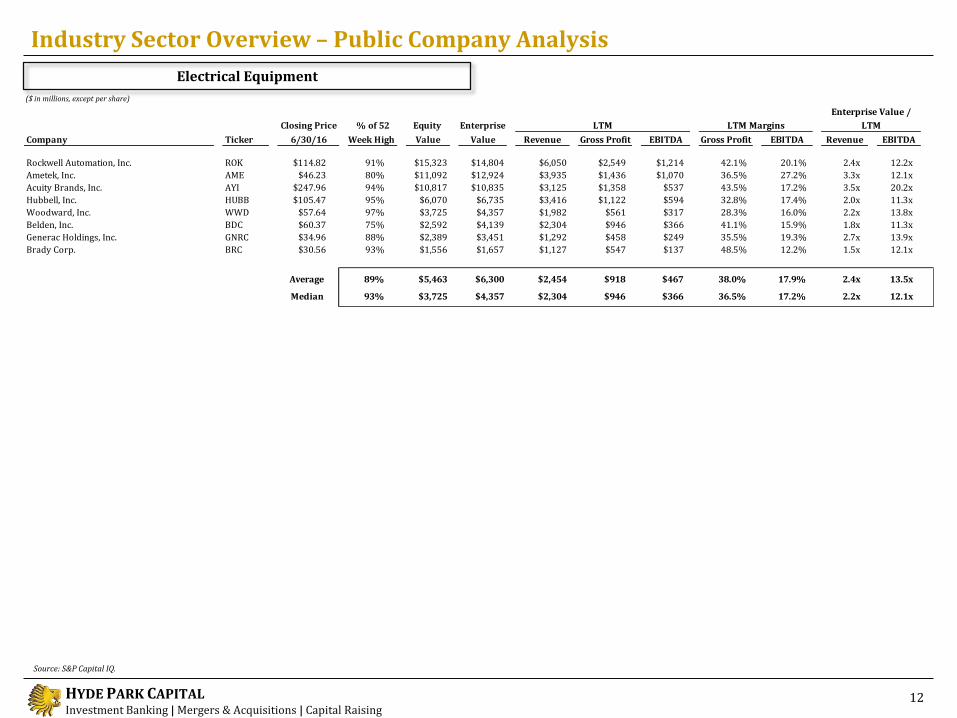
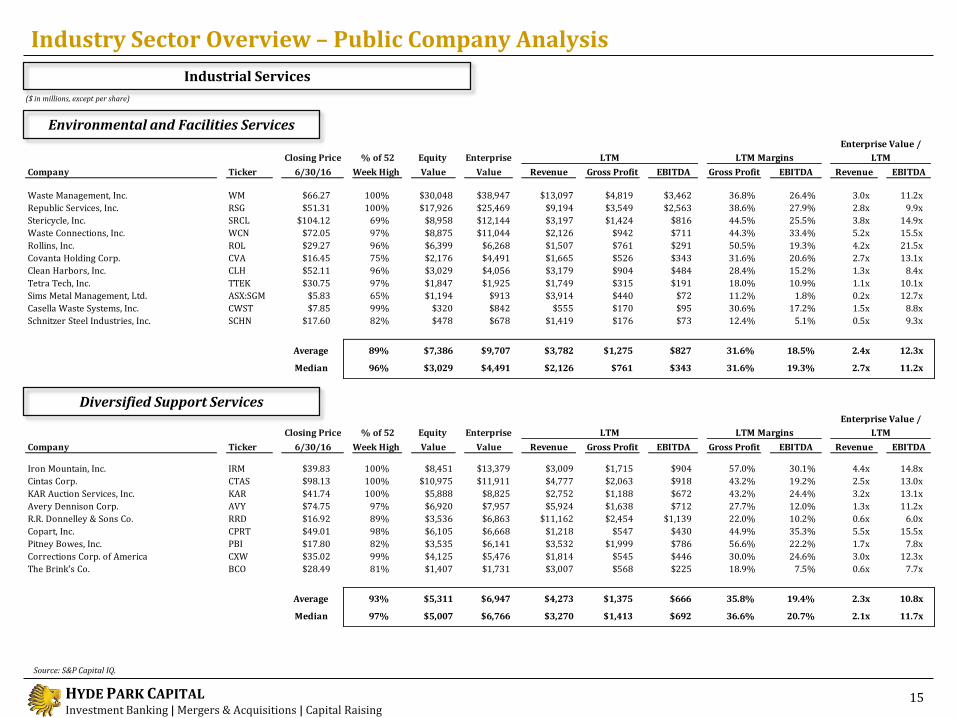
Closing Price % of 52 Equity Enterprise
Company Ticker 6/30/16 Week High Value Value Revenue Gross Profit EBITDA Gross Profit EBITDA Revenue EBITDA