44
Chapter 8 Tests of Hypotheses Based on a Single Sample

Chapter 8
Tests of Hypotheses Based
on a Single Sample

8.1
Hypotheses and
Test Procedures

Hypotheses
The null hypothesis, denoted H0, is the claim that is initially assumed to be true. The alternative hypothesis, denoted by Ha, is the assertion that is contrary to H0. Possible conclusions from hypothesis-testing analysis are reject H0 or fail to reject H0.

A Test of Hypotheses
A test of hypotheses is a method for using sample data to decide whether the null hypothesis should be rejected.

Test ProcedureA test procedure is specified by
1. A test statistic, a function of the sample data on which the decision is to be based.
2. A rejection region, the set of all test statistic values for which H0 will be rejected (null hypothesis rejected iff the test statistic value falls in this region.)

Errors in Hypothesis Testing
A type I error consists of rejecting the null hypothesis H0 when it was true.
A type II error involves not rejecting H0 when H0 is false.

Rejection Region: and
Suppose an experiment and a sample size are fixed, and a test statistic is chosen. The decreasing the size of the rejection region to obtain a smaller value of results in a larger value of for any particular parameter value consistent with Ha.

Significance Level
Specify the largest value of that can be tolerated and find a rejection region having that value of . This makes as small as possible subject to the bound on . The resulting value of is referred to as the significance level.
Level Test
A test corresponding to the significance level is called a level test. A test with significance level is one for which the type I error probability is controlled at the specified level.

8.2
Tests About a Population Mean

Case I: A Normal Population With Known
Null hypothesis: 0 0:H
Test statistic value: 0
/xz
n

Case I: A Normal Population With Known
a 0:H
Alternative Hypothesis
Rejection Region for Level Test
a 0:H
a 0:H
z zz z
/ 2z z/ 2z zor

Recommended Steps in Hypothesis-Testing Analysis
1. Identify the parameter of interest and describe it in the context of the problem situation.
2. Determine the null value and state the null hypothesis.
3. State the alternative hypothesis.
Hypothesis-Testing Analysis
4. Give the formula for the computed value of the test statistic.
5. State the rejection region for the selected significance level
6. Compute any necessary sample quantities, substitute into the formula for the test statistic value, and compute that value.

Hypothesis-Testing Analysis
7. Decide whether H0 should be rejected and state this conclusion in the problem context.
The formulation of hypotheses (steps 2 and 3) should be done before examining the data.

Type II Probability for a Level Test
( )
Alt. Hypothesis
a 0:H
a 0:H
a 0:H
Type II Probability
( )
0
/z
n
01/
zn
0 0/ 2 / 2/ /
z zn n

Sample SizeThe sample size n for which a level test also has at the alternative value is
( )
2
0
2/ 2
0
( )
( )
z z
nz z
one-tailed test
two-tailed test

Case II: Large-Sample Tests
When the sample size is large, the z tests for case I are modified to yield valid test procedures without requiring either a normal population distribution or a known .
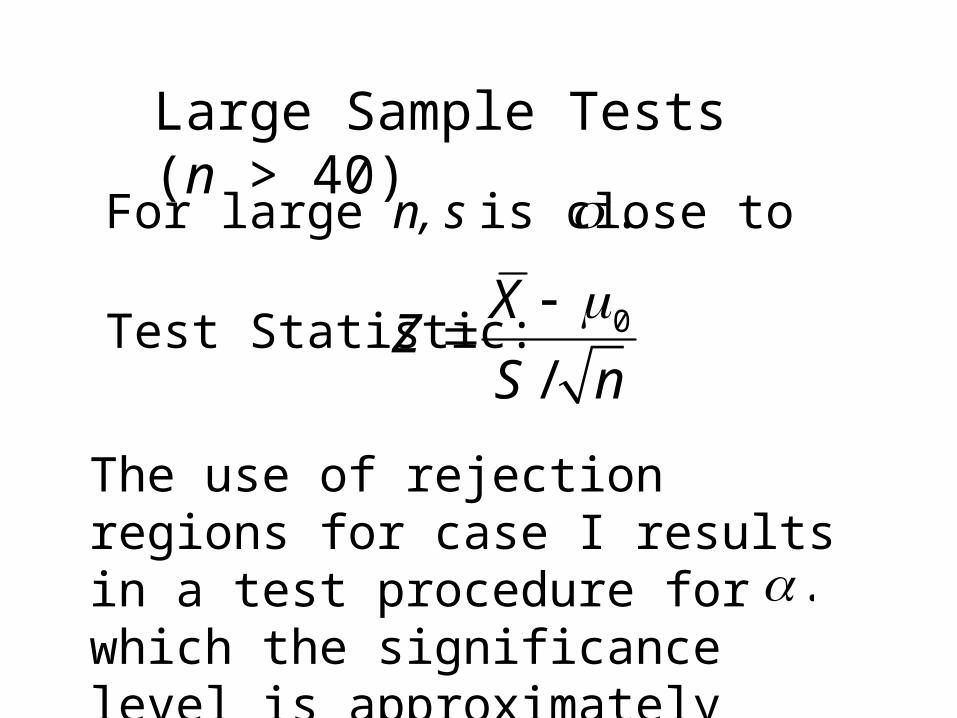
Large Sample Tests (n > 40)
For large n, s is close to .
Test Statistic: 0
/XZS n
The use of rejection regions for case I results in a test procedure for which the significance level is approximately .

Case III: A Normal Population Distribution
If X1,…,Xn is a random sample from a normal distribution, the standardized variable
has a t distribution with n – 1 degrees of freedom.
/XTS n

The One-Sample t Test
Null hypothesis: 0 0:H
Test statistic value: 0
/xts n

a 0:H
Alternative Hypothesis
Rejection Region for Level Test
a 0:H
a 0:H
, 1nt t
, 1nt t
/ 2, 1nt t or
The One-Sample t Test
/ 2, 1nt t

A Typical Curve for the t Test
curve for n – 1 df
Value of d corresponding to specified alternative to
0
when

8.3
Tests Concerning a
Population Proportion
A Population Proportion
Let p denote the proportion of individuals or objects in a population who possess a specified property.

Large-Sample Tests
Large-sample tests concerning p are a special case of the more general large-sample procedures for a parameter .

Large-Samples Concerning p
Null hypothesis: 0 0:H p p
Test statistic value:
0
0 0
ˆ
1 /p pz
p p n

a 0:H p p
Alternative Hypothesis
Rejection Region
a 0:H p p
a 0:H p p
z z
z z
/ 2z z / 2z zor
Large-Samples Concerning p
Valid provided 0 010 and (1 ) 10.np n p

( )p
Alt. Hypothesis
a 0:H p p
a 0:H p p
( )p
0 0 0(1 ) /(1 ) /
p p z p p np p n
General Expressions for
0 0 0(1 ) /1
(1 ) /p p z p p n
p p n

( )p
Alt. Hypothesis
a 0:H p p
( )p
General Expressions for
0 0 0(1 ) /(1 ) /
p p z p p np p n
0 0 0(1 ) /(1 ) /
p p z p p np p n

Sample SizeThe sample size n for which a level test also has ( )p p
2
0 0
0
2
/ 2 0 0
0
(1 ) (1 )
(1 ) (1 )
z p p z p pp p
nz p p z p p
p p
two-tailed test
one-tailed test

Small-Sample Tests
Test procedures when the sample size n is small are based directly on the binomial distribution rather than the normal approximation.
0(type I) 1 ( 1; , )P B c n p
( ) ( 1; , )B p B c n p

8.4
P - Values

P - ValueThe P-value is the smallest level of significance at which H0 would be rejected when a specified test procedure is used on a given data set.
0
1. -value reject at a level of
PH
0
2. -value do not reject at a level of
PH

P - Value
The P-value is the probability, calculated assuming H0 is true, of obtaining a test statistic value at least as contradictory to H0 as the value that actually resulted. The smaller the P-value, the more contradictory is the data to H0.
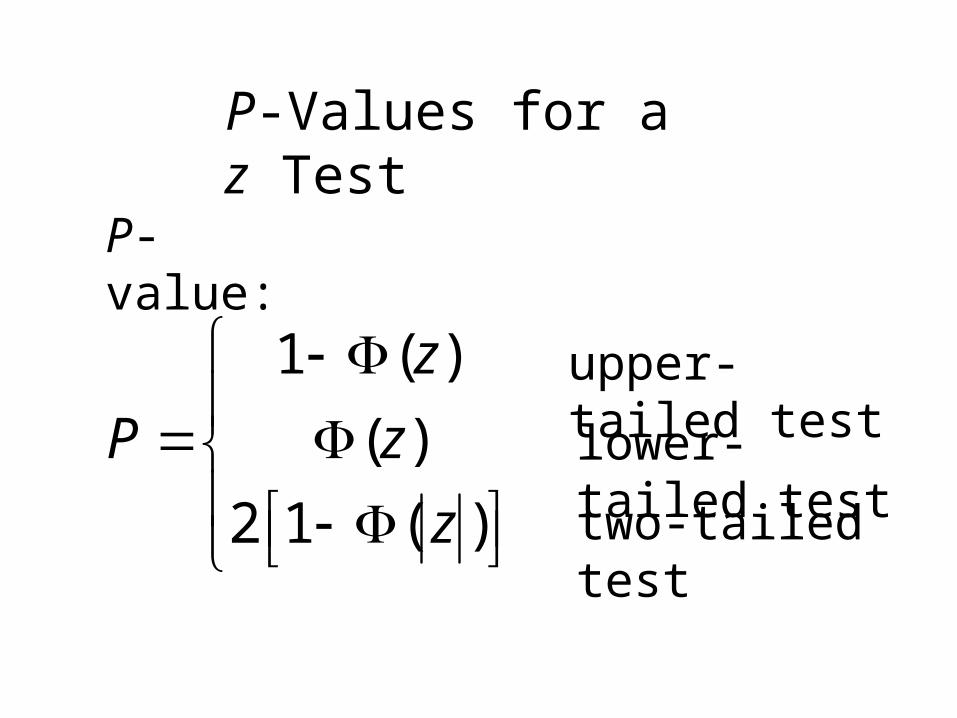
P-Values for a z Test
P-value:
1 ( )( )
2 1 ( )
zP z
z
upper-tailed test
lower-tailed test
two-tailed test

P-Value (area)
z
-z
-value 1 ( )P z
-value ( )P z
-value 2[1 (| |)]P z
0
0
0
-z
z
Upper-Tailed
Lower-Tailed
Two-Tailed
P–Values for t Tests
The P-value for a t test will be a t curve area. The number of df for the one-sample t test is n – 1.
8.5
Some Comments on Selecting a
Test Procedure
Constructing a Test Procedure
1. Specify a test statistic.
2. Decide on the general form of the rejection region.
3. Select the specific numerical critical value or values that will separate the rejection region from the acceptance region.
Issues to be Considered
1. What are the practical implications and consequences of choosing a particular level of significance once the other aspects of a test procedure have been determined?
2. Does there exist a general principle that can be used to obtain best or good test procedures?

Issues to be Considered3. When there exist two or more tests that
are appropriate in a given situation, how can the tests be compared to decide which should be used?
4. If a test is derived under specific assumptions about the distribution of the population being sampled, how well will the test procedure work when the assumptions are violated?

Statistical Versus Practical Significance
Be careful in interpreting evidence when the sample size is large, since any small departure from H0 will almost surely be detected by a test (statistical significance), yet such a departure may have little practical significance.

The Likelihood Ratio Principle
1. Find the largest value of the likelihood for any
2. Find the largest value of the likelihood for any
3. Form the ratio
0 in .
a in .
01
a
maximum likelihood for in ,...,
maximum likelihood for in nx x
Reject H0 when this ratio is small.


