1/11/2010 1 Act 1: What am I looking at? What is SAR? When does it or doesn’t it work? Act 2: Should I believe my eyes? Act 3: Who cares? What have we learned about volcanoes from InSAR? Observations and models Act 4: State of the art and future trends Act 5: How to get a piece of the action Monitoring volcanoes with InSAR Matt Pritchard Cornell Magnitude 6.6 Bam, Iran earthquake in 2003 Interferogram courtesy of Yuri Fialko Basics of Radar: (RAdio Detection And Ranging) Image from: Paul Rosen The Radar Concept: active transmission of microwave radiation Works at night and sees through clouds Ground-Based volcano monitoring radar at Merapi From: Matthias Hort, (U. Hamburg) - 24 GHz FMCW - Doppler radar (Wavelength: 1.25 cm: K radar band) -Range: approx. 4-6 km - Output: Doppler spectra Voege and Hort, 2007 Basics of Ground-based volcano Radar Images courtesy of Matthias Hort (U. Hamburg) DEM from C. Gerstenecker Transmitted frequency Time Returned Reflectivity Frequency Measure: time, frequency and amplitude of returned radar signals To simplify: Time tells us distance Frequency tells us velocity Amplitude tells us size and/or strength of radar scattering What can we do with ground based radar? Doppler spectra of different types of volcanic activity - Radar gives a velocity distribution for up to 16 distance intervals (range gates) - 4 range gate of 600m length are recorded at Merapi - Velocity resolution: 0.28 m/s (radial velocity) Explosion 15 m/s Directed explosion 25 m/s, opening angle 50。 Modified from: Matthias Hort (U. Hamburg) Basics of Imaging Radar Images from: Paul Rosen Place on moving platform -- combine multiple radar bursts into an image Range resolution controlled by extent of pulse (short pulses = high spatial resolution = high bandwidth) Azimuth resolution related to antenna size Basics of Synthetic Aperture Radar From: Paul Rosen Real aperture radar resolution ~ 1 km Synthetic aperture combines multiple views of same area (“synthetic”) ~ 10 m/pixel From: Massonnet & Feigl, 1998
Transcript
1/11/2010
1
Act 1: What am I looking at?
What is SAR?When does it or doesn’t it work?
Act 2: Should I believe my eyes?
Act 3: Who cares?
What have we learned about volcanoes from InSAR? Observations and models
Act 4: State of the art and future trends
Act 5: How to get a piece of the action
Monitoring volcanoes with InSAR
Matt Pritchard
Cornell
Magnitude 6.6 Bam, Iran earthquake in 2003Interferogram courtesy of Yuri Fialko
Basics of Radar: (RAdio Detection And Ranging)
Image from: Paul Rosen
The Radar Concept: active transmission of microwave radiationWorks at night and sees through clouds
Ground-Based volcano monitoring radar at MerapiFrom: Matthias Hort, (U. Hamburg)
Images courtesy of Matthias Hort (U. Hamburg)DEM from C. Gerstenecker
Transmitted frequency
Time
Returned Reflectivity
Frequency
Measure: time, frequency and amplitude of returned radar signals
To simplify:Time tells us distanceFrequency tells us velocityAmplitude tells us size and/or strength of radar scattering
What can we do with ground based radar?
Doppler spectra of different types of volcanic activity
- Radar gives a velocity distribution for up to 16 distance intervals (range gates)- 4 range gate of 600m length are recorded at Merapi- Velocity resolution: 0.28 m/s (radial velocity)
Explosion15 m/s
Directed explosion25 m/s, opening angle 50。
Modified from: Matthias Hort (U. Hamburg)
Basics of Imaging Radar
Images from: Paul Rosen
Place on moving platform -- combine multiple radar bursts into an image
Range resolution controlled by extent of pulse (short pulses = high spatial resolution = high bandwidth)
Azimuth resolution related to antenna size
Basics of Synthetic Aperture Radar
From: Paul Rosen
Real aperture radar resolution ~ 1 km
Synthetic aperture combines multiple views of same area (“synthetic”) ~ 10 m/pixel
From: Massonnet & Feigl, 1998
1/11/2010
2
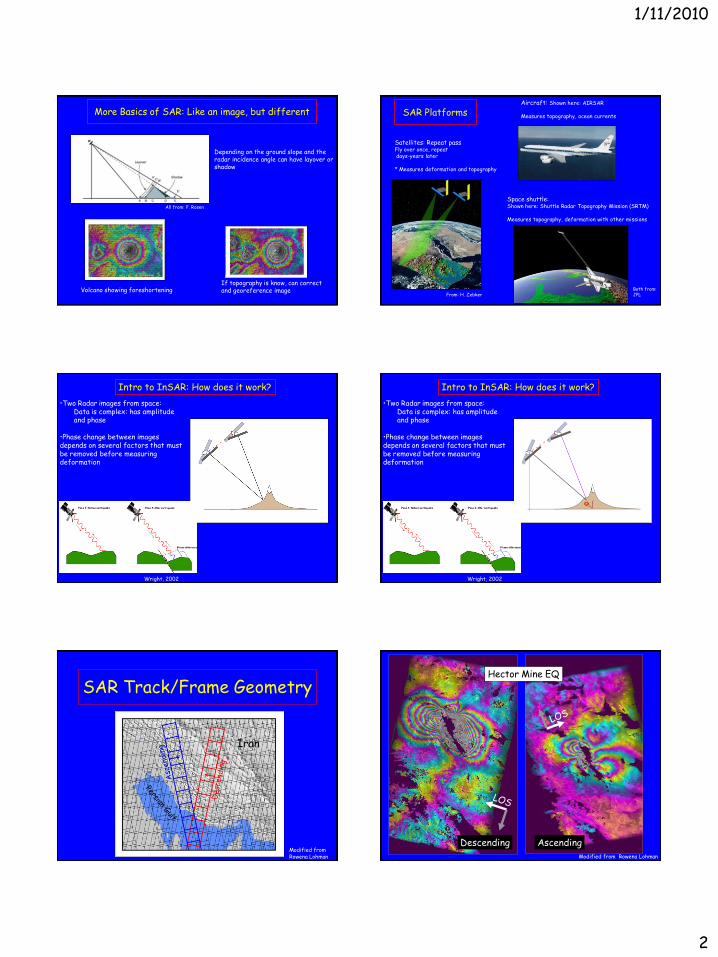
More Basics of SAR: Like an image, but different
All from: P. Rosen
Volcano showing foreshorteningIf topography is know, can correct and georeference image
Depending on the ground slope and the radar incidence angle can have layover or shadow
SAR Platforms
Both from: JPLFrom: H. Zebker
Satellites: Repeat passFly over once, repeatdays-years later
* Measures deformation and topography
Space shuttle:Shown here: Shuttle Radar Topography Mission (SRTM)
Measures topography, deformation with other missions
Aircraft: Shown here: AIRSAR
Measures topography, ocean currents
Intro to InSAR: How does it work?
Wright, 2002
•Two Radar images from space:Data is complex: has amplitude and phase
•Phase change between images depends on several factors that must be removed before measuring deformation
Intro to InSAR: How does it work?
Wright, 2002
•Two Radar images from space:Data is complex: has amplitude and phase
•Phase change between images depends on several factors that must be removed before measuring deformation
SAR Track/Frame Geometry
Iran
Modified from Rowena Lohman
Descending Ascending
Hector Mine EQ
Modified from Rowena Lohman
1/11/2010
3
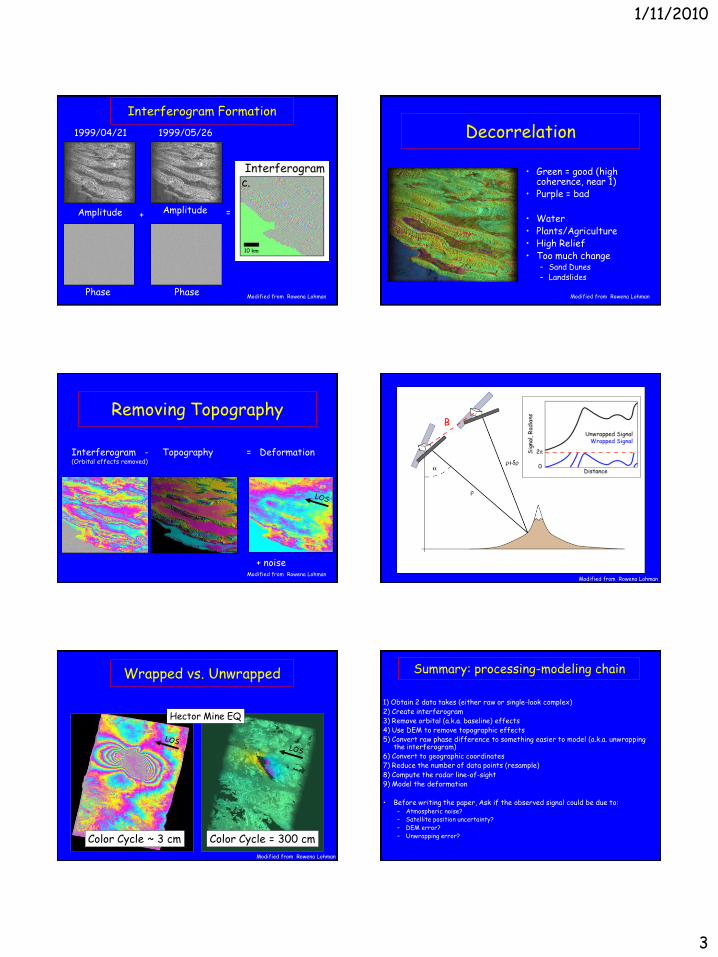
Interferogram Formation
+ =
1999/04/21 1999/05/26
Modified from Rowena Lohman
Amplitude Amplitude
Phase Phase
Decorrelation
• Green = good (high coherence, near 1)
• Purple = bad
• Water• Plants/Agriculture• High Relief• Too much change
1) Obtain 2 data takes (either raw or single-look complex)2) Create interferogram3) Remove orbital (a.k.a. baseline) effects4) Use DEM to remove topographic effects5) Convert raw phase difference to something easier to model (a.k.a. unwrapping
the interferogram)6) Convert to geographic coordinates7) Reduce the number of data points (resample)8) Compute the radar line-of-sight9) Model the deformation
• Before writing the paper, Ask if the observed signal could be due to:– Atmospheric noise?– Satellite position uncertainty?– DEM error?– Unwrapping error?
1/11/2010
4
Condition Data
Condition Data
Form SLC 1
Form SLC 2
Resample Image #2&
Form Interferogram&
Estimate Correlation
Remove Topography
Filter & Look Down
Unwrap Phase
Geocode
Post-Process&
Model
RemoveModel
DEM
(Re)EstimateBaseline
GPS
IndependentData
EstimateTie Points
Orbits
ReturnModel
modified from Mark Simons & Eric Fielding
ROI_pac Two-pass Processing Flow Orbital Errors (“Ramps”)
• ~0.1-1 m uncertainty in satellite positions
• Orbital fringes not always 100% removed
• In particular, not sensitive to long wavelength deformation
How to overcome?• Simultaneously solve for
position and geophysics
Reported vs. Actual
Modified from Rowena Lohman
Atmospheric contamination:Two types
Turbulence
Vertical stratification
Correlated vs. Random Noise
Same variance
Real noise White noise
• Atmospheric water vapor is not white noise• Spatial length scale (turbulence)
Correlated vs. Random Noise
Real noise White noise
Mw 6
Correlated vs. Random Noise
Real noise White noise
Mw 5.5
1/11/2010
5
Correlated vs. Random Noise
Real noise White noise
Mw 5
Correlated vs. Random Noise
Inferred strike
Real noise White noise
Mw 5
Correlated vs. Random Noise
Real fault plane
Real noise White noise
Mw 5
Can we remove the atmospheric signal
from interferograms?
0) Use interferograms themselves to estimate linear or exponential phase with elevation: constant for image or spatially variable
1) Direct water vapor and “dry delay” observations:From satellite (e.g., Li et al., 2005)
From GPS & other ground sensors (e.g., Webley et al., 2002)
2) Data stacks or APS: Assume atmosphere random in time or low-pass time domain filtering (e.g., Ferretti et al., 2001; Simons and Rosen, 2007)
3) Global and Regional Models computed by data center (~100 km horizontal resolution by ECMWF, NCEP; North American RR ~ 32 km) (e.g., Doin et al., 2007; Elliott et al., 2007)
4) Regional or Local Model computed by user (<3 km horizontal resolution) (e.g., Foster et al., 2006)
Based on several studies, we can’t remove everything. Will likely always need to account for atmosphere via covariance matrix
Unexpected deformation can cause errors
Vertical component of deformation from Southern California GPS station (in mm)
Annual and sub-annual cycles
Not a perfect sinusoid:Amplitude varies from year to year
Presumably related to natural and human-induced groundwater changes
From: Dong, JPL webpage
Should we believe GPS/InSAR?: Part 1How well do coincident measurements agree?
•Compare large earthquakes in South America: RMS different few cm
90 InSAR and GPS points for Mw 8.1 Antofagasta, Chile earthquake. GPS stations first occupied in 1992, so GPS was immature (Pritchard et al., 2002)
10 InSAR and GPS points for Mw 8.4 Arequipa, Peru earthquake. Only 4 different GPS stations included(Pritchard et al., 2007)
•For other earthquakes also agree to few cm: Landers, Northridge, Hector Mine (Massonnet et al., 1993, 1998; Zebker et al., 1994; Fialko et al., 2001; Jonsson et al., 2002)
1/11/2010
6
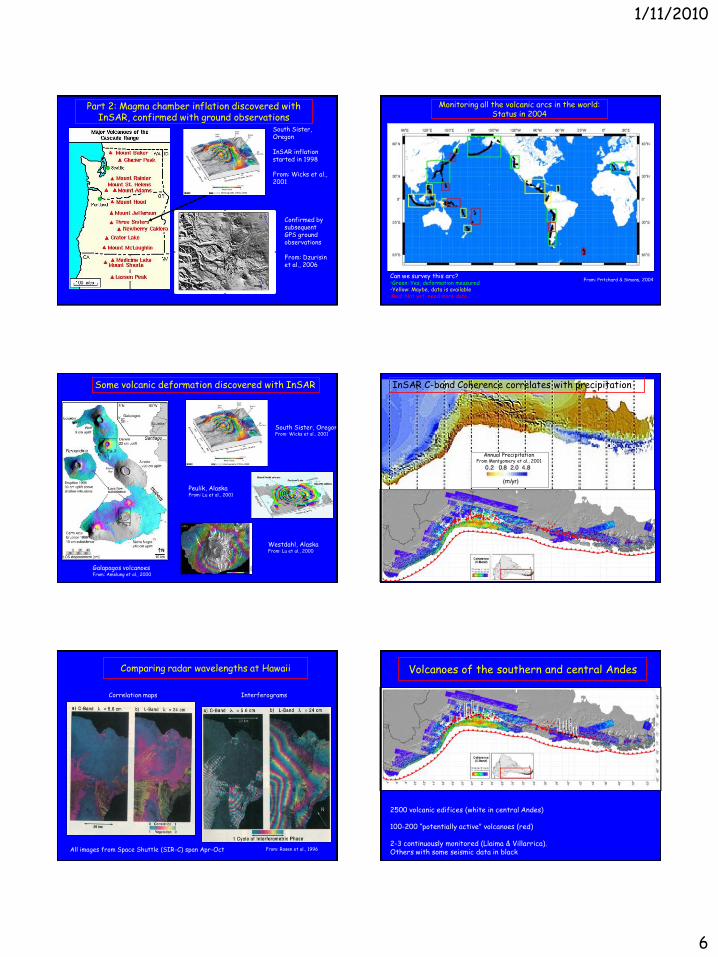
Part 2: Magma chamber inflation discovered with InSAR, confirmed with ground observations
South Sister, Oregon
InSAR inflation started in 1998
From: Wicks et al., 2001
Confirmed by subsequent GPS ground observations
From: Dzurisin et al., 2006
Monitoring all the volcanic arcs in the world: Status in 2004
Can we survey this arc?•Green: Yes, deformation measured•Yellow: Maybe, data is available•Red: Not yet, need more data
From: Pritchard & Simons, 2004
Some volcanic deformation discovered with InSAR
South Sister, OregonFrom: Wicks et al., 2001
Peulik, AlaskaFrom: Lu et al., 2001
Galapagos volcanoesFrom: Amelung et al., 2000
Westdahl, AlaskaFrom: Lu et al., 2000
InSAR C-band Coherence correlates with precipitation
Annual PrecipitationFrom Montgomery et al., 2001
Comparing radar wavelengths at Hawaii
From: Rosen et al., 1996
InterferogramsCorrelation maps
All images from Space Shuttle (SIR-C) span Apr-Oct
Volcanoes of the southern and central Andes
2500 volcanic edifices (white in central Andes)
100-200 “potentially active” volcanoes (red)
2-3 continuously monitored (Llaima & Villarrica). Others with some seismic data in black
1/11/2010
7
Volcanoes of the central Andes 1992-2007
~1000 of the 1113 volcanoes < 20 MaAll 53 of the 53 “potentially active”
Results:Hualca Hualca, Peru - (related to Sabancaya?)inflating until 1997 (Pritchard & Simons, 2002, 2004)
Ticsani region, Peru -1 month(?) deflation 2005
Uturuncu, Bolivia -inflating since 1992 (Pritchard & Simons, 2002, 2004)
Lascar, Chile - pyroclastic flow & intracrater deformation (Pavez et al., 2006; Whelley et al., 2008)
Lastarria, Chile inflating hydrothermal system (Froger et al., 2007)
Cerro Blanco, Argentina -deflating until 2002(?) (Pritchard & Simons, 2002, 2004)
What range of models fit your data?
Some different model parameters to test:Chamber geometryHomogeneous vs. 1D, 2D, and 3D elastic modelsInclude faults and realistic topographyIsotropic vs. Anisotropic modelsMagma compressibilityThermally self-consistent modelElastic vs. Viscoelastic models
Who cares?Impacts: Magma chamber depth, location & volume
Important for understanding relation between deformation and other parameters: seismicity, volumes erupted, gas flux, etc.
Vary shape of “magma chamber”
•Bottom line:With only one component of deformation: all shapes can fit data, but have different depths
Consider:•Spherical point source •Prolate ellipsoid (football)•Oblate ellipsoid (frisbee)•Finite sphere
Dieterich & Decker, 1975
All sources have similarvertical deformation
… But horizontaldeformation different
Effects of source geometry on inferred depth at volcanoes of the central Andes
Pritchard & Simons, G-cubed, 2004
Example data fit
•Uturuncu stratovolcano,Bolivia
•Joint inversion for 3 independent satellite tracks
•All types of sourcescan fit data
•Combining ascendingand descending doesrule out some modelsBut non-uniqueness remains
Pritchard & Simons, G-cubed, 2004
Lascar: Most active volcano in the central Andes
Monitor by seismology: Unique harmonic tremor,Probably related to shallow hydrothermal circulation
Monitor by remote sensing: Thermal radiation from volcanic dome
Thermal hotspot detectedBy JERS-1 OPSFrom: Wooster and Rothery, 1997
Largest eruption in central Andes this century: April 20, 1993Photo by: M. Vuille
30 s time record.From: Hellweg, 1999
Smaller eruption July 20, 2000Photo by: Mason & Pearson
1/11/2010
8
Three major eruptions Largest April, 1993 (.1 km3)
Several minor eruptions
Also, no deformation during eruptions at 3 other volcanoes in central Andes, 4 volcanoes in Kamchatka, 4 in Alaska
Why no deformation?
At least 3 options:
1) Magma moves w/o deformation
2) Deep magma chamber
3) Chamber refills quickly
No deept deformation at Lascar
Deformation not visible with SRTM 90m DEM
DEM:
3 m/pixel; created by Pavez et al., 2006
Digitized aerial photographs (acquired in 1998 by SAF Chile) and ground GPS measurements
Interferogram:
Time period: 95/07/08–95/09/16Pavez et al., 2006
July 20, 1995 eruption17 mm subsidence
Source at 180 m Volume change: 2 x 10³ m3 deflation(Smaller than the eruption)
Deformation not visible with SRTM 90m DEM
Interferogram spans: 19 May 1996 - 12 August 1995 (no major eruptions): See poster by Patrick Whelley
Shishaldin
Lu et al. 2003a
Moran et al. 2006
Seguam
Lu et al. 2003a
Masterlark & Lu, 2004Lu et al. 2000c, 2005b
Westdahl
Lu et al. 2000b,
2003b, 2004
Makushin
Lu et al. 2002c0 12 cm
AkutanKiska
Lu et al. 2002b
0 28.3 cm
Okmok
Lu et al. 2000a, 2003c, 2005a;
Mann et al. 2002;
Patrick et al., 2003
Augustine
Lu et al. 2003a
Masterlark et al 2006
Peulik
Lu et al. 2002a
Tanaga
Korovin
Kwoun et al. 2006
Aniakchak
Deformation of Aleutian Volcanoes by Zhong Lu et al.
Inter-arc comparison
Arc # volcanoes # with historic # with eruptions # of volcanoeseruptions this decade actively deforming
C. Andes 65 17 4 6
Alaska/ 80 46 17 121
Aleutians
• Although Alaska/Aleutian arc seems more active, geologic averaged magma flux about the same (Reymer and Schubert, 1984)
• Central Andes different because of 70 km thick crust or magma composition?
• Or amount of sediment subducted?
• Or type of lava (basalt vs. andesite/dacite)?
• No single global explanation for the inter-arc variation in magma flux (Simkin and Siebert, 1984)
1Based on published work of Lu et al. 1997-2006
Wicks, et al., 2006, Magma rises beneath the Sour Creek resurgent dome, migrates through the caldera, and exits the system near the Norris Geyser Basin.
Only use summer SAR data because of snow cover
Yellowstone caldera: complex deformation in space and time
1/11/2010
9
ENVISAT IS2 2004-2006 interferogram with Continuous GPS vectors (Chang et al., 2007)
Modified from Chuck Wicks
Different Yellowstone activity starts in 2004
Sources for 2004-2006 deformation (InSAR plus GPS)
Combined with earthquakes, Coloumb stress change modeling
and inferences from seismic tomography
From: Chang et al., 2007
Inferred subsurface active from deformation
measurements
inflation
subsidence
KILAUEAMAUNA LOA
ENVISAT interferogram spanning November 2003 to January 2006 and showing inflation of the summits of Kilauea and Mauna Loa volcanoes, along with subsidence along both of Kilauea’s rift zones.
unpublished data from Mike Poland, USGS
Activity at the Big Island, Hawai’i
ENVISAT IS3 Track 365May 13, 2006 – September 30, 2006
Kilauea caldera Pu`u `O`o
Alae craterMakaopuhi crater
ocean entry
unpublished data from Mike Poland
Conceptual Model
Dike intrusion
From: H. Zebker
Mt. Etna
From: Lundgren and Rosen, 2003
Kilauea
From: F. Amelung
Magma inflation & sector collapse: Mt. Etna
Above: Interferograms spanning 1993-1999 with faults from left; From: Lundgren et al., 2004
1/11/2010
10
ERS-1/2 interferometric stack spanning 1992–2001 at Mount St. Helens. Three areas of subsidence in debris avalanche deposit, but no volcano-wide deformation in the pre-eruptive period. From Poland & Lu, 2008.
Debris Avalanche subsidence at Mt. St. HelensGlobal Synthesis: What have we learned from InSAR?
• Volcano life cycle:– Magmatic intrusions without eruption might be frequent and short-lived– These intrusions are mostly aseismic (caveats: Uturuncu, South Sister)
– Implications for hazard
• Magma plumbing– Image spatial complexity of deformation (or lack of complexity)
• Non-magmatic deformation – Lava flow and pyroclastic flow subsidence; geothermal areas
• Eruptions with no deformation observed – 4 volcanoes in Andes; 4 in Kamchatka; several in Alaska– Maybe chambers are deep– Maybe chambers quickly refill
• Different rates of activity in different arcs
Data available in southern California
From: Yuri Fialko
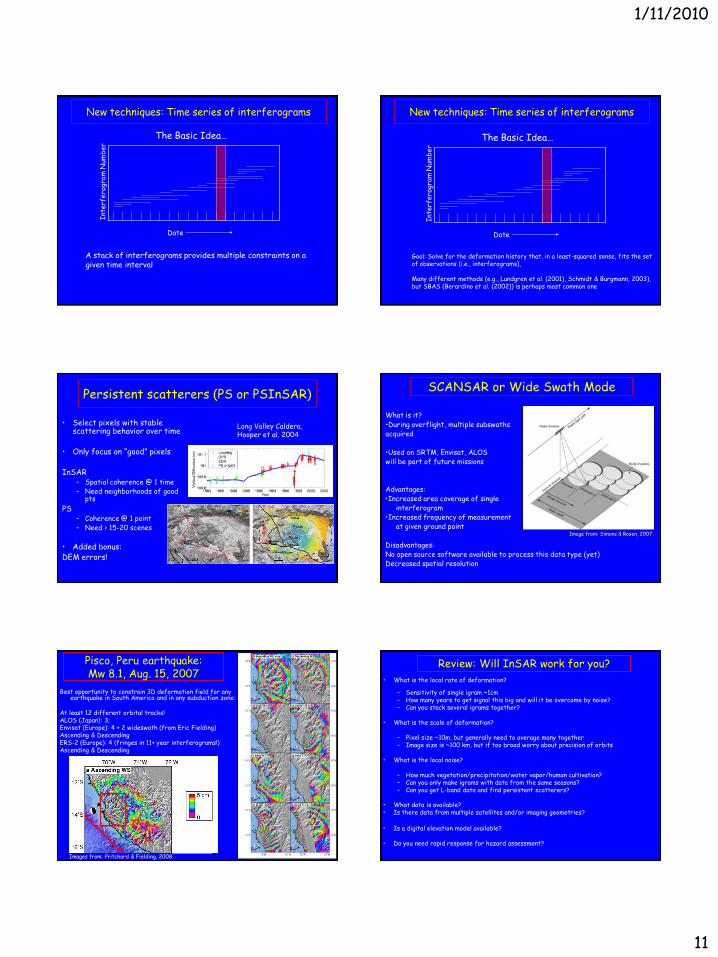
New techniques: Time series of interferograms
Possible pairs with Perpendicular baseline < 200 m
From: Yuri Fialko
New techniques: Time series of interferograms
New techniques: Time series of interferograms
Actual pairs made -- reduce influence of scenes with severe atmospheric noise
From: Yuri Fialko
The Basic Idea…
Date
New techniques: Time series of interferograms
1/11/2010
11
The Basic Idea…
Date
A stack of interferograms provides multiple constraints on a given time interval
New techniques: Time series of interferograms
The Basic Idea…
Date
Goal: Solve for the deformation history that, in a least-squared sense, fits the set of observations (i.e., interferograms),
Many different methods (e.g., Lundgren et al. (2001), Schmidt & Burgmann, 2003), but SBAS (Berardino et al. (2002)) is perhaps most common one
New techniques: Time series of interferograms
Persistent scatterers (PS or PSInSAR)
Long Valley Caldera,Hooper et al. 2004
• Select pixels with stable scattering behavior over time
• Only focus on “good” pixels
InSAR– Spatial coherence @ 1 time– Need neighborhoods of good
pts
PS– Coherence @ 1 point– Need > 15-20 scenes
• Added bonus:DEM errors!
SCANSAR or Wide Swath Mode
What is it?•During overflight, multiple subswathsacquired
•Used on SRTM, Envisat, ALOS will be part of future missions
Advantages: •Increased area coverage of single
interferogram•Increased frequency of measurement
at given ground point
Disadvantages:No open source software available to process this data type (yet)Decreased spatial resolution
Image from: Simons & Rosen, 2007
Pisco, Peru earthquake: Mw 8.1, Aug. 15, 2007
Best opportunity to constrain 3D deformation field for any earthquake in South America and in any subduction zone:
At least 12 different orbital tracks! ALOS (Japan): 3; Envisat (Europe): 4 + 2 wideswath (from Eric Fielding) Ascending & DescendingERS-2 (Europe): 4 (fringes in 11+ year interferograms!) Ascending & Descending
Images from: Pritchard & Fielding, 2008
Review: Will InSAR work for you?
• What is the local rate of deformation?
– Sensitivity of single igram ~1cm – How many years to get signal this big and will it be overcome by noise?– Can you stack several igrams together?
• What is the scale of deformation?
– Pixel size ~10m, but generally need to average many together– Image size is ~100 km, but if too broad worry about precision of orbits
• What is the local noise?
– How much vegetation/precipitation/water vapor/human cultivation?– Can you only make igrams with data from the same seasons?– Can you get L-band data and find persistent scatterers?
• What data is available? • Is there data from multiple satellites and/or imaging geometries?
• Is a digital elevation model available?
• Do you need rapid response for hazard assessment?
1/11/2010
12
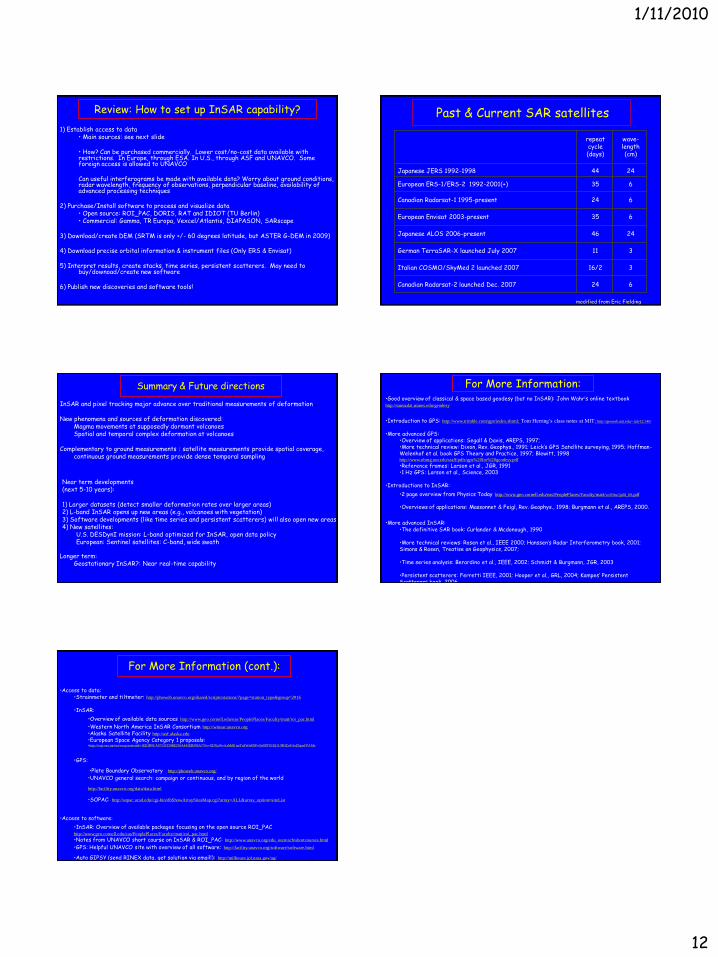
Review: How to set up InSAR capability?
1) Establish access to data • Main sources: see next slide
• How? Can be purchased commercially. Lower cost/no-cost data available with restrictions. In Europe, through ESA. In U.S., through ASF and UNAVCO. Some foreign access is allowed to UNAVCO
Can useful interferograms be made with available data? Worry about ground conditions, radar wavelength, frequency of observations, perpendicular baseline, availability of advanced processing techniques
2) Purchase/Install software to process and visualize data• Open source: ROI_PAC, DORIS, RAT and IDIOT (TU Berlin)• Commercial: Gamma, TR Europa, Vexcel/Atlantis, DIAPASON, SARscape
3) Download/create DEM (SRTM is only +/- 60 degrees latitude, but ASTER G-DEM in 2009)
4) Download precise orbital information & instrument files (Only ERS & Envisat)
5) Interpret results, create stacks, time series, persistent scatterers. May need to buy/downoad/create new software
6) Publish new discoveries and software tools!
Past & Current SAR satellites
repeatcycle(days)
wave-length(cm)
European ERS-1/ERS-2 1992-2001(+) 35 6
Canadian Radarsat-1 1995-present 24 6
European Envisat 2003-present 35 6
Japanese ALOS 2006-present 46 24
German TerraSAR-X launched July 2007 11 3
Italian COSMO/SkyMed 2 launched 2007 16/2 3
Canadian Radarsat-2 launched Dec. 2007 24 6
Japanese JERS 1992-1998 44 24
modified from Eric Fielding
Summary & Future directions
InSAR and pixel tracking major advance over traditional measurements of deformation
New phenomena and sources of deformation discovered:Magma movements at supposedly dormant volcanoesSpatial and temporal complex deformation at volcanoes
Complementary to ground measurements : satellite measurements provide spatial coverage, continuous ground measurements provide dense temporal sampling
Near term developments (next 5-10 years):
1) Larger datasets (detect smaller deformation rates over larger areas)2) L-band InSAR opens up new areas (e.g., volcanoes with vegetation)3) Software developments (like time series and persistent scatterers) will also open new areas4) New satellites:
U.S. DESDynI mission: L-band optimized for InSAR, open data policyEuropean: Sentinel satellites: C-band, wide swath
Longer term:Geostationary InSAR?: Near real-time capability
•Good overview of classical & space based geodesy (but no InSAR): John Wahr’s online textbookhttp://samizdat.mines.edu/geodesy
•Introduction to GPS: http://www.trimble.com/gps/index.shtml; Tom Herring’s class notes at MIT: http://geoweb.mit.edu/~tah/12.540/
•More advanced GPS:•Overview of applications: Segall & Davis, AREPS, 1997; •More technical review: Dixon, Rev. Geophys., 1991; Leick’s GPS Satellite surveying, 1995; Hoffman-Welenhof et al. book GPS Theory and Practice, 1997; Blewitt, 1998 http://www.nbmg.unr.edu/staff/pdfs/gps%20for%20geodesy.pdf
•Reference frames: Larson et al., JGR, 1991•1 Hz GPS: Larson et al., Science, 2003
•Introductions to InSAR:
•2 page overview from Physics Today http://www.geo.cornell.edu/eas/PeoplePlaces/Faculty/matt/vol59no7p68_69.pdf
•Overviews of applications: Massonnet & Feigl, Rev. Geophys., 1998; Burgmann et al., AREPS, 2000.
•More advanced InSAR:•The definitive SAR book: Curlander & Mcdonough, 1990
•More technical reviews: Rosen et al., IEEE 2000; Hanssen’s Radar Interferometry book, 2001; Simons & Rosen, Treatise on Geophysics, 2007;
•Time series analysis: Berardino et al., IEEE, 2002; Schmidt & Burgmann, JGR, 2003