Powers, Materials and Radiations from Low Energy Nuclear Reactions on Surfaces David J. Nagel The George Washington University Abstract Nuclear reactions that occur at low kinetic energies produce thermal energy at some rate (powers), nuclear reaction products (materials) and, in some cases, energetic photons or particles (radiations). Experimental evidence indicates that low energy nuclear reactions (LENR) occur on or very near to the surfaces of solid lattices. The rates of such reactions depend on the total area of the lattices in an LENR experiment, the fraction of that area which is active and the number of reactions per area per second. The powers further depend on the energy per reaction. The production rates of materials are related to the masses of the reaction products. And, the fluxes of radiations depend on the fraction of the reactions that produce energetic quanta. These factors are examined in this paper. A simple, but useful graphical method to relate surface areas to output nuclear powers is presented. It is used to make the first estimate of the active fraction of a surface in LENR experiments. Optimization of power outputs from LENR experiments is discussed in relation to the various factors cited above and to past work. The several intersections between LENR and both nano-science and nano- technology are examined. A new engineering discipline will be required to turn the current science of LENR into practical sources of energy, materials and maybe radiations. Outline 1. Introduction 2. Experimental Case for LENR Occurring on Surfaces 3. Equations for Production of Power, Materials and Radiations 4. Total Surface Area 5. Active Area Fraction 6. Areal Reaction Rates 7. Energies per Reaction 8. Graphical Relationships 9. Maximization of Outputs 10. Relations to Past Parametric Work 11. LENR within Solids 12. Control of LENR Power Sources 13. LENR are Part of Nano-Science and Nano-Technology 14. Conclusion Acknowledgements References Proceedings of the 13 th International Conference on Cold Fusion Sochi Russia 2007
Transcript
Powers, Materials and Radiations from Low Energy Nuclear Reactions on Surfaces
David J. Nagel
The George Washington University
Abstract
Nuclear reactions that occur at low kinetic energies produce thermal energy at some rate (powers), nuclear reaction products (materials) and, in some cases, energetic photons or particles (radiations). Experimental evidence indicates that low energy nuclear reactions (LENR) occur on or very near to the surfaces of solid lattices. The rates of such reactions depend on the total area of the lattices in an LENR experiment, the fraction of that area which is active and the number of reactions per area per second. The powers further depend on the energy per reaction. The production rates of materials are related to the masses of the reaction products. And, the fluxes of radiations depend on the fraction of the reactions that produce energetic quanta. These factors are examined in this paper. A simple, but useful graphical method to relate surface areas to output nuclear powers is presented. It is used to make the first estimate of the active fraction of a surface in LENR experiments. Optimization of power outputs from LENR experiments is discussed in relation to the various factors cited above and to past work. The several intersections between LENR and both nano-science and nano-technology are examined. A new engineering discipline will be required to turn the current science of LENR into practical sources of energy, materials and maybe radiations.
Outline
1. Introduction 2. Experimental Case for LENR Occurring on Surfaces 3. Equations for Production of Power, Materials and Radiations 4. Total Surface Area 5. Active Area Fraction 6. Areal Reaction Rates 7. Energies per Reaction 8. Graphical Relationships 9. Maximization of Outputs 10. Relations to Past Parametric Work 11. LENR within Solids 12. Control of LENR Power Sources 13. LENR are Part of Nano-Science and Nano-Technology 14. Conclusion Acknowledgements References
Proceedings of the 13th International Conference on Cold Fusion
Sochi Russia 2007
1. Introduction. The powers available from sources of energy determine their applications. This is true whether the energy comes from chemical or nuclear reactions. The power (energy per second, measured in watts or horsepower) is dependent on the energy per reaction, which is commonly constant, and the number of reactions per second. Hence, the rates of reactions are critically important for the potential uses of any energy source. This central role of reaction rates is also true for the production of materials or radiations from nuclear reactions. Reaction rates are a main consideration in this paper. In the field of LENR, solid lattices are common to almost all experiments [1]. However, the phases from which hydrogen isotopes are introduced into lattices span the possibilities indicated in Figure 1. The ways with which lattices can be loaded with protons or deuterons fall into three broad categories. Initially and most commonly, electrochemical methods are used for loading protons from light water or deuterons from heavy water into an immersed lattice. In a few experiments, molten salts were the liquid source of the hydrogen isotopes. Many experiments have also been done with lattices placed within hydrogen or deuterium gases, usually at elevated temperatures or pressures. The final large class of loading methods involves plasmas, and sometimes low energy beams, as sources of energetic protons or deuterons. In all three cases, a solid is involved. No matter how the conditions to achieve LENR are produced, there are three major types of products from those reactions. The production of energy, called excess heat, is of greatest interest. However, the nuclei that result from the reactions, called nuclear ash, can also be significant. The production of desirable elements or destruction of unwanted isotopes could be very important. Finally, energetic quanta, both photons and particles, which are sometimes observed from LENR, are both diagnostically useful and possible concerns for radiation safety. Many other sources of radiation for applications ranging from medicine to security are now in use. However, any unwanted or wanted source of radiation inevitably comes with serious concerns over its possible degradation of the health of people or the environment. It appears most likely that LENR will be used for energy production, and most uncertain that LENR will be the basis of practical radiation sources. Having energy (heat) sources without energetic radiations is a very attractive possibility. In this paper, we are interested in all three of the means to produce LENR. However, because most of the research in the field has been on electrochemical experiments, such work is most commonly cited. Similarly, the production of energy, materials and radiation are all
Excess Nuclear EnergeticHeat Products Quanta
Liquids:Electrochemical
Gases:Thermodynamic
Plasmas & Beams:Kinetic
Input(Loading)Processes
Output (Measurements)
Figure 1. The nine combinations of the three major means of producing LENR and the three classes of measured quantities. Darker shading indicates the combinations that have received more attention to date.
of interest. But, since the production of clean energy is probably the first, if not most important potential application of LENR, our focus is dominantly on the power available from such reactions. The nuclear reactions that occur at ordinary energies near room temperature can take place on the surface of a lattice, within its bulk, or in both locations. There is substantial experimental evidence for the first possibility, that is, reactions happening on or very near to the surface of a lattice. This evidence is briefly summarized in the next section. Then, we provide the simple equations that relate the rates of production of energy, nuclei or radiations to a few basic factors in the third section. The following four sections discuss each of these factors in additional detail. A simple, but very useful graphical means of relating surface areas to power production in LENR experiments constitutes section 8. The following section deals with maximization of the desired outputs. Section 10 seeks to relate the new formulation to published information on LENR rates. The possibilities for and implications of LENR within solids are discussed in the following section. Reproducibility, controllability and optimization of LENR for both research and applications are discussed in section 12. Then, the relationships between LENR and nano-science and -technology are examined. The concluding section confronts the requirements of engineering useful reactors based on LENR. 2. Experimental Case for LENR Occurring on Surfaces It is appropriate to begin by considering the possible locations on or near a surface or within the bulk at which LENR can occur. This can be done with the use of Figure 2. Clean surfaces can be classified as either smooth, if the shapes of the atoms and molecules that constitute the surface are ignored, or else structured with various geometries of different size scales. Surfaces usually are covered with diverse layers, which are generally complex in both their composition and structure. This is especially true of the environments in electrochemical cells. The layers on surfaces can be enabling or disabling for the chemical or nuclear reactions of interest. The bulk of a material can be even more complex than the surface because of the various dimensionality and types of defects that are possible. Most of these are listed in Figure 2. We will next provide reasons for consideration of LENR on or very near to surfaces. Later, after presentation and discussion of the analysis for LENR rates on surfaces, possibilities for bulk reactions will be considered. The definition of a surface or near-surface region can be complex, especially for
Surface
Bulk
0 DPoint Defects
VacanciesImpuritiesInterstitials
3 DParticles
VoidsPhases
Other Materials
1 DDislocations
EdgeScrewOther
2 DBoundaries
TwinsGrainsPhases
Figure 2. Top: Schematic indications of a perfect and clean surface and of imperfect surfaces that have structures above or below the average surface level. Bottom: Schematic of a perfect bulk material and lists of the various zero, one, two and three dimensional defects that can occur within a bulk material.
contoured surfaces. Electronic structure calculations made for layers of atoms parallel to the clean surface of a crystal provide useful guidance on what constitutes a surface. They show that the band structure and density of states for the single surface layer of atoms is markedly different from those of bulk layers. This is due to the absence of bonds on one side of atoms in the surface layer. However, the second layer has an electronic structure that is very much like that of bulk layers. So, the surface and near-surface regions can be reasonably defined as just the top two layers of atoms on a surface. That is, the width of the surface and near-surface region is on the scale of one nanometer. However, diffusive and other more energetic processes can affect depths extending one micrometer or more into the bulk of a material. There is evidence from both electrochemical, and gas loading and permeation LENR experiments, that the reactions occur near the surface of the usually-ordered solid materials involved in the experiments. Many workers have found that excess power scales with the electrical current density through the surface of the cathode. A summary of such data is given in Figure 3 [2]. Letts and Cravens [3], and Swartz [4], showed that shining a laser on a cathode in an electrochemical cell increases the rate of power production. The skin depth for the laser-solid interaction is on the order of nanometers. Arata and Zhang used Pd black in their Double Structure Cathodes, which had a high pressure of deuterium gas inside of the hollow cathodes [5]. In such finely-divided Pd, most of the atoms are near the surfaces of the nano-particles. The gas permeation transmutation experiments by Iwamura and his colleagues show the reaction products occur within about <10 nm of the surface, as indicated in Figure 3 [6]. In his recent book, Storms cites other evidence for the surface occurrence of LENR [7]. Included are the appearance of tritium in the gas above an active cell (rather than in the electrolyte) and the surface-sensitive open circuit voltage in power-producing cells. In summary, there is substantial experimental evidence of varying quality, which indicates that LENR occur on or near the surface of solids. The case for where LENR occur is certainly not closed. Additional data is needed both from reproductions of experiments already run, and from new experiments, such as Raman scattering. Even if a much stronger case can be made now for surface LENRs, the possibility of bulk reactions is not automatically ruled out. We will briefly return to the question of reactions in the bulk in Section 11.
Figure 3. Some of the experimental evidence that LENR occur on or very near surfaces. Left: A compilation by Storms of the dependence of excess power on the current density through the surface of the cathode in electrochemical experiments. Right: A profile into a complex Pd foil that had been permeated with deuterium gas, as measured by Iwamura et al. B.G. means Background and F.G. means Foreground.
3. Equations for Production of Power, Materials and Radiation The relations that give the number (N) of reactions, the energy (E), the material mass (M) and the radiation (R) per unit time (T) are given, respectively, in equations (1) through (4). In all of these equations, A is the total surface area, F is the fraction of that area which is active in producing nuclear reactions, and [N/(A x T)] is the reaction rate per unit of total area. E is the total emitted energy per reaction, M is the amount (mass) of a particular isotope of interest produced in each reaction and Q is the number of quanta of some electromagnetic or particulate radiation of interest. The energy of any quanta may be part of the total emitted reaction. The mass of particular quanta links their number and the production rate of materials.
In the rest of this paper, we will focus on the production of energy and power, that is, equation (2). If one wants the reaction, mass production or radiation production rates, then the other equations can be employed in a manner similar to the energy considerations that follow. Figure 4 gives the energy production rate (power = P) equation again with labels. Values for each of the four factors in this equation are available from different sources. They will be discussed in the following four sections.
4. Total Surface Area (A)
The area of the surface of the cathode in an electrochemical loading experiment can vary
widely both an absolute basis and in relation to the volume of the cathode material. If the geometrical shape of the cathode is fixed, increasing the volume will increase the surface area. However, it is more effective to alter the geometry of the cathode for a fixed volume of material. This section examines three varieties of geometries that have been used in LENR experiments, and then discusses the increase in surface area as the shape of a cathode with a fixed amount of material is varied.
N/T = A x F x [N/(A x T)] (1)
E/T = A x F x [N/(A x T)] x E = P (2)
M/T = A x F x [N/(A x T)] x M (3)
R/T = A x F x [N/(A x T)] x Q (4)
E/T = A x F x [N/(A x T)] x E = P
TotalArea
FractionActive
Reactionsper Area per Second
Energyper Reaction
Figure 4. The equation governing energy production by LENR, with labels for the four individual factors.
Figure 5 shows photographs of LENR cathodes on three size scales. The classical electrode is a solid cylinder of Palladium or its alloys with a diameter on the scale of millimeters, such as that made by Imam [8]. Co-deposition of Palladium and deuterons leads to a material with much higher surface area per cubic centimeter or gram, as found in the work of Szpak et al [9]. The largest surface area per volume is gotten for material with dimensions of nanometers, with the work of Arata and Zhang providing one of the few examples [10]. In going from the regular solid electrode form to progressively finer materials, there are both advantages and disadvantages, as noted in Figure 5. The increase in area, and possibly the number of nuclear reactions, and the decrease in loading times, are the major advantages. Rapid removal of heat, products and high escape rates for radiations can also be advantageous. However, unless particular assessment techniques are used, the actual surface area is not known for the micro- and nano-meter scale materials. This is not to say that the areas of the fine-scale materials cannot be measured. Catalysis scientists have developed an array of methods for measuring the surface areas of materials with very small particle sizes [11]. Apparently, such techniques have not yet been used for the study of the dependence of the output of LENR experiments on the total areas of the cathodes.
Turning now to ways to increase the areas for a given volume of materials, there are conceptually two approaches. In the first, the material is cut into progressively smaller pieces, with each cut producing more surface area without the addition of any volume. This is illustrated in Figure 6. Starting with a cube one centimeter on a side, regularly-spaced cuts parallel to one pair of sides will produce layers. Further cuts parallel to another pair of sides yields rods. Finally, cuts orthogonal to the first two sets of slices gives particles. The
Large Surface Areas Per Unit Volume Many ReactionsShort Input Material Diffusion Lengths Rapid LoadingShort Output Thermal Diffusion Lengths Rapid Heat RemovalShort Output Material Diffusion Lengths Rapid Product RemovalShort Output Radiation Escape Lengths High Escape Fraction
Known Surface AreaSmall Surface Area
Long Loading Times
Unknown Surface AreaLarge Surface Area
Short Loading Times
Unknown Surface AreaVery Large Surface Area
Short Loading Times
Imam-Naval Research laboratory Szpak et al-SPAWAR Arata & Zhang-Osaka University
Figure 5. Photographs of Pd cathode materials from various LENR experiments on size scales of millimeters, micrometers and nanometers. The favorable and unfavorable aspects of each type of material are listed in the middle. The implications of having large surface areas and small particles are given at the bottom of the figure.
analytical expressions for the total surface areas of the layers, rods or particles are given in Figure 6 as a function of N, the number of entities in each case. It can be seen from the expressions that, for all three cases, the area per volume scales linearly with N. In the limit of large N, the scaling for layers is 2N, for rods 4N and for particles 6N. That is, there is a gain of a factor of a few (2 or 3) if the number of directions of the cuts is increased from one to two or three. The biggest gain is due to having large values of N, that is, by making numerous cuts. For example, in the case of particles, micrometer-sized particles have a value of N of 104, while nanometer-scale particle have an N = 107. Particles with sizes of about 10 nanometers have a surface to area ratio of about 6 x 10⁶ with units of cm2/cm3.
The second approach to increasing the surface area of a fixed volume of cathode material is to deform it, for example, by flattening it into a square sheet or pulling it into a wire with a square cross section. For reference, gold leaf is about 100 nanometers in thickness [12]. Flattening one cubic centimeter into a thin film with a thickness of 100 nm would give a square area with a side that is about 3 m long. The total surface area of the film would be about 20 square meters. Stretching the cubic centimeter into a wire that has a square cross section of 100 nm would yield a wire, which is 108 m long with an area of 40 square meters. It is clear that having one or two dimensions on the scale of nanometers results in very large total areas per cubic centimeter of material, whether the starting volume is cut up or deformed. 5. Active Area Fraction (F)
Even if the substrate material in an LENR experiment has a very large area, on either absolute or volumetric bases, only a small fraction of it may be active. The fraction of the overall area that can support LENR is critical to the effectiveness, total power output and cost of a power source based on LENR. This factor is not known now from either experiment or theory. It cannot be higher than 1.0 and is more likely to be low, maybe in the range 0.01 to
1 cm
N = number of particlesin each direction, so theparticle edge length =
1/N cm.
Particles
Area/cm3 =N3 x 6 x 1/N2
= 6N
1 cm
N = number of rods intwo directions, each with
cross sectional area =1/N2 cm2
Rods
Area/cm3 = N2 x [2/N2+4x1x1/N] =
2 + 4N
1 cm
N = number of layersper cm,
with thickness =1/N cm.
Layers
Area/cm3 =N x [2+4x1x1/N]
= 2N + 4 Figure 6. The number of layers, rods or particles, and the total surface area per cubic centimeter, that result from one, two or three sets of regularly-spaced cuts parallel to the faces of the original solid cube.
0.0001 or even lower. If it can be made high, say 0.1 or greater, then the substrate material will be used more effectively and the device output power relatively high. It is already clear that deposits and coatings of solid surfaces may render some regions inactive. Poisons could work by either covering the appropriate lattice or other surface sites, or by reacting with them. It is also possible that deposits from the electrolyte, gas or plasma near the substrate might make some regions active by producing required conditions. A given small region of the substrate might alternatively be active and inactive, possibly due to the production and escape of nuclear reaction products from the region. Storms called regions, which produce LENR, Nuclear Active Environments (NAE) [13]. This term could apply to either regions on the surface of a lattice, which is or interest here, or to regions within the bulk of a material. It is very important to devise experiments that can yield values for the fraction of the total surface that is active, both to make calculations of expected powers and for studies to control (increase!) the active fraction. Few of the large array of tools available for surface measurements in vacuo are operable in an electrochemical or even a gas cell. Even fewer instrumental analytical methods work under plasma conditions. In gas and plasma experiments, alternative operation and purging of the atmosphere will permit the use of many of the techniques from vacuum surface science. Relatively simple imaging, with modern capture and analysis software tools, applies to liquid, gas and plasma loading experiments. Rather ordinary imaging in the visible range, with spatial resolution slightly below one micrometer and temporal resolution down to about one millisecond, is straightforward. Stroboscopic imaging with pulsed laser or other sources will yield images with temporal resolution down to nanoseconds and below. High spatial- and temporal-resolution infrared images of thin films on active cathodes might also yield useful information on the active fraction. Emission and fluorescent spectroscopy in the visible and the infrared regions, with both small spot sizes and short data acquisition times, should be done also. Other experimental probes that can operate under various ambient environments are also attractive. Focused x-ray synchrotron emission for both diffraction and, possibly, fluorescence, is an example. It is not guaranteed that any of these techniques offers sufficiently good spatial, temporal or spectral resolution to reveal the LENR activity on surfaces in operating devices. However, they should still be employed in an effort to determine the fraction of the surfaces that is usefully active. 6. Areal Reaction Rates (N/[A x T]) The number of reactions per second (Hz) per unit area is a parameter no less important than the total and fractionally active areas. This cannot even be guesstimated reasonably. Experimental values are hard to obtain because of all the other parameters that link this factor to the measured total power generation rate. Theoretical estimates are needed, but few are available. The theory due to Widom and Larsen involves concepts that are limited to the near surface region of materials. They provide estimates and an expression for areal reaction rates [14]. Their estimate of the areal reaction rates is 1012 to 1014 reactions/second/cm2, that is, about 1013 Hz/cm2.
It must be emphasized that the areal reaction rate may be the result of any of the diverse mechanisms proposed for the occurrence of LENR. The mechanisms already proposed fall into two broad categories, point reactions of second (two body) and higher orders, as well as a variety of cooperative and coherent mechanisms. Making predictions of
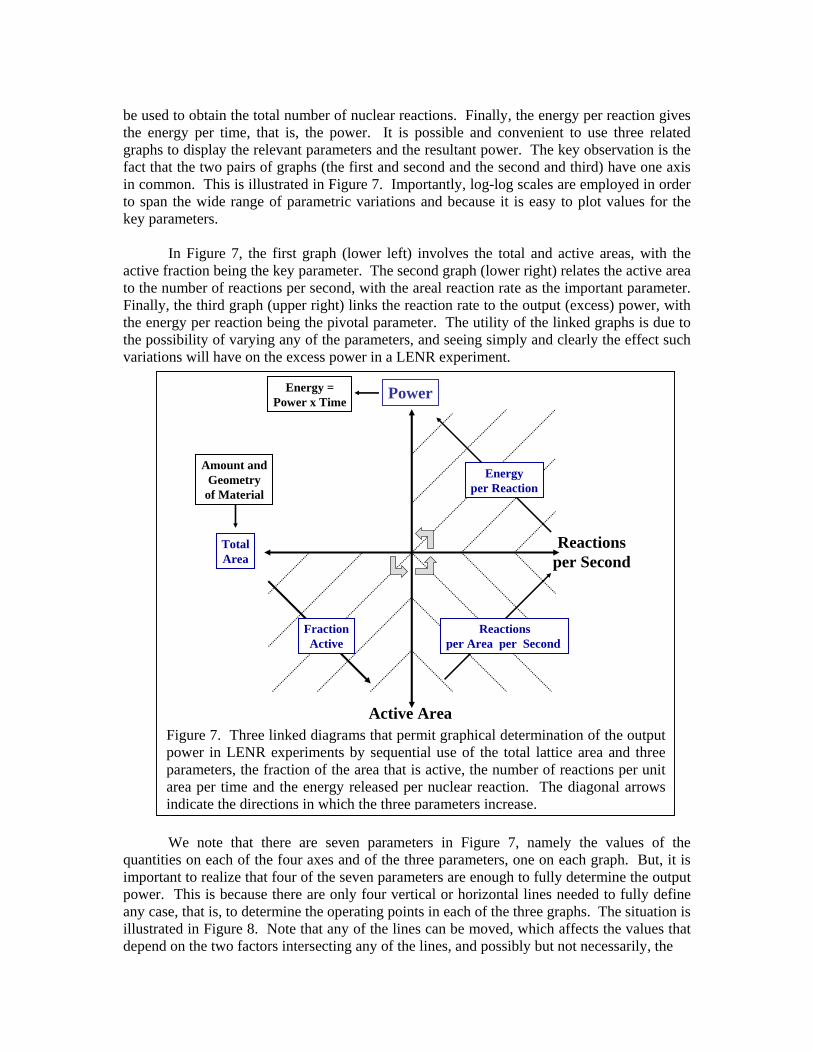
quantitative reaction rates based on any mechanism is the central challenge to theoreticians in the field. The computed rates might be limited by any of several factors, including the supply of reactants, the fundamental rate of reactions once the reactants are in place, or even the removal rate of products, if their presence can influence the basic reaction rates. 7. Energies per Reaction (E) The energies released per nuclear reactions are known much better than the reaction rate per area. This fact is due to decades of experiments using accelerated ions. Energies released in exothermic nuclear reactions, or absorbed in endothermic nuclear reactions, are the energy equivalents of the mass differences between the initial and subsequent nuclei. The mass difference between the initial and final isotope after a reaction is called the Q value. It is commonly quoted in units of MeV/c2. It was realized over 70 years ago that measured reactions energies would enable more precise determination of atomic weights [15]. There are now two useful web-based sources of nuclear reaction energies [16,17]. In very general terms, most of the energies given off in nuclear reactions are in the MeV range. For example, for energetic deuterium-deuterium fusion, the two main branches give 2.45 MeV (for the neutron and 3He path) and 3.0 MeV (for the proton and triton branch). These occur with 50% probabilities. The third branch, production of 4He, has a very low fractional probability (10-7), but yields 24 MeV per reaction. In several LENR experiments, both heat and 4He were measured, and they were correlated. In general, the energy released per nuclear reaction (evidenced by the appearance of 4He) is near 24 MeV. This correlation was first found by Miles [18] and reviewed by Bressani [19]. McKubre and his colleagues found values for the MeV to 4He ratio that are near 31+/-13 and 32 +/-13 MeV per helium atom in a gas loading experiment [20]. These relatively high values might be due to the inability to capture and measure all of the He atoms that were produced in the experiments. For the purposes of this study, it is convenient to consider reaction energies in LENR experiments to be in the range of 2 to 20 MeV. When all the parameters discussed in the last four sections are known with more precision, and the precise reaction paths are known, then tabulated values for the specific reactions can be used in estimating the power output of a particular experiment. There are mechanistic questions that relate to the both the magnitude and the disposition of energies produced by LENR, just as there are questions of the type and strength of mechanisms leading to areal reaction rates. If LENR have branching ratios very different from those measured in energetic beam experiments, the distribution of the kinetic energies of the reaction products can also be different. A central question is how the energy released in a LENR couples to the lattice without the significant emission of high energy radiations or residual radioactivity. This is another key challenge for theoreticians. Although alternatives for post-reaction energy coupling have been proposed, there is no unanimity in the field at present. 8. Graphical Relationships The parameters discussed in the last four sections can be used sequentially to estimate the power available from a LENR experiment. The active fraction links the total surface area to the total active surface area. Then, the number of reactions per second per active area can
be used to obtain the total number of nuclear reactions. Finally, the energy per reaction gives the energy per time, that is, the power. It is possible and convenient to use three related graphs to display the relevant parameters and the resultant power. The key observation is the fact that the two pairs of graphs (the first and second and the second and third) have one axis in common. This is illustrated in Figure 7. Importantly, log-log scales are employed in order to span the wide range of parametric variations and because it is easy to plot values for the key parameters. In Figure 7, the first graph (lower left) involves the total and active areas, with the active fraction being the key parameter. The second graph (lower right) relates the active area to the number of reactions per second, with the areal reaction rate as the important parameter. Finally, the third graph (upper right) links the reaction rate to the output (excess) power, with the energy per reaction being the pivotal parameter. The utility of the linked graphs is due to the possibility of varying any of the parameters, and seeing simply and clearly the effect such variations will have on the excess power in a LENR experiment.
We note that there are seven parameters in Figure 7, namely the values of the quantities on each of the four axes and of the three parameters, one on each graph. But, it is important to realize that four of the seven parameters are enough to fully determine the output power. This is because there are only four vertical or horizontal lines needed to fully define any case, that is, to determine the operating points in each of the three graphs. The situation is illustrated in Figure 8. Note that any of the lines can be moved, which affects the values that depend on the two factors intersecting any of the lines, and possibly but not necessarily, the
Power
Reactionsper Second
Active Area
TotalArea
FractionActive
Reactionsper Area per Second
Energyper Reaction
Amount andGeometry
of Material
Energy =Power x Time
Figure 7. Three linked diagrams that permit graphical determination of the output power in LENR experiments by sequential use of the total lattice area and three parameters, the fraction of the area that is active, the number of reactions per unit area per time and the energy released per nuclear reaction. The diagonal arrows indicate the directions in which the three parameters increase.
power output. As one example, if the active fraction F is constant, increasing the total area will first increase the active area and, then both the reactions per second and the output power, if the areal reaction rates and energies per reaction are constant. However, the active area can
Power
Reactionsper Second
Active Area
TotalArea
FractionActive
Reactionsper Area per Second
Energyper Reaction
Figure 8. Four of the factors suffice to determine the entire situation for the three graphs. Any of the vertical lines can be moved to adjust the operating points in one or more of the graphs.
Power
Reactionsper Second
Active Area
TotalArea
Known
Derived
FractionActive
Reactionsper Area per Second
Energyper Reaction
Figure 9. Illustration of how the trio of graphs can be used with four known factors to derive the three others.
be constant and the output power constant if an increase in area is just balanced by a decrease in the active fraction. This would be the case if all the new area were inactive. There is another use of the linked graphs that makes it possible to estimate values of otherwise poorly known or unknown parameters in LENR experiments. The point is, since four parameters completely determine a particular situation, but there are seven total parameters, three can be derived in some cases. This is illustrated in Figure 9 for one set of circumstances. In the case shown, the power from an experiment and the reaction energy are known. This determines the position of two of the four lines and gives the reaction rate. If the areal reaction rate is known, the position of another line and another parameter is determined. That is, the active area is then known. Finally, use of the total area sets the last line and the active fraction can be determined. This exploitation of the linked graphs can be made quantitative using Figure 10. If an experiment gives an excess power of 10 W and the reaction rate is taken to be 24 MeV, then the reaction rate is close to 1012 Hz. Using an areal reaction rate from the theoretical estimate of Widom and Larsen, namely 1013 Hz per centimeter squared, indicates that the total active area is a few times 0.1 cm2. It the total surface area is known to be 10 cm2, then we have a value for the active fraction on the order of 10-2, that is, a few percent. This is the initial estimate of a parameter that is key to power and energy production with LENR, but has yet to be either measured or calculated from theory. If the total area in the experiment were ten times less, then the active fraction would have to be ten times higher.
cm2
TotalArea
cm2 Active Area
W
Hz
ActiveFraction
J
Hz/cm2
W-L
10 W
10 cm2
1013
24 MeV
10-2
Figure 10. Illustration of how an active area fraction of 1% can be determined, if the other factors have the indicated values.
Two things should be noted about the set of liked graphs. First, the active fraction is 1.0 or less. That is, there is a part of the total and active area graph that is excluded. The second is related to the common observation during a LENR experiment, namely the variation of the excess power with time. It the horizontal line cutting the excess power axis moves up and down, and the reaction energy is fixed, then the reaction rate and the vertical line intersecting that axis must vary. If the total area is fixed, then either (or both) of the active fraction and the areal reaction rate must vary. This clearly points to the determination and control of these two parameters as being among the major challenges of the field, both for scientific understanding and engineering utility. Finally, we note that the set of linked graphs can be overlaid to indicate the range of variations for each of the seven parameters. Observed powers in LENR experiments have usually fallen in the 10 mW to 10 W range. The lower value is set by calorimetric limit of detection in many cases. The upper limit has been exceeded in only a few cases. We already noted that reaction energies of 2 to 20 MeV are reasonable, and can be refined as more in known. There are no independent values for total reaction rates, but use of the two variations just cited gives reaction rates that can fall in the range of a few times 109 to a few times 1013 Hz. Areal reaction rates are not available from experiment, but have been estimated theoretically to be in the range 1012 to 1014 reactions/second/cm2, as already noted. Total surface areas are known for simple electrode geometries, such as the rod shown in Figure 5. However, total areas for finer, more complex micro- and nano-scale materials are unknown. Their determination is an experimental priority. Certainly, the set of three graphs is not necessary to make estimates of the power or other four factors that appear in equation (2) and Figure 4. If all four of the factors are known, computation of the power is straightforward. For example, a total area of 100 cm2, an active fraction of 10%, an areal reaction rate of 1013 Hz/cm2 and a reaction energy of 24 MeV would yield a power output of about 4 W, where the conversion factor of 1.6 x 10⁻¹⁹ J/eV was used. In a similar fashion, it is possible to calculate the total area needed for a specific desired power output. If an output power of 1 kW was desired for the same active fraction, areal reaction rate and energy per reaction, then a total surface area of 1/4th of a square meter (2.5 x 103 cm2) would be required. The total area and the energy per reaction are not zero. The total area is controllable, even if it is not known precisely. The particular reaction in an experiment, with its characteristic released energy, may eventually be under control. If there is no nuclear power in a particular LENR experiment, then either or both of the active fraction or the areal nuclear reaction must be zero. Again, it is difficult to overemphasize the importance of understanding and controlling these two factors. The use of surfaces structured on the nanometer scale might enable the needed control, or at least, improve the performance of a LENR device. 9. Maximization of Outputs For almost all energy sources, the maximization of the output power is a serious consideration, because the highest available powers limit applications. This is expected to also be the case for energy sources based on LENR. Figure 11 indicates four parameters that can be increased to improve the power output of a LENR reactor.
There are limits to the values for each of the four factors and, hence, to the maximum power that can be expected from a LENR reactor. The limits for each of these parameters will be discussed in turn. Surface Area. This factor is the one that can be varied widely to scale up the power available from LENR. Catalysts can have areas exceeding 1000 centimeters squared per gram of material. If a kilogram of catalyst is used, one million square centimeters meters of surface area are available for LENR. Support of such a large amount of catalyst, and the transport of material to it, and heat and products away from it, would be major mechanical and thermal engineering challenges. Active Fraction. This cannot exceed unity. It might not prove possible to achieve a high active fraction over all of the available area. The magnitude and willful control of the active fraction is one of the major scientific and engineering challenges in the field of LENR. Areal Reaction Rate. There are 1.3 x 10¹⁵ square "holes" over the half octahedral sites on the surface per square centimeter of the (100) surface of Pd. Hence, if there are on the order of 1015 reaction sites per square centimeter of surface area, and one reaction per second can occur at each, then 1015 reaction per second per square centimeter are possible. Again, this is a very high estimate, but it serves to permit calculation of maximum power production rates. Energy per Reaction. The output energies for nuclear reactions are on the order of 10 MeV, typically in or near the 2 to 20 Mev range, as noted above. Taking the most optimistic values cited above for each of the four factors yields energy production rate of 3 x 10⁹ watts. This is almost certainly a very unrealistically high number. Scaling the surface area back by 100, making the active fraction 1% and reducing the areal reaction rate by 100 still gives a power of 3 kilowatts. Realization of such a power seems unlikely in the foreseeable future. Besides the material transport challenges, the melting points of reactor materials will provide limits. However, the point of these estimates is that, in principle, very large powers are possible from LENR reactors. Further, the new field of LENR reactor design will be quite complex, as is the current design of fusion reactors.
Reactionsper Second
Active Area
Power
TotalArea
Addition orDeposition
Activation
Poisoning
BetterReactions
HigherAreal Rates
Figure 11. Four parameters can be changed in order to maximize the power output from LENR. The first is to increase the surface available for LENR by addition or deposition of more solid substrate. The second is to improve the active fraction either by reducing poisoning or by activating new areas. The third is to increase the LENR areal reaction rate. Finally, the use of nuclear reactions that yield more energy per reaction may be possible.
10. Relations to Past Parametric Work This certainly is not the first paper to discuss relations that give the output power from LENR in terms of various factors. McKubre and his colleagues provided an empirical
equation that relates the excess energy production rate, the excess power (Pxs), to three factors, as given by equation (5) [21,22]. The factors are the loading fraction (X = D/Pd) over a threshold, the electrical current density (I) in mA per square centimeter, again above a threshold, and the deuteron current density (ID), also in mA per square centimeter. M is the proportionality constant. Note that the electron flux is about 100 times that of the deuterons. For reference, 10 mA per cm2 corresponds to the movement of about 20 singly charged quanta (deuterons, in this case) through each lattice cell face of Pd each second. It is clear that the factor X (the ratio of the number of deuterons D to the number of Pd atoms in the cathode) involves the bulk of the cathodes, which were 1 mm in diameter for the values given above. Initially, McKubre and his colleagues used the rate of change of the bulk loading X, that is, dX/dt, in place of the deuteron surface flux. That bulk loading change rate is related to the deuteron flux rate through the surface by numerical factors, one of which is the geometry-dependent ratio of the bulk volume to the surface area. That is, using either dX/dt or ID can be accommodated by an adjustment in the factor M.
We note that, if the deuteron concentration at the surface is what is important, then it is also necessary to achieve and maintain high bulk loading. That is, it is not possible to have a high surface loading if the bulk has a lower loading, due to the rapidity with which hydrogen isotopes diffuse within metals. The quadratic behavior of the excess power on the surface loading could be taken to imply two-body collision dynamics. However, such a simplistic interpretation ignores collective effects that might be active in the surface region. Both the electron flux factor I and the deuteron flux factor ID evidently involve the surface of the cathode. The linear dependence of the excess power on both flux terms, and the very different values for the electrons and deuterons, are difficult to interpret mechanistically from the empirical behavior. However, it is clear that equation (5) involves three quantities, all of which are relevant to the surface of the cathode. How are the terms in equation (5) related to the factors given in equation (2) and discussed above in this paper? For the experiments that were the basis of equation (5), the surface area of the cathodes was constant. It is reasonable to assume that the energy per nuclear reaction was also constant, that is, the type of reaction giving the excess power did not change during the experiments. That leaves only the active fraction and the areal reaction rates as possible variables to account for the behavior summarized in equation (5). How the surface loading (X), and the electron and deuteron fluxes, can result in changes in either of these two factors is not clear from the empirical relationship. The dependence of the active fraction on experimental conditions is one of the primary unsolved questions for LENR. Possibly that fraction is determined mainly by local chemical conditions, and it is the areal reaction rate that varies with the surface loading and fluxes.
Pxs = M (X-X°)2 (I-I°) |ID| (5)
where X°~0.875, I°=50-400mA cm-2 and ID=1-10 mA cm-2
Another major relationship between the production of excess power, and also nuclear ash, was found by Swartz [23]. Data from his work, and from papers of others, which he replotted, are given in Figure 12. Swartz identified the input electrical power as the key variable. He showed that the production of heat with both Pd and Ni cathodes and the production of tritium and helium nuclear ash, in very different experiments, all exhibited peaks as a function of input power. Swartz calls the input power values, at which peak outputs occur, "optimum operating points" because they give the greatest outputs. If the ratios of products (heat or ash) were plotted against input power, the locations of the peaks would shift somewhat. The observed locations of the peaks, plotted either way, call for explanation. However, it is clear that the input power is a salient variable in several LENR experiments. This situation applies to many scientific and engineering systems.
The emphasis in input powers by Swartz has other advantages. It encourages attention to power gain, that is, the ratio of output to input powers, a measure of reactor efficiency. Further, it draws attention to the overall flow of energy into and out of LENR reactors, something of clear importance to the engineering of such power sources. So again, a question arises concerning how the empirical optimum operating points are related to the factors of interest in this paper. Since the input power is the product of the voltage applied to the cell and the current flowing through the cell, we see that again, the electrical current, and hence the electrical flux for the constant geometry of the experiments, is a relevant variable. The behavior observed in Figure 12 could be due to the product of two factors, one of which increases with input power while the other decreases as that power increases. The unanswered question remains whether the variation in input power changes the active fraction or the areal reaction rate, again for the constant area and probably constant reaction energies.
Figure 12. Plot of the dependencies of the production of heat and nuclear products on the input power to electrochemical experiments. The horizontal axis is Watts.
The empirical relationships between experimental parameters and results, just discussed, have two impacts. First, they provide practical guidance to future experiments. Second, they focus the discussion of mechanisms on two of the key parameters in the current analysis, the active fraction and the areal reaction rates. 11. LENR within Solids It must be noted that the possibility of some LENR occurring within the bulk of solids is not entirely ruled out now. If this is clearly shown to happen, then a volumetric analysis similar to that above for surface reactions can be developed. In the volumetric case, the total volume of the solid in an LENR experiment and the fraction of that volume that is active would be relevant. The number of reactions per second per cubic centimeter would then apply. That is, the lower two graphic in Figures 7 through 11 would be replaced by their volumetric equivalents. Because of the great complexity of the compositions and structures within materials, as indicated schematically in Figure 2, the analysis for bulk LENR could be more complicated than that for surface reactions. If LENR were occurring at both surface and bulk locations, a combination of the two analyses would be appropriate. Of course, the number of needed parameters would then be roughly twice as great as for the surface case discussed in this paper. It is noted that a single formulation could be developed to embrace both surface and bulk reactions. In the absence of variations parallel to the surface for regular geometries, the depth below the surface could serve as a primary variable. The active fractions, areal reaction rates and reaction energies would apply to small volume elements in the surface region and within the bulk. Such an integrated formulation would collapse to either limiting case, depending on the depth distribution of the active fraction and areal reaction rates. That is, if either of these parameters were zero in the bulk, then there would be reactions only on the surface (uniformly distributed). If either of the parameters were zero in the surface region, the LENR would occur only in the bulk. A full three-dimensional analysis would be needed to handle non-uniformities parallel to the surface, or complex geometries, such as metallic particles. Computing the flow of heat, the diffusion of reaction products or the emergence of energetic quanta for that case would be quite complicated, but fully within the capabilities of modern simulations. It must be noted that, from a practical viewpoint, there are two generally undesirable aspects of having LENR occur within materials. The first is the need to get reactants to and remove products from the reaction regions. In the surface case, this can be done partly or entirely by convection within a liquid or gas, or by particle transport within a plasma. In the bulk case, diffusion of heavy atoms inevitably would be the rate limiting process. The second concern is the inability to quickly change conditions within a material for control purposes. For some applications, rapid control is not necessary. However, the range of applications of bulk LENR would seem to be less than that for surface LENR. 12. Control of LENR Power Sources The graphical relationships presented and discussed above have implications beyond those already discussed. It has already been emphasized that applications of LENR will require reproducible production of power or other desired factors [24]. Without causal
relations between what goes into a LENR device and what comes out of the device, it is essentially impossible to use such reactions, except for research. Even if reproducibility of behavior is assured, the reactions must also be controllable. That is, applications demand the ability to turn on, turn up, turn down and turn off a source of power, materials or radiations. That is, triggering, acceleration, deceleration and quenching of the power producing reactions are all necessary for practical energy sources. Finally, optimization of the performance has to be considered. Even if a power source is reliably reproducible and controllable, its economic value will depend on minimizing input costs for equipment and materials and maximizing the desired outputs in order to overcome thermal inefficiencies and produce power or work. The factors relevant to the presented graphs, which were discussed in sections 4 through 7, must have specific behaviors for a LENR experiment to be reproducible. Either all the factors must remain constant or there must be compensations in one or more factors as another of them changes, which is probably unlikely. If one factor changes, even with the same equipment, materials and procedures, and there are not changes in any of the other factors, the output power will vary. Triggering of LENR is the first step in their overall controllability. Cravens and Letter provided a summary of triggering methods [25]. McKubre and his colleagues discussed four requirements, related to equation (5) for the initiation of LENR [26]. The first two are the achievement of high loading for long times. These were preparatory steps. Then, the imposition of both high electron and deuteron current densities activate the reactions to produce excess power and heat, plus nuclear ash and, possibly, energetic radiations. Letts and Cravens [3] and Swartz [4] first reported the use of laser irradiation of cathode surfaces in electrochemical cells to trigger the production of excess power. This effect has been well verified in other laboratories. Claytor and his colleagues found that making changes in the plasma conditions in a glow discharge experiment sometimes triggered changes in the production of tritium [27]. Other instances of variations of excess power in response to alteration of experimental conditions can be cited. For example, many researchers observed that the excess power varies as the current density into the cathode of varied, as shown in Figure 3. In the framework of this paper, triggering would result in one or more the factors in the graphs being increased to the point that the excess power exceeds the measurement threshold in a particular calorimetric experiment. The area and the energy per reaction are fixed in most experiments, so the active areal fraction and the areal reaction rates are candidates for increases to turn on energy, materials or radiation production. Since we do not know now what in an experiment controls either the active fraction or the areal reaction rate, it is not currently possible to specify ways in which to control these factors. We clearly know how to control the production of power by an internal combustion engine by varying the input rates of fuel and air. Control of nuclear fission reactors is also well established using neutron absorbing rods. There are no analogous fast control parameters for LENR now. However, we can anticipate their development and, also, the appearance of longer-term effects somewhat similar to those in current engines and reactors. In hydrocarbon-burning motors, there can be gradual accumulations of deleterious materials, which have to be either prevented or cleaned away. In reactors, the fuel rods become depleted of fissionable materials over time and must be replaced. In seems likely that, even when LENR can be fully controlled on short time scales, there will still be some longer-term effects
that must be considered. The delivery of reactants to the right sites and, especially, the removal of products, are inevitable challenges. It might be necessary to cycle the chemistry within an LENR reactor to remove products and refresh the surfaces on which reactions occur. This would be analogous to the manner in which ion-exchange water softeners were recharged periodically. In short, there will be some commonalities with, as well as differences from current thermal and chemical engineering systems. Some engineering aspects of LENR energy sources will be discussed in the final section. Next, we pause to note the enticing relationships between LENR and the emerging nano-materials industries. 13. LENR are Part of Nano-Science and Nano-Technology It is widely known that funding agencies in the America, Europe and Asia greatly increased support for nano-science and nano-technology in the past decade. Remarkable materials, whose properties are new and dependent on nano-meter scale effects, are under development or already commercialized. It is interesting that the independent development of a robust experimental case for the existence of LENR was contemporaneous with the explosive growth in nano-science and technology. This was accidental and not causal. There are at least two reasons for LENR experiments to be viewed as a part of nano-science and -technology. The first is simply the size scale of the materials that are and can be involved in the production of energy, materials or radiation by LENR. If LENR occur on or near the surfaces of materials, the maximization of surface area for a given amount (volume or weight) of the substrate material will be economically compelling. Section 4 presented the case for using nano-meter sized materials. As already noted, nano-meter scale particles have been used in very successful LENR experiments [5,10]. Figure 13 gives micrographs of nanometer-scale Pd and Ni structures from the recent literature. Nano-scale materials relevant to LENR are already commercialized. However, their cost is a current and durable concern.
The second reason why LENR can be viewed as a part of nano-science and -technology is less certain now. It is possible that the active areas on the surface of a LENR substrate have lateral dimensions below a micrometer. The difficulty in understanding the essential parameters that determine the outcome of LENR experiments might be due to appropriate conditions existing in only very small regions for very short times. Such regions might turn on and off during an experiment, and might vary widely in size and duration. There is little direct experimental evidence for sub-micrometer active regions being important. Diagnostic equipment with the needed spatial and temporal resolution has not been brought to bear in LENR experiments. It is possible to immerse high power microscope objectives near
Figure 13. Micrographs of nano-structured materials relevant to LENR. Left: Pd nano-wires about 100 nm in diameter [28]. Center: Pd nano-particles about 100 nm in diameter, many of them grouped to form nano-wires [29]. Right: Commercial Ni nano-particles generally near 200 nm in diameter [30].
cathodes in LENR experiments in order to obtain images with sub-micrometer spatial and sub-millisecond time resolution. The use of an Atomic Force Microscope (AFM) to examine the surfaces of cathodes within electrolytes during active LENR experiments would not be as simple, but should also be feasible. In short, the vast array of surface diagnostics, now of use in catalysis and other areas of science and technology, has not been employed in LENR experiments, primarily due to lack of financial support. It is well known that the structures, including lattice constants of nanometer-scale materials are different than those of the bulk of the same materials. It is entirely unclear now whether such changes will improve or degrade the production of LENR. Similarly, it is well understood that the local order in amorphous materials is quite similar to the local order within ordered samples of the same materials. But, here again, it is not known now, either experimentally or theoretically, if the long range structure of a materials is relevant to the production of LENR. 14. Conclusion Early in the study of LENR, many people thought that all the reports were wrong, the result of errors or fraud. Because of the strong experimental basis that now exists, it is clear that mistakes or lies cannot account for all the published results. Hence, there is at least new science, which could rejuvenate the old field of nuclear physics [31]. There are many experiments that can be done to help elucidate the mechanisms active in LENR. Some were mentioned in the last section. Others were presented and discussed by Hubler [32]. It remains to be seen if technological capabilities or engineering designs will result from the science. The overall situation is sketched in Figure 14. The key question is how far LENR will go towards forming the basis for businesses and then having high-level impacts. The viewpoint touted in this paper essentially gives a new dimension to the basic study of LENR. This is indicated schematically in Figure 15. Frequently, scientists attempt to link directly the outputs of experiments to the input conditions. This approach has had some limited success for LENR to date, as discussed above. The new viewpoint of this paper is to define what are essentially engineering parameters, and to attempt to link them first to the experimental
FourParameters
ExperimentalObservations
ExperimentalConditions
Usual Perspective
New Perspective
Figure 15. The role of the four parameters in equation (2), the total area, active fraction, areal reaction rates and energies per reaction.
Basics:Science, Technology and Engineering
Business:Prototypes, Products and Profits
Impacts:Economic, Social and Political
Figure 14. The three levels that might become germane to LENR, which is now on the level of fundamental research and development.
conditions and then to the experimental results. The linkage to conditions is challenging and still largely unknown. The linkages to the output energy, materials or radiation are quite simple, and presented above. There are many examples in science and engineering of multiple levels of detail. The relationships of quantum mechanics to statistical physics to thermodynamics are widely known. Detail is lost at each higher level, but there is still utility for both science and engineering. It seems that the same might be true for the field of LENR. It was already noted that the design and manufacture of practical sources of energy, materials and radiations will not merely be the application of existing engineering practices. Most current sources of energy, notably combustion and fission fuel rods, are three-dimensional in nature. If surface reactions are the dominant mode for LENR, then the flows of energy and matter will be quite different than for current combustors and reactors. There will certainly be commonalities in the basic science and in some of the codes used for design and simulation. However, an energy source based on LENR might be quite like an automobile radiator with a large surface area to enable the transfer of significant energy even if the temperature gradients are not large. It is important to put current and potential LENR energy sources in perspective. Now, electricity from the grid costs about $0.10 per kW-Hr in the U. S. This is equivalent to 3.6 MJ. In the past, few LENR experiments have demonstrated the ability to produce excess powers of 100 W. Such a source would have to be run for 10 hours to provide 3.6 MJ. The more common LENR level of 10 W would require 100 hours of operation to produce this amount of energy. The point is that there is a great deal of engineering, especially the scaling of output powers, as well as controllability and reliability, needed for development of competitive LENR energy sources. If the task seems daunting, the possibilities for output powers that were presented and discussed above are enticing. History also provides lessons in the scaling of technologies. Early silicon boules grown for semiconductor electronics were a few centimeters in diameter. Now, wafers 45 centimeters in diameter are being produced, and are moving into routine production. The research, development and engineering of sources of energy, materials and, possibly, radiations based on LENR are likely to be challenging for many years to come. Acknowledgements Assistance from A. Imam, M.C.H. McKubre, M. E. Melich, G. W. Phillips and E. Storms is greatly appreciated.
References
1. Beaudette, C. G. “Excess Heat: Why Cold Fusion Research Prevailed” (Second Edition), Oak Grove Press (2002) 2. Storms, E., “Review of Experimental Observations about the Cold Fusion Effect” Fusion Technology, Vol 20 (1991) p. 433. 3. Letts, D. and Cravens, D. “Laser Stimulation of Deuterated palladium: Past and present” in Hagelstein, P. L. and Chubb, S.R. (Editors), Condensed Matter Nuclear Science, Proc. of the 10th International Conf. on Cold fusion, World Scientific (2006) pp. 159-170 5. Swartz, M. R. “Photo-Induced Excess Heat from Laser-Irradiated Electrically Polarized Palladium Cathodes in D2O” in Hagelstein, P. L. and Chubb, S.R. (Editors), Condensed Matter Nuclear Science, Proc. of the 10th International Conf. on Cold fusion, World Scientific (2006) pp. 213-225
5. Arata, Y. and Y.C. Zhang, “Reproducible "Cold" Fusion Reaction Using A Complex Cathode” Fusion Technology, Vol 22 (1992) p. 287. 6. Iwamura, Y. et al, “Observation of Nuclear Transmutation Reactions Induced by D2 Gas Permeation through Pd Complexes” in Biberian, J.-P. (Editor) Condensed Matter Nuclear Science, Proc. of the 11th Int’l. Conf. on Cold fusion, World Scientific (2006) pp. 339-350. 7. Storms, E. “The Science of Low Energy Nuclear Reaction”, World Scientific (2007) 8. Dominguez, D. D., Hagans P. L. and Imam M. A., “A Summary of NRL Research on Anomalous Effects in Deuterated Pd Electrochemical Systems”, Report NRL-MR-6170 (9 January 2996) 9. Szpak, S. et al, “The Effect of an External Electric Field on Surface Morphology of Co-deposited Pd/D Films”, J. of Electroanalytical Chemistry, Vol 580 (2005) pp. 284–290 10. Arata, Y. and Zhang, Y, “Development of Compact Nuclear Fusion Reactor Using Solid Pycnodeuterium as Nuclear Fuel” in Hagelstein, P. L. and Chubb, S.R. (Editors), Condensed Matter Nuclear Science, Proc. of the 10th International Conf. on Cold fusion, World Scientific (2006) pp. 139-157. 11. Condon, J. B. “Surface Area and Porosity Determinations by Physisorption: Measurements and Theory”, Elsevier Science (2006) 12. Gold Leaf Thickness, http://hypertextbook.com/facts/1999/JeniferVilfranc.shtml 13. Storms, E. “Some Thoughts on the Nature of the Nuclear-Active Regions in Palladium” in Okamoto, M. (Editor) Progress in New Hydrogen Energy, Proc. of the Sixth International Conference on Cold Fusion, New Energy and Industrial Technology Development Organization, (1996) pp. 105-112. 14. Widom, A. and Larsen, L. “Theoretical Standard Model Rates of Proton to Neutron Conversions Near Metallic Hydride Surfaces” http://arxiv.org/PS_cache/nucl-th/pdf/0608/ 0608059v2.pdf 15. Wilson, H. A. “The Calculation of Atomic Weights from Nuclear Reaction Energies”, Proc. of the Royal Society of London. Series A, Math. & Phys. Sci., Vol. 154, No. 883 (1936), pp. 560-563 16. National Nuclear Data Center, http://www.nndc.bnl.gov/ 17. LBNL Isotopes Project, http://ie.lbl.gov/toi.html 18. Miles, M. et al, “Correlation of Excess Power and Helium Production during D2O and H2O Electrolysis Using Pd Cathodes” J. Electroanalytical Chemistry, Vol 346 (1993) p. 99 19. Bressani, T. “Nuclear Physics Aspects of Cold Fusion Experiments: Scientific Summary after ICCF-7” in Proc. of the 7th Int’l.Conf. on Cold Fusion. ENECO, Inc., (1998) pp. 32-37. 20. McKubre, M.C.H. et al, “The Emergence of a Coherent Explanation for Anomalies Observed in D/Pd and H/Pd System: Evidence for 4He and 3He Production” in F. Scaramuzzi (Editor) Proc of the 8th Int’l. Conf. on Cold Fusion. Italian Physical Society (2000) pp. 3-10 21. McKubre, M.C.H. et al, “Concerning Reproducibility of Excess Power Production” in Proc of the 5th International Conference on Cold Fusion., IMRA Europe (1995) pp. 17-33. 22. McKubre, M. C. H., “Cold Fusion at SRI: An 18 Year Retrospective (and Brief Prospective”, American Physical Society Meeting, Denver CO (5 Mar 2007) 23. Swartz, M., "Generality of Optimal Operating Point Behavior in Low Energy Nuclear Systems", Journal of New Energy, Vol 4 (#2) (1999) pp. 218-228 24. Nagel, D. J., “Reproducibility, Controllability and Optimization of LENR Experiments” in Biberian, J.-P. (Editor) Condensed Matter Nuclear Science, Proc. of the 11th International Conf. on Cold fusion, World Scientific (2006) pp. 60-69 25. Cravens, D. and Letts, D. “Practical Techniques In CF Research: Triggering Methods” in Hagelstein, P. L. and Chubb, S.R. (Editors), Condensed Matter Nuclear Science, Proc. of the 10th International Conf. on Cold fusion, World Scientific (2006) pp. 171-181.
26. McKubre, M.C.H. et al, “The Need for Triggering in Cold Fusion Reactions” in Hagelstein, P. L. and Chubb, S.R. (Editors), Condensed Matter Nuclear Science, Proc. of the 10th International Conf. on Cold fusion, World Scientific (2006) pp. 199-212. 27. Claytor, T.N. et al, “Tritium Production from a Low Voltage Deuterium Discharge of Palladium and Other Metals” J. New Energ,y Vol 1(#1) (1996) p. 118. 28. Kim, K, et al, "Pulsed Electrodeposition of Palladium Nanowire Arrays Using AAO Template", Materials Chemistry and Physics, Vol. 96 (2006) pp.278-282 29. Shi, Z., Szpunar, J. A. and Wu, S., “Morphological Characterization of Self-Assembled Pd Nanowires by Electroless Deposition”, Microscopy & Microanalysis, 11(Suppl 2), (2005) 30. 200 nm Nickel particles sold by Nano Dynamics,Inc. (http://www.ndmaterials.com/nickel.php) 31. Dean, D. J., “Beyond the Nuclear Shell Model”, Physics Today, (Nov 2007), pp.48-53 32. Hubler, G. K. “Anomalous Effects in Hydrogen-Charged Palladium—A Review”, Surface and Coatings Technology, Vol. 201 (2007) pp. 8568-8573


![3 Untried ‘Optimal’ - LENR-CANR.org · 3 Untried ‘Optimal ... KRUSKAL PARADOX : Qualitatively different physical results predicted according ... [e.g. the Limacon of Pascal]](https://static.documents.pub/doc/80x56/5b2403b27f8b9a8f688b4c49/3-untried-optimal-lenr-canr-3-untried-optimal-kruskal-paradox.jpg)


