Appendix 6.1: Detailed Outcome Tables 191 APPENDIX 6.1: DETAILED OUTCOME T ABLES This Appendix presents graphs comparing various Even Start and control group outcome measures at pretest and posttest. For ease of reading, the graphs have been constructed so that only a portion of the full range of data is shown. The small differences between Even Start and control groups at pretest, or at posttest, may sometimes look large because of the way they are presented. Unless otherwise indicated, these differences are not statistically significant. The Appendix includes the following sets of graphs: Child outcomes o PPVT o Woodcock-Johnson o Story & Print Concepts o Social skills rating system o Vineland o School records Parent report of child literacy Parent outcomes o Woodcock-Johnson o Parent education, GED attainment, employment, income Parent report of parent literacy at home Parent report of parent-child reading Parent report of literacy resources at home Parent report of parent support of child’s school Comparison of pretest parent report data for EDS and ESPIRS samples
Transcript
Appendix 6.1: Detailed Outcome Tables
191
APPENDIX 6.1: DETAILED OUTCOME TABLES
This Appendix presents graphs comparing various Even Start and control group outcome measures at pretest and posttest. For ease of reading, the graphs have been constructed so that only a portion of the full range of data is shown. The small differences between Even Start and control groups at pretest, or at posttest, may sometimes look large because of the way they are presented. Unless otherwise indicated, these differences are not statistically significant. The Appendix includes the following sets of graphs:
Child outcomes o PPVT o Woodcock-Johnson o Story & Print Concepts o Social skills rating system o Vineland o School records
Parent report of child literacy Parent outcomes
o Woodcock-Johnson o Parent education, GED attainment, employment, income
Parent report of parent literacy at home Parent report of parent-child reading Parent report of literacy resources at home Parent report of parent support of child’s school Comparison of pretest parent report data for EDS and ESPIRS samples
Appendix 6.1: Detailed Outcome Tables
192
CHILD OUTCOMES
PPVT Woodcock-Johnson Story & Print Concepts Social skills rating system Vineland School records
Appendix 6.1: Detailed Outcome Tables
193
Exhibit 6.1.1: Child PPVT
73
7774
78
73
78
85
89
77
82
70
75
80
85
90
Pretest Posttest
PPVT
Sta
ndar
d Sc
ore
Even Start (n=110) Control (n=53)Even Start (n=87, all with ECE) Head Start FACESControl (n=26, none with ECE)
PPVT: Measures listening comprehension for spoken works. It assesses children’s knowledge of the meaning of words by asking them to say or point to which of four pictures best shows the meaning of a word that is said aloud.
Even Start children gain from pretest to posttest (4.0 points or .27 std dev) Control children gain (3.6 points or .24 std dev) No significant difference between Even Start and control gains (p<.86) At posttest, Even Start children score at the 6th and Controls at the 8th percentile When we delete Even Start children with no ECE (24 of 111 children were deleted)
the gain for Even Start children is larger (5.4 points or .36 std dev), but still no significant difference between Even Start and control gains
Head Start children (from the FACES study) gain 4.2 points over a year
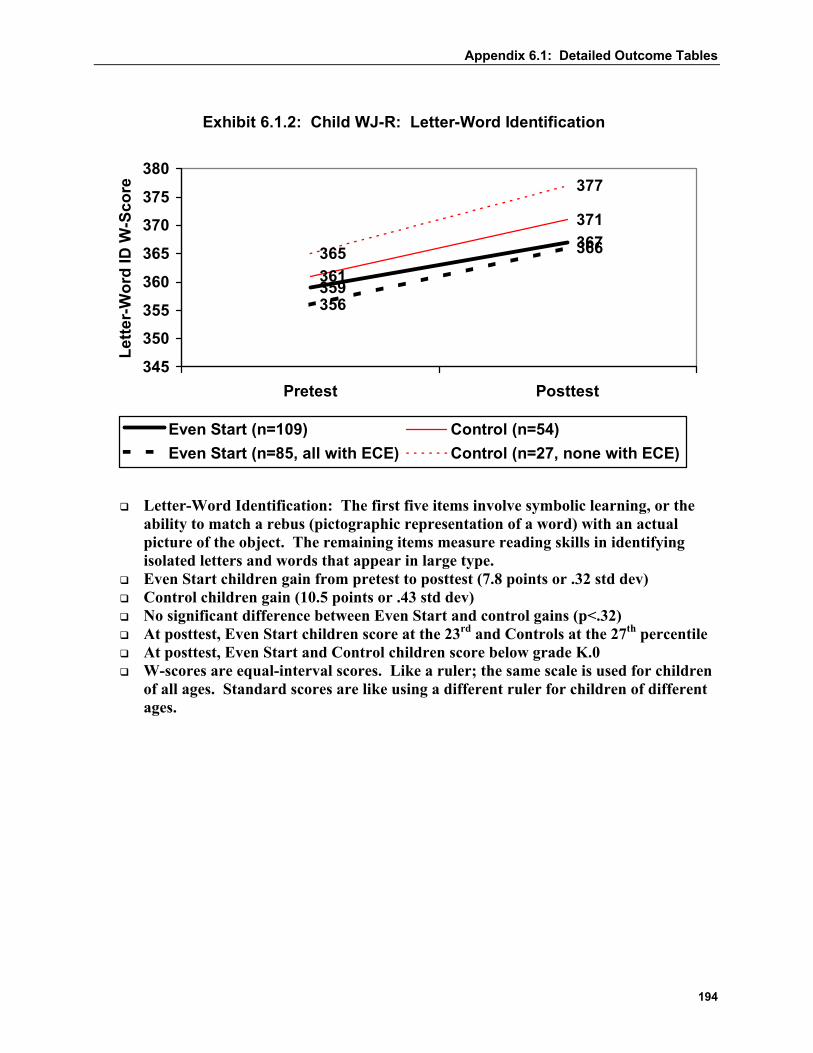
Even Start (n=109) Control (n=54)Even Start (n=85, all with ECE) Control (n=27, none with ECE)
Letter-Word Identification: The first five items involve symbolic learning, or the ability to match a rebus (pictographic representation of a word) with an actual picture of the object. The remaining items measure reading skills in identifying isolated letters and words that appear in large type.
Even Start children gain from pretest to posttest (7.8 points or .32 std dev) Control children gain (10.5 points or .43 std dev) No significant difference between Even Start and control gains (p<.32) At posttest, Even Start children score at the 23rd and Controls at the 27th percentile At posttest, Even Start and Control children score below grade K.0 W-scores are equal-interval scores. Like a ruler; the same scale is used for children
of all ages. Standard scores are like using a different ruler for children of different ages.
Appendix 6.1: Detailed Outcome Tables
195
Exhibit 6.1.3: Child WJ-R: Dictation
333
359
346
366
331
361
348
361
310
320
330
340
350
360
370
Pretest Posttest
Dic
tatio
n W
-Sco
re
Even Start (n=108) Control (n=53)Even Start (n=84, all with ECE) Control (n=26, none with ECE)
Dictation: The first six items measure prewriting skills such as drawing lines and copying letters. The remaining items measure the child’s skill in providing written responses to questions requiring knowledge of letter forms, spelling, punctuation, capitalization and word usage.
Even Start children gain from pretest to posttest (25.5 points or .76 std dev) Control children gain (20.8 points or .62 std dev) No significant difference between Even Start and control gains (p<.49) At posttest, Even Start children score at the 14th and Controls at the 16th percentile At posttest, Even Start and Control children score below grade K.0
Appendix 6.1: Detailed Outcome Tables
196
Exhibit 6.1.4: Child WJ-R: Applied Problems
394
411
394
418
392
412
398
422
375380385390395400405410415420425
Pretest Posttest
App
lied
Prob
lem
s W
-Sco
re
Even Start (n=109) Control (n=52)Even Start (n=85, all with ECE) Control (n=26, none with ECE)
Applied Problems: Measures skill in analyzing and solving practical math problems. Child must recognize the procedure to be followed and then perform simple counting or addition or subtraction operations.
Even Start children gain from pretest to posttest (17.0 points or .80 std dev) Control children gain (24.6 points or 1.15 std dev) No significant difference between Even Start and control gains (p<.06) At posttest, Even Start children score at the 19th and Controls at the 32nd percentile At posttest, Even Start and Control children score below grade K.0
Appendix 6.1: Detailed Outcome Tables
197
Exhibit 6.1.5: Child WJ-R: Incomplete Words
442
452
446
462
441
453
447
460
430
435
440
445
450
455
460
465
Pretest Posttest
Inco
mpl
ete
Wor
ds W
-Sco
re
Even Start (n=107) Control (n=53)Even Start (n=83, all with ECE) Control (n=26, none with ECE)
Incomplete Words: A tape-recorded test that measures auditory processing. After hearing a recorded word that has one or more phonemes missing, the child identifies the complete word.
Even Start children gain from pretest to posttest (10.2 points or .54 std dev) Control children gain (19.5 points or 1.03 std dev) No significant difference between Even Start and control gains (p<.08) At posttest, Even Start children score at the 15th and Controls at the 30th percentile At posttest, Even Start and Control children score below grade K.0
Appendix 6.1: Detailed Outcome Tables
198
Exhibit 6.1.6: Child WJ-R: Sound Blending
447
460
449
460
447
460458
467
435440
445450
455460
465470
Pretest Posttest
Soun
d B
lend
ing
W-S
core
Even Start (n=59) Control (n=32)Even Start (n=45, all with ECE) Control (n=13, none with ECE)
Sound Blending: Measures the ability to integrate and then say whole words after hearing parts (syllables and/or phonemes) of the words. Not given if under age 4.
Even Start children gain from pretest to posttest (12.4 points or .72 std dev) Control children gain (10.6 points or .62 std dev) No significant difference between Even Start and control gains (p<.62) At posttest, Even Start children score at the 24th and Controls at the 32nd percentile At posttest, Even Start children score at grade K.2 and Controls at grade K.2
Appendix 6.1: Detailed Outcome Tables
199
Exhibit 6.1.7: Child WJ-R: Early Development Skills Cluster (Letter-Word Identification + Dictation + Applied Problems)
362
379
366
385
359
380
369
385
345350355360365370375380385390
Pretest Posttest
Early
Dev
elop
men
t Ski
lls W
-Sc
ore
Even Start (n=108) Control (n=53)Even Start (n=84, all with ECE) Control (n=26, none with ECE)
Early Development Skills Cluster: A cluster of scores that provides a quick assessment of broad achievement. Sum of Letter-Word ID, Dictation and Applied Problems.
Even Start children gain from pretest to posttest (17.5 points or .78 std dev) Control children gain (19.2 points or .85 std dev) No significant difference between Even Start and control gains (p<.62) At posttest, Even Start children score at the 12th and Controls at the 17th percentile At posttest, Even Start and Control children score below grade K.0
Appendix 6.1: Detailed Outcome Tables
200
Exhibit 6.1.8: Story & Print Concepts
4.7
5.4
4.7
5.6
3
4
5
6
Pretest Posttest
S&PC
Tot
al S
core
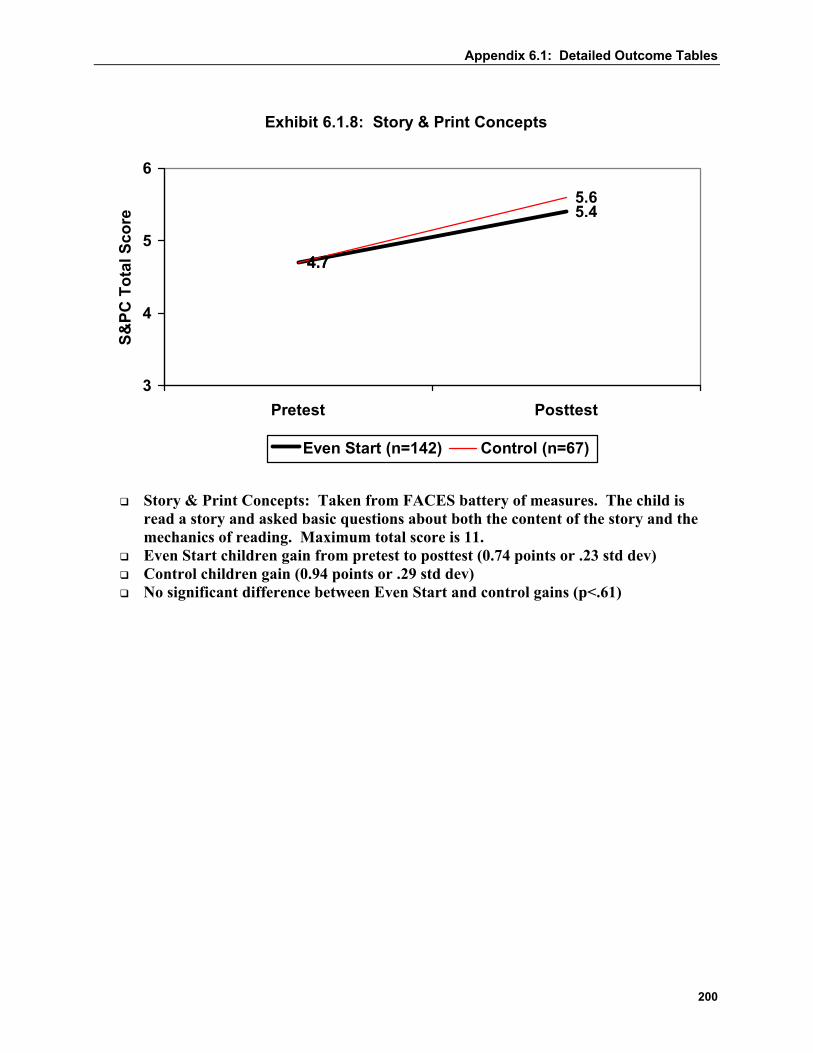
Even Start (n=142) Control (n=67)
Story & Print Concepts: Taken from FACES battery of measures. The child is
read a story and asked basic questions about both the content of the story and the mechanics of reading. Maximum total score is 11.
Even Start children gain from pretest to posttest (0.74 points or .23 std dev) Control children gain (0.94 points or .29 std dev) No significant difference between Even Start and control gains (p<.61)
Appendix 6.1: Detailed Outcome Tables
201
Exhibit 6.1.9: Social Skills Rating System Posttest Standard Scores (Teacher Report)
99.9102.7
97.695.796.7
100.997.5
101
85
90
95
100
105
110
Social Skills -Preschool
Social Skills -Elementary
Prob Behav -Preschool
Prob Behav -Elementary
SSR
S Po
stte
st S
tand
ard
Scor
e
Even Start Control
Teachers need to become familiar with children in order to complete these rating
scales, hence SSRS data were collected only at posttest. Social Skills: 30 items that ask the teacher to rate the child on a three-point scale
(never, sometimes, very often). Measures cooperation, assertion and self-control. A high score indicates better social skills.
Problem Behavior: 18 items (10 for the preschool version) that ask the teacher to rate the child on a three-point scale (never, sometimes, very often). Measures internalizing behaviors (acting sad or lonely), externalizing behaviors (acting out), and hyperactivity (not in the preschool version). A high score indicates more problematic behaviors.
Even Start children scored better than Control children on the Social Skills scale at both the preschool and elementary levels, although the differences are not statistically significant.
Even Start children scored better than Control children on the Problem Behavior scale at the elementary level (5.3 points or .35 std dev, p<.09). This difference is statistically significant and indicates that in elementary school, Even Start children exhibit fewer problematic behaviors than Control children.
Appendix 6.1: Detailed Outcome Tables
202
Exhibit 6.1.10: Vineland Communication Posttest Standard Score (Teacher Rating)
90.6 89.9
80
85
90
95
100
PosttestVine
land
Com
mun
icat
ion
Post
test
St
anda
rd S
core
Even Start (n=127) Control (n=40)
Teachers need to become familiar with children in order to complete the Vineland, hence data were collected only at posttest.
Vineland Communication Standard Score: This scale consists of 63 items that provide an assessment of literacy functioning.
Even Start children score at the same level as Control children.
Appendix 6.1: Detailed Outcome Tables
203
Exhibit 6.1.11: School Record Abstraction(Preschool Level)
65.8
10.4 10.2 7.2
68.7
9.2 6.3 7.1
0
20
40
60
80
100
% DaysAttended
% Days Absent % Ever Tardy % in SpecialEducation
Perc
ent
Even Start Control
Data were taken from school records on days attended, days absent, days tardy, and
referral to special education or presence of an IEP N for % days attended: ES = 83, C = 22 N for % days absent: ES = 75, C = 25 N for % ever tardy: ES = 49, C = 16 N for % in special education: ES = 97, C = 28 No significant difference between Even Start and Control children on any of these
variables at the preschool level
Appendix 6.1: Detailed Outcome Tables
204
Exhibit 6.1.12: School Record Abstraction(Elementary Level)
92.6
5.717.4 12.8
94.8
5.1
25
5.30
20
40
60
80
100
% DaysAttended
% Days Absent % Ever Tardy % in SpecialEducation
Perc
ent
Even Start Control
Data were taken from school records on days attended, days absent, days tardy, and
referral to special education or presence of an IEP N for % days attended: ES = 37, C = 17 N for % days absent: ES = 37, C = 19 N for % ever tardy: ES = 23, C = 8 N for % in special education: ES = 39, C = 19 No significant difference between Even Start and Control children on any of these
Exhibit 6.1.13: Percent of Children Who Know the Alphabet (Parent Report)
8.15
12.45
7.78
17.54
13
20
0
5
10
15
20
25
Pretest Posttest
Perc
ent o
f Chi
ldre
n
Even Start (n=232) Control (n=115) ESPIRS (n=4000)
Even Start children gain from pretest to posttest (4.29%) Control children gain (9.65%) No significant difference between Even Start and control gains (p<.24)
Appendix 6.1: Detailed Outcome Tables
207
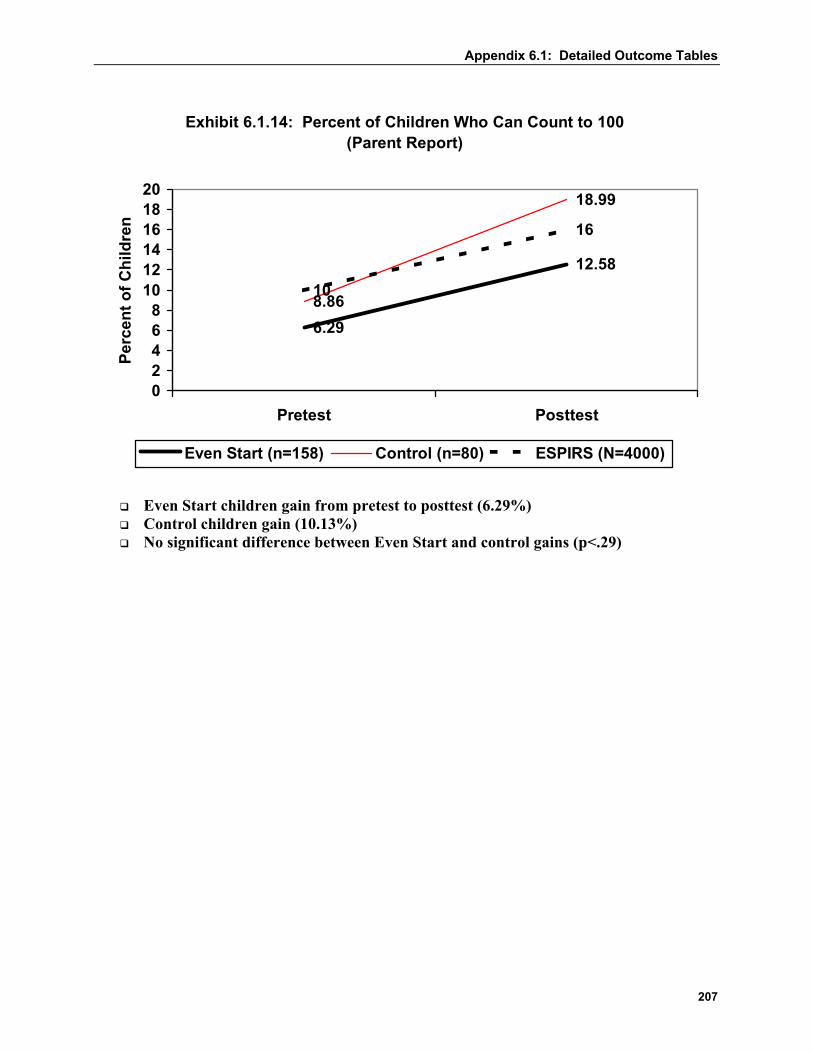
Exhibit 6.1.14: Percent of Children Who Can Count to 100(Parent Report)
6.29
12.58
8.86
18.99
10
16
02468
101214161820
Pretest Posttest
Perc
ent o
f Chi
ldre
n
Even Start (n=158) Control (n=80) ESPIRS (N=4000)
Even Start children gain from pretest to posttest (6.29%) Control children gain (10.13%) No significant difference between Even Start and control gains (p<.29)
Appendix 6.1: Detailed Outcome Tables
208
Exhibit 6.1.15: Percent of Children Who Know Colors Red, Yellow, Blue, Green (Parent Report)
43.31
60.5151.95
66.23
52
71
01020304050607080
Pretest Posttest
Perc
ent o
f Chi
ldre
n
Even Start (n=156) Control (n=78) ESPIRS (n=4000)
Even Start children gain from pretest to posttest (17.20%) Control children gain (14.29%) No significant difference between Even Start and control gains (p<.88)
Appendix 6.1: Detailed Outcome Tables
209
Exhibit 6.1.16: Extent to Which Child <2 yrs, 6 mos Reads(Parent Report, range of 0-4)
0.82
1.86
1.15
2.19
0.9
1.59
0
0.5
1
1.5
2
2.5
Pretest Posttest
Exte
nt to
Whi
ch C
hild
Rea
ds
Even Start (n=56) Control (n=27) ESPIRS (n=4000)
Extent to Which Child Reads (age 0,0 – 2,6): Has values from 0 to 4. Value
increases by 1 if child pretends to read, has memorized book, pretends to read to someone else, has favorite book.
Even Start children gain from pretest to posttest (1.04 points or .95 std dev) Control children gain (1.04 points or .95 std dev) No significant difference between Even Start and control gains (p<.99)
Appendix 6.1: Detailed Outcome Tables
210
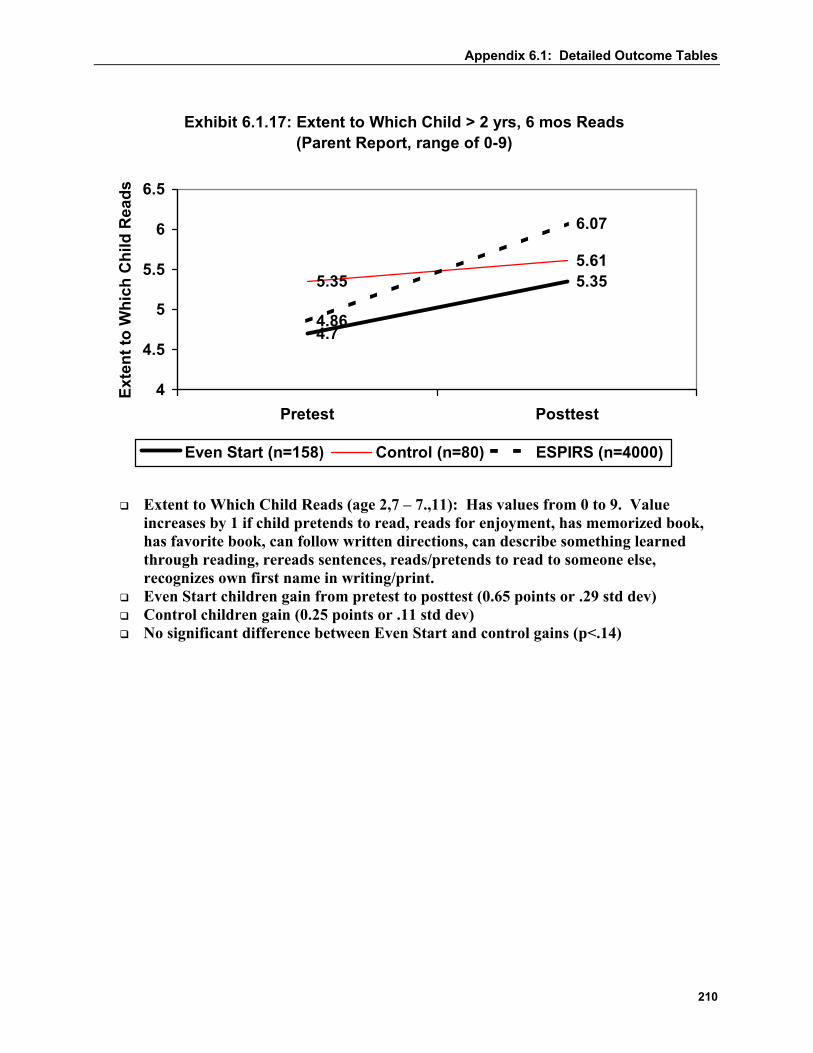
Exhibit 6.1.17: Extent to Which Child > 2 yrs, 6 mos Reads(Parent Report, range of 0-9)
4.7
5.355.355.61
4.86
6.07
4
4.5
5
5.5
6
6.5
Pretest Posttest
Exte
nt to
Whi
ch C
hild
Rea
ds
Even Start (n=158) Control (n=80) ESPIRS (n=4000)
Extent to Which Child Reads (age 2,7 – 7.,11): Has values from 0 to 9. Value
increases by 1 if child pretends to read, reads for enjoyment, has memorized book, has favorite book, can follow written directions, can describe something learned through reading, rereads sentences, reads/pretends to read to someone else, recognizes own first name in writing/print.
Even Start children gain from pretest to posttest (0.65 points or .29 std dev) Control children gain (0.25 points or .11 std dev) No significant difference between Even Start and control gains (p<.14)
Appendix 6.1: Detailed Outcome Tables
211
Exhibit 6.1.18: Age-Appropriate Writing Skills(Parent Report, range of 0-2)
1.081.3
1.161.41
0.851.05
0
0.5
1
1.5
2
Pretest Posttest
Age
-App
ropr
iate
Writ
ing
Skill
s
Even Start (n=234) Control (n=117) ESPIRS (n=4000)
Age-Appropriate Writing Skills: Has values from 0 to 2. Value increases by 1 if
child pretends to write, writes some letters of the alphabet. Even Start children gain from pretest to posttest (0.22 points or .33 std dev) Control children gain (0.24 points or .36 std dev) No significant difference between Even Start and control gains (p<.74)
Appendix 6.1: Detailed Outcome Tables
212
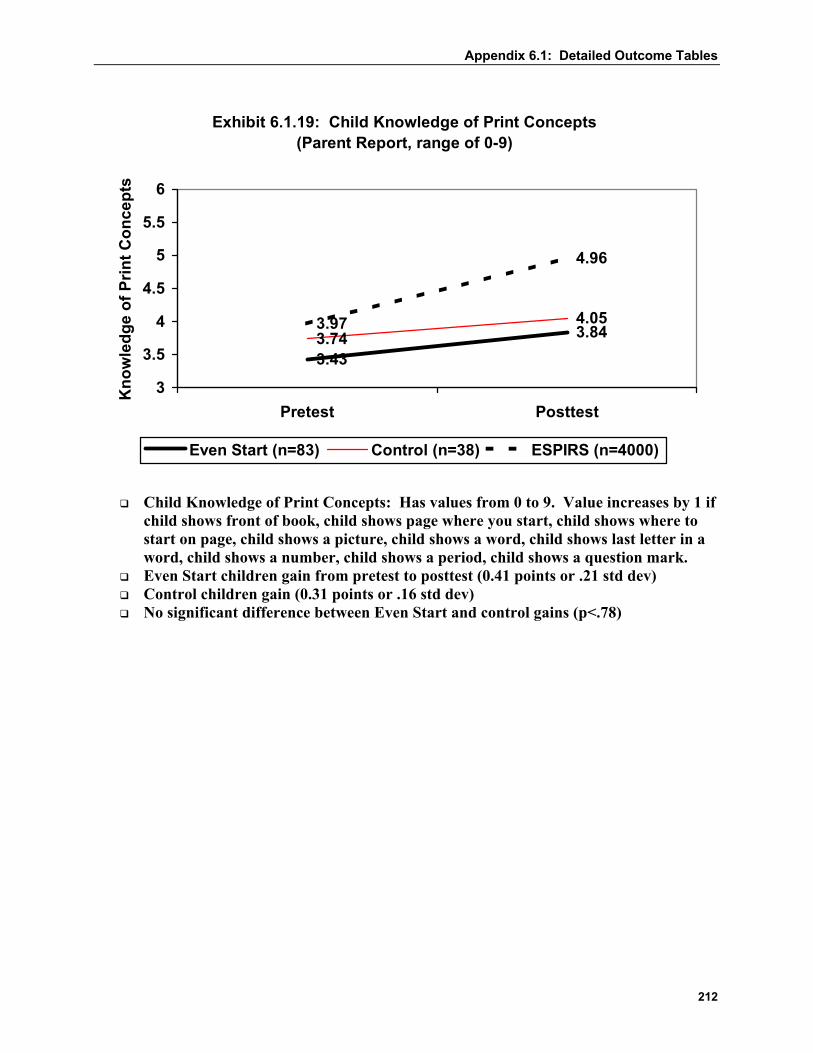
Exhibit 6.1.19: Child Knowledge of Print Concepts(Parent Report, range of 0-9)
3.433.843.744.053.97
4.96
3
3.5
4
4.5
5
5.5
6
Pretest Posttest
Kno
wle
dge
of P
rint C
once
pts
Even Start (n=83) Control (n=38) ESPIRS (n=4000)
Child Knowledge of Print Concepts: Has values from 0 to 9. Value increases by 1 if
child shows front of book, child shows page where you start, child shows where to start on page, child shows a picture, child shows a word, child shows last letter in a word, child shows a number, child shows a period, child shows a question mark.
Even Start children gain from pretest to posttest (0.41 points or .21 std dev) Control children gain (0.31 points or .16 std dev) No significant difference between Even Start and control gains (p<.78)
Even Start (n=172) Control (n=80)Even Start (n=99, all with AE) Control (n=53, none with AE)
Letter-Word Identification: The first five items involve symbolic learning, or the ability to match a rebus (pictographic representation of a word) with an actual picture of the object. The remaining items measure reading skills in identifying isolated letters and words that appear in large type.
Even Start adults gain from pretest to posttest (4.4 points or .21 std dev) Control adults gain (5.4 points or .25 std dev) No significant difference between Even Start and control gains (p<.71) At posttest, Even Start adults score at the 5th and Controls at the 8th percentile At posttest, Even Start adults score at grade 5.4 and Controls at grade 6.0
Appendix 6.1: Detailed Outcome Tables
215
Exhibit 6.1.21: Adult WJ-R: Passage Comprehension
476
480481
485
472
477
481484
465
470
475
480
485
490
Pretest PosttestPass
age
Com
preh
ensi
on W
-Sco
re
Even Start (n=169) Control (n=74)Even Start (n=99, all with AE) Control (n=48, none with AE)
Passage Comprehension: The first four items are presented in a multiple-choice format requiring the adult to point to the picture represented by a phrase. The remaining items measure skill in reading a short passage and identifying a missing key word.
Even Start adults gain from pretest to posttest (3.6 points or .22 std dev) Control adults gain (4.3 points or .27 std dev) No significant difference between Even Start and control gains (p<.77) At posttest, Even Start adults score at the 2nd and Controls at the 2nd percentile At posttest, Even Start adults score at grade 3.0 and Controls at grade 3.4
Appendix 6.1: Detailed Outcome Tables
216
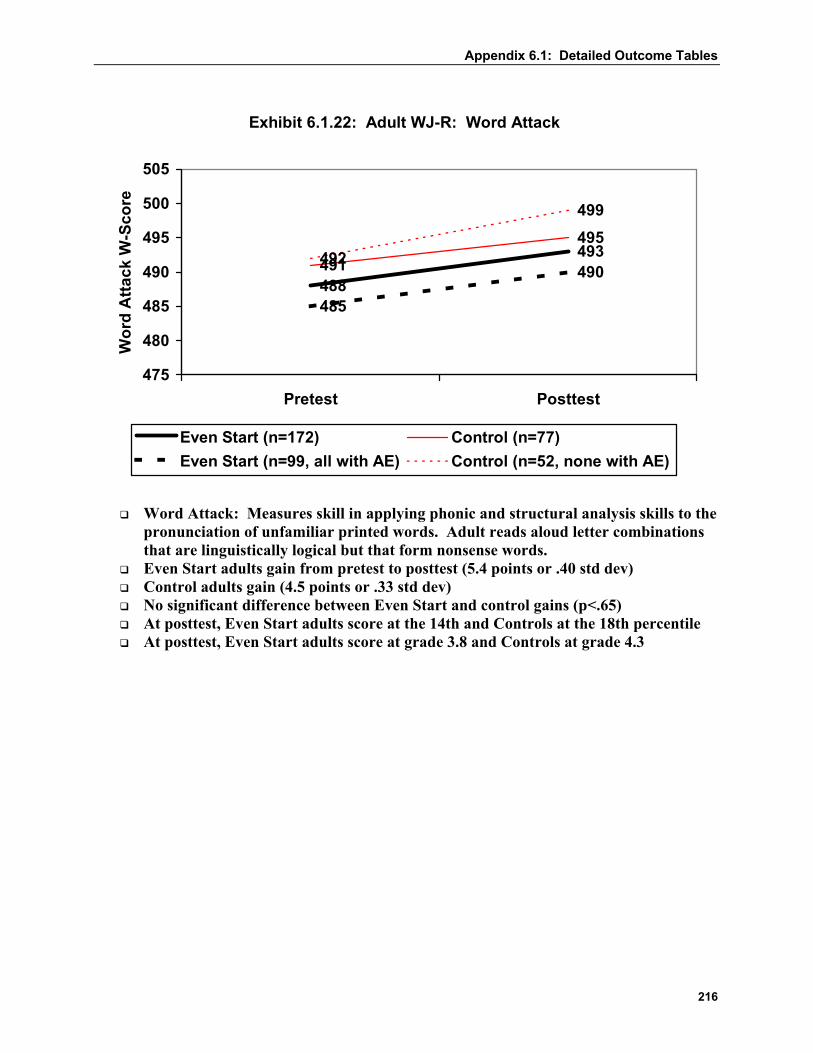
Exhibit 6.1.22: Adult WJ-R: Word Attack
488
493491
495
485
490492
499
475
480
485
490
495
500
505
Pretest Posttest
Wor
d A
ttack
W-S
core
Even Start (n=172) Control (n=77)Even Start (n=99, all with AE) Control (n=52, none with AE)
Word Attack: Measures skill in applying phonic and structural analysis skills to the pronunciation of unfamiliar printed words. Adult reads aloud letter combinations that are linguistically logical but that form nonsense words.
Even Start adults gain from pretest to posttest (5.4 points or .40 std dev) Control adults gain (4.5 points or .33 std dev) No significant difference between Even Start and control gains (p<.65) At posttest, Even Start adults score at the 14th and Controls at the 18th percentile At posttest, Even Start adults score at grade 3.8 and Controls at grade 4.3
Appendix 6.1: Detailed Outcome Tables
217
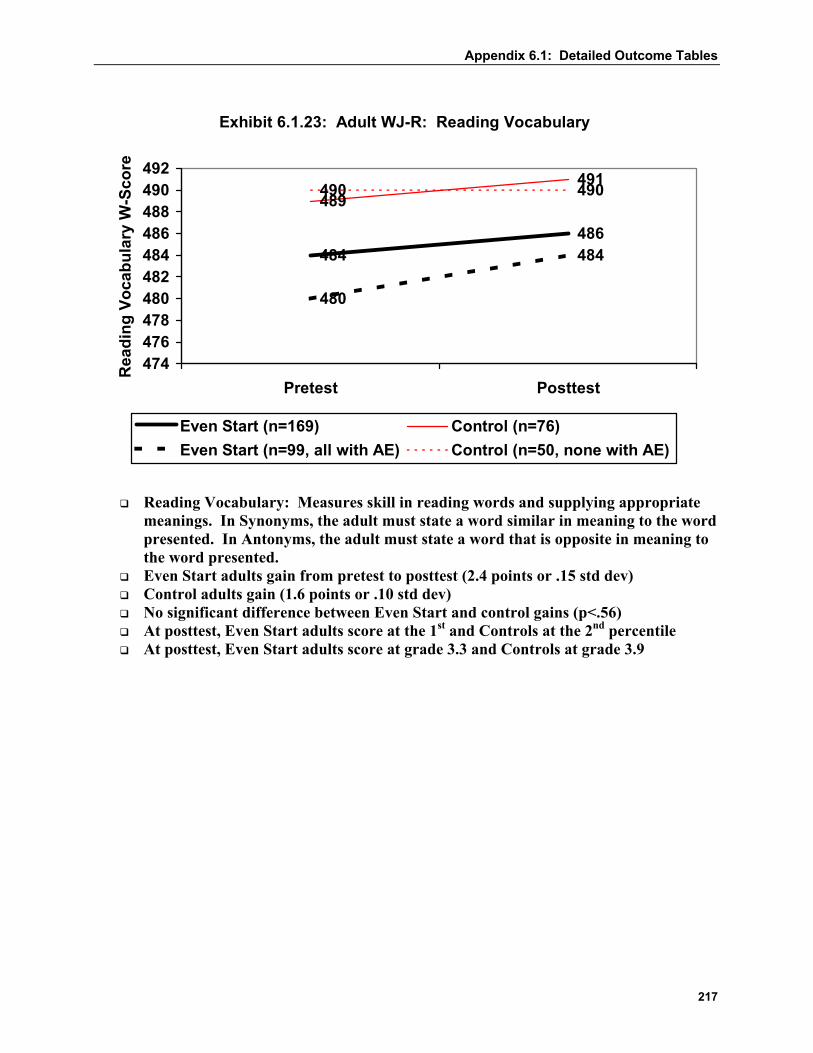
Exhibit 6.1.23: Adult WJ-R: Reading Vocabulary
484486
489491
480
484
490 490
474476478480482484486488490492
Pretest Posttest
Rea
ding
Voc
abul
ary
W-S
core
Even Start (n=169) Control (n=76)Even Start (n=99, all with AE) Control (n=50, none with AE)
Reading Vocabulary: Measures skill in reading words and supplying appropriate meanings. In Synonyms, the adult must state a word similar in meaning to the word presented. In Antonyms, the adult must state a word that is opposite in meaning to the word presented.
Even Start adults gain from pretest to posttest (2.4 points or .15 std dev) Control adults gain (1.6 points or .10 std dev) No significant difference between Even Start and control gains (p<.56) At posttest, Even Start adults score at the 1st and Controls at the 2nd percentile At posttest, Even Start adults score at grade 3.3 and Controls at grade 3.9
Even Start (n=169) Control (n=74)Even Start (n=99, all with AE) Control (n=48, none with AE)
Reading Comprehension Cluster: A cluster of scores that provides a measure of reading comprehension skills that includes both comprehension of single-word stimuli and context-embedded stimuli. Sum of Passage Comprehension and Reading Vocabulary.
Even Start adults gain from pretest to posttest (3.0 points or .20 std dev) Control adults gain (3.0 points or .20 std dev) No significant difference between Even Start and control gains (p<.99) At posttest, Even Start adults score at the 2nd and Controls at the 2nd percentile At posttest, Even Start adults score at grade 3.2 and Controls at grade 3.7
Even Start (n=172) Control (n=77)Even Start (n=99, all with AE) Control (n=52, none with AE)
Basic Reading Skills Cluster: A cluster of scores that provides a measure of basic reading skills that includes both sight vocabulary and the ability to apply phonic and structural analysis skills. Sum of Letter-Word Identification and Word Attack.
Even Start adults gain from pretest to posttest (4.9 points or .33 std dev) Control adults gain (5.3 points or .35 std dev) No significant difference between Even Start and control gains (p<.83) At posttest, Even Start adults score at the 8th and Controls at the 12th percentile At posttest, Even Start adults score at grade 4.6 and Controls at grade 5.3
Appendix 6.1: Detailed Outcome Tables
220
Exhibit 6.1.26: Parent's Education Level (in years)
9.2 9.39.49.2
8
9
10
11
Pretest Posttest
Year
s of
Edu
catio
n
Even Start (n=239) Control (n=123)
Even Start adults gain minimally from pretest to posttest (0.09 years or .03 std dev) No significant difference between Even Start and control gains (p<.12)
Appendix 6.1: Detailed Outcome Tables
221
Exhibit 6.1.27: Percent of Parents Who Have a GED or High School Diploma
17.2
15.8
17.9
15.3
10
15
20
Pretest PosttestPerc
ent o
f Par
ents
With
a G
ED o
r HS
Dip
lom
a
Even Start (n=240) Control (n=124)
Even Start and control adults lose minimally from pretest to posttest (due to
reporting error) No significant difference between Even Start and control gains
Appendix 6.1: Detailed Outcome Tables
222
Exhibit 6.1.28: Percent of Employed Parents
25.8
32.9
22.8
36.3
0
5
10
15
20
25
30
35
40
Pretest Posttest
Perc
ent o
f Em
ploy
ed P
aren
ts
Even Start (n=240) Control (n=124)
Even Start parents gain 7.1 percentage points Control parents gain 13.5 percentage points No significant difference between Even Start and control gains
Appendix 6.1: Detailed Outcome Tables
223
Exhibit 6.1.29: Annual Household Income (categorized)
5 5.14.9 5
4
4.5
5
5.5
6
Pretest Posttest
Inco
me
Cat
egor
y
Even Start (n=181) Control (n=85)
Income Category: 1=< $3,000, 2=$3,000-$5,999, 3=$6,000-$8,999, 4=$9,000-$11,999,
5=$12,000-$14,999, 6=$15,000-$19,999, 7=$20,000-$25,000, 8= > $25,000 Even Start adults gain from pretest to posttest (0.08 points or .04 std dev) Control adults gain (0.10 points or .05 std dev) No significant difference between Even Start and control gains (p<.91)
Appendix 6.1: Detailed Outcome Tables
224
PARENT REPORT OF PARENT LITERACY AT HOME
Variety of parent reading Variety of parent writing
Appendix 6.1: Detailed Outcome Tables
225
Exhibit 6.1.30: Variety of Parent Reading at Home(Parent Report, range of 0-12)
7.077.32
6.92
7.567.25
8.39
6
6.5
7
7.5
8
8.5
9
Pretest Posttest
Pare
nt R
eadi
ng a
t Hom
e
Even Start (n=240) Control (n=124) ESPIRS (n=4000)
Variety of Parent Reading at Home: Has values from 0 to 12. Value increases by 1
if parent reads letters or bills, advertisements, street signs, books, newspapers, labels on food, coupons, notes from teacher or school, magazines, TV Guide, instructions, religious materials
Even Start parents gain from pretest to posttest (0.25 points or .09 std dev) Control parents also gain (0.65 points or .24 std dev) No significant difference between Even Start and control gains (p<.22)
Appendix 6.1: Detailed Outcome Tables
226
Exhibit 6.1.31: Variety of Parent Writing at Home(Parent Report, range of 0-11)
3.22
4.1
3.13
3.7
4.41
5.75
3
3.5
4
4.5
5
5.5
6
Pretest Posttest
Pare
nt W
ritin
g at
Hom
e
Even Start (n=240) Control (n=124) ESPIRS (n=4000)
Variety of Parent Writing at Home: Has values from 0 to 11. Value increases by 1
if parent writes appointments on calendar, grocery lists, notes or memos, forms or applications, letters, checks or money orders, greeting cards, crossword puzzles, journal or diary, recipes, stories or poems.
Even Start parents gain from pretest to posttest (0.88 points or .38 std dev) Control parents also gain (0.57 points or .24 std dev) No significant difference between Even Start and control gains (p<.25)
Appendix 6.1: Detailed Outcome Tables
227
PARENT REPORT OF PARENT-CHILD READING
Parent reads to child daily Amount of reading to/with child Variety of reading to/with child Quality of reading to/with child
Appendix 6.1: Detailed Outcome Tables
228
Exhibit 6.1.32: Percent of Families That Read to Child Daily(Parent Report)
30.8 28.329.822.6
30
4138.334.1
05
1015202530354045
Pretest Posttest
Perc
ent o
f Fam
ilies
Even Start (n=240) Control (n=124)ESPIRS (n=4000) Head Start FACES
Percent of Even Start families that read to child daily is lower at posttest (-2.5%) Same pattern for Control families (-7.3%) No significant difference between Even Start and control gains (p<.30)
Appendix 6.1: Detailed Outcome Tables
229
Exhibit 6.1.33: Amount of Reading to/with Child(Parent Report, range of 0-3)
0.59 0.570.530.47
0.53
0.71
0
0.2
0.4
0.6
0.8
1
Pretest Posttest
Am
ount
of R
eadi
ng to
Chi
ld
Even Start (n=240) Control (n=124) ESPIRS (n=4000)
Amount of Reading to/with Child: Has values from 0 to 3. Value increases by 1 if
parent reads to child every day, someone else reads to child every day, parent tells story to child every day.
Even Start families stay constant from pretest to posttest (-.02 points or -.02 std dev) Control families do less reading with child at posttest (-0.6 points or -.08 std dev) No significant difference between Even Start and control gains (p<.67)
Appendix 6.1: Detailed Outcome Tables
230
Exhibit 6.1.34: Variety of Reading to/with Child(Parent Report, range of 0-5)
1.7 1.81.71.9
1.26
1.76
1
2
3
Pretest Posttest
Varie
ty o
f Rea
ding
to C
hild
Even Start (n=240) Control (n=124) ESPIRS (n=4000)
Variety of Reading to/with Child: Has values from 0 to 5. Value increases by 1 if
parent does the following to/with child: reads newspapers, reads magazines, reads store catalogs, reads funnies or comic books, reads TV listings.
Even Start families gain from pretest to posttest (0.10 points or .07 std dev) Control families also gain (0.19 points or .14 std dev) No significant difference between Even Start and control gains (p<.60)
Appendix 6.1: Detailed Outcome Tables
231
Exhibit 6.1.35: Quality of Reading to/with Child(Parent Report, range of 0-5)
2.8
3.3
2.8
3.4
2.3
3.3
2
2.5
3
3.5
4
Pretest Posttest
Qua
lity
of R
eadi
ng
Even Start (n=238) Control (n=123) ESPIRS (n=4000)
Quality of Reading to/with Child: Has values from 0 to 5. Value increases by 1 if
when reading to child, parent stops and asks what is in picture, stops and points out letters, stops and asks what happens next, reads the same story over and over, asks child to read.
Even Start families gain from pretest to posttest (0.47 points or .29 std dev) Control families also gain (0.56 points or .34 std dev) No significant difference between Even Start and control gains (p<.58)
Appendix 6.1: Detailed Outcome Tables
232
PARENT REPORT OF LITERACY RESOURCES AT HOME
Number of books that child has Variety of non-print resources in the home Variety of print resources in the home
Appendix 6.1: Detailed Outcome Tables
233
Exhibit 6.1.36: Number of Books Child Has (Categorized)(Parent Report, range of 0-5)
2.1
2.42.2
2.5
2.2
2.7
1
1.5
2
2.5
3
Pretest Posttest
Cat
egor
ized
N o
f Boo
ks
Even Start (n=240) Control (n=123) ESPIRS (n=4000)
Number of Books that Child Has: Has values from 0 to 5. 0 = no books, 1 = 1 or 2
books, 2 = 3 to 10 books, 3 = 11 to 25 books, 4 = 26 to 50 books, 5 = 51+ books. Even Start children gain from pretest to posttest (0.31 points or .27 std dev) Control children gain (0.35 points or .30 std dev) No significant difference between Even Start and control gains (p<.74)
Appendix 6.1: Detailed Outcome Tables
234
Exhibit 6.1.37: Variety of Non-Print Resources in the Home (Parent Report, range of 0-16)
9.1
9.99
9.01
9.94
8.97
10.83
8
8.5
9
9.5
10
10.5
11
Pretest Posttest
Varie
ty o
f Non
-Prin
t Res
ourc
es
Even Start (n=240) Control (n=122) ESPIRS (n=4000)
Variety of Non-Print Resources in the Home: Has values from 0 to 16. Value
increases by 1 if the following are available at home: rattle or squeak toys, pull toys, crayons and paper, scissors, blocks, scotch tape, tinkertoys, puzzles or paint or magic markers, picture catalogs, yarn or thread or cloth, clay or playdough, make-believe toys, plants in pot or garden, pens or pencils, typewrite or computer.
Even Start children gain from pretest to posttest (0.89 points or .29 std dev) Control children gain (0.93 points or .30 std dev) No significant difference between Even Start and control gains (p<.89)
Appendix 6.1: Detailed Outcome Tables
235
Exhibit 6.1.38: Variety of Print Resources at Home(Parent Report, range of 0-5)
2.72.962.93 3.01
2.74
3.15
2
2.5
3
3.5
4
Pretest Posttest
Varie
ty o
f Prin
t Res
ourc
es
Even Start (n=240) Control (n=124) ESPIRS (n=4000)
Variety of Print Resources in the Home: Has values from 0 to 5. Value increases by
1 if the following are available at home: books, magazines, newspapers, TV Guide, comic books.
Even Start children gain from pretest to posttest (0.26 points or .21 std dev) Control children gain (0.08 points or .07 std dev) No significant difference between Even Start and control gains (p<.20)
Appendix 6.1: Detailed Outcome Tables
236
PARENT REPORT OF PARENT SUPPORT OF CHILD’S SCHOOL
Parent participation in school activities Parent opinion about school
Appendix 6.1: Detailed Outcome Tables
237
Exhibit 6.1.39: Parent Participation in School Activities(Parent Report, range of 0-12)
2.62
3.87
3.07
4.63
2.01
3.13
1
2
3
4
5
Pretest Posttest
Pare
nt P
artic
ipat
ion
in S
choo
l A
ctiv
ities
Even Start (n=91) Control (n=29) ESPIRS (n=4000)
Parent Participation in School Activities: Has values from 0 to 12. Value increases
by 1 if parent does following activities: has conference with a teacher, observes classroom activities, attends a school event, attends an after-school program, meets with PTA, attends a parent advisory committee meeting, helps with fundraising activities, volunteers in school office or library, volunteers in children’s classroom, volunteers for school trips, works as a paid employee, serves on preschool committee.
Even Start parents gain from pretest to posttest (1.25 points or .64 std dev) Control parents also gain (1.55 points or .80 std dev) No significant difference between Even Start and control gains (p<.57)
Appendix 6.1: Detailed Outcome Tables
238
Exhibit 6.1.40: Parent Opinion About Child's School(Parent Report, range of 0-14)
12.7912.61
12.73 12.7312.96
13.18
12
12.5
13
13.5
14
Pretest Posttest
Pare
nt O
pini
on A
bout
Chi
ld's
Sc
hool
Even Start (n=26) Control (n=17) ESPIRS (n=4000)
Parent Opinion About Child’s School: Has values from 0 to 14. Value increases by
1 if parent agrees with the following: school places priority on learning, school assigns homework that is worthwhile, child is challenged at school, child is treated fairly at school, school standards are realistic, child is respected by teacher, parent is respected by teacher, parent would select this school, child gets needed help at school, school is a safe place, it is important for parents to participate in school, parents have a say in school policy, parents support school policy, school maintains discipline.
Even Start parents have lower opinions about school at posttest (-0.18 points or -.06 std dev)
Control parents do not change (0.00 points or .00 std dev) No significant difference between Even Start and control gains (p<.85)
Appendix 6.1: Detailed Outcome Tables
239
EXHIBIT 6.1.41
COMPARISON OF PARENT-REPORTED ADULT AND CHILD OUTCOMES: EDS AND ESPIRS PRETEST DATA
MEASURE EDS ESPIRS Parent Report of Child Literacy Child Knows Alphabet (%) 7.9 14.0** Child Counts to 100 or More (%) 6.9 9.2 Child Knows Colors (%) 48.0 53.5 Extent Child Reads (<2,6 yrs) 1.3 1.0** Extent Child Reads (>2,6 yrs) 5.0 4.9 Age-Appropriate Writing 1.1 0.8** Child Knows Print Concepts 4.1 4.1 Parent Report of Parent Literacy at Home Variety of Parent Reading 7.0 7.3* Variety of Parent Writing 3.2 4.5** Parent Report of Parent-Child Reading Parent Reads to Child Daily (%) 30 29 Amount of Reading to Child 0.6 0.5 Variety of Reading to Child 1.7 1.2** Quality of Reading to Child 2.8 2.3** Parent Report of Literacy Resources at Home Number of Books Child Has 2.1 2.1 Variety of Non-Print Resources 9.0 9.0 Variety of Print Resources 2.8 2.8 Parent Report of Parent Support of Child’s School Parent Participation in School 2.8 2.0** Parent Opinion about School 12.8 12.8 Notes: *p<.05, **p<.01. N’s vary from variable to variable because some variables are based on subsets of parents/children. For the EDS, n’s range from 51 to 417; for the ESPIRS, n’s range from 781 to 8,171. Exhibit reads: In the EDS sample, parents reported that 7.9 percent of children knew the entire alphabet.