30
PPL 3 rd Quarter Investor Update | November 4, 2021

PPL 3rd Quarter Investor Update | November 4, 2021
2PPL 3rd Quarter Investor Update – November 4, 2021
Cautionary Statements and Factors That May Affect Future Results
Statements made in this presentation about future operating results or other
future events, including the anticipated effects of the recent sale of PPL
Corporation’s U.K. business, the anticipated acquisition of The Narragansett
Electric Company (Narragansett) from National Grid, and the impact of each
transaction on PPL Corporation, are forward-looking statements under the
Safe Harbor provisions of the Private Securities Litigation Reform Act of 1995.
Actual results may differ materially from the forward-looking statements. A
discussion of some of the factors that could cause actual results or events to
vary is contained in the Appendix to this presentation and in the Company’s
SEC filings.
Management utilizes non-GAAP financial measures such as, “adjusted gross
margins” or “margins” in this presentation. For additional information on non-
GAAP financial measures and reconciliations to the appropriate GAAP
measure, refer to the Appendix of this presentation and PPL’s SEC filings.

3PPL 3rd Quarter Investor Update – November 4, 2021
Agenda
I. Strategic and Operational Updates
II. Financial Update
III. Closing Remarks
IV. Q&A
Vince Sorgi
Joe Bergstein
Vince Sorgi

4PPL 3rd Quarter Investor Update – November 4, 2021
Strategic UpdateExcellent progress on strategic repositioning
➢ Narragansett Electric acquisition approvals remain on track
▪ 4 of 5 approvals completed - FERC approval received in September
▪ Rhode Island (RI) Division of Public Utilities and Carriers only remaining approval (procedural
schedule in Appendix)
▪ Expect to close transaction by March 2022
➢ Significant progress on Day 1 and transition planning initiatives
▪ Day 1 activities identified and planned
▪ Transition Services Agreement (TSA) identified and drafted
▪ 1,100+ National Grid employees accepted employment offers upon closing to staff RI
operations
➢ Added Heather B. Redman to Board of Directors effective October 11th
▪ Co-founder and managing partner of Flying Fish Partners, a venture capital firm investing in
early-stage artificial intelligence and machine learning startups, including energy-related
applications
▪ Board is now overall 60% diverse, with 30% women and an average tenure of 7.5 years
Highlights since 2nd quarter investor update
5PPL 3rd Quarter Investor Update – November 4, 2021
$10.4
$3.9
$3.8
Net
Cash Proceeds
LT Debt
Reduction
Narragansett
Acquisition
Additional Utility Capex Share
Buybacks
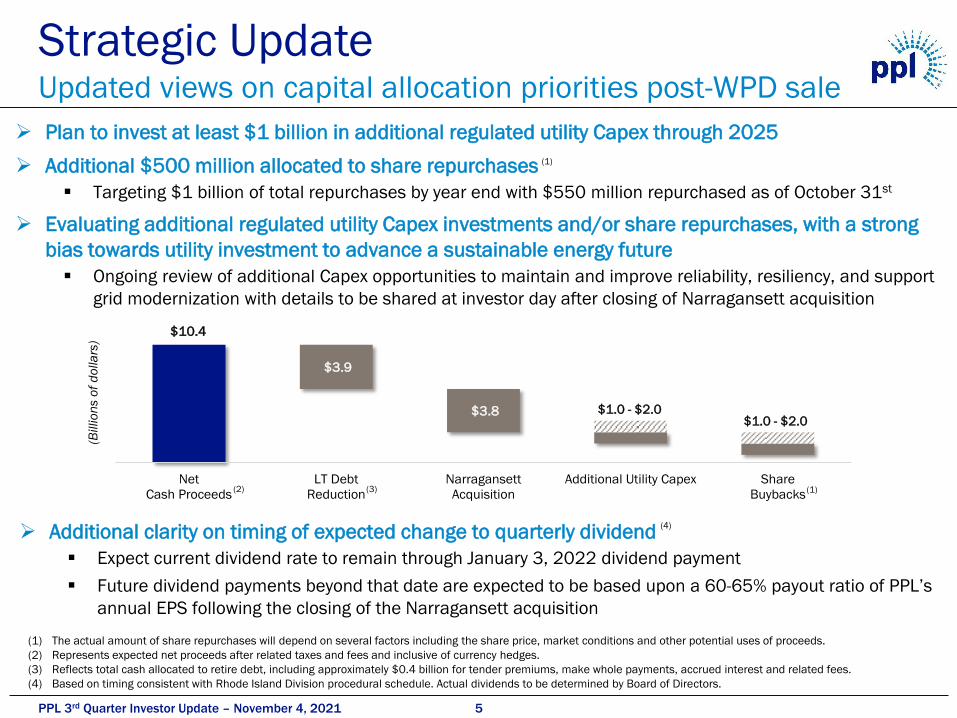
Strategic UpdateUpdated views on capital allocation priorities post-WPD sale
➢ Plan to invest at least $1 billion in additional regulated utility Capex through 2025
➢ Additional $500 million allocated to share repurchases
▪ Targeting $1 billion of total repurchases by year end with $550 million repurchased as of October 31st
➢ Evaluating additional regulated utility Capex investments and/or share repurchases, with a strong
bias towards utility investment to advance a sustainable energy future
▪ Ongoing review of additional Capex opportunities to maintain and improve reliability, resiliency, and support
grid modernization with details to be shared at investor day after closing of Narragansett acquisition
(1) The actual amount of share repurchases will depend on several factors including the share price, market conditions and other potential uses of proceeds.
(2) Represents expected net proceeds after related taxes and fees and inclusive of currency hedges.
(3) Reflects total cash allocated to retire debt, including approximately $0.4 billion for tender premiums, make whole payments, accrued interest and related fees.
(4) Based on timing consistent with Rhode Island Division procedural schedule. Actual dividends to be determined by Board of Directors.
(Billio
ns o
f d
olla
rs)
$1.0 - $2.0$1.0 - $2.0
(1)
(3)(2)
➢ Additional clarity on timing of expected change to quarterly dividend
▪ Expect current dividend rate to remain through January 3, 2022 dividend payment
▪ Future dividend payments beyond that date are expected to be based upon a 60-65% payout ratio of PPL’s
annual EPS following the closing of the Narragansett acquisition
(4)
(1)

6PPL 3rd Quarter Investor Update – November 4, 2021
Advancing PPL’s Clean Energy StrategyInitiatives supporting overall goal of net zero emissions
➢ New 125-megawatt solar facility planned for Kentucky
▪ Renewable Power Agreements with five major customers in LG&E and KU’s
service territories
▪ Agreements are under LG&E and KU’s existing Green Tariff
➢ Joined Electric Highway Coalition to support electric vehicle (EV) adoption
▪ Coalition aims to expand rapid-charging infrastructure along U.S. highways from
the Northeast to Midwest down to Texas
▪ PA and KY utilities are members of the coalition; Narragansett is also a member of
the coalition under National Grid’s ownership
➢ Launched partnership to study and simulate the capture of carbon
emissions at a combined cycle gas plant
▪ LG&E and KU collaboration with EPRI and University of Kentucky Center for
Applied Energy Research
➢ Innovative transmission line infrastructure investment
▪ Acquired ownership interest in SOO Green transmission line project
▪ 350-mile underground transmission line along existing railway right of ways to
transmit Midwest renewable energy into PJM
CO2

7PPL 3rd Quarter Investor Update – November 4, 2021
38%
12%
50%
1%
18%
81%
19%
29%
52%
Kentucky Integrated Resource PlanExpecting meaningful shift to cleaner generation mix
Projected generation mix over 15-year planning period
(Percentage of projected GWh)
(1)
Source: LG&E and KU 2021 Integrated Resource Plan (IRP), KPSC case no. 2021-00393
(1) See appendix for a summary of the base and high case scenario assumptions.
(2) Represents results from base load/base fuel price scenario. See slide 19 for applicable assumptions supporting this scenario.
(3) Represents results from high load/high fuel price scenario. See slide 19 for applicable assumptions supporting this scenario.
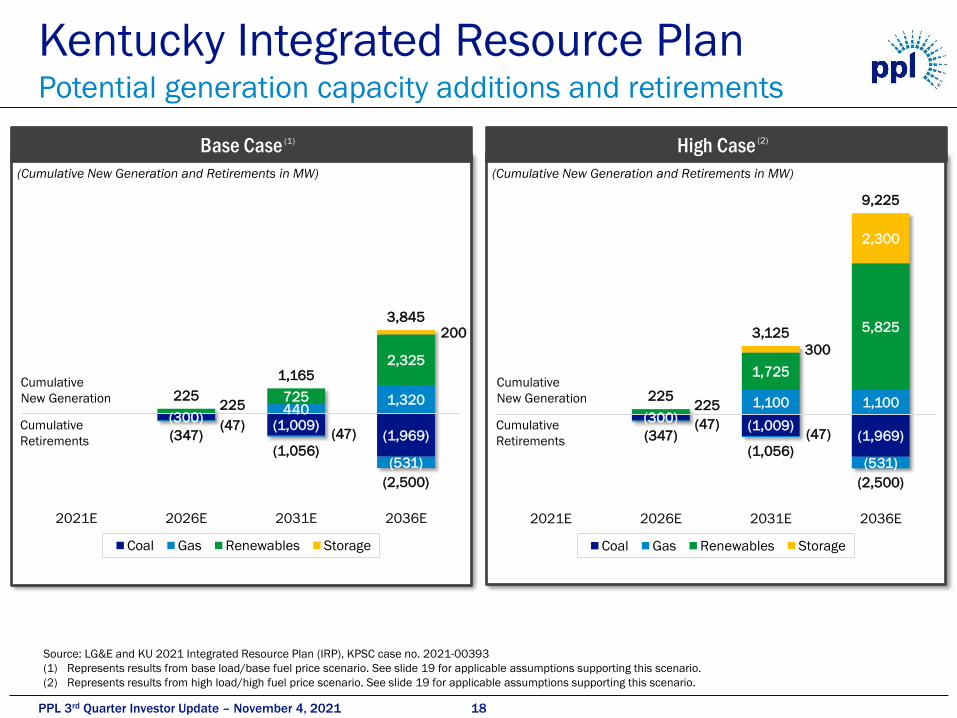
➢ Anticipate meaningful decline in output from coal-fired facilities during the 15-year planning
period, replaced by combination of renewable and natural gas
➢ Base case scenario supports renewable development of ~2,300 MW by 2036, with substantial
further renewable generation needed in the high load/high fuel price case scenario
➢ Next IRP filed in 2024
Gas
Coal
Renewables
Base
Case
2021E 2036E
Current
Mix
High
Case(2) (2) (3)

8PPL 3rd Quarter Investor Update – November 4, 2021
Operational and Regulatory UpdateInnovation driving value for our customers and shareowners
➢ Constructive settlement on PA transmission formula rate
▪ Agreement lowers base ROE, partially offset by other formula changes
➢ PPL’s utilities named among the most trusted utility brands in the nation
▪ PPL Electric and Kentucky Utilities are top rated by residential customers in Escalent
study focused on utility performance
▪ PPL Electric’s 3rd consecutive year, Kentucky Utilities’ 2nd consecutive year
➢ PPL Electric recognized for innovation in vegetation management
▪ Use of data analytics and other technologies driving fewer tree-related outages
➢ PPL Electric chosen as a Top Innovator by Public Utilities Fortnightly
▪ Acknowledgement for use of Dynamic Line Rating sensors in transmission
➢ Supporting meaningful economic development in Kentucky
▪ Ford Motor Co. and SK Innovation announced in late September a new $5.8 billion
investment in the state for two electric battery manufacturing facilities in Glendale, KY
(1) The Settlement is subject to review and action by FERC, including approval, denial or modification. See appendix for settlement agreement details.
(2) Escalent – a human behavior and analytics advisory firm. Study focused on customer focus, community support, communications effectiveness, reliable quality,
environmental dedication, and company reputation.
(3) 2021 AEIC (Association of Edison Illuminating Companies) Achievement award.
(4) Public Utilities Fortnightly - a forum for stakeholders in utility regulation and policy.
(4)
(3)
(2)
(1)

9PPL 3rd Quarter Investor Update – November 4, 2021
3rd Quarter Financial Results
$0.37
$0.27
2020 Q3
Reported
2021 Q3
Reported
$0.30
$0.36
2020 Q3
Ongoing
2021 Q3
Ongoing
(Earnings Per Share)
Note: See Appendix for the reconciliation of reported earnings to earnings from ongoing operations.
(1) Excludes special items. PPL sold its U.K. utility business on June 14, 2021, and its earnings were treated as a special item.
(1) (1)
(Earnings Per Share)
➢ 3rd quarter 2021 results reflect special items of ($0.09) per share, primarily related
to losses on the early extinguishment of debt
Ongoing Earnings Reported Earnings
10PPL 3rd Quarter Investor Update – November 4, 2021
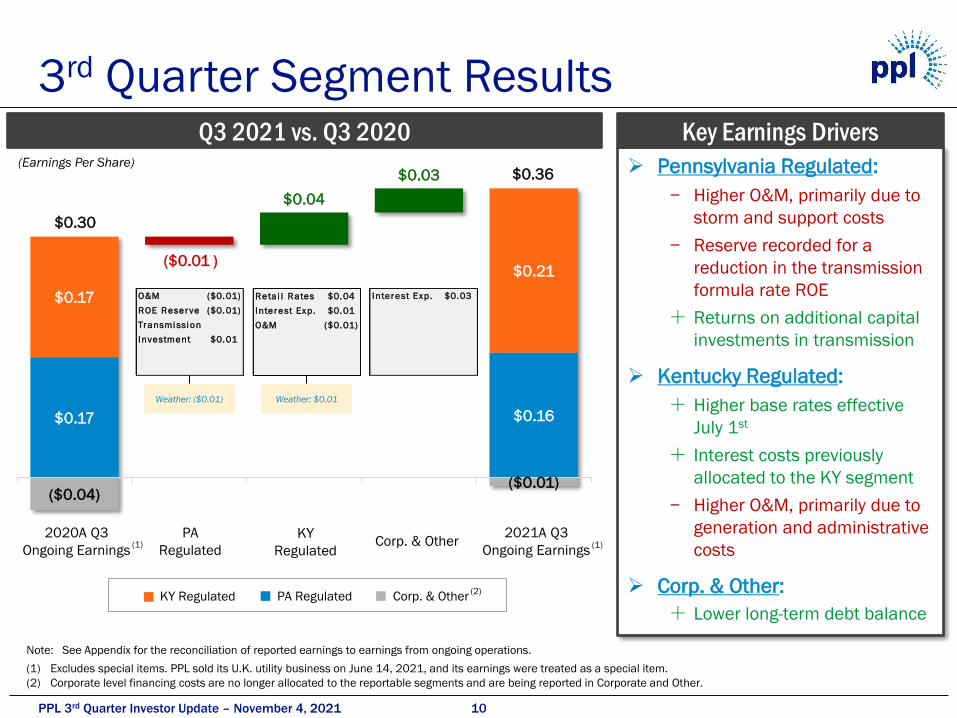
$0.17 $0.16
$0.17
$0.21
($0.04)($0.01)
$0.04
$0.03
($0.01 )
$0.30
$0.36
3rd Quarter Segment Results
(2)
Note: See Appendix for the reconciliation of reported earnings to earnings from ongoing operations.
(1) Excludes special items. PPL sold its U.K. utility business on June 14, 2021, and its earnings were treated as a special item.
(2) Corporate level financing costs are no longer allocated to the reportable segments and are being reported in Corporate and Other.
(Earnings Per Share)➢ Pennsylvania Regulated:
− Higher O&M, primarily due to
storm and support costs
− Reserve recorded for a
reduction in the transmission
formula rate ROE
Returns on additional capital
investments in transmission
➢ Kentucky Regulated:
Higher base rates effective
July 1st
Interest costs previously
allocated to the KY segment
− Higher O&M, primarily due to
generation and administrative
costs
➢ Corp. & Other:
Lower long-term debt balance
Weather: ($0.01) Weather: $0.01
KY Regulated PA Regulated Corp. & Other
Key Earnings DriversQ3 2021 vs. Q3 2020
2021A Q3
Ongoing Earnings
2020A Q3
Ongoing Earnings(1)
PA
Regulated
KY
RegulatedCorp. & Other (1)
O&M ($0.01)
ROE Reserve ($0.01)
Transmi ssi on
Investment $0.01
Reta i l Rates $0.04
Interest Exp. $0.01
O&M ($0.01)
Interest Exp. $0.03

Appendix

12PPL 3rd Quarter Investor Update – November 4, 2021
$0.48 $0.46
$0.43 $0.50
($0.14) ($0.13)
$0.07 $0.01
($0.02 )
$0.77
$0.83
YTD 2021 Financial Results
Note: See Appendix for the reconciliation of reported earnings to earnings from ongoing operations.
(1) Excludes special items. PPL sold its U.K. utility business on June 14, 2021, and its earnings were treated as a special item.
(2) YTD 2020 earnings have been adjusted by ($0.04) per share for certain costs that were previously included in the U.K. Regulated segment.
(3) Corporate level financing costs are no longer allocated to the operating segments and are being reported in Corporate and Other.
(Earnings Per Share) ➢ Pennsylvania Regulated:
− Reserve recorded for a reduction in the
transmission formula rate ROE
− Lower peak transmission demand
Returns on additional capital
investments in transmission
Higher sales volumes primarily due to
increased residential load
➢ Kentucky Regulated:
Higher base rates effective July 1st
Interest costs previously allocated to
the KY segment & lower interest rates
Higher sales volumes, primarily due to
favorable weather vs. prior year
− Higher O&M due to increased
generation and administrative costs
➢ Corp. & Other:
Lower long-term debt balance
− Higher interest expense primarily due
to interest previously allocated to the
Kentucky Regulated segment
Weather: $0.00 Weather: +$0.03
(2)(3)KY Regulated PA Regulated Corp. & Other
(1)(1)2020A YTD
Ongoing Earnings
PA
Regulated
KY
RegulatedCorp. & Other
2021A YTD
Ongoing Earnings
YTD 2021 vs. YTD 2020 YTD Highlights: 2021 vs. 2020
ROE Reserve ($0.03)
Peak Demand ($0.03)
Transmi ssi on
Investment $0.04
Sal es Vo l umes $0.01
Other ($0.01)
Reta i l Rates $0.04
Interest $0.04
Sal es Vo l umes $0.03
O&M ($0.03)
Other ($0.01)
Interest Exp. $0.02
Other ($0.01)

13PPL 3rd Quarter Investor Update – November 4, 2021
Narragansett Electric Acquisition Regulatory approvals on track
Acquisition of Narragansett
(expected approval within 12 months of transaction announcement) Status
Federal Approvals:
Hart-Scott-Rodino (DOJ) ✓Waiting Period Expired 6/2
Federal Communications Commission (FCC) ✓ Approval Received 7/14
Federal Energy Regulatory Commission (FERC) ✓ Approval Received 9/23
State Approvals:
Rhode Island Division of Public Utilities and Carriers Pending (filing submitted 5/4)
Massachusetts Department of Public Utilities (waiver) ✓ Granted 7/16
(1) National Grid obligation for Massachusetts Department of Public Utilities waiver relating to its foreign utility change in control provision.
(1)

14PPL 3rd Quarter Investor Update – November 4, 2021
Narragansett Electric Acquisition Rhode Island Division procedural schedule
Timing Milestone
10/1/2021 Deadline for propounding discovery (all parties)
10/25/2021 Discovery Conference (if needed)
11/3/2021 Deadline for Intervenors and Advocacy Section to submit pre-filed direct testimony
11/23/2021 Deadline for Petitioners to submit pre-filed rebuttal testimony
12/8/2021 –
12/10/2021Settlement discussions
12/9/2021 Deadline for Advocacy Section and Intervenors to submit pre-filed surrebuttal testimony
12/13/2021 –
12/17/2021Public Hearings (Starting at 9:30AM)
1/17/2022 Post-Hearing Memoranda (Optional)
1/25/2022 Reply Memoranda (Optional)
2/25/2022 Decision Target Date
Note: Docket number D-21-09, Rhode Island Division of Public Utilities and Carriers.
15PPL 3rd Quarter Investor Update – November 4, 2021
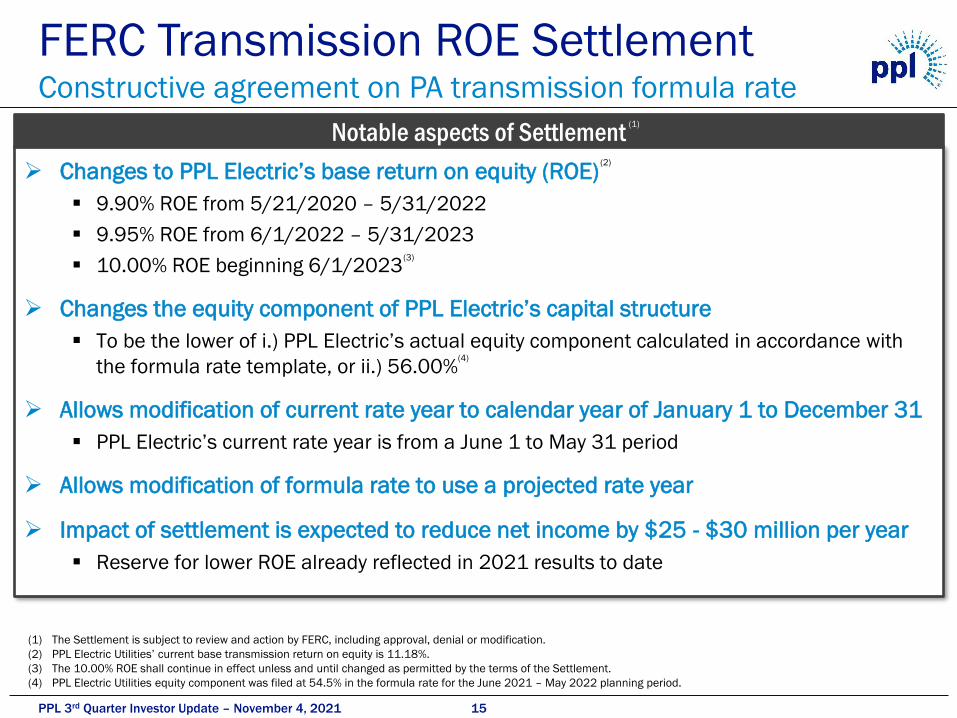
FERC Transmission ROE SettlementConstructive agreement on PA transmission formula rate
➢ Changes to PPL Electric’s base return on equity (ROE)
▪ 9.90% ROE from 5/21/2020 – 5/31/2022
▪ 9.95% ROE from 6/1/2022 – 5/31/2023
▪ 10.00% ROE beginning 6/1/2023
➢ Changes the equity component of PPL Electric’s capital structure
▪ To be the lower of i.) PPL Electric’s actual equity component calculated in accordance with
the formula rate template, or ii.) 56.00%
➢ Allows modification of current rate year to calendar year of January 1 to December 31
▪ PPL Electric’s current rate year is from a June 1 to May 31 period
➢ Allows modification of formula rate to use a projected rate year
➢ Impact of settlement is expected to reduce net income by $25 - $30 million per year
▪ Reserve for lower ROE already reflected in 2021 results to date
(1) The Settlement is subject to review and action by FERC, including approval, denial or modification.
(2) PPL Electric Utilities’ current base transmission return on equity is 11.18%.
(3) The 10.00% ROE shall continue in effect unless and until changed as permitted by the terms of the Settlement.
(4) PPL Electric Utilities equity component was filed at 54.5% in the formula rate for the June 2021 – May 2022 planning period.
(3)
(2)
Notable aspects of Settlement(1)
(4)

16PPL 3rd Quarter Investor Update – November 4, 2021
4.9% 3.5%
2.8%
4.6%
7.2%
(4.0%)(2.9%) (3.1%)
(0.2%) (0.3%)
(0.5%) (0.3%) (0.7%)
1.4% 2.8%
Q3 2020 Q4 2020 Q1 2021 Q2 2021 Q3 2021
7.1% 6.9%
4.8%
0.6% 1.2%
(6.7%)
(3.5%) (3.6%)(2.7%)
(3.7%)
(1.9%)(0.5%) (0.5%)
(1.6%)(1.8%)
Q3 2020 Q4 2020 Q1 2021 Q2 2021 Q3 2021
Electricity Sales TrendsSales comparison to pre-pandemic levels
TotalResidential C&I (2)
Weather-Normalized Electricity Sales Volumes Compared to 2019 Sales Volumes
Pennsylvania Regulated Kentucky Regulated
(1)
(1) 2019 weather-normalized electricity sales volumes used for comparative purposes to reflect sales trends vs. a period prior to COVID-19 impacts.
(2) Includes Residential, Commercial and Industrial customer classes as well as “Other,” which is not depicted in the charts above.

17PPL 3rd Quarter Investor Update – November 4, 2021
Weather-Normalized Electricity Sales Volume Variance (2021 vs. 2020) in GWh
Pennsylvania KentuckyQ3 2021 Q3 2020 % Change Q3 2021 Q3 2020 % Change
Residential 3,525 3,449 2.2% Residential 2,854 3,019 (5.5%)
Commercial 3,747 3,609 3.8% Commercial 2,120 2,113 0.3%
Industrial 2,205 2,119 4.0% Industrial 2,287 2,156 6.1%
Other 18 18 NM* Other 734 700 NM*
Total 9,494 9,195 3.2% Total 7,995 7,987 0.1%
YTD 2021 YTD 2020 % Change YTD 2021 YTD 2020 % Change
Residential 11,155 11,009 1.3% Residential 8,170 8,401 (2.7%)
Commercial 10,468 10,019 4.5% Commercial 5,779 5,760 0.3%
Industrial 6,319 6,078 4.0% Industrial 6,562 6,018 9.0%
Other 53 60 NM* Other 2,009 1,966 NM*
Total 27,995 27,166 3.1% Total 22,520 22,145 1.7%
Actual Electricity Sales Volume Variance (2021 vs. 2020) in GWh
Pennsylvania KentuckyQ3 2021 Q3 2020 % Change Q3 2021 Q3 2020 % Change
Residential 3,628 3,753 (3.3%) Residential 2,928 3,000 (2.4%)
Commercial 3,792 3,714 2.1% Commercial 2,143 2,105 1.8%
Industrial 2,205 2,119 4.1% Industrial 2,287 2,156 6.1%
Other 17 17 NM* Other 741 699 NM*
Total 9,642 9,603 0.4% Total 8,100 7,960 1.8%
YTD 2021 YTD 2020 % Change YTD 2021 YTD 2020 % Change
Residential 11,175 10,947 2.1% Residential 8,199 7,971 2.9%
Commercial 10,497 10,052 4.4% Commercial 5,817 5,666 2.7%
Industrial 6,319 6,078 4.0% Industrial 6,562 6,018 9.0%
Other 55 61 NM* Other 2,014 1,937 NM*
Total 28,046 27,138 3.3% Total 22,593 21,592 4.6%
*NM: Not Meaningful
(1) Represents the nine months ending September 30, 2021.
(2) Represents the nine months ending September 30, 2020.
Electricity Sale Volumes2021 sales vs. 2020 sales by operating segment
(1)
(1) (1)
(1)
(2) (2)
(2) (2)
18PPL 3rd Quarter Investor Update – November 4, 2021
Kentucky Integrated Resource PlanPotential generation capacity additions and retirements
Cumulative
New Generation
Cumulative
Retirements
(Cumulative New Generation and Retirements in MW)
Source: LG&E and KU 2021 Integrated Resource Plan (IRP), KPSC case no. 2021-00393
(1) Represents results from base load/base fuel price scenario. See slide 19 for applicable assumptions supporting this scenario.
(2) Represents results from high load/high fuel price scenario. See slide 19 for applicable assumptions supporting this scenario.
(Cumulative New Generation and Retirements in MW)
Cumulative
New Generation
Cumulative
Retirements
Base Case High Case(1) (2)
(300)(1,009)
(1,969)(47)
(47)
(531)
440 1,320 225
725
2,325
200
225
1,165
3,845
(347)(1,056)
(2,500)
2021E 2026E 2031E 2036E
Coal Gas Renewables Storage
(300)(1,009)
(1,969)(47)
(47)
(531)
1,100 1,100 225
1,725
5,825
300
2,300
225
3,125
9,225
(347)(1,056)
(2,500)
2021E 2026E 2031E 2036E
Coal Gas Renewables Storage

19PPL 3rd Quarter Investor Update – November 4, 2021
Base Case High Case
Key Load Assumptions
Customer Growth 0.4% CAGR 50% faster (0.6% CAGR)
Energy Efficiency>6% reduction in Residential/
Small Commercial use-per-customer by 2036
>6% reduction in Residential/
Small Commercial use-per-customer by 2036
Major New Customer Additions None 180 MW
Electric Vehicle Growth Less than 4% of new car sales by 2030 50% of new car sales by 2030
Space Heating Electrification Flat to slightly increasing No new gas furnaces beginning 2024
Key Fuel Assumptions
Gas Price: 5-year averages
($/mmBtu)
2022 - 2026: $2.87
2027 - 2031: $3.11
2032 - 2036: $3.52
2022 - 2026: $3.75
2027 - 2031: $4.14
2032 - 2036: $4.74
Coal Price: 5-year averages
($/mmBtu)
2022 - 2026: $1.69
2027 - 2031: $1.80
2032 - 2036: $1.98
2022 - 2026: $1.89
2027 - 2031: $2.02
2032 - 2036: $2.24
Carbon Price No assumption No assumption
Kentucky Integrated Resource PlanKey Forecast Assumptions & Uncertainties
Source: LG&E and KU 2021 Integrated Resource Plan (IRP), KPSC case no. 2021-00393
(1) Gas price base case reflects forward market prices through 2024 interpolated to reach the U.S. Energy Information Administration’s (EIA) 2021 Annual Energy Outlook’s
(AEO) High Oil and Gas Supply case’s price by 2050.
(2) Gas price high case reflects EIA’s 2021 AEO reference case.
(3) In the coal price base case, the forecasted open position through 2026 is a blend of bids received in response to the RFP and a consultant’s forecast. In the long-term, the
forecast escalates with coal price growth rate from EIA’s 2021 AEO High Oil & Gas Supply case.
(4) In the coal price high case, coal prices are correlated with natural gas prices.
(5) Plants assumed to retire in accordance with recent depreciation study filed in rate cases. New resources assumed to be non-emitting, except for CTs needed for reliability.
(1)(2)
(3)(4)
(5)

20PPL 3rd Quarter Investor Update – November 4, 2021
Owned
Capacity
Power Plant Unit COD MW 2019A 2020A
Coal
Mill Creek 1 1972 300 57% 64% 2024
E.W. Brown 3 1971 412 25% 29% 2028
Mill Creek 2 1974 297 70% 35% 2028
Ghent 1 1974 475 65% 63% 2034
Ghent 2 1977 485 62% 59% 2034
Ghent 3 1981 481 56% 60% 2037
Ghent 4 1984 478 59% 53% 2037
Mill Creek 3 1978 391 54% 50% 2039
Mill Creek 4 1982 477 73% 54% 2039
Trimble County 1 1990 370 75% 81% 2045
Trimble County 2 2011 549 72% 76% 2066
Natural Gas
Cane Run (CCGT) 7 2015 662 86% 76% 2055
Total Baseload 5,377
Capacity FactorCurrently Projected
End of Economic
Useful Life
Baseload Generation ResourcesSummary of Kentucky’s baseload generation fleet
(1) Per most recent depreciation study filed in Case Nos. 2020-00349 and 2020-00350.
(1)
PPL’s Kentucky Baseload Generation Resources
21PPL 3rd Quarter Investor Update – November 4, 2021
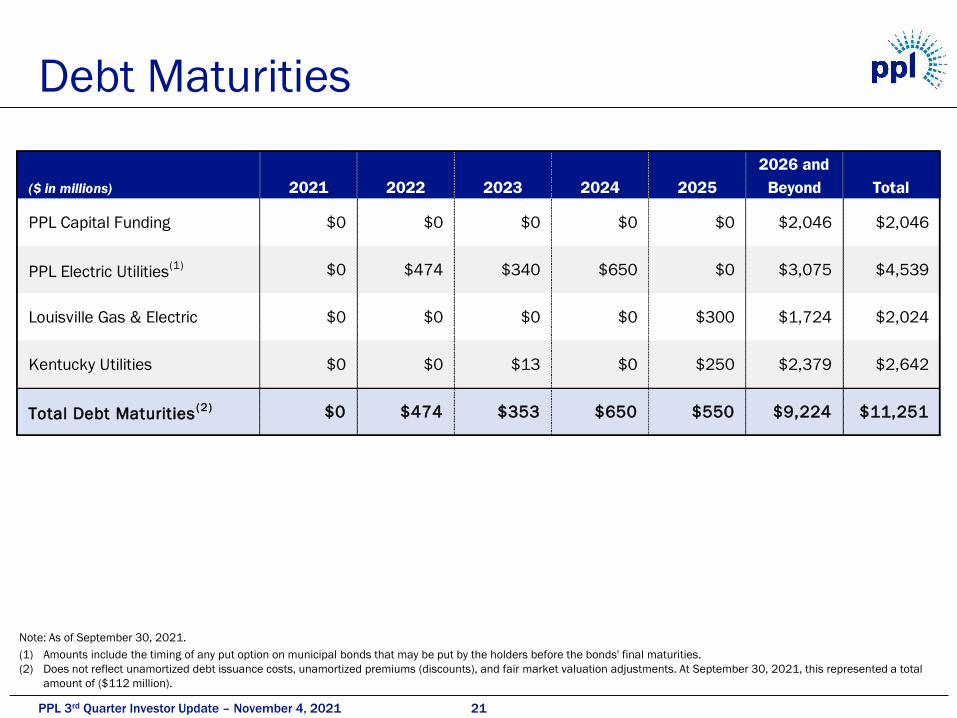
($ in millions) 2021 2022 2023 2024 2025
2026 and
Beyond Total
PPL Capital Funding $0 $0 $0 $0 $0 $2,046 $2,046
PPL Electric Utilities(1) $0 $474 $340 $650 $0 $3,075 $4,539
Louisville Gas & Electric $0 $0 $0 $0 $300 $1,724 $2,024
Kentucky Utilities $0 $0 $13 $0 $250 $2,379 $2,642
Total Debt Maturities(2) $0 $474 $353 $650 $550 $9,224 $11,251
Debt Maturities
Note: As of September 30, 2021.
(1) Amounts include the timing of any put option on municipal bonds that may be put by the holders before the bonds' final maturities.
(2) Does not reflect unamortized debt issuance costs, unamortized premiums (discounts), and fair market valuation adjustments. At September 30, 2021, this represented a total
amount of ($112 million).

22PPL 3rd Quarter Investor Update – November 4, 2021
Liquidity Profile
Note: As of September 30, 2021.
Entity Facility
Expiration
Date
Capacity
($ in mill ions)
Borrowed
($ in mill ions)
Letters of
Credit &
Commercial
Paper Issued
($ in mill ions)
Unused
Capacity
($ in mill ions)
PPL Capital Funding Syndicated Credit Facility Jan-2024 $1,450 $0 $0 $1,450
Bilateral Credit Facility Mar-2022 50 0 0 50
Uncommitted Credit Facility Mar-2022 50 0 15 35
$1,550 $0 $15 $1,535
PPL Electric Util ities Syndicated Credit Facility Jan-2024 $650 $0 $1 $649
Louisville Gas & Electric Syndicated Credit Facility Jan-2024 $500 $0 $0 $500
Kentucky Util ities Syndicated Credit Facility Jan-2024 $400 $0 $0 $400
Total Credit Facilities $3,100 $0 $16 $3,084

23PPL 3rd Quarter Investor Update – November 4, 2021
PPL’s Credit Ratings
PPL Electric UtilitiesLG&E and KU
Credit Rating
Secured
Unsecured
Long-term Issuer
Outlook
S&P
NR
BBB+
A-
Stable
Moody’s
NR
Baa2
NR
Positive
Credit Rating
Secured
Unsecured
Long-term Issuer
Outlook
S&P
A
NR
A-
Stable
Moody’s
A1
NR
A3
Stable
Credit Rating
Secured
Unsecured
Long-term Issuer
Outlook
S&P
A
NR
A-
Positive
Credit Rating
Secured
Unsecured
Long-term Issuer
Outlook
S&P
NR
NR
A-
Stable
Moody’s
NR
NR
Baa2
Positive
Moody’s
A1
NR
A3
Stable
PPL Corporation
PPL Capital Funding
Note: As of September 30, 2021.

24PPL 3rd Quarter Investor Update – November 4, 2021
After-Tax (Unaudited) 3rd Quarter Year-to-Date
($ in millions) September 30, 2021
KY
Reg.
PA
Reg.
Corp. &
Other
Disc.
Ops.Total
KY
Reg.
PA
Reg.
Corp. &
Other
Disc.
Ops.Total
Reported Earnings 159$ 126$ (76)$ (2)$ 207$ 389$ 335$ (848)$ (1,490)$ (1,614)$
Less: Special Items (expense) benefit:
Income (Loss) from Discontinued Operations (2) (2) (1,494) (1,494)
Talen litigation costs, net of tax of $1, $3 (1) (1) (10) (10)
Strategic corporate initiatives, net of tax of $0, $1 (1) (1) (3) (3)
Valuation allowance adjustment 4 (4) 4 4
Transmission formula rate return on equity reserve, net of tax of $0, $8 (20) (20)
Acquisition integration, net of tax of $3, $4 (9) (9) (11) (11)
U.K. tax rate change (383) (383)
Solar panel impairment, net of tax of $0, $9 (28) (28)
Loss on early extinguishment of debt, net of tax of $16, $83 (57) (57) (312) (312)
Total Special Items - - (68) (2) (70) 4 (20) (751) (1,490) (2,257)
Earnings from Ongoing Operations 159$ 126$ (8)$ -$ 277$ 385$ 355$ (97)$ -$ 643$
After-Tax (Unaudited) 3rd Quarter Year-to-Date
(per share - diluted) September 30, 2021
KY
Reg.
PA
Reg.
Corp. &
Other
Disc.
Ops.Total
KY
Reg.
PA
Reg.
Corp. &
Other
Disc.
Ops.Total
Reported Earnings 0.21$ 0.16$ (0.10)$ -$ 0.27$ 0.51$ 0.43$ (1.10)$ (1.94)$ (2.10)$
Less: Special Items (expense) benefit:
Income (Loss) from Discontinued Operations (1.95) (1.95)
Talen litigation costs (0.01) (0.01)
Valuation allowance adjustment 0.01 (0.01) 0.01 0.01
Transmission formula rate return on equity reserve (0.03) (0.03)
Acquisition integration (0.01) (0.01) (0.01) (0.01)
U.K. tax rate change (0.50) (0.50)
Solar panel impairment (0.04) (0.04)
Loss on early extinguishment of debt (0.08) (0.08) (0.40) (0.40)
Total Special Items - - (0.09) - (0.09) 0.01 (0.03) (0.97) (1.94) (2.93)
Earnings from Ongoing Operations 0.21$ 0.16$ (0.01)$ -$ 0.36$ 0.50$ 0.46$ (0.13)$ -$ 0.83$
September 30, 2021
September 30, 2021
Reconciliation of Segment Reported Earnings to Earnings From Ongoing Operations
(1)
(1)
(2) (2)
(2) (2)
(1) Reported Earnings represents Net Income.
(2) PPL sold its U.K. utility business on June 14, 2021, and its earnings were treated as a special item.

25PPL 3rd Quarter Investor Update – November 4, 2021
After-Tax (Unaudited) 3rd Quarter Year-to-Date
($ in millions) September 30, 2020
KY
Reg.
PA
Reg.
Corp. &
Other
Disc.
Ops.Total
KY
Reg.
PA
Reg.
Corp. &
Other
Disc.
Ops.Total
Reported Earnings 129$ 135$ (147)$ 164$ 281$ 330$ 371$ (227)$ 705$ 1,179$
Less: Special Items (expense) benefit:
Income (Loss) from Discontinued Operations 164 164 705 705
Talen litigation costs, net of tax of $1, $2 (2) (2) (6) (6)
COVID-19 impact, net of tax of $0, $0, $0, $1, $0, $0 (1) (1) (2) (4) (1) (1) (6)
Strategic corporative initiatives, net of tax of $2, $2 (5) (5) (5) (5)
U.K. tax rate change (102) (102) (102) (102)
Total Special Items - (1) (110) 164 53 (4) (1) (114) 705 586
Earnings from Ongoing Operations 129$ 136$ (37)$ -$ 228$ 334$ 372$ (113)$ -$ 593$
After-Tax (Unaudited) 3rd Quarter Year-to-Date
(per share - diluted) September 30, 2020
KY
Reg.
PA
Reg.
Corp. &
Other
Disc.
Ops.Total
KY
Reg.
PA
Reg.
Corp. &
Other
Disc.
Ops.Total
Reported Earnings 0.17$ 0.17$ (0.19)$ 0.22$ 0.37$ 0.43$ 0.48$ (0.29)$ 0.91$ 1.53$
Less: Special Items (expense) benefit:
Income (Loss) from Discontinued Operations 0.22 0.22 0.91 0.91
Talen litigation costs (0.01) (0.01) (0.01) (0.01)
Strategic corporate initiatives (0.01) (0.01) (0.01) (0.01)
U.K. tax rate change (0.13) (0.13) (0.13) (0.13)
Total Special Items - - (0.15) 0.22 0.07 - - (0.15) 0.91 0.76
Earnings from Ongoing Operations 0.17$ 0.17$ (0.04)$ -$ 0.30$ 0.43$ 0.48$ (0.14)$ -$ 0.77$
September 30, 2020
September 30, 2020
Reconciliation of Segment Reported Earnings to Earnings From Ongoing Operations
(1)
(3)
(1) Reported Earnings represents Net Income.
(2) The amount for the period ended September 30, 2020, has been adjusted for certain costs that were previously included in the U.K. Regulated segment.
(3) PPL sold its U.K. utility business on June 14, 2021, and its earnings were treated as a special item.
(2)
(1)
(2)
(3) (2)
(2) (3)
(3)
26PPL 3rd Quarter Investor Update – November 4, 2021
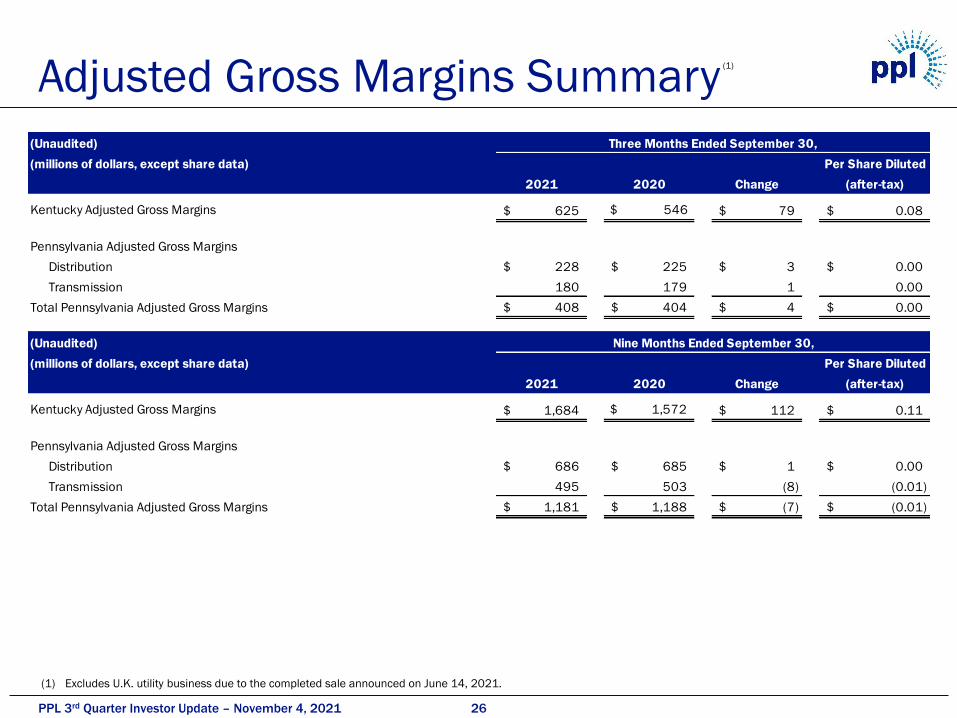
(Unaudited) Three Months Ended September 30,
(millions of dollars, except share data) Per Share Diluted
2021 2020 Change (after-tax)
Kentucky Adjusted Gross Margins 625$ $ 546 79$ 0.08$
Pennsylvania Adjusted Gross Margins
Distribution 228$ 225$ 3$ 0.00$
Transmission 180 179 1 0.00
Total Pennsylvania Adjusted Gross Margins 408$ 404$ 4$ 0.00$
(Unaudited) Nine Months Ended September 30,
(millions of dollars, except share data) Per Share Diluted
2021 2020 Change (after-tax)
Kentucky Adjusted Gross Margins 1,684$ $ 1,572 112$ 0.11$
Pennsylvania Adjusted Gross Margins
Distribution 686$ 685$ 1$ 0.00$
Transmission 495 503 (8) (0.01)
Total Pennsylvania Adjusted Gross Margins 1,181$ 1,188$ (7)$ (0.01)$
Adjusted Gross Margins Summary(1)
(1) Excludes U.K. utility business due to the completed sale announced on June 14, 2021.

27PPL 3rd Quarter Investor Update – November 4, 2021
Reconciliation of Adjusted Gross Margins to Operating Income(1)
(1) Excludes U.K. utility business due to the completed sale announced on June 14, 2021.
(Unaudited) Three Months Ended September 30, 2021 Nine Months Ended September 30, 2021
(millions of dollars) KY PA KY PA
Adjusted Adjusted Adjusted Adjusted
Gross Gross Operating Gross Gross Operating
Margins Margins Other Income Margins Margins Other Income
Operating Revenues 879$ 628$ 5$ 1,512$ 2,505$ 1,797$ (4)$ 4,298$
Operating Expenses
Fuel 195 - - 195 531 - - 531
Energy purchases 24 143 - 167 122 402 - 524
Other operation and maintenance 22 35 336 393 71 86 1,007 1,164
Depreciation 12 12 250 274 93 44 673 810
Taxes, other than income 1 30 21 52 4 84 65 153
Total Operating Expenses 254 220 607 1,081 821 616 1,745 3,182
Total 625$ 408$ (602)$ 431$ 1,684$ 1,181$ (1,749)$ 1,116$
(Unaudited) Three Months Ended September 30, 2020 Nine Months Ended September 30, 2020
(millions of dollars) KY PA KY PA
Adjusted Adjusted Adjusted Adjusted
Gross Gross Operating Gross Gross Operating
Margins Margins Other Income Margins Margins Other Income
Operating Revenues 806$ 586$ 8$ 1,400$ 2,331$ 1,748$ 24$ 4,103$
Operating Expenses
Fuel 177 - - 177 478 - - 478
Energy purchases 18 118 - 136 97 373 - 470
Other operation and maintenance 25 23 298 346 66 69 919 1,054
Depreciation 39 13 205 257 114 38 610 762
Taxes, other than income 1 28 18 47 4 80 47 131
Total Operating Expenses 260 182 521 963 759 560 1,576 2,895
Total 546$ 404$ (513)$ 437$ 1,572$ 1,188$ (1,552)$ 1,208$

28PPL 3rd Quarter Investor Update – November 4, 2021
Forward-Looking Information StatementStatements contained in this presentation, including statements with respect to future earnings, cash flows, dividends,
financing, regulation and corporate strategy, including the anticipated acquisition of Narragansett from National Grid, and
its impact on PPL Corporation, are “forward-looking statements” within the meaning of the federal securities laws. Although
PPL Corporation believes that the expectations and assumptions reflected in these forward-looking statements are
reasonable, these statements are subject to a number of risks and uncertainties, and actual results may differ materially
from the results discussed in the statements. The following are among the important factors that could cause actual results
to differ materially from the forward-looking statements: asset or business acquisitions and dispositions, including the
expected acquisition of Narragansett Electric, and our ability to realize expected benefits from them; the COVID-19
pandemic or other pandemic health events or other catastrophic events, including severe weather, and their effect on
financial markets, economic conditions and our businesses; the outcome of rate cases or other cost recovery or revenue
proceedings; market demand for energy in our service territories; weather conditions affecting customer energy usage and
operating costs; the effect of any business or industry restructuring; the profitability and liquidity of PPL Corporation and its
subsidiaries; new accounting requirements or new interpretations or applications of existing requirements; operating
performance of our facilities; the length of scheduled and unscheduled outages at our generating plants; environmental
conditions and requirements, and the related costs of compliance; system conditions and operating costs; development of
new projects, markets and technologies; performance of new ventures; receipt of necessary government permits, approvals,
capital market conditions, including interest rates, and decisions regarding capital structure; the impact of state, federal or
foreign investigations applicable to PPL Corporation and its subsidiaries; the outcome of litigation involving PPL Corporation
and its subsidiaries; stock price performance; the market prices of debt and equity securities and the impact on pension
income and resultant cash funding requirements for defined benefit pension plans; the securities and credit ratings of PPL
Corporation and its subsidiaries; changes in political, regulatory or economic conditions in states, regions or countries
where PPL Corporation or its subsidiaries conduct business, including any potential effects of threatened or actual
cyberattack, terrorism, or war or other hostilities; new state, federal or foreign legislation or regulatory developments,
including new tax legislation; and the commitments and liabilities of PPL Corporation and its subsidiaries. Any such forward-
looking statements should be considered in light of such important factors and in conjunction with factors and other
matters discussed in PPL Corporation's Form 10-K and other reports on file with the Securities and Exchange Commission.
29PPL 3rd Quarter Investor Update – November 4, 2021
Definitions of non-GAAP Financial Measures
Management utilizes "Earnings from Ongoing Operations" as a non-GAAP financial measure that should not be considered
as an alternative to reported earnings, or net income, an indicator of operating performance determined in accordance with
GAAP. PPL believes that Earnings from Ongoing Operations is useful and meaningful to investors because it provides
management's view of PPL's earnings performance as another criterion in making investment decisions. In addition, PPL's
management uses Earnings from Ongoing Operations in measuring achievement of certain corporate performance goals,
including targets for certain executive incentive compensation. Other companies may use different measures to present
financial performance.
Earnings from Ongoing Operations is adjusted for the impact of special items. Special items are presented in the financial
tables on an after-tax basis with the related income taxes on special items separately disclosed. Income taxes on special
items, when applicable, are calculated based on the statutory tax rate of the entity where the activity is recorded. Special
items may include items such as:
• Gains and losses on sales of assets not in the ordinary course of business.
• Impairment charges.
• Significant workforce reduction and other restructuring effects.
• Acquisition and divestiture-related adjustments.
• Significant losses on early extinguishment of debt.
• Other charges or credits that are, in management's view, non-recurring or otherwise not reflective of the company’s
ongoing operations.
30PPL 3rd Quarter Investor Update – November 4, 2021
Management also utilizes the following non-GAAP financial measures as indicators of performance for its businesses:
"Kentucky Adjusted Gross Margins" is a single financial performance measure of the electricity generation, transmission
and distribution operations of the Kentucky Regulated segment, as well as the Kentucky Regulated segment’s distribution
and sale of natural gas. In calculating this measure, fuel, energy purchases and certain variable costs of production
(recorded in "Other operation and maintenance" on the Statements of Income) are deducted from operating revenues. In
addition, certain other expenses, recorded in "Other operation and maintenance", "Depreciation" and "Taxes, other than
income" on the Statements of Income, associated with approved cost recovery mechanisms are offset against the recovery
of those expenses, which are included in revenues. These mechanisms allow for direct recovery of these expenses and, in
some cases, returns on capital investments and performance incentives. As a result, this measure represents the net
revenues from electricity and gas operations.
"Pennsylvania Adjusted Gross Margins" is a single financial performance measure of the electricity transmission and
distribution operations of the Pennsylvania Regulated segment. In calculating this measure, utility revenues and expenses
associated with approved recovery mechanisms, including energy provided as a PLR, are offset with minimal impact on
earnings. Costs associated with these mechanisms are recorded in "Energy purchases," "Other operation and
maintenance," (which are primarily Act 129, Storm Damage and Universal Service program costs), "Depreciation" (which is
primarily related to the Act 129 Smart Meter program) and "Taxes, other than income," (which is primarily gross receipts tax)
on the Statements of Income. This measure represents the net revenues from the Pennsylvania Regulated segment's
electricity delivery operations.
These measures are not intended to replace "Operating Income," which is determined in accordance with GAAP, as an
indicator of overall operating performance. Other companies may use different measures to analyze and report their results
of operations. Management believes these measures provide additional useful criteria to make investment decisions. These
performance measures are used, in conjunction with other information, by senior management and PPL's Board of
Directors to manage operations and analyze actual results compared with budget.
Reconciliations of adjusted gross margins for future periods are not provided as certain items excluded from Operating
Income are inherently subject to change and are not significant.
Definitions of non-GAAP Financial Measures


