73
PPM Essentials Accelerator Product Guide - On Demand Service Pack 02.0.02

PPM Essentials Accelerator Product Guide - On Demand
Service Pack 02.0.02

This Documentation, which includes embedded help systems and electronically distributed materials, (hereinafter referred to as the “Documentation”) is for your informational purposes only and is subject to change or withdrawal by CA at any time.
This Documentation may not be copied, transferred, reproduced, disclosed, modified or duplicated, in whole or in part, without the prior written consent of CA. This Documentation is confidential and proprietary information of CA and may not be disclosed by you or used for any purpose other than as may be permitted in (i) a separate agreement between you and CA governing your use of the CA software to which the Documentation relates; or (ii) a separate confidentiality agreement between you and CA.
Notwithstanding the foregoing, if you are a licensed user of the software product(s) addressed in the Documentation, you may print or otherwise make available a reasonable number of copies of the Documentation for internal use by you and your employees in connection with that software, provided that all CA copyright notices and legends are affixed to each reproduced copy.
The right to print or otherwise make available copies of the Documentation is limited to the period during which the applicable license for such software remains in full force and effect. Should the license terminate for any reason, it is your responsibility to certify in writing to CA that all copies and partial copies of the Documentation have been returned to CA or destroyed.
TO THE EXTENT PERMITTED BY APPLICABLE LAW, CA PROVIDES THIS DOCUMENTATION “AS IS” WITHOUT WARRANTY OF ANY KIND, INCLUDING WITHOUT LIMITATION, ANY IMPLIED WARRANTIES OF MERCHANTABILITY, FITNESS FOR A PARTICULAR PURPOSE, OR NONINFRINGEMENT. IN NO EVENT WILL CA BE LIABLE TO YOU OR ANY THIRD PARTY FOR ANY LOSS OR DAMAGE, DIRECT OR INDIRECT, FROM THE USE OF THIS DOCUMENTATION, INCLUDING WITHOUT LIMITATION, LOST PROFITS, LOST INVESTMENT, BUSINESS INTERRUPTION, GOODWILL, OR LOST DATA, EVEN IF CA IS EXPRESSLY ADVISED IN ADVANCE OF THE POSSIBILITY OF SUCH LOSS OR DAMAGE.
The use of any software product referenced in the Documentation is governed by the applicable license agreement and such license agreement is not modified in any way by the terms of this notice.
The manufacturer of this Documentation is CA.
Provided with “Restricted Rights.” Use, duplication or disclosure by the United States Government is subject to the restrictions set forth in FAR Sections 12.212, 52.227-14, and 52.227-19(c)(1) - (2) and DFARS Section 252.227-7014(b)(3), as applicable, or their successors.
Copyright © 2013 CA. All rights reserved. All trademarks, trade names, service marks, and logos referenced herein belong to their respective companies.
Contact CA Technologies
Contact CA Support
For your convenience, CA Technologies provides one site where you can access the information that you need for your Home Office, Small Business, and Enterprise CA Technologies products. At http://ca.com/support, you can access the following resources:
■ Online and telephone contact information for technical assistance and customer services
■ Information about user communities and forums
■ Product and documentation downloads
■ CA Support policies and guidelines
■ Other helpful resources appropriate for your product
Providing Feedback About Product Documentation
If you have comments or questions about CA Technologies product documentation, you can send a message to [email protected].
To provide feedback about CA Technologies product documentation, complete our short customer survey which is available on the CA Support website at http://ca.com/docs.

Contents 5
Contents
Chapter 1: Overview 9
PPM Essentials Accelerator Overview .......................................................................................................................... 9
How to Use the PPM Essentials Accelerator ................................................................................................................ 9
Access the Dashboards and Portlets ................................................................................................................... 10
Project Templates ...................................................................................................................................................... 10
Organizational Breakdown Structures ....................................................................................................................... 11
PPM Essentials Accelerator Access Groups ................................................................................................................ 11
Other Work ................................................................................................................................................................ 12
Chapter 2: Viewing the Demand Center Dashboard 13
About the Demand Center ......................................................................................................................................... 13
How to Set up the Demand Center ..................................................................................................................... 13
Submit Ideas ............................................................................................................................................................... 14
Create Ideas ........................................................................................................................................................ 14
Ideas Categorized By Type Portlet ...................................................................................................................... 15
Define Idea Alignment and Tracking Factors ............................................................................................................. 15
Demand Ranking ........................................................................................................................................................ 16
Demand Ranking Portlet ..................................................................................................................................... 16
Demand Analysis ........................................................................................................................................................ 18
Demand Analysis Portlet ..................................................................................................................................... 18
Demand Worksheet ................................................................................................................................................... 19
Demand Summary Portlet ................................................................................................................................... 19
Incoming Demand Portlet ................................................................................................................................... 20
Chapter 3: Viewing the Project Center Dashboard 21
About the Project Center ........................................................................................................................................... 21
How to Set up the Project Center ....................................................................................................................... 22
Define Project Alignment and Tracking Factors ......................................................................................................... 22
Create Project Status Reports .................................................................................................................................... 24
My Alerts .................................................................................................................................................................... 26
Schedule Performance Portlet ............................................................................................................................ 26
Staffing Outlook Portlet ...................................................................................................................................... 27
Milestones Portlet ............................................................................................................................................... 28
Prioritized Issues Portlet ..................................................................................................................................... 29
My Team..................................................................................................................................................................... 30
Resource Work Queue Portlet ............................................................................................................................ 31
6 PPM Essentials Accelerator Product Guide - On Demand
Resource Assignments Portlet ............................................................................................................................ 32
My Controls ................................................................................................................................................................ 32
Tasks Portlet ........................................................................................................................................................ 33
Change Requests Portlet ..................................................................................................................................... 33
Issues Portlet ....................................................................................................................................................... 34
Risks Portlet ........................................................................................................................................................ 35
Deliverables ................................................................................................................................................................ 37
Project Deliverables Review Portlet .................................................................................................................... 37
Timesheet Review ...................................................................................................................................................... 38
Timesheet Review Portlet ................................................................................................................................... 38
Pending Estimates Portlet ................................................................................................................................... 39
Chapter 4: Viewing the Resource Center Dashboard 41
About the Resource Center ........................................................................................................................................ 41
How to Set up the Resource Center .................................................................................................................... 42
Resource Planning ...................................................................................................................................................... 42
All Resources Portlet ........................................................................................................................................... 42
Resource Supply Portlet ...................................................................................................................................... 43
Resource Demand Portlet ................................................................................................................................... 44
Role Supply and Demand ........................................................................................................................................... 44
Role Supply and Demand Histogram Portlet ....................................................................................................... 45
Resource Allocation .................................................................................................................................................... 45
Weekly Detail of Resource Allocations Portlet ................................................................................................... 45
Unfilled Allocations .................................................................................................................................................... 46
Unfilled Requirements Portlet ............................................................................................................................ 46
Chapter 5: Viewing the Governance Center Dashboard 49
About the Governance Center ................................................................................................................................... 49
How to Set up the Governance Center ............................................................................................................... 50
Project Review ............................................................................................................................................................ 50
Project Review Portlet ........................................................................................................................................ 50
Project KPIs................................................................................................................................................................. 51
Project KPIs By OBS Portlet ................................................................................................................................. 51
Status Reports ............................................................................................................................................................ 53
Project Status Reports Summary Portlet ............................................................................................................ 53
Project Schedule ......................................................................................................................................................... 55
Project Schedule Portlet ..................................................................................................................................... 55
Project Cost ................................................................................................................................................................ 56
Project Cost and Effort Portlet ............................................................................................................................ 56

Contents 7
Chapter 6: Viewing the PPM Essentials Project Dashboard 59
About the PPM Essentials Project Dashboard ............................................................................................................ 59
Quick Metrics Portlet .......................................................................................................................................... 59
Upcoming Milestones Portlet ............................................................................................................................. 61
Recent Project Activity Portlet ............................................................................................................................ 61
Status Reports Portlet ......................................................................................................................................... 62
Appendix A: Access Rights 63
Access Rights .............................................................................................................................................................. 63
Group Access Rights ................................................................................................................................................... 63
PPM Essentials Demand Manager Group Access Rights ..................................................................................... 64
PPM Essentials Executive Group Access Rights................................................................................................... 65
PPM Essentials Idea Requestor Group Access Rights ......................................................................................... 67
PPM Essentials Project Manager Group Access Rights ....................................................................................... 68
PPM Essentials Resource Manager Group Access Rights .................................................................................... 70
PPM Essentials Team Member Group Access Rights .......................................................................................... 72

Chapter 1: Overview 9
Chapter 1: Overview
This section contains the following topics:
PPM Essentials Accelerator Overview (see page 9) How to Use the PPM Essentials Accelerator (see page 9) Project Templates (see page 10) Organizational Breakdown Structures (see page 11) PPM Essentials Accelerator Access Groups (see page 11) Other Work (see page 12)
PPM Essentials Accelerator Overview
The CA Clarity PPM Essentials Accelerator (PPM Essentials Accelerator) is an add-in for project management that provides the following:
■ Speedier and easy implementation of project management capabilities
■ Quick start to basic project management
■ Dashboards that guide you through key project management tasks
■ Project status reporting tools
How to Use the PPM Essentials Accelerator
The PPM Essentials Accelerator provides project management views into the following areas:
■ Demand management (see page 13). Demand Managers can use the Demand Center dashboard to review submitted project ideas.
■ Project management (see page 21). Project managers can use the Project Center dashboard to get high-level views on the projects they are managing
■ Resource management (see page 41). Resource managers or schedulers can use the Resource Center dashboard to get high-level views into the resources they are managing.
■ Project governance (see page 49). Executives can use the Governance Center dashboard to get aggregated views of projects and resources and decide about budgets, priorities, and more.
Project Templates
10 PPM Essentials Accelerator Product Guide - On Demand
Access the Dashboards and Portlets
The PPM Essentials Accelerator includes dashboards and portlets that display information about your ideas, projects, and resources.
Note: You can view the ideas and projects on the portlets that you manage or have access to.
Follow these steps:
1. Open the Dashboard menu and click a dashboard link.
The dashboard page appears.
2. Click a page to view the portlets.
Project Templates
The PPM Essentials Accelerator includes the following project templates you can use to convert an idea to a project or to create a new project:
■ Development Template (MSP). Use this template if Microsoft Project is your project scheduler.
■ Development Template (OWB). Use this template if Open Workbench is your project scheduler.
To change the default scheduler for a template, select the other scheduler from the Scheduler Format drop-down menu on the Create Project page.
The templates use the PPM Essentials Dashboard view for displaying all the portlets that provide a quick update on specific project metrics.
All the fields on the templates are standard to CA Clarity PPM project templates.
For more information, see the Project Management User Guide.
These PPM Essentials project templates include the following that can be modified to suit your business needs:
■ A work breakdown structure for creating project tasks.
■ The following folders for storing project documents in the Collaboration page:
– Design Deliverables
– Project Management
Organizational Breakdown Structures
Chapter 1: Overview 11
Organizational Breakdown Structures
The PPM Essentials Accelerator includes organizational breakdown structures (OBS) that can be a starting point and expand them to suit your business needs.
The OBS structures allow you to:
■ Filter information in the portlets for reporting purposes.
■ Restrict user access to different areas of the product using access groups with different privileges.
The following organizational breakdown structures are included:
■ Organization OBS. Allows you to group the business units within your organization and contains the following levels:
– All Lines of Business
– Line of Business (Internal Initiatives and Product Management)
■ Resource OBS. Allows you to group resources for reporting purposes and contains the following levels:
– All Employees
– Employee Groups (Administration, Engineering, Quality Assurance, Sales and Marketing, Services)
For more information, see the Administration Guide.
PPM Essentials Accelerator Access Groups
The PPM Essentials Accelerator includes access groups that represent specific project roles. The content included with the accelerator is designed for the access groups. Each access group is associated with a set of access rights that allows group members access to secured pages, portlets, and reports.
The access groups with the access rights provide you with a starting point for ensuring that the right users access the right pages. You can add your users to the access groups or modify the access groups and rights.
For more information, see the Administration Guide.
The following access groups are included with the accelerator:
■ PPM Essentials Demand Manager (see page 64). This group has access to the Demand Center and the Project Center dashboards. The analysts determine the project pipeline and can create, edit, and approve ideas. They can also create projects from ideas.
Other Work
12 PPM Essentials Accelerator Product Guide - On Demand
■ PPM Essentials Idea Requestor (see page 67). This group includes users that can create and submit ideas only. They have access to Submit Ideas.
■ PPM Essentials Project Manager (see page 68). The group has access to the Project Center, Governance Center, and the PPM Essentials Project dashboards. They can create and edit projects, resources, and ideas in the OBS to which they are associated.
■ PPM Essentials Resource Manager (see page 70). The group has access to the Project Center, Resource Center, and the PPM Essentials Project dashboards. They can edit, schedule, and book resources to projects.
■ PPM Essentials Team Member (see page 72). The group has access to the Project Center and the PPM Essentials Project dashboards. As project participants they can submit ideas and timesheets.
■ PPM Essentials Executive (see page 65). The group has access to the Governance Center dashboard. The executives can view project information across the organization.
Other Work
The PPM Essentials Accelerator includes the following other work instances for recording resource vacation or sick time:
■ Holiday
■ Personal Leave
■ Vacation Time
Assign all resources in your organization to the other work teams to enter vacation or sick time. Once a resource is assigned to the teams, they can see the Other Time section on their timesheets. Resources can then record any time that they are planning to take off in their timesheets.
For more information, see the Portfolio Management User Guide.

Chapter 2: Viewing the Demand Center Dashboard 13
Chapter 2: Viewing the Demand Center Dashboard
This section contains the following topics:
About the Demand Center (see page 13) Submit Ideas (see page 14) Define Idea Alignment and Tracking Factors (see page 15) Demand Ranking (see page 16) Demand Analysis (see page 18) Demand Worksheet (see page 19)
About the Demand Center
The Demand Center is a dashboard for reviewing and analyzing your business ideas. This dashboard provides views and metrics such as cost and ETC on which you can prioritize your ideas. Use this dashboard for the following:
■ Review submitted ideas
■ Specify budget limits
■ Create a shortlist of ideas that fit into a set budget
The Demand Center dashboard includes the following tabs:
■ Demand Ranking (see page 16). Lets you rank ideas according to their business alignment rating.
■ Demand Analysis (see page 18). Lets you analyze your business ideas by comparing cost with the return on investment.
■ Demand Worksheet (see page 19). Gives you a summarized view of total idea costs and displays all ideas in the pipeline.
How to Set up the Demand Center
To view information about the Demand Center dashboard, complete the following:
■ Ideas are defined as potential project opportunities.
Note: See the Demand Management User Guide for more information.
■ Resources and roles are created and assigned to ideas.
Note: See the Resource Management User Guide for more information.
■ Business alignment and tracking factors are defined for the idea (see page 15).
Submit Ideas
14 PPM Essentials Accelerator Product Guide - On Demand
Submit Ideas
Use the Submit Ideas to:
■ Create and submit new ideas for approval.
■ View your existing ideas categorized by type.
The ideas created from the page are referenced in portlets on the Demand Center dashboard.
This tab includes the following portlets:
■ Ideas
■ Ideas Categorized By Type
Create Ideas
As an idea requestor, use the Ideas page to create new ideas and submit them for approval. You can also approve, reject, or mark existing ideas for deletion from this portlet.
See the Demand Management User Guide for more information.
Follow these steps:
1. Open the Personal menu and click Overview.
The overview page appears.
2. Click Submit Ideas.
The submit ideas page appears.
3. Click New.
The create page appears.
4. Specify the details for the idea.
5. Select an idea type from the drop-down menu.
6. Save the new idea and submit for approval.
Define Idea Alignment and Tracking Factors
Chapter 2: Viewing the Demand Center Dashboard 15
Ideas Categorized By Type Portlet
The Ideas Categorized By Type portlet displays the percentage of ideas for the following idea types in a pie chart format:
■ Major Project
■ Application Change
■ Infrastructure Deployment
If no type is selected for an idea, it is displayed as Undefined. Each pie slice in the pie chart represents an idea type. You can filter on idea status to see how many ideas are approved or not approved for each idea type.
Define Idea Alignment and Tracking Factors
Each business alignment and tracking value that you define for an idea is associated with a number. All the numbers together are used to determine an average which is then considered the Business Alignment score for the idea.
Follow these steps:
1. Open Home, and from Demand Management, click Ideas.
The ideas page appears.
2. Click the idea to define business alignment and tracking factors.
The properties page appears.
3. Open the Properties menu, and click Alignment and Tracking.
The alignment and tracking properties page appears.
4. Specify the following alignment and tracking factors that are specific to the PPM Essentials Accelerator.
See the Demand Management User Guide for more information.
Business Value
Displays the amount of business value (high, medium, low) associated with the idea. Click the drop-down menu to select an option. After you save, the stoplight color changes as follows:
■ Red. The idea is of low business value.
■ Yellow. The idea is of medium business value.
■ Green. The idea is of high business Value
Demand Ranking
16 PPM Essentials Accelerator Product Guide - On Demand
Sponsorship
Displays the amount of sponsorship (high, medium, low) available for the idea. Click the drop-down menu to select an option. After you save, the stoplight color changes as follows:
■ Red. Low Sponsorship
■ Yellow. Medium Sponsorship
■ Green. High Sponsorship
Technology Compliance
Displays the technology compliance status of the idea. Click the drop-down menu to select an option. After you save, the stoplight color changes as follows:
■ Red. Not in Compliance
■ Yellow. Not in Compliance - but Stable
■ Green. Compliance with Architecture Standards
5. Submit your changes.
Demand Ranking
Use the Demand Ranking page to view your ideas ranked by their business alignment rating. The page includes the Demand Ranking portlet that lists the highest rated ideas first.
To display information in the Demand Ranking page:
■ Define business alignment and tracking values for the ideas.
■ Define planned cost amounts and assign resources to the ideas.
Demand Ranking Portlet
The Demand Ranking portlet lists ideas ranked by their business alignment values.
Use the Budget and Resource filter fields to highlight ideas matching the specified budget and ETC amounts. The Running Total columns continue adding up the budget and resource ETC amounts for each row in the portlet.
This portlet provides the following details about the listed ideas:
Yellow Check Mark
Indicates that the idea must be included on the list display when you filter ideas.
Demand Ranking
Chapter 2: Viewing the Demand Center Dashboard 17
Subject
Displays the name of the idea. Click the idea link to open the idea properties page and edit the idea.
Requestor
Displays the name of the person who requested the idea. Click the requestor link to open the resource properties page and edit the requestor information.
Budget
Displays the planned cost or budgeted amount for the idea. Click the budget link to open the budget page of ideas properties page and edit the budget properties for the idea.
Budget Running Total
Displays the running total of the budget amount including the amount from the previous rows. For example, if the portlet lists three ideas with the following budget amounts: 1,000, 2,000, and 3,000, the running total on each row is as follows:
■ 1,000
■ 3,000
■ 6,000
Resource ETC
Displays the ETC amount for the idea team.
Resource ETC Running Total
Displays the running total of the ETC hours including the amount from previous rows.
Business Alignment
Displays a stoplight indicating the business alignment value for the idea. The stoplight is based on the Business Alignment stoplight on the properties page of alignment and tracking.
Stoplights:
■ Green. The idea is aligned.
■ Yellow. The idea has an average alignment.
■ Red. The idea is poorly aligned.
Demand Analysis
18 PPM Essentials Accelerator Product Guide - On Demand
Demand Analysis
Use Demand Analysis to analyze the business ideas by comparing the cost with the return on investment (ROI) for each idea. The page includes the Demand Analysis portlet.
To display information in the Demand Analysis page, define the following information for the ideas:
■ ROI percentages
■ Planned cost
■ Business alignment rating
■ Start date
Demand Analysis Portlet
The Demand Analysis portlet displays cost, ROI, and business alignment information for ideas in a bubble chart format.
Each bubble on the bubble chart represents an idea. The size of the bubble represents the cost and the color represents the return on investment for that idea. The larger the bubble, the greater the cost for that idea.
The bubble colors indicate the following:
■ Green. The return is greater than 110 percent
■ Yellow. The return is from 100 to 110 percent
■ Red. The return is less than 100 percent
The X-axis of the chart displays the start dates of the ideas. The Y-axis displays the business alignment ranking for the ideas using the following background colors:
■ Green. The business alignment for the idea is from 68 to 100.
■ Yellow. The business alignment for the idea is from 34 to 68.
■ Red. The business alignment for the idea is from 0 to 34.
Mouse-over a bubble to view the following information for an idea:
■ The idea name
■ The business alignment ranking
■ The planned cost amount
Click a bubble to open the budget page of idea properties to edit the planned cost and benefit information for the idea.
Demand Worksheet
Chapter 2: Viewing the Demand Center Dashboard 19
Demand Worksheet
Use Demand Worksheet to get the latest status on your ideas in terms of their approval status, schedule, cost, ETC, and business compliance. You can also get a summarized view of total idea costs grouped by categories.
This page includes the following portlets:
■ Demand Summary
■ Incoming Demand
Demand Summary Portlet
The Demand Summary portlet provides a summary of the total idea costs. This portlet includes the following fields:
Description
Displays the following rows of information:
■ Budget Limit. Displays budget and resource amounts based on the value entered in the Budget Limit filter field.
■ Approved to Date. Displays the budget and resource amounts for only the approved ideas.
■ Available. Displays the difference between Budget Limit and Approved to Date.
Budget
Displays the total planned cost for a specific group of ideas.
Resources
Displays the total resource ETC for a specific group of ideas.
Demand Worksheet
20 PPM Essentials Accelerator Product Guide - On Demand
Incoming Demand Portlet
The Incoming Demand portlet lists all the ideas in the pipeline.
The portlet provides the following information about the listed ideas:
Status
Displays the idea status as follows:
■ Blue sideways arrow. Converted
■ Green up arrow. Approved, Resumed
■ Red down arrow. Rejected, Incomplete, Unapproved, Canceled
■ Yellow triangle. On Hold
■ Yellow check mark. Submitted for Approval
Subject
Displays the name of the idea. Click the idea link to open the ideas properties page and edit the idea.
Start Date
Displays the date of starting with the idea.
Cost
Displays the planned cost amount for the idea.
Resource ETC
Displays the total ETC hours based on the resources added to the idea team.
Business Alignment
Displays a stoplight based on the value of the Business Alignment stoplight that displays on the alignment and tracking page of ideas properties.
Stoplights Colors:
■ Green. The idea is aligned.
■ Yellow. The idea has an average alignment.
■ Red. The idea is poorly aligned.
Chapter 3: Viewing the Project Center Dashboard 21
Chapter 3: Viewing the Project Center Dashboard
This section contains the following topics:
About the Project Center (see page 21) Define Project Alignment and Tracking Factors (see page 22) Create Project Status Reports (see page 24) My Alerts (see page 26) My Team (see page 30) My Controls (see page 32) Deliverables (see page 37) Timesheet Review (see page 38)
About the Project Center
Project managers review issues, risks, and change requests related to their projects. They also monitor the project schedule and tasks.
The Project Center dashboard includes the following pages:
■ My Alerts (see page 26). Lets you review project issues that need immediate attention such as late tasks, unstaffed hours, and upcoming milestones.
■ My Team (see page 30). Lets you view and edit resource information for specific project tasks.
■ My Controls (see page 32). Lets you view project metrics such as risks and issues and their latest status.
■ Deliverables (see page 37). Lets you review project deliverable documents such as project design, plan, and scope documents.
■ Timesheet Review (see page 38). Lets you view, approve, or return resource timesheets and compare actuals with estimates.
Define Project Alignment and Tracking Factors
22 PPM Essentials Accelerator Product Guide - On Demand
How to Set up the Project Center
To view project information about the Project Center dashboard, complete the following:
■ Projects are created based on approved ideas, baselined, and include the following:
– Project metrics such as issues, risks, and change requests are defined.
– Deliverable documents uploaded to the Collaboration page on projects and attached to tasks.
For more information, see the Project Management User Guide.
■ Project management options for the following are set up in Administration:
– Risk Settings
– Timesheet Options
– Document Templates
– Settings
– Time Reporting Periods
For more information, see the Administration Guide.
■ Financial management is set up for entities, locations, departments, rates, and charge codes.
■ Resources and roles are created and assigned to projects.
For more information about managing resources, see the Resource Management User Guide.
■ Timesheets is set up for resources to enter time against their assigned tasks.
For more information, see the Personalizing CA Clarity PPM User Guide.
■ Business alignment and tracking factors are defined for the projects (see page 22).
■ Project status reports are created (see page 24).
Define Project Alignment and Tracking Factors
Each business alignment value that you define for a project is associated with a number. All the numbers together are used to determine an average which is then considered the Business Alignment score for the project.
For more information, see the Project Management User Guide.
Define Project Alignment and Tracking Factors
Chapter 3: Viewing the Project Center Dashboard 23
Follow these steps:
1. Open Home, and from Portfolio Management, and click Projects.
The projects page appears.
2. Click the project to define business alignment and tracking factors.
The project properties page appears.
3. Open the Properties menu, and click Alignment and Tracking.
The alignment and tracking properties page appears.
4. Specify the following business alignment values:
Business Value
Displays the amount of business value (high, medium, low) associated with the project. Click the drop-down menu to select an option. After you save, the stoplight color changes as follows:
■ Red. Low Business Value
■ Yellow. Medium Business Value
■ Green. High Business Value
Sponsorship
Displays the amount of sponsorship (high, medium, low) available for the project. Click the drop-down menu to select an option. After you save, the stoplight color changes as follows:
■ Red. Low Sponsorship
■ Yellow. Medium Sponsorship
■ Green. High Sponsorship
Technology Compliance
Displays the technology compliance status of the project. Click the drop-down menu to select an option. After you click Save, the stoplight color changes as follows:
■ Red. Not in Compliance
■ Medium. Compliance with Architecture Standards
■ Low. Not in Compliance - but Stable
5. Specify the following project tracking values:
Scheduler Format
Specifies the scheduler format used for the project. Click the drop-down menu and select a scheduler format (Microsoft Project or Open Workbench).

Create Project Status Reports
24 PPM Essentials Accelerator Product Guide - On Demand
Dashboard View
Specifies the dashboard view selected for the project. Click the drop-down menu to select a view option.
Default: PPM Essential Project Dashboard
Set Budget Dates
Indicates if the budget dates synchronizes with project dates. Select the check box to synchronize budget date with project dates.
6. Submit your changes.
Create Project Status Reports
You can enter weekly, monthly, or quarterly project status reports. These status reports indicate how a project is doing in terms of schedule, cost, and scope where compared to the baseline. If a project is not baselined, then the original project plan is used as a snapshot.
These reports are referenced in portlets on the Project Center dashboard.
Follow these steps:
1. Open Home, and from Portfolio Management, and click Projects.
The projects page appears.
2. Select the project to create a status report.
The properties page appears.
3. Open the Properties menu and click Status Report List.
The list page appears.
4. Click New.
The create page appears.
5. Complete the following:
Status Report Update
Provides a status update summary on the project. Enter the summary in the text box.
Report Date
Displays the date when the report was created. Enter or select a date.
Schedule Status
Displays a stoplight indicating the current project schedule status. Click the drop-down menu to select a schedule status.
Create Project Status Reports
Chapter 3: Viewing the Project Center Dashboard 25
Current Phase
Displays the current phase of the project. Click the drop-down menu to select a phase.
Next Milestone on Track?
Indicates if the next milestone is on track. Select the check box to indicate that the next milestone is on track.
Variance Explanation
Provides an explanation for a variance in the project schedule. Enter an explanation in the text box.
Scope Status
Displays a stoplight indicating the status of the project scope. Click the drop-down menu to select a scope status.
Scope Change Required?
Indicates if a change in the project scope is required. Select the check box to indicate if a change in the scope is required.
Deliverable Scope Changed?
Indicates if the scope of the project deliverable has changed. Select the check box to indicate that project deliverable scope has changed.
Project Objective Changed?
Indicates if the project objective has changed. Select the check box to indicate that the project objective has changed.
Change Explanation
Provides an explanation for a change in the project objective. Enter an explanation in the text box.
Cost and Effort Status
Displays a stoplight indicating the cost and effort status of the project. Click the drop-down menu to select a cost and effort status.
Review Approval Problems?
Indicates if the project is encountering any review approval problems. Select the check box to indicate that the project is encountering review approval problems.
Staffing/Availability Issues?
Indicates if the project is encountering staffing availability issues. Select the check box to indicate that the project is encountering staffing availability issues.
My Alerts
26 PPM Essentials Accelerator Product Guide - On Demand
Project Affected by External Factors?
Indicates if the project is affected by external factors. Select the check box to indicate that the project is affected by external factors.
Cost and Effort Explanation
Provides an explanation for the cost and effort status. Enter an explanation in the text box.
6. Submit your changes.
My Alerts
Use My Alerts to get a high-level exception-based view of your activities and closely monitor potential problem areas.
The page includes the following portlets:
■ Schedule Performance
■ Staffing Outlook
■ Milestones
■ Prioritized Issues
Schedule Performance Portlet
A task is considered late if it is past the baseline due date, or the finish date for the task (if the project was not baselined). A task is considered scheduled late when baseline due date is before the finish date for the task. This implies that the project was baselined and then the task date was moved out.
The Schedule Performance portlet displays the number of late tasks in a column graph format. Late tasks are categorized as follows:
■ Critical Late (Red). These tasks are late and they are on the critical path for the project. The 'is critical' flag is turned on for these tasks during auto scheduling.
■ Past Due (Blue). These are non-critical tasks that are past their baseline due date or the finish date.
■ Scheduled Late (Green). These are non-critical tasks that are due as of the current date or in the future depending on when the tasks were scheduled.
If no columns appear on the graph, it means that all tasks are finishing as scheduled.
My Alerts
Chapter 3: Viewing the Project Center Dashboard 27
From the Schedule Performance portlet, click a column in the graph to open the Schedule Performance Details portlet for a list of the critical late, past due, or scheduled late tasks. This portlet displays the following details for that task group:
Project
Displays the name of the associated project. Click the project name link to open the project properties page and edit the project.
Task
Displays the name of the associated task. Click the task name link to open the task properties page and edit the task.
Status
Indicates the status of the task.
Values: Started, Not Started, and Completed
Classification
Displays the task grouping.
Values: Critical Late, Past Due, and Scheduled Late
Due Date
Displays the date when the task is scheduled to be completed.
Days Late
Displays the number of days past the due date of the task, based on the current date.
Total Effort
Displays the total effort or ETC to complete the task.
Staffing Outlook Portlet
The Staffing Outlook portlet lets you identify project tasks where resources are not assigned. The portlet displays in a bar chart format the unstaffed hours or estimate-to-complete (ETC). Unstaffed hours are the hours assigned to a role for tasks that are not completed. The Y-axis of the chart displays project names. The X-axis displays the number of unassigned hours for each project.
You can replace a role with resources that can complete the work. Click a bar on the chart to go to the Staffing Drill Down page and search for resources. This page includes the Staffing Outlook Details portlet. This portlet provides a graphical view of all the unstaffed tasks and includes the following fields:
Project
Displays the name of the associated project. Click the project name link to open the project properties page and edit the project.
My Alerts
28 PPM Essentials Accelerator Product Guide - On Demand
Task
Displays the name of the associated task. Click the task link to open the task properties page and edit the task.
Unstaffed Role
Displays the role name that is unstaffed. Click the role link to open the team staff page and assign resources to the role.
Assignment Start Date
Displays the date of starting the associated task.
Assignment Finish Date
Displays the date of completing the associated task.
ETC
Displays the total hours of unstaffed ETC.
Milestones Portlet
The Milestones portlet lists the incomplete project milestones, or tasks and how they affect the project schedule.
This portlet includes the following fields:
Schedule
Displays a stoplight indicating the project schedule based on the value in the Days Late column.
Stoplight Colors:
■ White. The milestone data is undefined.
■ Green. The milestone is on schedule.
■ Yellow. The milestone is not yet late. But the due date is less than or equal to three days from the current date.
■ Red. The milestone is late by one or more days.
Project
Displays the name of the associated project. Click the project name link to open the project properties page and edit the project.
Milestone
Displays the name of the milestone. Click the milestone link to open the task properties page and edit the milestone.

My Alerts
Chapter 3: Viewing the Project Center Dashboard 29
Due Date
Displays the due date for the milestone to be complete. The due date is the baseline finish date for the milestone. If no baseline exists, is the finish date of the milestone.
Days Late
Displays the number of days past the baseline due date for the milestone. If the milestone is not late, a negative number displays indicating the number of days until the due date. For example, a negative five implies that five days are left before the task becomes due.
Prioritized Issues Portlet
The Prioritized Issues portlet gives you a high-level view of the current issues in a project and alerts you for large number of issues. The data appears in a pie chart format with each pie slice representing the number of open issues, grouped by priority, across all projects.
The number displayed next to each pie slice indicates the percentage of open issues for a particular type of priority (high, medium, or low). Open issues have statuses other than “Closed”.
From the Prioritized Issues portlet, click a pie slice to go to the Prioritized Issues Drill Down page and view the Prioritized Issues Listing portlet.
To display information in this portlet, issues must be defined for your projects.
This portlet displays the following details for a specific group of issues:
Schedule
Displays a stoplight indicating if the resolution of the issue is on schedule.
Stoplight Colors:
■ Red. The resolution of the issue is late by one or more days.
■ Yellow. The resolution of the issue is due in two or less days.
■ Green. The resolution of the issue is due in two or more days.
Priority
Displays a stoplight indicating the priority status of the issue.
Stoplight Colors:
■ Red. High priority
■ Yellow. Medium priority
■ Green. Low priority
My Team
30 PPM Essentials Accelerator Product Guide - On Demand
Issue ID
Displays the issue ID. Click the issue link to open the issue properties page and edit the issue.
Issue Description
Displays the issue description. Click the description link to open the issue properties page and edit the issue.
Project
Displays the name of the associated project. Click the project name link to open the project properties page and edit the project.
Category
Displays the issue category.
Owner
Displays the name of the person who owns the issue. Click the Send Mail icon next to an owner to send an email to the owner.
Target Resolution Date
Displays the target date for resolving the issue.
My Team
Use My Team to do the following:
■ View team resource information.
■ Track resource work queue.
■ Compare the ETC supply and demand curves.
The page includes the following portlets:
■ Resource Work Queue
■ Resource Assignments

My Team
Chapter 3: Viewing the Project Center Dashboard 31
Resource Work Queue Portlet
The Resource Work Queue portlet provides team resource information for each task and displays daily ETCs in a chart format.
To display information about the portlet, assign resources to tasks with ETCs.
The portlet provides the following information about the team:
Resource
Displays the associated resource name. Click the resource name link to open the resource properties page and edit the resource.
Project
Displays the name of the associated project. Click the project name link to open the project properties page and edit the project.
Task
Displays the name of the associated task. Click the task name link to open the task properties page and edit the task.
Status
Indicates the status of the task.
Values: Started, Not Started, and Completed. Click the status link to open the assignment properties page and edit ETC or assignment dates.
Priority
Displays a stoplight indicating the priority status of the task.
Stoplight Colors:
■ Green. Low priority (six and greater)
■ Yellow. Medium priority (from two through six)
■ Red. High priority (from one through two)
Schedule
Displays a stoplight indicating the schedule status of the task.
Stoplight Colors:
■ Green. Task is on schedule
■ Yellow. Task is behind schedule by less than or equal to ten days
■ Red. Task is behind schedule by more than ten days
ETC
Displays the amount of ETC in hours for each day.

My Controls
32 PPM Essentials Accelerator Product Guide - On Demand
Resource Assignments Portlet
The Resource Assignments portlet displays the availability and assignments information for resources in a histogram format. The yellow and red bars in the histogram represent the assignments for a resource. The grey lines in between represent the availability threshold based on the daily available hours for the resource. The colors of the bars indicate the following:
■ Red. The assignment hours exceed the availability of the resource.
■ Yellow. The assignment hours are within the availability of the resource.
A mouseover on the histogram displays the exact hours assigned and the daily availability for a resource. The total at the bottom shows the total ETC for all resources for each day.
The portlet includes the following fields:
Resource
Displays the first and last name of the resource. Click a resource name to drill to the resource properties page and edit the resource information.
Availability/Assignments ETC
Displays the availability and assignments for the resource using a histogram format.
My Controls
Use the My Controls page to get a high-level view of tasks, change requests, issues, and risks associated with projects. This information allows you to evaluate and control the performance of your projects more effectively.
The page includes the following portlets:
■ Tasks
■ Change Requests
■ Issues
■ Risks
Note: For information to display on the My Controls portlets, select the "Include in Status Reporting?" check box for the following on their respective properties pages:
■ Task
■ Issue
■ Risk
■ Change Request
My Controls
Chapter 3: Viewing the Project Center Dashboard 33
Tasks Portlet
The Tasks portlet displays the total amount of effort required to complete selected tasks. Tasks flagged for status reporting from the task properties page appears in the portlet. The portlet provides the following details:
Project
Displays the name of the associated project. Click the project name link to open the project properties page and edit the project.
Task
Displays the name of the associated task. Click the task name link to open the task properties page and edit the task.
Status
Indicates the status of the task.
Values: Started, Not Started, and Completed
Due Date
Displays the date for completing the task.
Days Late
Displays the number of days the task is late.
Total Effort
Displays the total ETC plus actuals for the task.
Schedule
Displays Gantt bars for a six-month period starting with the current month.
Gantt Bar Color Indicators:
■ Green. The task is before due date.
■ Yellow. The task is less than or equal to ten days after due date.
■ Red. The task is more than ten days after due date.
Change Requests Portlet
The Change Requests portlet shows the status of selected change requests. Change requests, flagged for status reporting from the properties page, appear in the portlet. The portlet provides the following details:
Project
Displays the name of the associated project. Click the project name link to open the project properties page and edit the project.
My Controls
34 PPM Essentials Accelerator Product Guide - On Demand
Change Request Description
Displays the change request description. Click the description link to open the change request properties page and edit the change request.
Status
Displays the status for the change request.
Values: Open, Work in Progress, Closed, and Resolved
Effective Date
Displays the date when the change request becomes effective.
Priority
Displays a stoplight indicating the priority status of the change request.
Stoplights:
■ Green. Low priority
■ Yellow. Medium priority
■ Red. High priority
Impact Severity
Displays the severity of impact the change request on the project.
Values: Critical Schedule, Critical Cost, Critical Cost & Schedule, Moderate, Negligible
Category
Displays the change request category.
Closed Date
Displays the date of closing the change request.
Owner
Displays the name of the owner of the change request. Click the Send Mail icon next to an owner to send an email the owner.
Issues Portlet
The Issues portlet shows selected project issues. Issues flagged for status reporting from the issues properties page appear in the portlet. The portlet displays the following details:
Project
Displays the name of the associated project. Click the project name link to open the project properties page and edit the project.
My Controls
Chapter 3: Viewing the Project Center Dashboard 35
Issue Description
Displays the issue description. Click the description link to open the issue properties page and edit the issue.
Status
Displays the status of the issue.
Values: Open, Work in Progress, Closed, and Resolved
Target Resolution Date
Displays the target date for resolving the issue.
Schedule
Displays a stoplight indicating the schedule status of the issue resolution:
Stoplights:
■ Green. The resolution of the issue is on schedule.
■ Yellow. The resolution of the issue is late by less than or equal to two days.
■ Red. The resolution of the issue is late by more than two days.
Priority
Displays a stoplight indicating the priority status of the issue.
Stoplights:
■ Green. The issue is low priority.
■ Yellow. The issue is medium priority.
■ Red. The issue is high priority.
Category
Displays the issue category.
Owner
Displays the name of the owner of the issue. Click the Send Mail icon next to an owner to email the owner.
Risks Portlet
The Risks portlet shows the project risks flagged to be included in status reporting on the risk properties page. The portlet displays the following details:
Project
Displays the name of the associated project. Click the project name link to open the project properties page and edit the project.
My Controls
36 PPM Essentials Accelerator Product Guide - On Demand
Risk Description
Displays the risk description as defined on the risk. Click the description link to open the risk properties page and edit the risk.
Status
Displays the status for the risk.
Values: Open, Work in Progress, Closed, and Resolved
Target Resolution Date
Displays the target date for resolving the risk.
Above Threshold
Displays a yellow check mark to indicate that the risk threshold is greater than 1. The value is based on Risk Threshold on the risk settings page.
Probability
Displays a stoplight indicating the probability of the risk happening.
Stoplights:
■ Red. High probability
■ Yellow. Medium probability
■ Green. Low probability
Impact
Displays a stoplight indicating the impact of the risk on the project.
Stoplights:
■ Red. High impact
■ Yellow. Medium impact
■ Green. Low impact
Category
Displays the risk category.
Owner
Displays the name of the owner of the risk. Click the Send Mail icon next to an owner to send an email to the owner.

Deliverables
Chapter 3: Viewing the Project Center Dashboard 37
Deliverables
Use the Deliverables page to review project documentation, such as architectural designs, planning documents, scope of work, and quality assurance plans.
The Deliverables page includes the Project Deliverables Review portlet.
Note: For information to appear on the portlet, upload all documentation to the Document Manager folders in a project. Also, attach the documents to the relevant tasks using the Document/Deliverables field on the task properties page.
Project Deliverables Review Portlet
The Project Deliverables Review portlet provides the following for all project documents:
Document/Deliverable
Displays a link to the document or deliverable. Click the document link to open the document or save it to your local desktop. Click the Document Manager icon next to a document to go to the Project Document Manager page and view all the uploaded documents.
Status
Displays a stoplight indicating the approval status of the document.
Stoplights:
■ Green. The document is approved.
■ Yellow. The document is submitted for approval.
■ Red. The document is rejected.
Schedule
Displays a stoplight indicating the approval schedule of the document:
Stoplights:
■ Red. The document is late for approval.
■ Yellow. The document is not yet approved and due within 30 days.
■ Green. The document has been approved.
■ Blue. The document is not yet approved and due after 30 days.
Due Date
Displays the due date for the document: The date for completing the associated task.

Timesheet Review
38 PPM Essentials Accelerator Product Guide - On Demand
Owner
Displays the name of the owner of the document.
Project
Displays the name of the associated project. Click the project name link to open the project properties page and edit the project.
Task
Displays the name of the associated task. Click the task name link to open the task properties page and edit the task.
Timesheet Review
Use the Timesheet Review page to review your project team timesheets and any modified estimates that the team members enter.
The page includes the following portlets:
■ Timesheet Review
■ Pending Estimates
Timesheet Review Portlet
The Timesheet Review portlet lets you review open timesheets. You can also compare the estimated time of completion (ETC) for a task with the submitted actuals.
The portlet displays the following information about timesheets:
Notes Attached
Displays a yellow check mark to indicate that notes are attached to the timesheet.
Project
Displays the name of the associated project. Click the project name link to open the project properties page and edit the project.
Task
Displays the name of the associated task. Click the task name link to open the task properties page and edit the task.
Timesheet
Displays the timesheet (clock) icon. Click the icon next to a resource to open the Timesheet page for that resource.
Timesheet Review
Chapter 3: Viewing the Project Center Dashboard 39
Resource
Displays the associated resource name. Click the resource link to open the assignment properties page to edit the resource assignment information.
Resource Type
Displays the resource type (Employee, Contractor).
Timesheet Status
Displays the latest timesheet status (Open, Submitted, Approved, Returned, Posted, Adjusted).
Period Start
Displays the start date for a specific time reporting period.
Period End
Displays the end date for a specific time reporting period.
Pending Actuals
Displays the unposted actuals for a specific time reporting period.
Posted Actuals
Displays the posted actuals for a specific time reporting period.
Total Actuals
Displays the total actuals (pending and posted) for a specific time reporting period.
Pending Estimates Portlet
Depending on whether less or more time is required for a task, a team member can increase or reduce the ETC on a task. They can do this using Timesheets. However, the project manager approves the modifications before the change is reflected in CA Clarity PPM. The Pending Estimates portlet lets you view all the variables associated with a task. Based on the variables, you can accept or deny any modified ETCs.
This portlet displays the following details:
Stoplight
Displays a stoplight indicating how the ETC was modified.
Stoplights:
■ Green. The ETC for the task is decreased.
■ Red. The ETC for the task is increased.
Project
Displays the name of the associated project. Click the project name link to open the project properties page and edit the project.

Timesheet Review
40 PPM Essentials Accelerator Product Guide - On Demand
Task
Displays the name of the associated task. Click the task name link to open the task properties page and edit the task.
Resource
Displays the name of the associated resource. Click the resource link to open the assignment properties page for the resource.
Start
Displays the date of starting the associated task.
Finish
Displays the date of completing the associated task.
Pending ETC
Displays the amount of ETC added to the timesheet.
Plan ETC
Displays the amount of ETC initially assigned to the task.
Pending Actuals
Displays the amount of unposted actuals for the task.
Adjusted Plan ETC
Displays the adjusted planned ETC amount (Planned ETC - Pending Actuals).
Recommended Change in ETC
Displays the amount of ETC used based on the modified ETC entered in the timesheet.
Chapter 4: Viewing the Resource Center Dashboard 41
Chapter 4: Viewing the Resource Center Dashboard
This section contains the following topics:
About the Resource Center (see page 41) Resource Planning (see page 42) Role Supply and Demand (see page 44) Resource Allocation (see page 45) Unfilled Allocations (see page 46)
About the Resource Center
The Resource Center is a dashboard for resource managers and schedulers to get a high-level view into the resources they are managing. They can use the dashboard to help ensure that the resources assigned to project tasks are not over or under allocated.
The Resource Center dashboard includes the following pages:
■ Resource Planning (see page 42). Lets you assess and manage resource supply and demand.
■ Role Supply and Demand (see page 44). Lets you assess and manage role supply and demand.
■ Resource Allocation (see page 45). Lets you view how resources are allocated to their assignments.
■ Unfilled Allocations (see page 46). Lets you monitor the roles to fill.

Resource Planning
42 PPM Essentials Accelerator Product Guide - On Demand
How to Set up the Resource Center
To view resource information about the Resource Center dashboard, complete the following:
■ Resources and roles are created.
For more information about managing resources, see the Resource Management User Guide.
■ Requisitions are created and fulfilled.
For more information about managing resources, see the Resource Management User Guide.
■ Resources and roles are assigned to projects.
For more information, see the Project Management User Guide.
■ Resources are set up to enter vacation and sick time (see page 12).
Resource Planning
Use the Resource Planning page to assess the supply and demand situation for your project resources:
The page includes the following portlets:
■ All Resources
■ Resource Supply
■ Resource Demand
All Resources Portlet
Use this portlet to view resource gaps for the entire organization or for a specific OBS or role. Information appears for six months, starting with the current month.
For information to appear in the portlet, assign resources and roles to projects.
This portlet includes the following fields:
Description
Displays resource supply, demand, and availability hours.
Resource Planning
Chapter 4: Viewing the Resource Center Dashboard 43
Total
Displays the aggregated amount for the following:
■ Supply. The total of all available hours for resources. If there are no available hours, zero value appears for this row
■ Demand. The total of all ETCs for resources across projects and ideas.
■ Availability. The difference between supply and demand.
Resource Supply Portlet
The Resource Supply portlet displays six months of supply information for roles, starting with the current month.
Note: For information to appear in the portlet, assign roles to projects.
The portlet includes the following fields:
Role
Displays the role name. Click the role link to open the role properties page and edit the role.
Total
Displays the total available or unallocated hours for the role.
Hours/FTE
Displays the available hours or full-time employee (FTE) for the role for six months, starting with the current month.
Role Supply and Demand
44 PPM Essentials Accelerator Product Guide - On Demand
Resource Demand Portlet
The Resource Demand portlet shows six months of demand information, starting with the current month. Information is displayed hierarchically using the following levels:
■ Project type
■ Project
■ Role
All role information in this portlet is aggregated to the project level. All project information is aggregated to the project type level. The Total column displays the final aggregated amount across all hierarchy levels.
For information to appear in this portlet, roles must be assigned to projects.
The portlet includes the following fields:
Type/Project/Role
Displays the project type, project, or role name. If no project type is selected for a project, [No Project Type] appears. Expand a project type to display all the projects associated with that type. Expand a project name to display all the roles associated with that project. Click a project or role link to open the project or role properties page and edit the project or role.
Total
Displays the total demand or assignments across the project type, project, or role.
Hours/FTE
Displays the hours or FTE in demand for each level in the hierarchy (project type, project, or role) for six months, starting with the current month.
Role Supply and Demand
Use the Role Supply and Demand page to assess the supply and demand for your project roles. The page includes the Role Supply and Demand Histogram portlet.
Resource Allocation
Chapter 4: Viewing the Resource Center Dashboard 45
Role Supply and Demand Histogram Portlet
The Role Supply and Demand Histogram portlet shows the number of available people (FTE) per role and the demand for the project roles.
This portlet provides the following aggregates:
■ Total Demand. Displays the total aggregated demand for each month in FTE.
■ Total Supply. Displays the total aggregated supply for each month in FTE.
■ Remaining Capacity. Displays the difference between the total demand and the total supply for each month in FTE.
This portlet includes the following fields:
Role
Displays the role name. Click the role link to open the role properties page and edit the role information. Click the Resource Allocation icon next to a role to go to the capacity page of role investments and view or modify role allocation.
Demand/Supply
Displays six months of demand and supply information for each role, starting with the current month.
Resource Allocation
Use the resource allocation page to view allocation information for a specific role and its associated resources. The page includes the Weekly Detail of Resource Allocations portlet.
Weekly Detail of Resource Allocations Portlet
The Weekly Detail of Resource Allocations portlet provides a detailed, weekly view of allocated hours for specific resources. As a resource manager, use this information to work with individual resources and confirm that they are allocated appropriately.
For information to appear in the portlet, allocate resources to projects.
Unfilled Allocations
46 PPM Essentials Accelerator Product Guide - On Demand
This portlet includes the following fields:
Resource
Displays the full name of the resource. Click the resource link to open the resource properties page and view or edit the resource information.
Click the Resource Finder icon next to a resource name to open the find resources page and search for resources.
Click the Properties icon next to a resource name to open the staff member properties page and view the allocation curves for the resource.
Role
Displays the role name associated with the resource. Click the Send Mail icon next to a role name to send an email to the associated resource.
Project
Displays the project name that the resource is associated to. Click the project link to open the project properties page and edit the project.
Allocation
Displays the weekly allocation amount in hours for a resource. Click an allocation amount to open the resource/ role allocations page and view allocation details.
Unfilled Allocations
Use the Unfilled Allocations page to view the booking and request status for all unfilled project requirements. The page includes the Unfilled Requirements portlet.
Unfilled Requirements Portlet
The Unfilled Requirements portlet provides a view of all the unfilled requirements across projects. Use the portlet to rectify those unfilled requirements. You can drill down to view and modify resource allocations and allocation requests.
For information to appear in the portlet, allocate resources to projects and requirements.
Unfilled Allocations
Chapter 4: Viewing the Resource Center Dashboard 47
The portlet includes the following fields:
Requirement
■ Displays the name of the requirement.
■ Click a requirement name or the Properties icon to open the staff member properties page and view allocation information for the requirement.
■ Click the Resource Finder icon next to a requirement to open the find resources page and search for resources to fill the requirement.
Role
■ Displays the role name associated with the requirement.
■ Click a role link to open the role properties page and view or edit the role information.
■ Click the Resource Allocation icon next to a role to open the capacity page of role investments and view role allocation information.
■ Click the Send Mail icon next to a role to send an email to the associated resource.
Project
Displays the name of the associated project. Click the project name link to open the project properties page and edit the project.
Booking Status
Displays the booking status for the associated role based on the Booking Status field on the staff member properties page.
Request Status
Displays the request status for the associated role based on the Request Status field on the staff member properties page.
Start
Displays the date of starting the project.
Finish
Displays the finish date for the project.
Allocation
Displays the number of hours that the role is allocated to the project. Click an allocation link to open the resource/role allocations page and view or edit the role allocation information.
Allocation %
Displays the percentage of time that the role is allocated to the project.


Chapter 5: Viewing the Governance Center Dashboard 49
Chapter 5: Viewing the Governance Center Dashboard
This section contains the following topics:
About the Governance Center (see page 49) Project Review (see page 50) Project KPIs (see page 51) Status Reports (see page 53) Project Schedule (see page 55) Project Cost (see page 56)
About the Governance Center
The Governance Center is a dashboard for managers and executives to view data across all projects in an organization. This dashboard is also for project managers to view metrics across all their assigned projects.
The Governance Center dashboard includes the following pages:
■ Project Review (see page 50). Use this page to review late projects based on certain criteria.
■ Project KPIs (see page 51). Use this page to get a quick update on key performance indicators.
■ Status Reports (see page 53). Use this page to view a list of project status reports.
■ Project Schedule (see page 55). Use this page to view project schedule information.
■ Project Cost (see page 56). Use this page to view project cost and effort information.

Project Review
50 PPM Essentials Accelerator Product Guide - On Demand
How to Set up the Governance Center
To view project information about the Governance Center dashboard, complete the following:
■ Projects are created, baselined, and include project metrics such as risks, issues, and change requests.
For more information, see the Project Management User Guide.
■ Resources and roles are created and assigned to projects.
For more information about managing resources, see the Resource Management User Guide.
■ Project status reports are created (see page 24).
Project Review
Use the Project Review page to review the status of projects that are late and the number of days by which they are behind schedule. This page includes the Project Review portlet.
Project Review Portlet
The Project Review portlet displays approved and unapproved projects and their schedule status. This portlet allows executives to view how large their approved projects are and whether they are on schedule.
The portlet displays information in a bubble chart. The X-axis of the chart displays the project finish dates in months. The Y-axis of the chart displays the number of days by which the projects are late compared to their baseline finish dates.
Each bubble on the chart represents a project. Click a bubble to open the project properties page and view or edit the project.
For bubbles to appear on the chart, require tasks and resources assigned to the tasks.
The bubble color represents the project status as follows:
■ Green. The project is approved.
■ Red. The project is unapproved.

Project KPIs
Chapter 5: Viewing the Governance Center Dashboard 51
The bubble size represents the total ETC amount for the project. Mouseover a bubble to display the following information:
■ Project name
■ Project finish date
■ Number of days by which the project is late
■ The Total project ETC
Project KPIs
Use the Project KPIs page to view at a glance key performance indicators for all projects. The page includes the Project KPIs By OBS portlet.
Project KPIs By OBS Portlet
The Project KPIs By OBS portlet displays projects sorted by OBS and provides a quick update on key performance indicators (KPIs), such as schedule, status, effort, cost, risk, issues, and change requests.
The portlet displays information from both an OBS and a project perspective. The project information rolls up to each level in the OBS. The stoplights that display on the portlet represent the status, schedule, or effort for all your projects. For example, if only one red stoplight exists and five yellow stoplights at various hierarchy levels, then the top-most level displays a yellow stoplight.
The portlet includes the following fields:
OBS/Project Name
Displays the OBS or project name. Expand an OBS name to display all projects that belong to that OBS. Click a project link to open the project properties page and edit the project.
Status
Displays a stoplight indicating the overall status of the projects based on their schedule, scope, and cost and effort status. This information is derived from the most recent status reports of the projects.
Stoplight Colors:
■ Red. Significant Variation.
■ Yellow. Minor Variation
■ Green. On Track.
Project KPIs
52 PPM Essentials Accelerator Product Guide - On Demand
Schedule
Displays a stoplight indicating the projects are on or behind schedule. This metric is evaluated by comparing the scheduled finish date with the baseline date for all projects in the hierarchy. If no baseline exists for a project, the current date is used.
Stoplight Colors:
■ Red. The projects are behind schedule by more than one day past due date.
■ Yellow. The projects are behind schedule by less than two days before due date.
■ Green. The projects are on schedule by more than two days before due date.
Effort
Displays a stoplight indicating if the amount of work is over or underestimated, or on target for the projects. This metric is evaluated by comparing the total current ETC with the baseline ETC for all projects in the hierarchy.
Stoplight Colors:
■ Red. The current ETC is more than or equal to 10 percent over the baseline.
■ Yellow. The current ETC is from 1 through 10 percent over the baseline.
■ Green. The current ETC is from 0 through 10 percent under the baseline.
■ White. No baseline data exists.
Cost
Displays a stoplight based on the comparison of the total current cost with the baseline cost for all projects in the hierarchy.
Stoplight Colors:
■ Red. The current cost is more than or equal to 10 percent over baseline.
■ Yellow. The current cost is from 1 through 10 percent over baseline.
■ Green. The current cost is from 0 through -10 percent under baseline.
■ White. No baseline data exists.
Risk
Displays a stoplight based on the severity of the risk factor for all projects in the hierarchy.
Stoplight Colors:
■ Red. A high priority risk exists.
■ Yellow. A medium priority risk exists.
■ Green. No high or medium priority risks exist.

Status Reports
Chapter 5: Viewing the Governance Center Dashboard 53
Issues
Displays a stoplight based on the severity of the issues for all projects in the hierarchy.
Stoplight Colors:
■ Red. A high priority issue exists.
■ Yellow. A medium priority issue exists.
■ Green. No high or medium priority issues exist.
Change
Displays a yellow check mark if at least one change request exists for a project at that hierarchy level.
Status Reports
Use the Status Reports page to view the latest and any previous project status reports on a regular basis. Having a complete history of project status reports is useful for auditing and archiving purposes. The page includes the Project Status Reports Summary portlet.
Project Status Reports Summary Portlet
The Project Status Reports Summary portlet lists project status reports to open and get detailed project status updates.
To display information in this portlet, project status reports is required.
This portlet includes the following fields:
Project
Displays the name of the associated project. Click the project name link to open the project properties page and edit the project.
Manager
Displays the first and last name of the project manager. Click the manager link to open the resource properties page and edit the project manager details.
Status Reports
54 PPM Essentials Accelerator Product Guide - On Demand
Overall Status
Displays a stoplight indicating how the project is doing overall. This metric is based on the Overall Status stoplight in the status report.
Stoplight Colors:
■ Red. A significant variance in the overall status of the project exists.
■ Yellow. A minor variance in the overall status of the project exists.
■ Green. The overall status of the project is on track.
Status Report Update
Displays the name of the status report. Click the report link to open the status properties page and view the report in detail.
Report Date
Displays the date the status report was created.
Schedule
Displays a stoplight indicating if the project schedule is on track. This metric is based on the Schedule section in the status report.
Stoplight Colors:
■ Red. A significant variance in the project schedule exists.
■ Yellow. A minor variance in the project schedule exists.
■ Green. The project schedule is on track.
Scope
Displays a stoplight indicating if the project scope is on track. This metric is based on the Scope section in the status report.
Stoplight Colors:
■ Red. A significant variance in the project scope exists.
■ Yellow. A minor variance in the project scope exists.
■ Green. The project scope is on track.
Cost and Effort
Displays a stoplight indicating if the project cost and effort are on track. This metric is based on the Cost and Effort section in the status report.
Stoplight Colors:
■ Red. A significant variance in the cost and effort of the project exists.
■ Yellow. A minor variance in the cost and effort of the project exists
■ Green. The cost and effort of the project is on track.
Project Schedule
Chapter 5: Viewing the Governance Center Dashboard 55
Project Schedule
Use the project schedule page to view project schedule information at the following hierarchy levels:
■ Project
■ Work breakdown structure
■ Resource
The page includes the project schedule portlet.
Project Schedule Portlet
The Project Schedule portlet displays project schedule information in a Gantt chart format.
The portlet displays information for a particular level in the hierarchy (project, task, or resource). For example, when you are at the project level, the stoplight is based on the finish date of the project and not an aggregate of all the tasks underneath it.
The portlet includes the following fields:
Project/WBS/Resource
Displays the project name, task name, or resource name. Expand a project name to display associated task names. Expand a task name to display associated resources. Click a project, task, or resource link to open their properties pages and edit the project, task, or resource.
Dashboard
Provides a link to the Project Dashboard page.
Start Date
Displays the start date of the project.
Finish Date
Displays the finish date of the project.
Days Late
Displays a project schedule stoplight based on the project or task finish date.
Stoplight Colors:
■ Red. The project schedule is more than ten days behind the due date.
■ Yellow. The project schedule is less than two days ahead of the due date.
■ Green. The project schedule is more than two days ahead of the due date.

Project Cost
56 PPM Essentials Accelerator Product Guide - On Demand
Schedule
Displays the schedule status for six months starting with the current month.
Project Cost
Use the project cost page to view project cost and effort information at the following hierarchy levels:
■ Project
■ Task
■ Resource
This page includes the Project Cost and Effort portlet.
Project Cost and Effort Portlet
The Project Cost and Effort portlet shows the following information for projects:
■ Baseline against actual costs
■ Baseline against actual hours of effort
The portlet aggregates the cost and effort numbers and stoplights at the project level, and includes the following fields:
Project/WBS/Resource
Displays the project name. Expand a project name to display associated task names. Expand a task name to display associated resources. Click a project, task, or resource link to open their properties pages and edit the project, task or resource.
Cost
Displays a stoplight indicating the project planned cost for the project.
Stoplight Colors:
■ Red. Actual cost is over baseline cost by greater than or equal to ten percent.
■ Yellow. Actual cost is over baseline cost by less than ten percent.
■ Green. Actual cost is less than or equal to baseline cost.
Baseline Cost
Displays the total baseline cost for the project.
Actual Cost
Displays the total actual cost for the project.
Project Cost
Chapter 5: Viewing the Governance Center Dashboard 57
EAC
Displays the total estimate at completion (EAC) value for the project.
Cost Variance
Displays the variance between the Baseline Cost and the Actual Cost for the project.
Effort
Displays a stoplight indicating the project ETC status.
Stoplight Colors:
■ Red. Actual ETC is over baseline ETC by greater than or equal to ten percent.
■ Yellow. Actual ETC is over baseline ETC by less than ten percent.
■ Green. Actual ETC is less than or equal to baseline ETC.
Baseline Hours
Displays the total baseline hours for the project.
Actual Hours
Displays the total actual hours for the project.
Total Effort
Displays the total ETC for the project.
Hours Variance
Displays the variance between the Baseline Hours and the Actual Hours for the project.

Chapter 6: Viewing the PPM Essentials Project Dashboard 59
Chapter 6: Viewing the PPM Essentials Project Dashboard
This section contains the following topics:
About the PPM Essentials Project Dashboard (see page 59)
About the PPM Essentials Project Dashboard
The PPM Essentials Project Dashboard provides a quick glance at project metrics, schedule status, and task status for a single project.
To view this dashboard, select the Dashboard page from a project.
The dashboard includes the following portlets:
■ Quick Metrics
■ Upcoming Milestones
■ Recent Project Activity
■ Status Reports
Quick Metrics Portlet
The Quick Metrics portlet keeps a project manager informed on a project risks, issues, or other issues. The portlet displays project metrics using stoplights. The following stoplights are included:
Status
Displays a stoplight based on the Overall Status stoplight value that displays on the most recent status report.
Stoplight Colors:
■ Red. Significant Variance
■ Yellow. Minor Variance
■ Green. On Track
About the PPM Essentials Project Dashboard
60 PPM Essentials Accelerator Product Guide - On Demand
Schedule
Displays a stoplight indicating the project is on or behind schedule. This metric is evaluated by comparing the scheduled finish date with the baseline finish date. If the project is not baselined, the current date is used.
Stoplight Colors:
■ Red. The project is more than one day past the baseline finish date
■ Yellow. The project is less than two days away from the baseline finish date.
■ Green. The project is more than two days away from the baseline finish date.
Effort
Displays a stoplight indicating if the project is over or under the baselined ETC. This metric is evaluated by comparing total current ETC with baselined ETC.
Stoplight Colors:
■ Red. The project is over the baseline by ten percent.
■ Yellow. The project is from 1 percent through ten percent over baseline.
■ Green. The project is from zero percent through ten percent under baseline.
■ Blue. The project is more than negative 10 percent under baseline.
■ White. The project is not baselined.
Cost
Displays a stoplight indicating if the project is over or under the baseline cost. This metric is evaluated by comparing total current cost with the baseline cost.
Stoplight Colors:
■ Red. The project is equal to or more than ten percent over baseline.
■ Yellow. The project is from one through ten percent over baseline.
■ Green. The project is from zero through ten percent under baseline.
■ Blue. The project is equal to or more than negative ten percent under baseline.
■ White. The project is not baselined.
Risk
Displays a stoplight indicating the severity of the risks associated with the project.
Stoplight Colors:
■ Red. High priority risks.
■ Yellow. Medium priority risks.
■ Green. No high or medium priority risks exist.
About the PPM Essentials Project Dashboard
Chapter 6: Viewing the PPM Essentials Project Dashboard 61
Issues
Displays a stoplight indicating the severity of the issues associated with the project.
Stoplight Colors:
■ Red. The issues are high priority.
■ Yellow. The issues are medium priority.
■ Green. No high or medium priority issues exist.
Change
Displays a yellow check mark to indicate that at least one change request exists for the project.
Upcoming Milestones Portlet
The Upcoming Milestones portlet lists all the milestones for a project. This portlet includes the following fields:
Milestone Name
Displays the milestone name. Click the milestone link to open the task properties page and view or edit the task.
Due Date
Displays the date of completing the milestone.
Gantt
Displays the schedule status for each milestone for a six-month period, starting with the current month. A green diamond represents a milestone.
Recent Project Activity Portlet
The Recent Project Activity portlet lists specific project activities and the number of changes that have occurred with each activity. Use this information to determine areas of the project currently being worked on and get more specific information as needed.
Information appears on this portlet for the following hierarchy levels:
■ An activity group. Includes the following groups of activities:
■ Late Tasks. The number of tasks that are one or more days past the baseline due date. If no baseline information exists, the task finish date is used.
■ Completed tasks. The number of tasks marked as complete.
■ Unstaffed Tasks. The number of tasks to which resources are not yet assigned.
■ Document Changes. The number of documents uploaded either for the first-time or as an updated version.
About the PPM Essentials Project Dashboard
62 PPM Essentials Accelerator Product Guide - On Demand
■ Risks. The number of unresolved risks.
■ Issues. The number of unresolved issues.
■ Change Requests. The number of unresolved change requests.
■ A specific instance of an activity. For example, a specific task is late.
This portlet includes the following fields:
Description
Displays an activity group name. Expand an activity group name to view the activity instances under it. Click an activity instance link to open the properties page for that activity.
Quantity
Provides the count of instances for a specific activity group. For example, the number of late tasks.
Status Reports Portlet
The Status Reports portlet lists all the status reports for a project. You can also drill down to the properties page for a specific report for more detailed status information.
This portlet includes the following fields:
Overall Status
Displays a stoplight representing the overall status on the status report.
Stoplight Colors:
■ Red. There is a significant variance in the overall project status.
■ Yellow. There is a minor variance in the overall project status.
■ Green. The overall project status is on track.
Status Report Update
Displays the name of the status report. Click the name link to open the status report properties page and view more details.
Report Date
Displays the date of creating the status report.
Chapter 6: Viewing the PPM Essentials Project Dashboard 63
Appendix A: Access Rights
This section contains the following topics:
Access Rights (see page 63) Group Access Rights (see page 63)
Access Rights
The following access rights are included with the PPM Essentials Accelerator:
Status Report - Create
Allows you to create status reports. This includes the page navigation access right.
Type: Global
Status Report - Edit
Allows the user to edit specific status reports.
Type: Instance
Status Report - Edit All
Allows you to edit all status reports. This includes the page navigation access right.
Type: Global
Status Report - View
Allows the user to view specific status reports.
Type: Instance
Status Report - View All
Allows the user to view all status reports. This includes the page navigation access right.
Type: Global
Status Report - XOG Access
Allows the user to import and export status reports using the XML Open Gateway (XOG) interface.
Type: Global
Group Access Rights
The PPM Essentials Accelerator access groups are associated with a set of access rights.
Group Access Rights
64 PPM Essentials Accelerator Product Guide - On Demand
PPM Essentials Demand Manager Group Access Rights
The following access rights are included with the PPM Essentials Demand Manager access group:
Idea - Approve - All
Lets you approve all ideas.
Type: Global
Idea - Edit - All
Lets you edit all ideas. The access right includes the Idea - View access and the ability to delete all ideas.
Type: Global
Idea - Edit Access Rights - All
Lets you edit the access rights for all ideas. The right does not include the Ideas - Navigate or Idea - View access.
Type: Global
Idea - Hierarchy - Parents - Add - All
Lets you add investments to the Parent Hierarchy for any idea.
Type: Global
Idea - Hierarchy - Parents - Edit - All
Lets you edit investments in the Parent Hierarchy for any idea.
Type: Global
Idea - Hierarchy - Parents - View - All
Lets you view investments in the Parent Hierarchy for any idea.
Type: Global
Idea - View - All
Lets you view all ideas. The right includes the Ideas - Navigate access.
Type: Global
Ideas - Create
Allows you to create instances of the idea object. The right includes the Ideas - Navigate access.
Type: Global
Group Access Rights
Chapter 6: Viewing the PPM Essentials Project Dashboard 65
Portlet Viewer - All
Lets you view and add stock portlets to portlet pages. The right helps add a stock portlet to a personal dashboard.
Type: Global
Timesheets - Navigate
Allows you to navigate to timesheet pages.
Type: Global
Page - View
Allows users to view a general page in CA Clarity PPM. For instance pages (such as portfolio pages), this right is not required.
Type: Instance
PPM Essentials Executive Group Access Rights
The following access rights are included with the PPM Essentials Executive access group:
Idea - Approve - All
Lets you approve all ideas.
Type: Global
Idea - Edit - All
Lets you edit all ideas. The access right includes the Idea - View access and the ability to delete all ideas.
Type: Global
Idea - Hierarchy - Parents - Edit - All
Lets you edit investments in the Parent Hierarchy for any idea.
Type: Global
Idea - Hierarchy - Parents - View - All
Lets you view investments in the Parent Hierarchy for any idea.
Type: Global
Idea - View - All
Lets you view all ideas. The right includes the Ideas - Navigate access.
Type: Global

Group Access Rights
66 PPM Essentials Accelerator Product Guide - On Demand
Ideas - Create
Allows you to create instances of the idea object. The right includes the Ideas - Navigate access.
Type: Global
Portlet Viewer - All
Lets you view and add stock portlets to portlet pages. The right helps add a stock portlet to a personal dashboard.
Type: Global
Resource - View - All
Allows users to view information, except the financial properties of all resources.
Type: Global
Resource - View Book - All
Allows users to view bookings for all resources.
Type: Global
Resource - View Financial - All
Allows users to view financial properties for all resources.
Required: Resource - Navigate right
Type: Global
Page - View
Allows users to view a general page in CA Clarity PPM. For instance pages (such as portfolio pages), this right is not required.
Type: Instance
Project - Risk, Issue, Change Request - View
Allows users to view all risks, issues, and change requests for a specific project.
Type: Global
Project - View
Allows users to view the general, management, financial properties, custom defined fields, roster, tasks, processes, and subprojects for a specific project.
Type: Instance
Project - View Management
Allows users to view management properties, roster, and key tasks of a specific project. This right also allows users view the project in a project scheduler, such as Microsoft Project.
Type: Instance

Group Access Rights
Chapter 6: Viewing the PPM Essentials Project Dashboard 67
PPM Essentials Idea Requestor Group Access Rights
The following access rights are included with the Idea Requestor access group:
Ideas - Create
Allows you to create instances of the idea object. The right includes the Ideas - Navigate access.
Type: Global
Portlet Viewer - All
Lets you view and add stock portlets to portlet pages. The right helps add a stock portlet to a personal dashboard.
Type: Global
Timesheets - Navigate
Allows you to navigate to timesheet pages.
Type: Global
Page - View
Allows you to view a general page in CA Clarity PPM. This access is not required for instance pages, such as portfolio pages.
Type: Instance
Project - Risk, Issue, Change Request - View - All
Lets you view all risks, issues, and change requests for a specific project.
Type: Global
Project - View
Allows users to view the general, management, financial properties, custom defined fields, roster, tasks, processes, and subprojects for a specific project.
Type: Instance
Project - View Management
Allows users to view management properties, roster, and key tasks of a specific project. This right also allows users view the project in a project scheduler, such as Microsoft Project.
Type: Instance
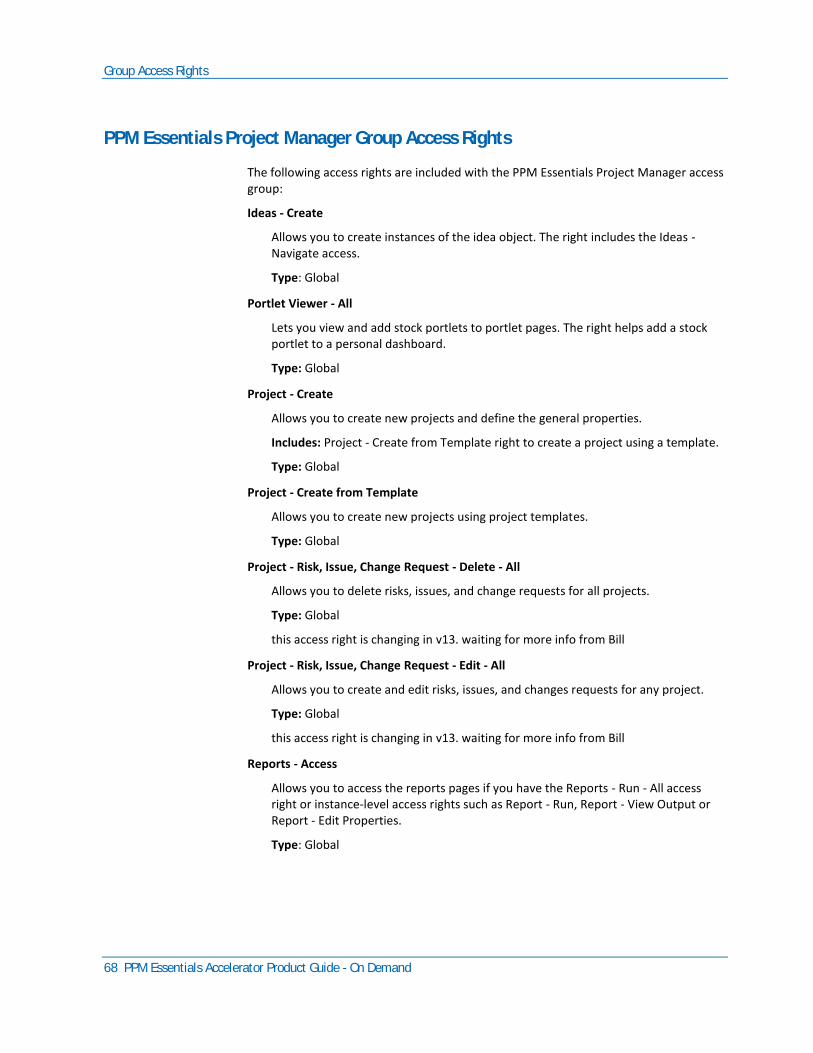
Group Access Rights
68 PPM Essentials Accelerator Product Guide - On Demand
PPM Essentials Project Manager Group Access Rights
The following access rights are included with the PPM Essentials Project Manager access group:
Ideas - Create
Allows you to create instances of the idea object. The right includes the Ideas - Navigate access.
Type: Global
Portlet Viewer - All
Lets you view and add stock portlets to portlet pages. The right helps add a stock portlet to a personal dashboard.
Type: Global
Project - Create
Allows you to create new projects and define the general properties.
Includes: Project - Create from Template right to create a project using a template.
Type: Global
Project - Create from Template
Allows you to create new projects using project templates.
Type: Global
Project - Risk, Issue, Change Request - Delete - All
Allows you to delete risks, issues, and change requests for all projects.
Type: Global
this access right is changing in v13. waiting for more info from Bill
Project - Risk, Issue, Change Request - Edit - All
Allows you to create and edit risks, issues, and changes requests for any project.
Type: Global
this access right is changing in v13. waiting for more info from Bill
Reports - Access
Allows you to access the reports pages if you have the Reports - Run - All access right or instance-level access rights such as Report - Run, Report - View Output or Report - Edit Properties.
Type: Global
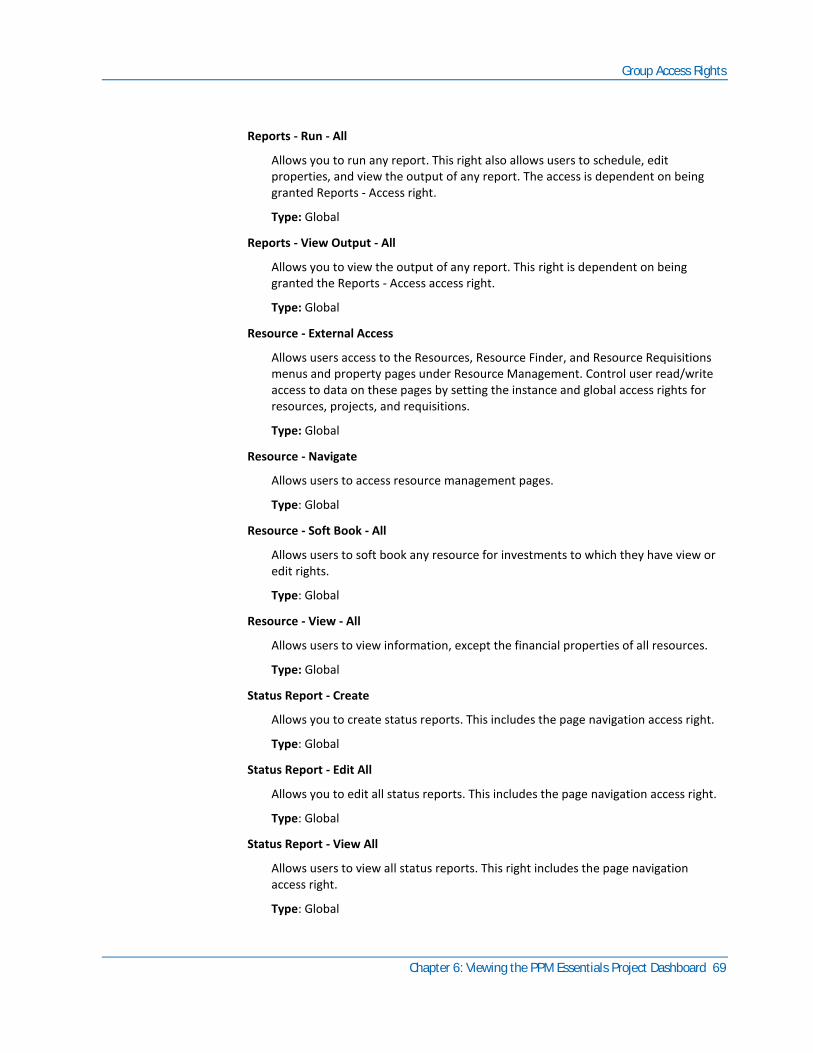
Group Access Rights
Chapter 6: Viewing the PPM Essentials Project Dashboard 69
Reports - Run - All
Allows you to run any report. This right also allows users to schedule, edit properties, and view the output of any report. The access is dependent on being granted Reports - Access right.
Type: Global
Reports - View Output - All
Allows you to view the output of any report. This right is dependent on being granted the Reports - Access access right.
Type: Global
Resource - External Access
Allows users access to the Resources, Resource Finder, and Resource Requisitions menus and property pages under Resource Management. Control user read/write access to data on these pages by setting the instance and global access rights for resources, projects, and requisitions.
Type: Global
Resource - Navigate
Allows users to access resource management pages.
Type: Global
Resource - Soft Book - All
Allows users to soft book any resource for investments to which they have view or edit rights.
Type: Global
Resource - View - All
Allows users to view information, except the financial properties of all resources.
Type: Global
Status Report - Create
Allows you to create status reports. This includes the page navigation access right.
Type: Global
Status Report - Edit All
Allows you to edit all status reports. This includes the page navigation access right.
Type: Global
Status Report - View All
Allows users to view all status reports. This right includes the page navigation access right.
Type: Global
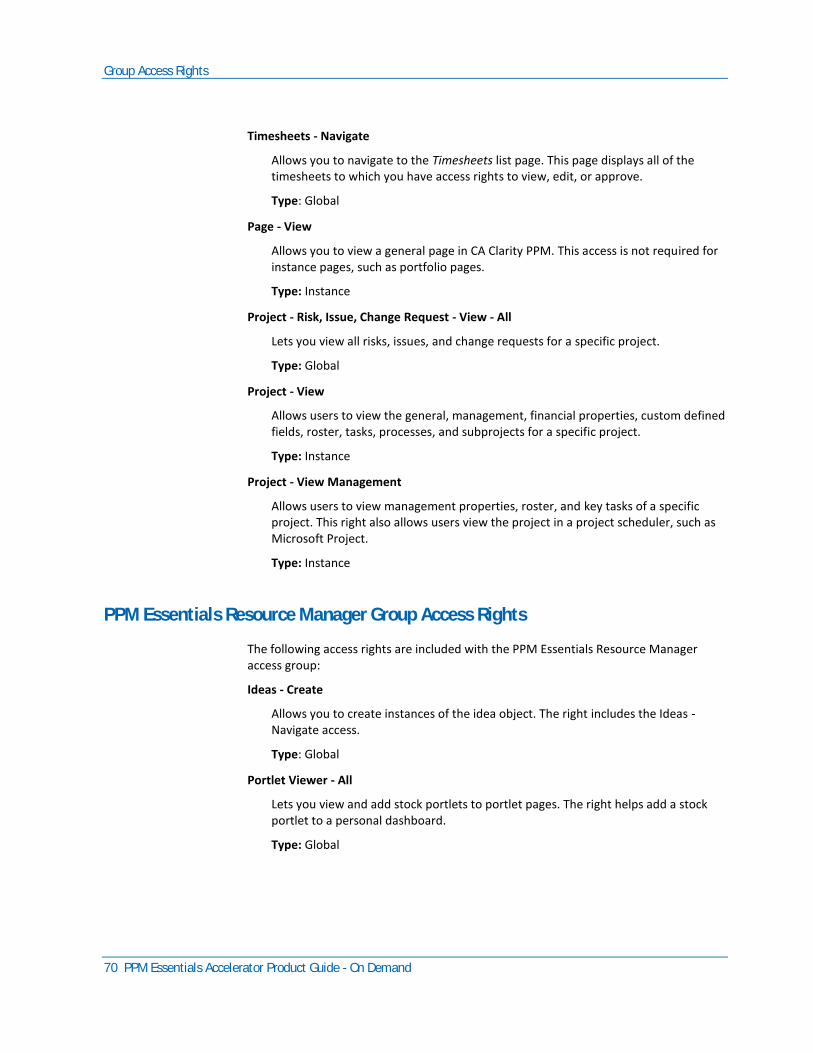
Group Access Rights
70 PPM Essentials Accelerator Product Guide - On Demand
Timesheets - Navigate
Allows you to navigate to the Timesheets list page. This page displays all of the timesheets to which you have access rights to view, edit, or approve.
Type: Global
Page - View
Allows you to view a general page in CA Clarity PPM. This access is not required for instance pages, such as portfolio pages.
Type: Instance
Project - Risk, Issue, Change Request - View - All
Lets you view all risks, issues, and change requests for a specific project.
Type: Global
Project - View
Allows users to view the general, management, financial properties, custom defined fields, roster, tasks, processes, and subprojects for a specific project.
Type: Instance
Project - View Management
Allows users to view management properties, roster, and key tasks of a specific project. This right also allows users view the project in a project scheduler, such as Microsoft Project.
Type: Instance
PPM Essentials Resource Manager Group Access Rights
The following access rights are included with the PPM Essentials Resource Manager access group:
Ideas - Create
Allows you to create instances of the idea object. The right includes the Ideas - Navigate access.
Type: Global
Portlet Viewer - All
Lets you view and add stock portlets to portlet pages. The right helps add a stock portlet to a personal dashboard.
Type: Global

Group Access Rights
Chapter 6: Viewing the PPM Essentials Project Dashboard 71
Timesheets - Navigate
Allows you to navigate to the Timesheets list page. This page displays all of the timesheets to which you have access rights to view, edit, or approve.
Type: Global
Page - View
Allows users to view a general page in CA Clarity PPM. For instance pages (such as portfolio pages), this right is not required.
Type: Instance
Project - Attach Requisitions Resources
Lets you attach resources to requisition entries and includes adding, editing, proposing, or deleting resources from the request results page. The privilege lets users to change project statuses to "Proposed" and "Booked". This right includes the Project – View Requisitions access.
Type: Instance
Project - View
Lets you view the general, management, financial properties, custom defined fields, roster, tasks, processes, and subprojects for a specific project.
Type: Instance
Project - View Management
Allows users to view management properties, roster, and key tasks of a specific project. This right also allows users view the project in a project scheduler, such as Microsoft Project.
Type: Instance
Resource - Hard Book
Allows users to soft and hard book a specific resource for investments to which they have view or edit rights.
Type: Global
Resource - Soft Book
Allows users to soft book a specific resource or role to an investment.
Type: Instance
Resource - View
Allows users to view all of information for a specific resource, except for financial information.
Type: Instance
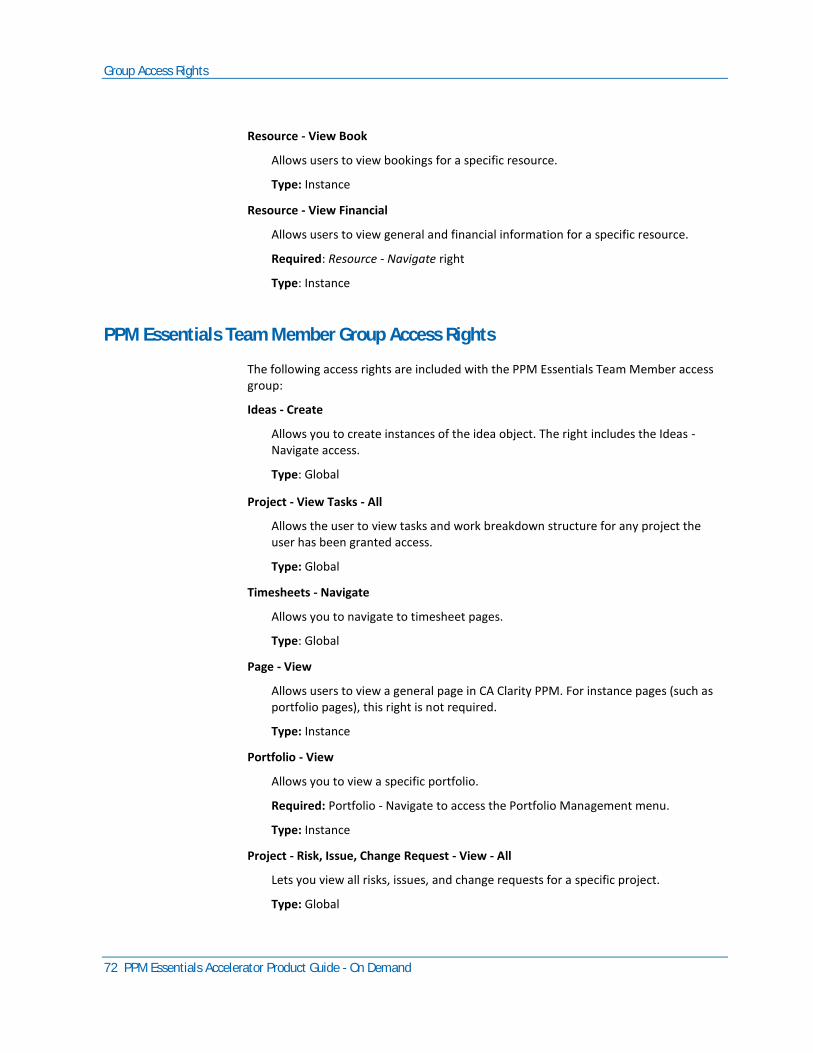
Group Access Rights
72 PPM Essentials Accelerator Product Guide - On Demand
Resource - View Book
Allows users to view bookings for a specific resource.
Type: Instance
Resource - View Financial
Allows users to view general and financial information for a specific resource.
Required: Resource - Navigate right
Type: Instance
PPM Essentials Team Member Group Access Rights
The following access rights are included with the PPM Essentials Team Member access group:
Ideas - Create
Allows you to create instances of the idea object. The right includes the Ideas - Navigate access.
Type: Global
Project - View Tasks - All
Allows the user to view tasks and work breakdown structure for any project the user has been granted access.
Type: Global
Timesheets - Navigate
Allows you to navigate to timesheet pages.
Type: Global
Page - View
Allows users to view a general page in CA Clarity PPM. For instance pages (such as portfolio pages), this right is not required.
Type: Instance
Portfolio - View
Allows you to view a specific portfolio.
Required: Portfolio - Navigate to access the Portfolio Management menu.
Type: Instance
Project - Risk, Issue, Change Request - View - All
Lets you view all risks, issues, and change requests for a specific project.
Type: Global
Group Access Rights
Chapter 6: Viewing the PPM Essentials Project Dashboard 73
Project - View
Lets you view the general, management, financial properties, custom defined fields, roster, tasks, processes, and subprojects for a specific project.
Type: Instance
Project - View Management
Allows users to view management properties, roster, and key tasks of a specific project. This right also allows users view the project in a project scheduler, such as Microsoft Project.
Type: Instance


