CMT III. 2015 Practice Exam VIII.
Alexey De La Loma ©FINANCER TRAINING Pag. 246/278 CFA, CMT, CAIA, FRM, EFA, CFTe
PPRRAACCTTIICCEE EEXXAAMM VVIIIIII..
Question Topic Point Range
Question 1 MTA Code of Ethics 12 points
Question 2 Behavioral Finance 20 – 40 points
Question 3 Intermarket Analysis 20 – 40 points
Question 4 Strategy and Techniques 20 – 40 points
Question 5 Candlestick Analysis 20 – 40 points
Question 6 Elliott Wave 20 – 40 points
Question 7 Point and Figure 20 – 40 points
Question 8 Risk Management 20 – 40 points
Question 9 System Development 20 – 40 points
240 points
Questions 8 and 9 (Risk Management and System Development) refer to CMT level II reading assignments.
CMT III. 2015 Practice Exam VIII.
Alexey De La Loma ©FINANCER TRAINING Pag. 247/278 CFA, CMT, CAIA, FRM, EFA, CFTe
Question 1. MTA Code of Ethics. 12 points.
1A. During a recent interview, Stuart Diamond, CMT, was asked to give his opinion on the stock market, his
recent market commentary and several stock picks. The following sentence comes from this interview.
”Recently we started a marketing campaign to increase our client base. As we have not increased the
number of employees, we have received some complaints from current clients. This will be temporary and
the quality of our service will be reestablished as soon as possible.”
Based on this information, which of the following statements is most accurate? (2 points).
A. Stuart has not violated any of the Ethics Standards.
B. Stuart has violated Ethics Standard 1 by behaving unprofessionally.
C. Stuart has violated Ethics Standard 2 by making misleading statements.
D. Stuart has violated Ethics Standards 7 because they have received complaints from current clients.
1B. During a recent interview, Stuart Diamond, CMT, was asked to give his opinion on the stock market, his
recent market commentary and several stock picks. The following sentence comes from this interview. “As
we have also less time to develop our technical weekly report, we have subscribed to some third-party
research, and we are repackaging this research with our logo to fill the recommendations in our weekly
report.”
Based on this information, which of the following statements is most accurate? (2 points).
A. Stuart has not violated any of the Ethics Standards.
B. Stuart has violated Ethics Standard 1 by behaving unprofessionally.
C. Stuart has violated Ethics Standard 2 by making misleading statements.
D. Stuart has violated Ethics Standards 8 by repackaging the research with the company logo as if the
research was proprietary.
1C. During a recent interview, Stuart Diamond, CMT, was asked to give his opinion on the stock market, his
recent market commentary and several stock picks. The following sentence comes from this interview:
“Because we base all our research in technical analysis, we have little problems with basing our
recommendations on material non-public information. However, we hired an expert on this area to study
the financial regulations of all countries in which we are promoting our services.”
Based on this information, which of the following statements is most accurate? (2 points).
A. Stuart has not violated any of the Ethics Standards.
B. Stuart has violated Ethics Standard 1 by behaving unprofessionally.
C. Stuart has violated Ethics Standard 2 by making misleading statements.
D. Stuart has violated Ethics Standards 5 regarding insider trading.
1D. During a recent interview, Stuart Diamond, CMT, was asked to give his opinion on the stock market, his
recent market commentary and several stock picks. The following sentence comes from this interview: “We
recently introduced a financial education plan for our analysts. Nowadays, technical analysts think that just
after reading two books they can beat the market. Yesterday I was invited to a conference by technical
analyst John Triangle, and it was completely useless, the whole conference was garbage.”
Based on this information, which of the following statements is most accurate? (2 points).
A. Stuart has not violated any of the Ethics Standards.
B. Stuart has violated Ethics Standard 1 by discrediting the analytical work of others.
C. Stuart has violated Ethics Standard 2 by making misleading statements.
D. Stuart has violated Ethics Standards 5 regarding insider trading.
CMT III. 2015 Practice Exam VIII.
Alexey De La Loma ©FINANCER TRAINING Pag. 248/278 CFA, CMT, CAIA, FRM, EFA, CFTe
1E. During a recent interview, Stuart Diamond, CMT, was asked to give his opinion on the stock market, his
recent market commentary and several stock picks. The following sentence comes from this interview:
“However, after this technical analyst, a trading system developer exposed a simple strategy that looked
quite interesting, I programmed it when I came back to the office and the backtesting was quite brilliant, I
changed the parameters of the model and fully documented the whole procedure and rationale. This is now
one of our star strategies.”
Based on this information, which of the following statements is most accurate? (2 points).
A. Stuart has not violated any of the Ethics Standards.
B. Stuart has violated Ethics Standard 1 by discrediting the analytical work of others.
C. Stuart has violated Ethics Standard 8 by copying the strategy and included as a proprietary strategy.
D. Stuart has violated Ethics Standards 5 regarding insider trading.
1F. Johnathan Dos Santos, CMT, works as an analyst for a big management and advisory company. Dos Santos
issued a research report with an initial buy recommendation on Panton Colors. The report includes an
analysis using some very new and controversial methods of technical analysis, along with complete
documentation as to the procedure and rationale. Ten minutes after emailing the report to all his clients,
Johnathan starts to buy Panton Colors stock for his premium clients.
Based on this information, which of the following statements is most accurate? (2 points).
A. Dos Santos committed no violation.
B. Dos Santos violated Ethics Standard 7 regarding the trading conducted in his premium client’s accounts.
C. Dos Santos violated Ethics Standard 3 regarding the technical methodologies employed.
D. Dos Santos violated Ethics Standards 3 and 7.
CMT III. 2015 Practice Exam VIII.
Alexey De La Loma ©FINANCER TRAINING Pag. 249/278 CFA, CMT, CAIA, FRM, EFA, CFTe
Question 2. Behavioral Finance. 20 - 40 points.
2A. Psychologists have spent many years documenting the fact that group decisions are among the worst
decisions ever made, effectively endorsing the view that committees are groups of people who keep
minutes but waste hours. The key reason for this appears to that when we come together as a group we not
only have to deal with our own biases, but also with everyone else’s biases. As with all biases the solutions
are never easy to implement. However, three possible routes to reducing group biases can be applied.
Determine and explain these routes.
2B. Determine whether Behavioral Finance in general and James Montier in particular, consider CAPM as a
valid financial model for practitioners. Explain your answer.
2C. Despite the wide range of assets that have witnessed bouts of irrational exuberance (tulips, coins, bonds,
cotton, wheat, land, equities, etc), bubbles seem to follow a similar pattern. Name the five phases of an
asset price bubble following the Kindleberger/Minsky model, and explain the phase in which the boom is
further exacerbated by monetary expansion and/or credit creation.
2D. Not all bubbles are the same. James Montier states four major types. Name them and explain the one
characterized by the following reasoning: “new era seems invincible and is supported by rapid expansion of
the economy and a seemingly inexorable rise in stock prices. This process leads to feelings of
over-optimism and overconfidence."
CMT III. 2015 Practice Exam VIII.
Alexey De La Loma ©FINANCER TRAINING Pag. 250/278 CFA, CMT, CAIA, FRM, EFA, CFTe
Question 3. Intermarket Analysis. 20 - 40 points.
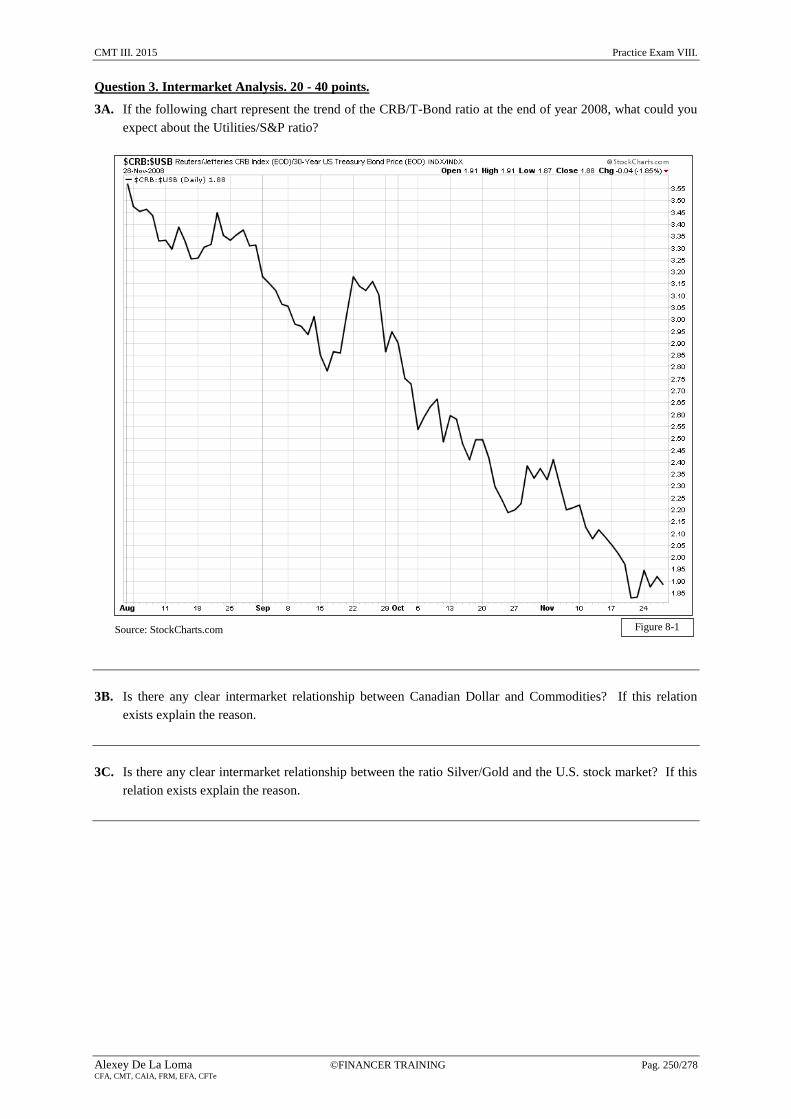
3A. If the following chart represent the trend of the CRB/T-Bond ratio at the end of year 2008, what could you
expect about the Utilities/S&P ratio?
3B. Is there any clear intermarket relationship between Canadian Dollar and Commodities? If this relation
exists explain the reason.
3C. Is there any clear intermarket relationship between the ratio Silver/Gold and the U.S. stock market? If this
relation exists explain the reason.
Source: StockCharts.com Figure 8-1
CMT III. 2015 Practice Exam VIII.
Alexey De La Loma ©FINANCER TRAINING Pag. 251/278 CFA, CMT, CAIA, FRM, EFA, CFTe
Question 4. Strategy and Techniques. 20 - 40 points.
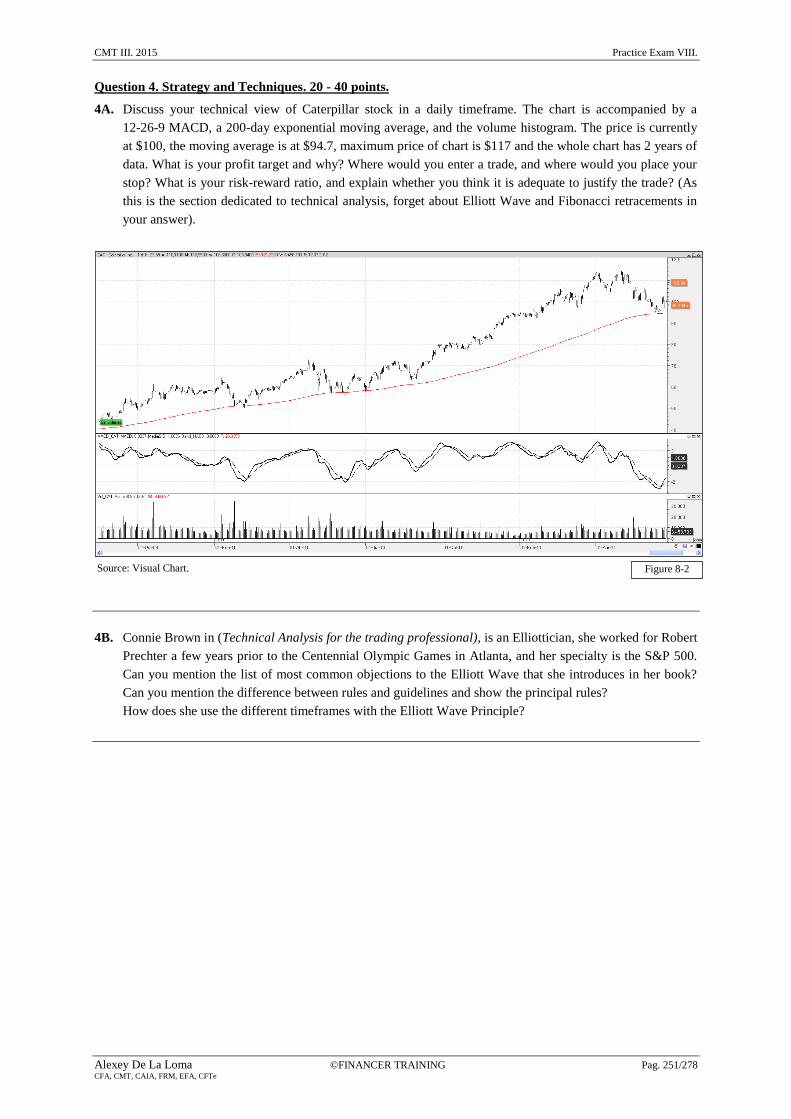
4A. Discuss your technical view of Caterpillar stock in a daily timeframe. The chart is accompanied by a
12-26-9 MACD, a 200-day exponential moving average, and the volume histogram. The price is currently
at $100, the moving average is at $94.7, maximum price of chart is $117 and the whole chart has 2 years of
data. What is your profit target and why? Where would you enter a trade, and where would you place your
stop? What is your risk-reward ratio, and explain whether you think it is adequate to justify the trade? (As
this is the section dedicated to technical analysis, forget about Elliott Wave and Fibonacci retracements in
your answer).
4B. Connie Brown in (Technical Analysis for the trading professional), is an Elliottician, she worked for Robert
Prechter a few years prior to the Centennial Olympic Games in Atlanta, and her specialty is the S&P 500.
Can you mention the list of most common objections to the Elliott Wave that she introduces in her book?
Can you mention the difference between rules and guidelines and show the principal rules?
How does she use the different timeframes with the Elliott Wave Principle?
Figure 8-2 Source: Visual Chart.
CMT III. 2015 Practice Exam VIII.
Alexey De La Loma ©FINANCER TRAINING Pag. 252/278 CFA, CMT, CAIA, FRM, EFA, CFTe
Question 5. Candlestick. 20 - 40 points.
5A. Identify and explain the significance of the following candlestick pattern within the oval.
5B. Identify and explain the significance of the following candlestick pattern within the oval.
Figure 8-3
Figure 8-4 Source: Visual Chart.
Source: Visual Chart.
CMT III. 2015 Practice Exam VIII.
Alexey De La Loma ©FINANCER TRAINING Pag. 253/278 CFA, CMT, CAIA, FRM, EFA, CFTe
5C. Identify and explain the significance of the following candlestick pattern within the oval.
5D. Identify and explain the significance of the following candlestick pattern within the oval.
Figure 8-5
Figure 8-6
Source: Visual Chart.
Source: Visual Chart.
CMT III. 2015 Practice Exam VIII.
Alexey De La Loma ©FINANCER TRAINING Pag. 254/278 CFA, CMT, CAIA, FRM, EFA, CFTe
5E. Identify and explain the significance of the following candlestick pattern within the oval.
5F. Identify the four candlestick patterns; explain their significance and classify them from the more relevant to
the less relevant.
Figure 8-7
Figure 8-8 Figure 8-9 Figure 8-10 Figure 8-11
Source: Visual Chart.
Source: Visual Chart.
Source: Visual Chart. Source: Visual Chart. Source: Visual Chart.
CMT III. 2015 Practice Exam VIII.
Alexey De La Loma ©FINANCER TRAINING Pag. 255/278 CFA, CMT, CAIA, FRM, EFA, CFTe
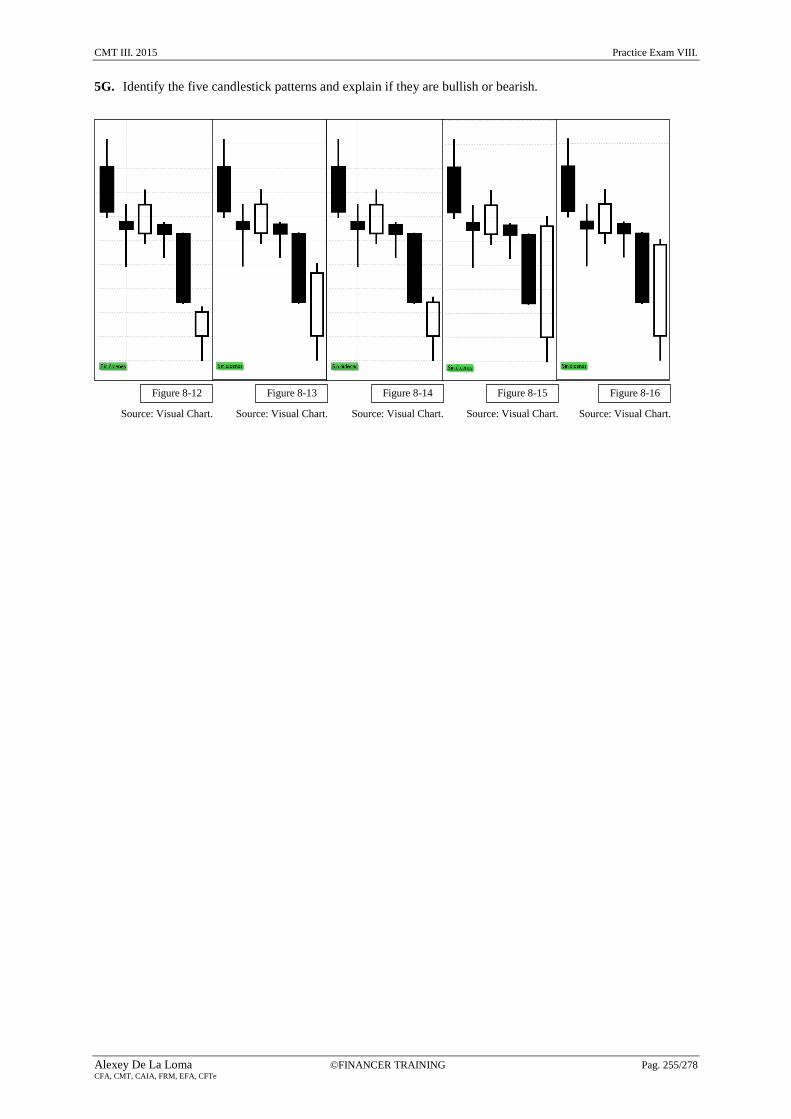
5G. Identify the five candlestick patterns and explain if they are bullish or bearish.
Figure 8-16 Figure 8-12 Figure 8-13 Figure 8-14 Figure 8-15
Source: Visual Chart. Source: Visual Chart. Source: Visual Chart. Source: Visual Chart. Source: Visual Chart.
CMT III. 2015 Practice Exam VIII.
Alexey De La Loma ©FINANCER TRAINING Pag. 256/278 CFA, CMT, CAIA, FRM, EFA, CFTe
Question 6. Elliott Wave. 20 - 40 points.
6A. Define the golden ratio or golden mean and its relation with the Elliott Wave Principle. Does the wave
principle work better for individual stocks or for stock market indices?
6B. Within the Elliott Wave Principle define the ratio analysis and explain the two categories of relationships
that can be defined with ratio analysis.
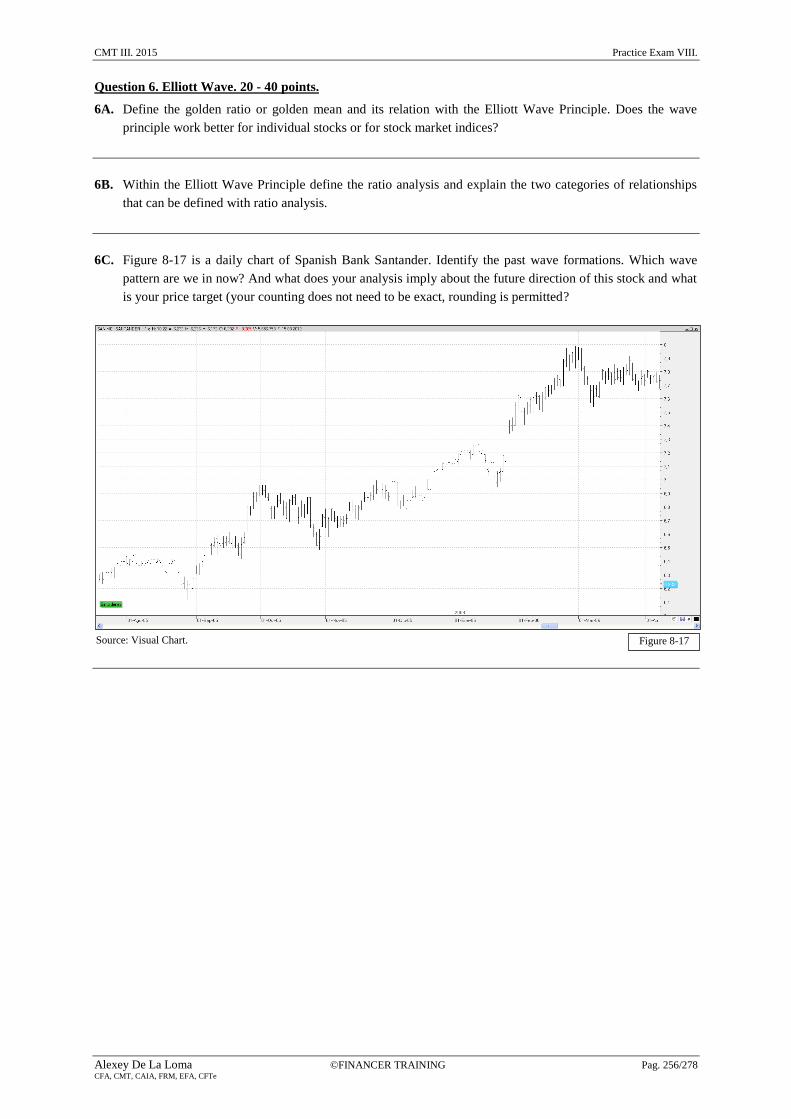
6C. Figure 8-17 is a daily chart of Spanish Bank Santander. Identify the past wave formations. Which wave
pattern are we in now? And what does your analysis imply about the future direction of this stock and what
is your price target (your counting does not need to be exact, rounding is permitted?
Figure 8-17 Source: Visual Chart.
CMT III. 2015 Practice Exam VIII.
Alexey De La Loma ©FINANCER TRAINING Pag. 257/278 CFA, CMT, CAIA, FRM, EFA, CFTe
Question 7. Point and Figure. 20 - 40 points.
7A. Regarding the optimization with P&F charts, name five inputs parameters of any P&F optimization and
five advises you will give a young technician about P&F optimization.
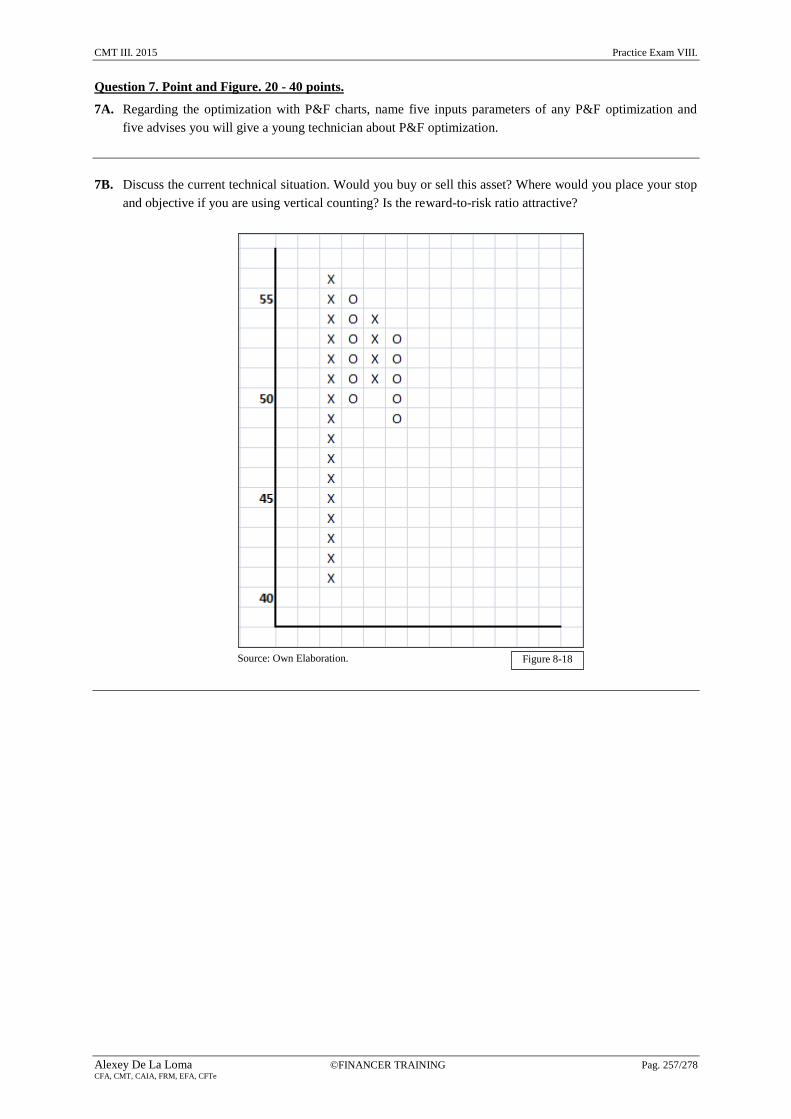
7B. Discuss the current technical situation. Would you buy or sell this asset? Where would you place your stop
and objective if you are using vertical counting? Is the reward-to-risk ratio attractive?
Figure 8-18 Source: Own Elaboration.
CMT III. 2015 Practice Exam VIII.
Alexey De La Loma ©FINANCER TRAINING Pag. 258/278 CFA, CMT, CAIA, FRM, EFA, CFTe
Question 8. Risk Management. 20 - 40 points.
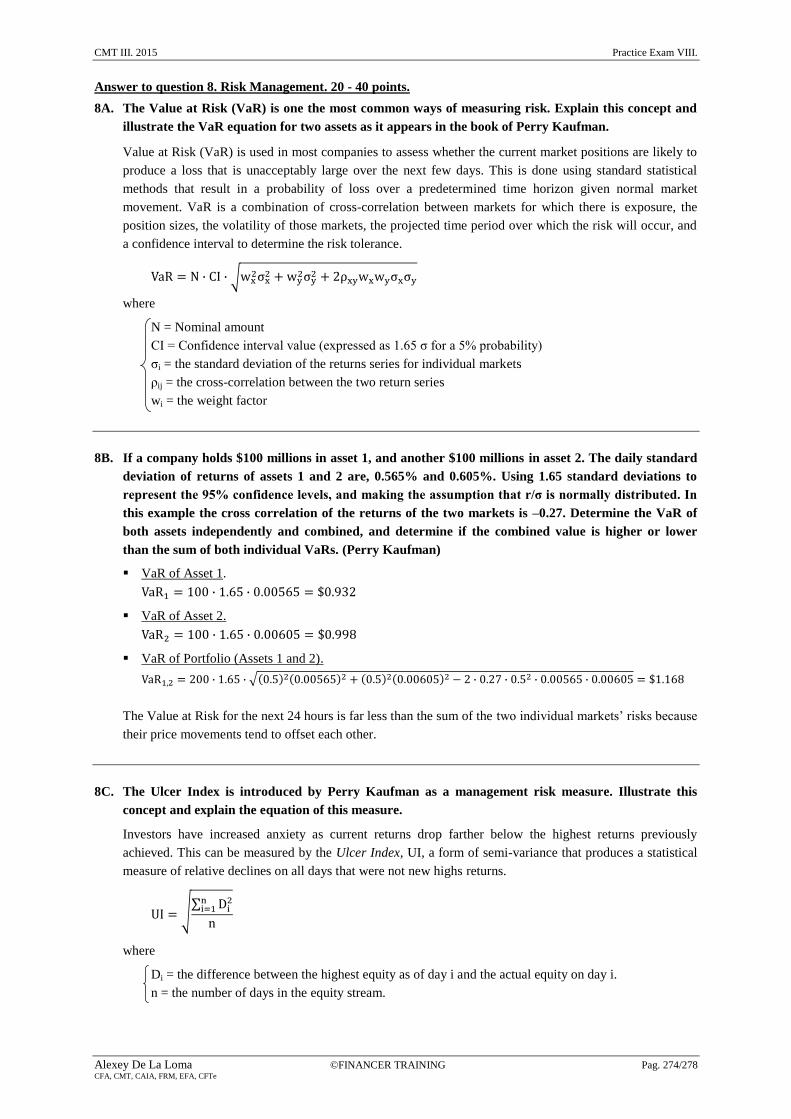
8A. The Value at Risk (VaR) is one the most common ways of measuring risk. Explain this concept and
illustrate the VaR equation for two assets as it appears in the book of Perry Kaufman.
8B. If a company holds $100 millions in asset 1, and another $100 millions in asset 2. The daily standard
deviation of returns of assets 1 and 2 are, 0.565% and 0.605%. Using 1.65 standard deviations to represent
the 95% confidence levels, and making the assumption that r/σ is normally distributed. In this example the
cross correlation of the returns of the two markets is –0.27. Determine the VaR of both assets
independently and combined, and determine if the combined value is higher or lower than the sum of both
individual VaRs.
8C. The Ulcer Index is introduced by Perry Kaufman as a management risk measure. Illustrate this concept and
explain the equation of this measure.
8D. Illustrate the equation of the Sharpe Ratio and determine graphically why this ratio cannot distinguish
between
Consecutive small losses and alternating small losses.
Consecutive small losses and large surges of profits.
CMT III. 2015 Practice Exam VIII.
Alexey De La Loma ©FINANCER TRAINING Pag. 259/278 CFA, CMT, CAIA, FRM, EFA, CFTe
Question 9. System Development. 20 - 40 points.
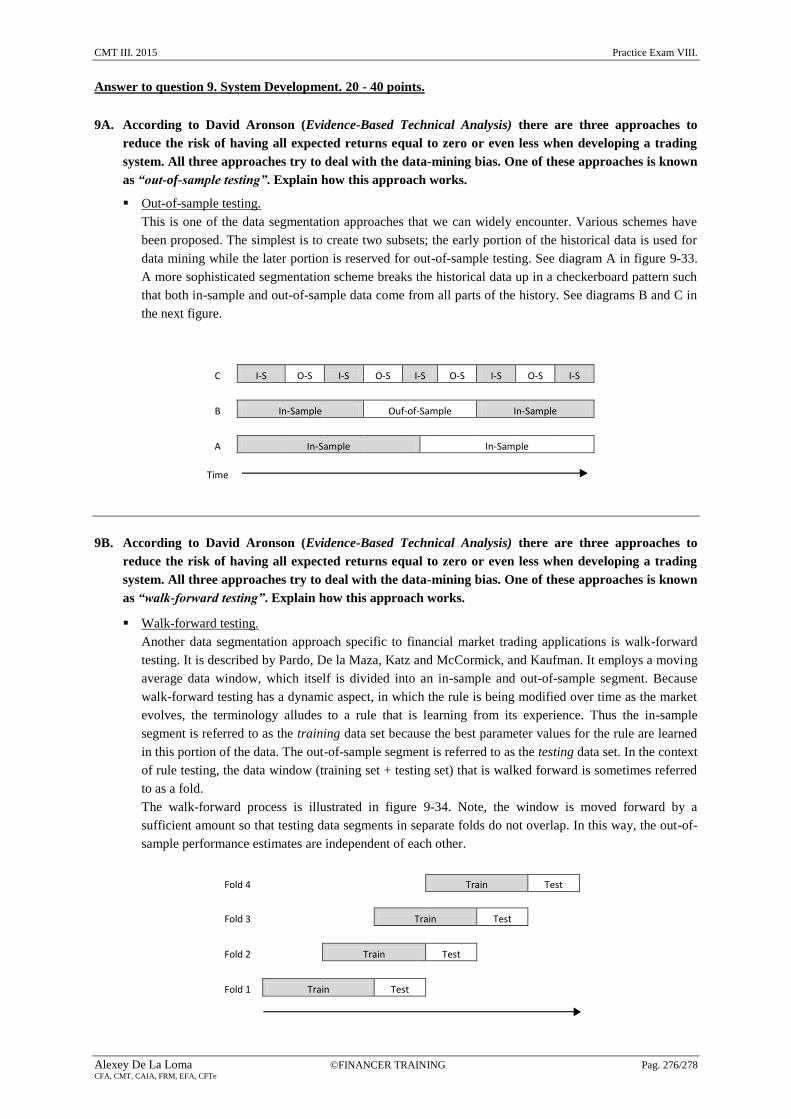
9A. According to David Aronson (Evidence-Based Technical Analysis) there are three approaches to reduce the
risk of having all expected returns equal to zero or even less when developing a trading system. All three
approaches try to deal with the data-mining bias. One of these approaches is known as “out-of-sample
testing”. Explain how this approach works.
9B. According to David Aronson (Evidence-Based Technical Analysis) there are three approaches to reduce the
risk of having all expected returns equal to zero or even less when developing a trading system. All three
approaches try to deal with the data-mining bias. One of these approaches is known as “walk-forward
testing”. Explain how this approach works.
9C. Trend-following systems are based on taking positions in the direction of the trend. They are based on
taking a long position when prices are high, in order to close that position even higher, or taking a short
position when prices are low, in order to sell that position even lower. Trend-following do not attempt to
catch peaks and valleys as counter-trend system do. Because, we need to be sure a trend has started before
taking a position, they send lagging signals and suffer in trading range markets. According to Charles
Kirkpatrick, there are two types of trend-following systems. Name them and explain their characteristics.
9D. Define the concept and state the equations for the next backtesting measures: net profit, profit factor, payoff
ratio, and the recovery ratio.
CMT III. 2015 Practice Exam VIII.
Alexey De La Loma ©FINANCER TRAINING Pag. 260/278 CFA, CMT, CAIA, FRM, EFA, CFTe
Answer to Question 1. MTA Code of Ethics. 12 points.
1A. During a recent interview, Stuart Diamond, CMT, was asked to give his opinion on the stock market,
his recent market commentary and several stock picks. The following sentence comes from this
interview. ”Recently we started a marketing campaign to increase our client base. As we have not
increased the number of employees, we have received some complaints from current clients. This will
be temporary and the quality of our service will be reestablished as soon as possible.”
Based on this information, which of the following statements is most accurate? (2 points)
B. Stuart has violated Ethics Standard 1 by behaving unprofessionally.
1B. During a recent interview, Stuart Diamond, CMT, was asked to give his opinion on the stock market,
his recent market commentary and several stock picks. The following sentence comes from this
interview. “As we have also less time to develop our technical weekly report, we have subscribed to
some third-party research, and we are repackaging this research with our logo to fill the
recommendations in our weekly report.”
Based on this information, which of the following statements is most accurate? (2 points)
D. Stuart has violated Ethics Standards 8 by repackaging the research with the company logo as if the
research was proprietary.
1C. During a recent interview, Stuart Diamond, CMT, was asked to give his opinion on the stock market,
his recent market commentary and several stock picks. The following sentence comes from this
interview: “Because we base all our research in technical analysis, we have little problems with
basing our recommendations on material non-public information. However, we hired an expert on
this area to study the financial regulations of all countries in which we are promoting our services.”
Based on this information, which of the following statements is most accurate? (2 points)
A. Stuart has not violated any of the Ethics Standards.
1D. During a recent interview, Stuart Diamond, CMT, was asked to give his opinion on the stock market,
his recent market commentary and several stock picks. The following sentence comes from this
interview: “We recently introduced a financial education plan for our analysts. Nowadays, technical
analysts think that just after reading two books they can beat the market. Yesterday I was invited to
a conference by technical analyst John Triangle, and it was completely useless, the whole conference
was garbage.”
Based on this information, which of the following statements is most accurate? (2 points)
B. Stuart has violated Ethics Standard 1 by discrediting the analytical work of others.
1E. During a recent interview, Stuart Diamond, CMT, was asked to give his opinion on the stock market,
his recent market commentary and several stock picks. The following sentence comes from this
interview: “However, after this technical analyst, a trading system developer exposed a simple
strategy that looked quite interesting, I programmed it when I came back to the office and the
backtesting was quite brilliant, I changed the parameters of the model and fully documented the
whole procedure and rationale. This is now one of our star strategies.”
Based on this information, which of the following statements is most accurate? (2 points)
C. Stuart has violated Ethics Standard 8 by copying the strategy and included as a proprietary strategy.
CMT III. 2015 Practice Exam VIII.
Alexey De La Loma ©FINANCER TRAINING Pag. 261/278 CFA, CMT, CAIA, FRM, EFA, CFTe
1F. Johnathan Dos Santos, CMT, works as an analyst for a big management and advisory company. Dos
Santos issued a research report with an initial buy recommendation on Panton Colors. The report
includes an analysis using some very new and controversial methods of technical analysis, along with
complete documentation as to the procedure and rationale. Ten minutes after emailing the report to
all his clients, Johnathan starts to buy Panton Colors stock for his premium clients.
Based on this information, which of the following statements is most accurate? (2 points).
C. Dos Santos violated Ethics Standard 3 regarding the technical methodologies employed.
CMT III. 2015 Practice Exam VIII.
Alexey De La Loma ©FINANCER TRAINING Pag. 262/278 CFA, CMT, CAIA, FRM, EFA, CFTe
Answer to Question 2. Behavioral Finance. 20 - 40 points.
2A. Psychologists have spent many years documenting the fact that group decisions are among the worst
decisions ever made, effectively endorsing the view that committees are groups of people who keep
minutes but waste hours. The key reason for this appears to that when we come together as a group
we not only have to deal with our own biases, but also with everyone else’s biases. As with all biases
the solutions are never easy to implement. However, three possible routes to reducing group biases
can be applied. Determine and explain these routes.
Secret Ballots.
The use of secret ballots reduces the risk of group members coming under social pressure. So perhaps
before the meeting starts members should write down their views and their preferences for asset
allocation, then count the votes, and debate the outcome if it is really necessary – bearing in mind the
dangers inherent in this process.
Devil’s Advocates.
Appointing a devil’s advocate may help. However, all too often the person selected may not truly
believe the role he is asked to play, and hence does not really try too hard to prevent the group reaching
its consensus decision. Selecting prickly disagreeable individuals with a strong contrarian view and the
ability and desire to argue on almost anything would be perfect.
Respect for other group members.
When the group members are acknowledged to be experts in their field, and hence disparate viewpoints
are easier to deal with and unshared information may be easier to uncover. However, all too often
people tend to believe that they know best on almost every subject and hence tend not to display respect
for the views of others.
2B. Determine whether Behavioral Finance in general and James Montier in particular, consider CAPM
as a valid financial model for practitioners. Explain your answer.
Over the long run there has been essentially no relationship between beta and return. The evidence is clear:
CAPM doesn’t work, and if we are asking why? The answer is clearly understood when you see the
incredible and super restrictive assumptions:
1. No transaction costs (no commissions, no bid-ask spread).
2. Investors can take any position (long or short) in any stock in any size without affecting the market
price.
3. No taxes (so investors are indifferent between dividends and capital gains).
4. Investors are risk averse.
5. Investors share a common time horizon.
6. Investors view stocks only in mean-variance space (so they all use the Markowitz Optimization model).
7. Investors control risk through diversification.
8. All assets, including human capital, can be bought and sold freely in the market.
9. Investors can lend and borrow at the risk-free rate (RFR).
2C. Despite the wide range of assets that have witnessed bouts of irrational exuberance (tulips, coins,
bonds, cotton, wheat, land, equities, etc), bubbles seem to follow a similar pattern. Name the five
phases of an asset price bubble following the Kindleberger/Minsky model, and explain the phase in
which the boom is further exacerbated by monetary expansion and/or credit creation.
Displacement.
Credit creation.
Just as fire can’t grow without oxygen, so a boom needs liquidity to feed on. The boom is then further
exacerbated by monetary expansion and/or credit creation. Effectively the model holds money/credit as
CMT III. 2015 Practice Exam VIII.
Alexey De La Loma ©FINANCER TRAINING Pag. 263/278 CFA, CMT, CAIA, FRM, EFA, CFTe
endogenous to the system, such that for any given banking system, monetary means of payment may be
expanded not only within the existing system of banks, but also by the formation of new banks, the
developments of new credit instruments and the expansion of personal credit outside the banking
system.
Monetary and credit creation in the US high tech bubble were largely the result of overly
accommodative monetary policy on the part of the Fed in 1998, resulting in a massive liquidity surge.
The prominent role that investment played in the cite US bubble is evident looking at the investment as
a percentage of GDP; this percentage soared from around the 14% in the late 1980s to nearly 19% at the
peak in 2000.
Euphoria.
Critical stage / financial distress.
Revulsion.
2D. Not all bubbles are the same. James Montier states four major types. Name them and explain the one
characterized by the following reasoning: “new era seems invincible and is supported by rapid
expansion of the economy and a seemingly inexorable rise in stock prices. This process leads to
feelings of over-optimism and overconfidence."
Rational/Near Rational Bubbles.
Intrinsic Bubbles.
Fad Bubbles.
It is the psychology of the euphoria stage that is of relevance to us in the present context. The euphoria
stage might, for example, be characterized by a general belief in the “new era”. Groupthink is an
important contributor in such environments. People come under immense pressure to conform to the
majority’s view, frequently suppressing their own views in the process.
The “new era” seemed invincible and was supported by rapid expansion of the economy and a
seemingly inexorable rise in stock prices. This process leads to feelings of overoptimism and
overconfidence. These two traits are a potent combination leading people to overestimate returns,
understate the risk, and be far too sure about their knowledge and ability to control the situation.
Informational Bubbles.
CMT III. 2015 Practice Exam VIII.
Alexey De La Loma ©FINANCER TRAINING Pag. 264/278 CFA, CMT, CAIA, FRM, EFA, CFTe
Answer to question 3. Intermarket Analysis. 20 - 40 points.
3A. If the following chart represent the trend of the CRB/T-Bond ratio at the end of year 2008, what
could you expect about the Utilities/S&P ratio?
Usually, this relationship is negative. When the CRB/Bond ratio is rising, investors favor economically
sensitive stock groups that benefit from a stronger economy. A falling CRB/Bond ratio favors more
defensive stocks groups like consumer staples and utilities. That makes the CRB/Bond ratio a useful
indicator for sector rotation purposes.
3B. Is there any clear intermarket relationship between Canadian Dollar and Commodities? If this
relation exists explain the reason.
The direction of the Canadian Dollar (CAD) has important implications for the Canadian and U.S. stock
markets, as well as commodities. Canadian stocks have a close historical correlation to U.S. stocks. There
is also a close historic correlation between the CAD and the Canadian stocks, and both are closely tied to
fortunes of commodity markets. Canada is one of the world’s biggest exporters of natural resources.
Canadian companies that produce energy and basic materials make up half of the Toronto Stock Index. The
three markets, therefore, are highly correlated.
3C. Is there any clear intermarket relationship between the ratio Silver/Gold and the U.S. stock market?
If this relation exists explain the reason.
Source: StockCharts.com Figure 8-1
CMT III. 2015 Practice Exam VIII.
Alexey De La Loma ©FINANCER TRAINING Pag. 265/278 CFA, CMT, CAIA, FRM, EFA, CFTe
Although silver is considered to be a precious metal, it is also an industrial metal. It is the industrial role
that gives it some value in helping to measure economic trends. Generally speaking, a rising silver price
implies economic strength. Using the same rationale that compares the price of copper to gold, the direction
of the silver/gold ratio can also be employed as a useful stock market indicator. The relation has a positive
correlation coefficient.
CMT III. 2015 Practice Exam VIII.
Alexey De La Loma ©FINANCER TRAINING Pag. 266/278 CFA, CMT, CAIA, FRM, EFA, CFTe
Answer to question 4. Strategy and Techniques. 20 - 40 points.
4A. Discuss your technical view of Caterpillar stock in a daily timeframe. The chart is accompanied by a
12-26-9 MACD, a 200-day exponential moving average, and the volume histogram. The price is
currently at $100, the moving average is at $94.7, maximum price of chart is $117 and the whole
chart has 2 years of data. What is your profit target and why? Where would you enter a trade, and
where would you place your stop? What is your risk-reward ratio, and explain whether you think it
is adequate to justify the trade? (As this is the section dedicated to technical analysis, forget about
Elliott Wave and Fibonacci retracements in your answer).
This is a long-term bull trend of a stock (stock market asset). The moving average of parameter 200 is
working as a dynamic support with three contact points and the price has already touched again this
moving average so the bull trend is still in place. The last months show a small bear trend that is
represented by an oversold level in the MACD oscillator. However this oscillator is showing a buy
signal (MACD is crossing over the Signal line), so we are facing a long-term bull trend and the
technical situation in the short-term is also bullish. During this oversold period, the volume has not been
especially strong and this adds to the before mentioned technical view in the short-term.
Regarding the trading opportunities, as the price is near the support area, we could open a long position
with a price target in the relative maximum price at $117 and a stop before the moving average, at $94
and that gives us a reward-to-risk ratio close to 3, so it will be a good trading opportunity for a short-
term trade. Another option will be to take a long position with a trailing stop under the exponential
moving average without profit target (position trading).
Figure 8-2 Source: Visual Chart.
CMT III. 2015 Practice Exam VIII.
Alexey De La Loma ©FINANCER TRAINING Pag. 267/278 CFA, CMT, CAIA, FRM, EFA, CFTe
4B. Connie Brown in (Technical Analysis for the trading professional), is an Elliottician, she worked for
Robert Prechter a few years prior to the Centennial Olympic Games in Atlanta, and her specialty is
the S&P 500. Can you mention the list of most common objections to the Elliott Wave that she
introduces in her book? (10 points). Can you mention the difference between rules and guidelines and
show the principal rules? (5 points). How does she use the different timeframes with the Elliott Wave
Principle?
1) Although she disagree with most common objections to the Elliott Wave principle, these are the
following:
a) “It is too subjective”.
b) “Analysts have been caught on the wrong side of the market or with diametrically opposing views
about the Dow Jones Industrial Average”.
c) “Too many alternative market scenarios can be suggested by the same analyst” and “Different
analysts can interpret the exact same pattern in different ways”.
d) “If you scan different time horizons for the same market, you can find any pattern you want to prove
your market opinion”.
2) The Wave Principle only has three rules. Everything else is a guideline.
a) Rule 1: Wave 2 may not break below the origin of wave 1.
b) Rule 2: Wave 3 cannot be the shortest. This rule actually leads to a common misunderstanding.
Wave 3 does not have to be the longest; it just cannot be the shortest when compared to waves 1 and
5.
c) Rule 3: Wave 4 cannot overlap the end or termination of wave 1.
3) Constance Brown analyzes some intraday charts with the Elliott Wave Principle and makes the
statement that she works from the smallest building block possible (avoiding tick charts) and work
upward into a longer time horizon. On the other hand, Robert Prechter starts with an extremely long
horizon interpretation and then looks for substructure within progressively shorter timeframes to
compliment his longer-horizon view. Connie Brown takes the approach of building from the small and
working upward because her risk management dictates accuracy in the very short time horizons.
However, Prechter is interested in the big picture.
CMT III. 2015 Practice Exam VIII.
Alexey De La Loma ©FINANCER TRAINING Pag. 268/278 CFA, CMT, CAIA, FRM, EFA, CFTe
Answer to question 5. Candlestick. 20 - 40 points.
5A. Identify and explain the significance of the following candlestick pattern within the oval.
It is an abandoned baby top. A countertrend bearish pattern similar to an evening star, with an island top for
the intermediate candle. It is a pattern that needs no confirmation and it has a bearish bias.
5B. Identify and explain the significance of the following candlestick pattern within the oval.
It is a dragonfly doji. It is a counter-trend bullish pattern. The real body is a doji (it is a hammer deviation).
It comes after a short-term bearish trend, the upper shadow must be small and the lower shadow must be
relatively great. No confirmation is necessary and it has a bullish bias.
5C. Identify and explain the significance of the following candlestick pattern within the oval.
It is a bearish harami. It is a counter-trend bearish pattern, composed by two candles with no mandatory
definition. However, the ideal bearish harami must have a white first candle and a black second candle. The
particular characteristic of the harami is that the first real body engulfs the second. It is a pattern that needs
confirmation, as it happens in this chart, so it has a bearish bias.
5D. Identify and explain the significance of the following candlestick pattern within the oval.
It is hanging man, a counter-trend bearish pattern, with an identical pattern as the hammer, with the
difference of the preceding trend (bullish in this case). The real body can be black or white and must be
near the high of the trading range. It is a pattern composed by just one candle, an umbrella. The upper
shadow must be smaller than the real body and the lower shadow must be greater than the real body by a
proportion of at least 2. It is a pattern that needs confirmation, because the proportion between real body
and shadows is bullish. In this chart there is confirmation so the bias is bearish.
5E. Identify and explain the significance of the following candlestick pattern within the oval.
It is a bullish engulfing with a tweezers bottom. It is a counter-trend bullish pattern, similar to the piercing
line in all characteristics, except that in an engulfing pattern, the second real body candle must covers
completely the real body of the first candle. First candle must be black and second candle must be white. It
needs no confirmation and it has a bullish bias.
5F. Identify the four candlestick patterns; explain their significance and classify them from the more
relevant to the less relevant.
1) Chart 8-8 is a morning star. It is the third more relevant of the four patterns. It has a bullish bias.
2) Chart 8-9 is a morning doji star. It is the second more relevant of the four patterns. It has a bullish bias.
3) Chart 8-10 is an abandoned baby bottom. It is the most relevant of the four patterns. It has a bullish bias.
4) Chart 8-11 looks like a morning star but the third candle does not close above the middle-point of first
candle, so this is not a morning star.
CMT III. 2015 Practice Exam VIII.
Alexey De La Loma ©FINANCER TRAINING Pag. 269/278 CFA, CMT, CAIA, FRM, EFA, CFTe
5G. Identify the five candlestick patterns and explain if they are bullish or bearish.
1) Chart 8-12 is an on-neck pattern. It is a continuation-trend bearish pattern.
2) Chart 8-13 is an in-neck pattern. It is a continuation-trend bearish pattern.
3) Chart 8-14 is a thrusting pattern. It is a continuation-trend bearish pattern.
4) Chart 8-15 is a piercing line. It is a counter-trend bullish pattern.
5) Chart 8-16 is a bullish engulfing pattern. It is a counter-trend bullish pattern.
CMT III. 2015 Practice Exam VIII.
Alexey De La Loma ©FINANCER TRAINING Pag. 270/278 CFA, CMT, CAIA, FRM, EFA, CFTe
Answer to question 6. Elliott Wave. 20 - 40 points.
6A. Define the golden ratio or golden mean and its relation with the Elliott Wave Principle. Does the
wave principle work better for individual stocks or for stock market indices?
In Liber Abacci, Fibonacci establishes the sequence of numbers 1, 1, 2, 3, 5, 8, 13, 21, 34, 55, 89, 144,
and so on to infinity, known today as the Fibonacci sequence. The Fibonacci sequence has many
interesting properties and reflects an almost constant relationship among its components. The sum of
any two adjacent numbers in the sequence forms the next higher number in the sequence: 1 plus 1
equals 2, 1 plus 2 equals 3, 2 plus 3, equals 5, 3 plus 5 equals 8, and so on to infinity.
After the first several numbers in the sequence, the ratio of any number to the next higher is
approximately .618 to 1 and to the next lower number approximately 1.618 to 1. The further along the
sequence, the closer the ratio approaches Phi (Ф) which is an irrational number, .618034… between
alternate numbers in the sequence, the ratio is approximately .382. Phi is the only number that when
added to 1 yields its inverse: 1 + 0.618 = 1/0.618.
1.618 (or 0.618) is known as the Golden Ratio or Golden Mean. Its proportions are pleasing to the eye
and ear. It appears throughout biology, music, art and architecture. Nature uses the Golden Ratio in its
most intimate building blocks and in its most advanced patterns, in forms as minuscule as microtubules
in the brain and the DNA molecule. It is used extensively in the Wave Theory, to calculate retracements
and impulse proportions.
As a mass psychological phenomenon, the market averages unfold in Elliott wave patterns regardless of
the price movements of individual stocks. While the wave principle has some application to individual
stocks, the count for many issues is often too fuzzy to be of great practical value. In other words, Elliott
will tell you if the track is fast but not which horse is going to win. With regard to individual stocks,
other types of analysis are probably more rewarding than trying to force the stock’s price action into an
Elliott count that may or may not exist.
6B. Within the Elliott Wave Principle define the ratio analysis and explain the two categories of
relationships that can be defined with ratio analysis.
Ratio analysis is the assessment of the proportionate relationship, in time and amplitude, of one wave to
another. In discerning the working of the Golden Ratio in the five up and three down movement of the
stock market cycle, one might anticipate that on completion of any bull phase, the ensuing correction would
be three-fifths of the previous rise in both time and amplitude. Such simplicity is seldom seen. Ratio
analysis has revealed a number of precise price relationships that occur often among waves. There are two
categories of relationships: retracements and multiples.
Retracements.
Occasionally, a correction retraces a Fibonacci percentage of the preceding wave. Sharp corrections
tend more often to retrace 61.8% or 50% of the previous wave, particularly when they occur as wave 2
of an impulse, wave B of a larger zigzag, or wave X in a multiple zigzag. A leading diagonal triangle in
the wave one position is typically followed by a zigzag retracement of 78.6% (√Ф). Sideways
corrections tend more often to retrace 38.2% of the previous impulse wave, particularly when they
occur as wave 4. Retracements come in all sizes.
Motive Waves Multiples.
When wave 3 is extended, waves 1 and 5 tend towards equality or a 0.618 relationship. Actually, all
three motive waves tend to be related by Fibonacci mathematics, whether by equality, 1.618 or 2.618
(whose inverses are 0.618 and 0.382). These impulse wave relationships usually occur in percentage
terms. Of course, at small degrees, arithmetic and percentages scales produce essentially the same
result, so that the number of points in each impulse wave reveals the same multiples.
Another typical development is that wave 5’s length is sometimes related by the Fibonacci ratio to the
length of wave 1 through wave 3, showing an extended fifth wave 0.382 and 0.618 relationships occur
CMT III. 2015 Practice Exam VIII.
Alexey De La Loma ©FINANCER TRAINING Pag. 271/278 CFA, CMT, CAIA, FRM, EFA, CFTe
when wave five is not extended. In those rare cases when wave 1 is extended, it is wave 2, quite
reasonably, that often subdivides the entire impulse wave into the Golden Section.
6C. Figure 8-17 is a daily chart of Spanish Bank Santander. Identify the past wave formations. Which
wave pattern are we in now? And what does your analysis imply about the future direction of this
stock and what is your price target (your counting does not need to be exact, rounding is permitted?
The time series shows a bull trend with a complete five Elliott wave movement. Wave 1 starts at €6.15 and
finishes at €6.95, so it has a length of €0.8, wave 2 retraces €0.50, wave 3 retakes the bullish side and has a
length equal to the first wave, wave 4 retraces a length of €0.4 and the bull impulse conclude with a wave 5
with a length of €1. Once this 5 wave cycle is completed we are ready for a Fibonacci retracement (down
move) with a first objective in the 38.2% of the whole down impulse, a second objective in the 50% of the
whole down impulse, and a third and last retracement in the 61.8%. In this chart we have included price
action after the wave counting to show how the time series stopped in the third Fibonacci retracement level.
Before that we could have confirmed the down movement when the double top was confirmed (the price
violates the intermediate local minimum between the two tops).
Figure 8-17 Source: Visual Chart.
CMT III. 2015 Practice Exam VIII.
Alexey De La Loma ©FINANCER TRAINING Pag. 272/278 CFA, CMT, CAIA, FRM, EFA, CFTe
Answer to question 7. Point and Figure. 20 - 40 points.
7A. Regarding the optimization with P&F charts, name five inputs parameters of any P&F optimization
and five advises you will give a young technician about P&F optimization.
Inputs:
3-box reversal charts only.
Log scale charts only.
Box size range from 0.5% to 5%, stepping up 0.1% at a time. This means that 0.5% will be tested,
then 0.6%, then 0.7% and so on.
Test using close only and the high/low construction methods.
Entry and exit signals. Buy on first occurrence of a double-top signal. Ignore any subsequent
double-top buys. Sell on first occurrence of a double-bottom sell. Ignore all subsequent double-
bottom sells, until the next double-top buy starts to process again.
Data. This is discussed in the data consistency and adaptability section.
Recommendations.
Optimization is only of value with 3-box reversal charts, because of their unambiguous signals.
Unless you are looking very short-term, percentage box sizes should be used.
Including uncommon Point and Figure patterns is fine for entry signals, but they should never be
included as possible exit signals.
Optimization should always be conducted using the latest data because this allows the parameters to
adjust as new data is received.
The unrealized profit from any open position should be excluded from the optimization, so box sizes
are calculated on closed positions only.
Dealing costs must be taken into account to prevent lots of small trades from being included.
Optimization can tell you what box size is working best, based on double-top and bottom signals. In
doing so, it tells you about the characteristics of the instruments.
In most cases, profits are increased considerably when trailing stop loss is used as the exit rather
than a double-column signal.
Optimization can tell you whether the close only or high/low construction method is working best
for the particular instrument.
Optimization results show that the shorter your time horizon, the smaller the box size is required.
Optimization does not tell you how to read the chart, but gives you a starting point from where your
subjective analysis must take over.
Signal delay may need to be considered, although it is more difficult to administer with Point and
Figure charts.
CMT III. 2015 Practice Exam VIII.
Alexey De La Loma ©FINANCER TRAINING Pag. 273/278 CFA, CMT, CAIA, FRM, EFA, CFTe
7B. Discuss the current technical situation. Would you buy or sell this asset? Where would you place
your stop and objective if you are using vertical counting? Is the reward-to-risk ratio attractive?
This is a 1x3 Point and Figure chart that is reversing a bull trend, so the current trendline is bearish. The
current price is in a down column and this pattern is called a reversal double bottom. We could not
recommend opening a short position at current prices because both reward-to-risk ratios are quite poor
(below the recommended 3:1).
Vertical Target.
56 - (6*1*3) = 38.
Reward.
49 - 38 = 11.
Risk 1.
55 - 49 = 6 and the Risk1-Reward ratio is 11/6 = 1.8.
Risk 2.
57 - 49 = 8 and the Risk2-Reward ratio is 12/8 = 1.5.
Figure 8-18 Source: Own Elaboration.
CMT III. 2015 Practice Exam VIII.
Alexey De La Loma ©FINANCER TRAINING Pag. 274/278 CFA, CMT, CAIA, FRM, EFA, CFTe
Answer to question 8. Risk Management. 20 - 40 points.
8A. The Value at Risk (VaR) is one the most common ways of measuring risk. Explain this concept and
illustrate the VaR equation for two assets as it appears in the book of Perry Kaufman.
Value at Risk (VaR) is used in most companies to assess whether the current market positions are likely to
produce a loss that is unacceptably large over the next few days. This is done using standard statistical
methods that result in a probability of loss over a predetermined time horizon given normal market
movement. VaR is a combination of cross-correlation between markets for which there is exposure, the
position sizes, the volatility of those markets, the projected time period over which the risk will occur, and
a confidence interval to determine the risk tolerance.
where
N = Nominal amount
CI = Confidence interval value (expressed as 1.65 σ for a 5% probability)
σi = the standard deviation of the returns series for individual markets
ρij = the cross-correlation between the two return series
wi = the weight factor
8B. If a company holds $100 millions in asset 1, and another $100 millions in asset 2. The daily standard
deviation of returns of assets 1 and 2 are, 0.565% and 0.605%. Using 1.65 standard deviations to
represent the 95% confidence levels, and making the assumption that r/σ is normally distributed. In
this example the cross correlation of the returns of the two markets is –0.27. Determine the VaR of
both assets independently and combined, and determine if the combined value is higher or lower
than the sum of both individual VaRs. (Perry Kaufman)
VaR of Asset 1.
VaR of Asset 2.
VaR of Portfolio (Assets 1 and 2).
The Value at Risk for the next 24 hours is far less than the sum of the two individual markets’ risks because
their price movements tend to offset each other.
8C. The Ulcer Index is introduced by Perry Kaufman as a management risk measure. Illustrate this
concept and explain the equation of this measure.
Investors have increased anxiety as current returns drop farther below the highest returns previously
achieved. This can be measured by the Ulcer Index, UI, a form of semi-variance that produces a statistical
measure of relative declines on all days that were not new highs returns.
where
Di = the difference between the highest equity as of day i and the actual equity on day i.
n = the number of days in the equity stream.
CMT III. 2015 Practice Exam VIII.
Alexey De La Loma ©FINANCER TRAINING Pag. 275/278 CFA, CMT, CAIA, FRM, EFA, CFTe
System B
System A
System B
System A
Time Time
If the equity on day i is a new high equity, then Di = 0. As the UI increases, investors are more anxious
about performance.
8D. Illustrate the equation of the Sharpe Ratio and determine graphically why this ratio cannot
distinguish between
Consecutive small losses and alternating small losses.
Consecutive small losses and large surges of profits.
The classic measurement of performance is the Sharpe ratio (SR), expressed as
where
μ = the expected return (the annualized rate of return)
rRF = the risk free rate (usually the 3-month rate)
σμ = the standard deviation of the periodic returns
Kaufman considers that the risk free rate can be omitted in some occasions. For example, it cannot be
omitted when there is a risk free rate return on unused capital that has been imbedded in the performance.
The Sharpe Ratio satisfies the first universal criterion of system selection, that all else being equal, higher
profits are better. It does not satisfy either of the other criteria illustrated in figures A and B, because it
cannot distinguish between:
Consecutive small losses (system B) and alternating small losses (system A).
Consecutive small losses (system B) and large surges of profits (system A).
Clearly, system A is best in both cases.
Equit
y
Equit
y
Source: Perry Kaufman. Source: Perry Kaufman. Figure B Figure A
CMT III. 2015 Practice Exam VIII.
Alexey De La Loma ©FINANCER TRAINING Pag. 276/278 CFA, CMT, CAIA, FRM, EFA, CFTe
Answer to question 9. System Development. 20 - 40 points.
9A. According to David Aronson (Evidence-Based Technical Analysis) there are three approaches to
reduce the risk of having all expected returns equal to zero or even less when developing a trading
system. All three approaches try to deal with the data-mining bias. One of these approaches is known
as “out-of-sample testing”. Explain how this approach works.
Out-of-sample testing.
This is one of the data segmentation approaches that we can widely encounter. Various schemes have
been proposed. The simplest is to create two subsets; the early portion of the historical data is used for
data mining while the later portion is reserved for out-of-sample testing. See diagram A in figure 9-33.
A more sophisticated segmentation scheme breaks the historical data up in a checkerboard pattern such
that both in-sample and out-of-sample data come from all parts of the history. See diagrams B and C in
the next figure.
C I-S O-S I-S O-S I-S O-S I-S O-S I-S
B In-Sample Ouf-of-Sample In-Sample
A In-Sample In-Sample
Time
9B. According to David Aronson (Evidence-Based Technical Analysis) there are three approaches to
reduce the risk of having all expected returns equal to zero or even less when developing a trading
system. All three approaches try to deal with the data-mining bias. One of these approaches is known
as “walk-forward testing”. Explain how this approach works.
Walk-forward testing.
Another data segmentation approach specific to financial market trading applications is walk-forward
testing. It is described by Pardo, De la Maza, Katz and McCormick, and Kaufman. It employs a moving
average data window, which itself is divided into an in-sample and out-of-sample segment. Because
walk-forward testing has a dynamic aspect, in which the rule is being modified over time as the market
evolves, the terminology alludes to a rule that is learning from its experience. Thus the in-sample
segment is referred to as the training data set because the best parameter values for the rule are learned
in this portion of the data. The out-of-sample segment is referred to as the testing data set. In the context
of rule testing, the data window (training set + testing set) that is walked forward is sometimes referred
to as a fold.
The walk-forward process is illustrated in figure 9-34. Note, the window is moved forward by a
sufficient amount so that testing data segments in separate folds do not overlap. In this way, the out-of-
sample performance estimates are independent of each other.
Fold 4
Train Test
Fold 3
Train Test
Fold 2
Train Test
Fold 1 Train Test
CMT III. 2015 Practice Exam VIII.
Alexey De La Loma ©FINANCER TRAINING Pag. 277/278 CFA, CMT, CAIA, FRM, EFA, CFTe
9C. Trend-following systems are based on taking positions in the direction of the trend. They are based
on taking a long position when prices are high, in order to close that position even higher, or taking a
short position when prices are low, in order to sell that position even lower. Trend-following do not
attempt to catch peaks and valleys as counter-trend system do. Because, we need to be sure a trend
has started before taking a position, they send lagging signals and suffer in trading range markets.
According to Charles Kirkpatrick, there are two types of trend-following systems. Name them and
explain their characteristics.
Moving Average Systems.
There are three popular trending-following trading systems based on moving averages. If we use only
one moving average, we can define a trading system whose signals are generated when prices cross the
moving average. If we include two moving averages, signals are generated when both moving averages
cross over each other. We can even include one more moving average and design a trading system with
three moving averages. According to Charles Kirkpatrick and Larry Williams (The Definitive Guide to
Futures Trading) the most efficient way to trade using moving averages is the intermediate system. In
other words, using two moving averages is better than using three or just one.
Breakout Systems.
Additionally to the popular moving averages, we can develop trend-following trading systems through
the concept of “breakout”. In a breakout trading systems, signals are generated when price moves out of
a channel or band. These systems can be based on static bands, as the popular Richard Donchian’s
four-week rule, or dynamic, as the volatility breakout systems using Bollinger bands, ranges ATRs or
other measures of range volatility. The most productive are based on longer timeframes (daily or
weekly). However, they can also be applied to shorter timeframes as the open range breakout systems,
based on intraday data.
9D. Define the concept and state the equations for the following backtesting measures: net profit, profit
factor, payoff ratio, and recovery ratio.
Net Profit.
It is the difference between gross profit (total profit from profitable trades) and gross loss (total loss
from losing trades). The net profit of our system must positive, if not we have a negative mathematical
expectancy.
Profit Factor.
It is the absolute value of the ratio between the gross profit and the gross loss. It shows the profitability
of the system. It must be above 1.0 or the system will have a negative mathematical expectancy.
According to Charles Kirkpatrick, “it is one of the most commonly used statistics to screen for systems
from optimization.” However, it does not tell us anything different than the previous net profit. If a
system has a positive mathematical expectancy, net profit must be positive, and profit factor must be
above 1.
Payoff ratio.
This is one of the most relevant figures of a trading system. It is just a ratio between the average
winning trade and the average losing trade, so when combined with the profitability percentage it
illustrates the mathematical expectancy of the trading system. It can also be used to determine the risk
of ruin. Trend-following systems have a higher payoff ratio than countertrend systems. Charles
Kirkpatrick considers that trend-following systems should have a ratio greater than 2.0.
CMT III. 2015 Practice Exam VIII.
Alexey De La Loma ©FINANCER TRAINING Pag. 278/278 CFA, CMT, CAIA, FRM, EFA, CFTe
Recovery Ratio.
This is one of the most important figures of a backtesting, and a great indicator to rank the results of an
optimization process. According to Charles Kirkpatrick, it should be above 2.0.