92
PRACTICAL APPLICATIONS OF MICROBIAL MODELING - WEBINAR SERIES November 29, 2017 10:00 a.m. EST

PRACTICAL APPLICATIONS OF MICROBIAL MODELING -
WEBINAR SERIES
November 29, 2017 10:00 a.m. EST

Practical Applications of Microbial Modeling Webinar Series
Webinar Series:
Part I of III
This IAFP webinar is sponsored by the following Professional Development Groups: Microbial Modelling and Risk Analysis Meat and Poultry Safety and Quality

Webinar Series: Part I of III
Practical Applications of Microbial Modeling

Dr. Betsy Booren
Senior Policy Advisor Olsson, Frank, Weeda, Terman, and Matz PC
Washington, DC

WEBINAR HOUSEKEEPING For best viewing of the presentation material, please click on ‘maximize’ in the upper right corner of the ‘Slide’ window, then ‘restore’ to return to normal view. Audio is being transmitted over the computer so please have your speakers ‘on’ and volume turned up in order to hear. A telephone connection is not available. Questions should be submitted to the presenters during the presentation via the Q & A section at the right of the screen.

WEBINAR HOUSEKEEPING It is important to note that all opinions and statements are those of the individual making the presentation and not necessarily the opinion or view of IAFP This webinar is being recorded and will be available for access by IAFP members at www.foodprotection.org within one week.

Agenda
Introduction Dr. Betsy Booren
Overview of Predictive Microbial Modeling Dr. Tom Ross
Tertiary Models for Estimation of Microbial Behavior in Real Situations – Meat Products Dr. Peter Taormina
Questions and Answers

Dr. Tom Ross
Director ARC Industrial Transformations Training Centre for Innovative Horticultural Products University of Tasmania
Tasmania, Australia

Dr. Peter Taormina
President Etna Consulting Group
Cincinnati, OH

Assoc Prof Tom Ross
Overview of Predictive Microbial Modeling

Predictive Microbiology
The quantitative microbial ecology of foods

Overview
Basic concept of predictive microbiology Basic mathematical ideas Kinds of microbial responses that can be predicted Current status of predictive microbiology Building models How can predictive microbiology models help the
food industry Critically assessing model applicability and reliability

Predictive Microbiology – basic ideas
microorganisms react reproducibly to environmental conditions
the fundamental premise is that microorganisms can’t think, so that they behave reproducibly (or “predictably”) in ways dictated by their environment.
thus if we can measure their environment, we can predict
what they will do, and how quickly they will do it.

do you all believe this?

Modern Predictive Microbiology
“the growth responses of the microbes of concern would be modelled with respect to the main controlling factors such as temperature, pH and aw ... ... Models relevant to broad categories of foods would greatly reduce the need for ad hoc microbiological examination and enable predictions of quality and safety to be made speedily with considerable financial benefit.”
Roberts and Jarvis (1983; Food Microbiology: Advances and Prospects,
Academic Press, New York, NY)

Consistent patterns of response: the temperature-growth rate relationship
5550454035302520151050-50
1
2
3
4
5
6
7
8
Temperature (°C)
Grow
th ra
te (g
ener
ation
s/h)

Universality of the temperature-growth rate relationship

Predictive Microbiology - concepts
there is a small number of environmental factors of main importance, namely: temperature pH water activity
for some foods this works, for processed foods its probably an oversimplification, so increasingly, as we adopt ‘hurdle technology’, other factors need to be considered explicitly: e.g., organic acid type and level, nitrite, gaseous atmosphere, smoke compounds, other microbes in the food, etc.

Predictive Microbiology - concepts
main controlling factors - microbial death
its also assumed that death rate is affected by physicochemical conditions in the food, but normally death rate is most strongly governed by the treatment, e.g.:
temperature pressure irradiation (UV, gamma etc.) electric field strength

Basic mathematical ideas

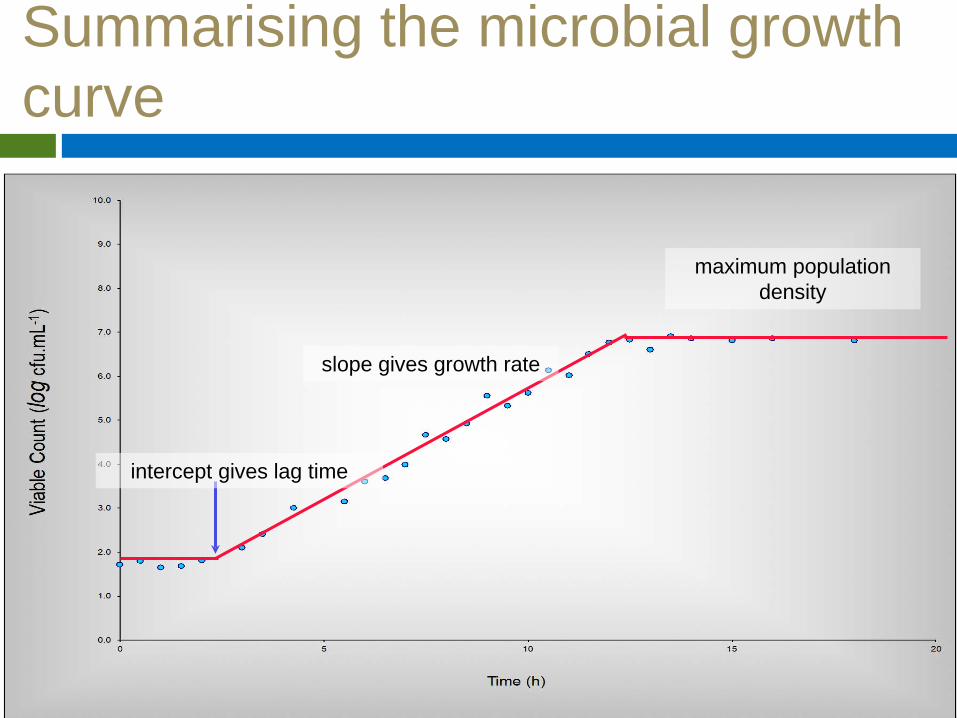
slope gives growth rate
intercept gives lag time
Summarising the microbial growth curve
maximum population density

slope gives growth rate
intercept gives lag time
maximum population density
Summarising the microbial growth curve
slope gives growth rate
intercept gives lag time
maximum population density
Summarising the microbial growth curve

slope gives growth rate
intercept gives lag time
maximum population density
Summarising the microbial growth curve

Inactivation modelling
0.0
1.0
2.0
3.0
4.0
5.0
6.0
7.0
8.0
9.0
10.0
0 5 10 15 20Time (h)
slope gives DRT (Dvalue)
0.0
1.0
2.0
3.0
4.0
5.0
6.0
7.0
8.0
9.0
10.0
0 5 10 15 20
Viab
le C
ount
(log
10cf
u.m
L-1 )
Time (h)
use slower rate - conservative (safe)
use sigmoid, or other, model
- e.g. Weibull
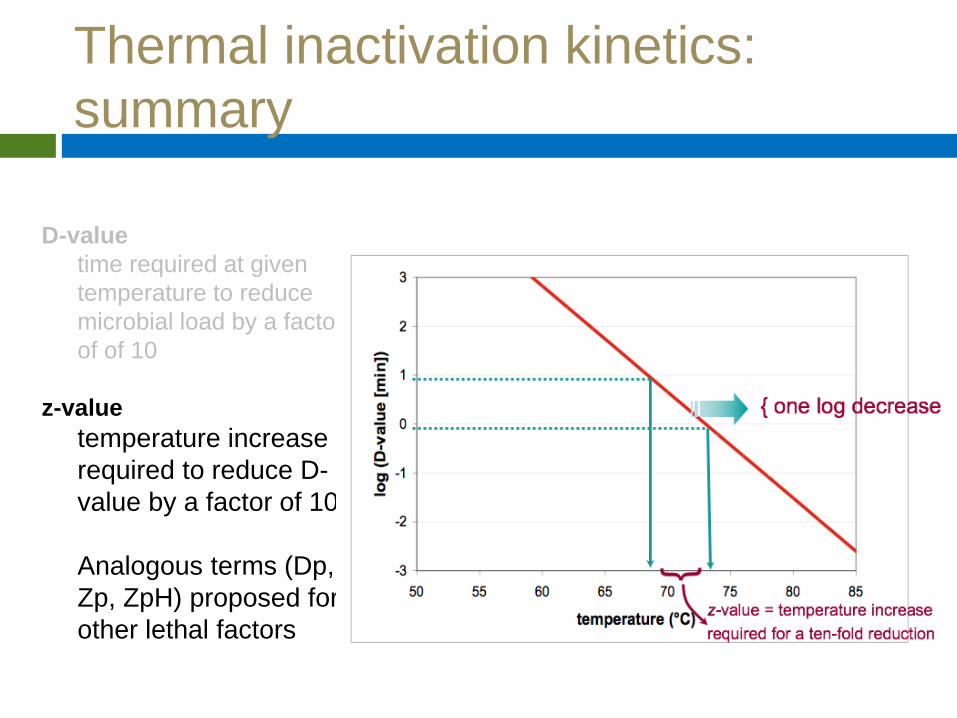
Thermal inactivation kinetics: summary
D-value time required at given
temperature to reduce microbial load by a factor of of 10
z-value temperature increase
required to reduce D-value by a factor of 10
Analogous terms (Dp,
Zp, ZpH) proposed for other lethal factors

What else can (or would) we ‘predict’
amount of microbial growth after time, (from temperature and product formulation; includes lag time, growth rate, germination and outgrowth of spores)
reduction in microbial numbers over time, from knowledge of treatment conditions and product formulations (includes delay, death rate)
probability of growth/toxin production stability of foods (absolute or within defined time)
sporulation recontamination/cross-contamination processes

Interaction of aw and temperature on growth limits of E. coli
Data of Salter et al. (2000) for E. coli (augmented 2002)

What is modelled?
growth rates bacteria yeasts and molds
inactivation (death) rates bacteria yeasts and molds viruses protozoa microbial toxins?
probability of growth/toxin formation bacteria yeasts and molds micro-algae*

Current status of Predictive Microbiology ...
PM approach is now firmly established: in the scientific literature in industry for HACCP planning, product/process
design supports food safety risk assessment and “Science-
based” risk management decisions is used in setting government regulations/laws e.g., Codex (and (EFSA) regulations for Listeria
monocytogenes in RTE foods e.g., C. perfringens model for meat cooling (USDA) e.g., E. coli growth in raw meats (NZ and Australia)

How models are ‘built’
based on measurements of changes in microbial numbers over time and environmental conditions
can be from deliberately designed de novo studies “data mining” studies in broths, or in foods n.b., assumed that the actual food is less
important than the physico-chemical properties of the environment (i.e., the food and its storage conditions), so long as basic nutritional needs are met, i.e., nutrients are non-limiting
Sometimes a model is developed for just one food

How models are ‘built’
data are analysed and patterns of response are identified
these patterns are expressed in the form of mathematical relationships
the relationships are turned into equations by finding the best values of the parameters to describe individual sets of data, i.e., specific to a particular organism - this is the process of ‘model fitting’
performance of the model is then evaluated and, if necessary, the model revised or new models constructed

Predictive Microbiology modelling
systematically make/collate lots of observations summarise the data as mathematical equations

Mathematical descriptions of temperature-growth rate relationship
‘mechanistic model’
square root model (“empirical”)
√rate = b x (T-Tmin) x (1-e(c x (T-Tmax)))
0.0
0.2
0.4
0.6
0.8
1.0
1.2
1.4
1.6
1.8
2.0
0.0000
0.0003
0.0005
0.0008
0.0010
0.0013
0.0015
0.0018
0.0020
0.0023
0.0025
250 260 270 280 290 300 310 320 330
grow
th ra
te
Temperature (°C)

Predictive Microbiology models
systematically make/collate lots of observations summarise the data as mathematical equations convert into computer software, spreadsheets users enter data/numbers in, get answers out

‘Nomenclature’ of models
Primary model describes the response of microbial numbers over
time (e.g., inactivation curve, growth curve, etc.) Secondary model
describes how outputs of the primary model (death rate, growth rate, combined limits to growth) are affected by environmental conditions (i.e., quantifies microbial ecology)
Tertiary model makes the knowledge and data contained in the
primary and secondary models available for prediction via an accessible software interface (software program, web-site, ‘app’)


Applications of Predictive Microbiology proactive
product or process design
reactive recognising, averting or minimising a problem managing consequences of loss of control

Pro-active Predictive Microbiology
using knowledge of microbial ecology in models we can design products to extend their shelf life find minimal conditions (better product quality)
to achieve required shelf life design shelf-stable products
e.g., processed cheese spread

Re-active Predictive Microbiology
using knowledge of microbial ecology and models how much growth has already occurred? how much loss of shelf life has occurred? or how long will it take for the initial levels of SSOs to
grow to the spoilage level, if we know: product characteristics (pH, aw, etc) storage conditions (temperature, atmosphere) characteristics (growth rate, limits) of the SSO

Data and Models
data (observations) knowledge (mathematical) databases models software/interfaces predictions by precedent by (objective) interpolation or analogy (extrapolation?)
analysis, synthesis
hypothesis; theory

Choosing a Model/Assessing its Reliability
Model applicability Does the model describe the right organism? Are
there strain differences? Is the model relevant to the food – does it include all
influential factors? Model reliability
Does the model accurately describe the biological phenomena?
Various measures of reliability Two aspects – goodness of fit, systematic lack of fit e.g., Bias and accuracy factors; bias and precision
factors; t-test and F-test; etc.

Model without terms for effect on growth rate of common organic acids
Model with terms for effect on growth rate of common organic acids
Variability
Variability between strains experimental (e.g., variations within food matrix,
sampling error) models should detail ‘confidence intervals’ on
predictions, or ‘error term’


Thank you…
and over to Peter 😊😊

Utilization of Tertiary Models for Estimation of Microbial Behavior in Meat-Containing Products Dr. Peter Taormina
Tertiary Microbial Models

Reasons for Using Predictive Models Hazard Analysis
Assessing microbiological risks Process Preventive Control Limits
Times, Temperatures Product Development
Formulation (e.g., pH, aw, preservatives) Shelf Life
Preliminary Assessment of Process Deviation Cooking, cooling deviations

Types of Tertiary Models
Bacterial Transfer Surface/Product/Human
Survival Shelf Life
Growth Boundary Rate
Inactivation

Available Predictive Tools Baseline Software Tool Bioinactivation SE ComBase Predictor Dairy products safety predictor DMRI – predictive models for meat E. coli Inactivation in Fermented
Meats Model EcSF – E. coli SafeFerment FDA-iRISK® Food Spoilage and Safety Predictor
(FSSP) FISHMAP GroPIN Listeria Control Model 2012 Listeria Meat Model
Microbial Responses Viewer (MRV) MicroHibro: Predictive Models MLA Refrigeration Index Calculator PMM-Lab Process lethality determination
spreadsheet Perfringens Predictor Praedicere Salmonella predictions Shelf Stability Predictor SWEETSHELF Sym’Previus Therm 2.0

Some Examples of Tertiary Models
Pathogen Modeling Program
https://pmp.errc.ars.usda.gov
Combase
https://www.combase.cc
http://dmripredict.dk

Pathogen Modeling Program 7.0

Corbion® Listeria Control Model

Spoilage Model

Australia’s Food Safety Information Portal


Marinated Chicken Breast
Cooked Chicken Cooling

Cooked Chicken Cooling – Marinated, Cooked Chicken Breast
Chicken breasts are vacuum tumbled in a marinade containing phosphates, sea salt, seasonings, and potassium lactate.
Marinated chicken breasts are cooked through continuous impingement oven, then cooled on racks.
pH 6.8, aw 0.987, 1.7% salt Temperature probes:
5 hours from 130 to 60ºF (54.4 to 15.6ºC)

Which Model?

Pathogen Modeling Program (PMP) Online

Pathogen Modeling Program (PMP) Online
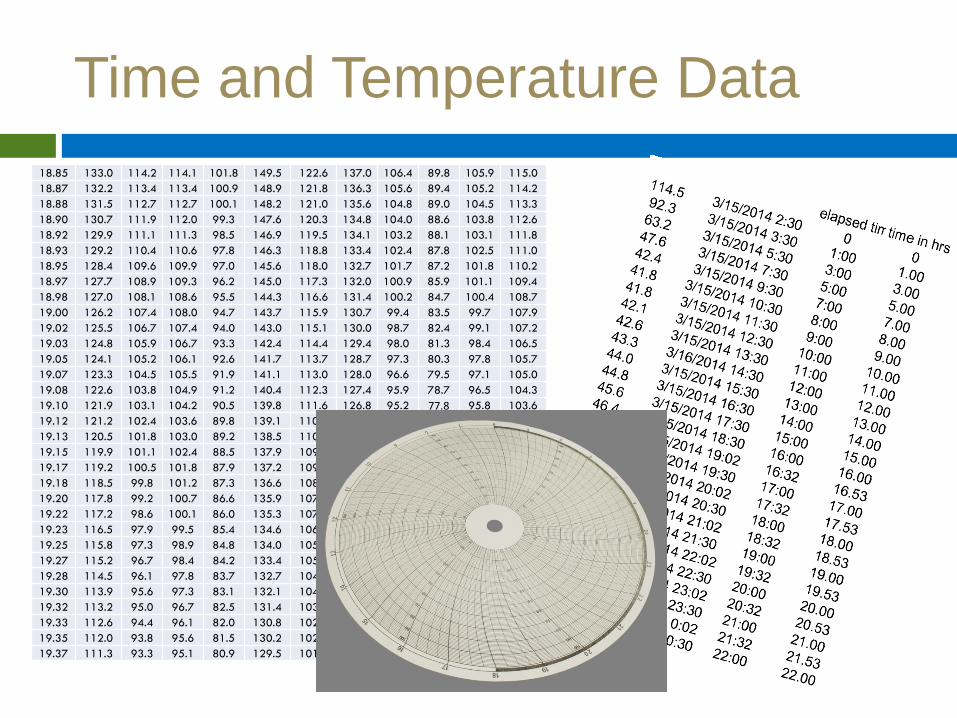
Time and Temperature Data 18.85 133.0 114.2 114.1 101.8 149.5 122.6 137.0 106.4 89.8 105.9 115.0 18.87 132.2 113.4 113.4 100.9 148.9 121.8 136.3 105.6 89.4 105.2 114.2 18.88 131.5 112.7 112.7 100.1 148.2 121.0 135.6 104.8 89.0 104.5 113.3 18.90 130.7 111.9 112.0 99.3 147.6 120.3 134.8 104.0 88.6 103.8 112.6 18.92 129.9 111.1 111.3 98.5 146.9 119.5 134.1 103.2 88.1 103.1 111.8 18.93 129.2 110.4 110.6 97.8 146.3 118.8 133.4 102.4 87.8 102.5 111.0 18.95 128.4 109.6 109.9 97.0 145.6 118.0 132.7 101.7 87.2 101.8 110.2 18.97 127.7 108.9 109.3 96.2 145.0 117.3 132.0 100.9 85.9 101.1 109.4 18.98 127.0 108.1 108.6 95.5 144.3 116.6 131.4 100.2 84.7 100.4 108.7 19.00 126.2 107.4 108.0 94.7 143.7 115.9 130.7 99.4 83.5 99.7 107.9 19.02 125.5 106.7 107.4 94.0 143.0 115.1 130.0 98.7 82.4 99.1 107.2 19.03 124.8 105.9 106.7 93.3 142.4 114.4 129.4 98.0 81.3 98.4 106.5 19.05 124.1 105.2 106.1 92.6 141.7 113.7 128.7 97.3 80.3 97.8 105.7 19.07 123.3 104.5 105.5 91.9 141.1 113.0 128.0 96.6 79.5 97.1 105.0 19.08 122.6 103.8 104.9 91.2 140.4 112.3 127.4 95.9 78.7 96.5 104.3 19.10 121.9 103.1 104.2 90.5 139.8 111.6 126.8 95.2 77.8 95.8 103.6 19.12 121.2 102.4 103.6 89.8 139.1 110.9 126.1 94.5 76.8 95.1 102.9 19.13 120.5 101.8 103.0 89.2 138.5 110.3 125.5 93.8 75.8 94.5 102.2 19.15 119.9 101.1 102.4 88.5 137.9 109.6 124.9 93.1 74.9 93.9 101.6 19.17 119.2 100.5 101.8 87.9 137.2 109.0 124.2 92.5 74.1 93.2 100.9 19.18 118.5 99.8 101.2 87.3 136.6 108.3 123.6 91.8 73.4 92.6 100.3 19.20 117.8 99.2 100.7 86.6 135.9 107.7 123.0 91.2 72.8 91.9 99.6 19.22 117.2 98.6 100.1 86.0 135.3 107.0 122.4 90.5 72.3 91.3 99.0 19.23 116.5 97.9 99.5 85.4 134.6 106.4 121.8 89.9 71.8 90.7 98.3 19.25 115.8 97.3 98.9 84.8 134.0 105.8 121.2 89.3 71.5 90.1 97.7 19.27 115.2 96.7 98.4 84.2 133.4 105.2 120.6 88.7 71.1 89.5 97.1 19.28 114.5 96.1 97.8 83.7 132.7 104.6 120.0 88.0 70.8 88.9 96.5 19.30 113.9 95.6 97.3 83.1 132.1 104.0 119.4 87.4 70.8 88.3 95.9 19.32 113.2 95.0 96.7 82.5 131.4 103.4 118.8 86.8 70.9 87.7 95.3 19.33 112.6 94.4 96.1 82.0 130.8 102.9 118.2 86.2 70.8 87.1 94.8 19.35 112.0 93.8 95.6 81.5 130.2 102.3 117.7 85.7 70.7 86.6 94.2 19.37 111.3 93.3 95.1 80.9 129.5 101.7 117.1 85.1 70.5 86.1 93.6

Pathogen Modeling Program (PMP) Online

Prepare Time/Temp Data
Download or Manual Entry
Select data range or points Convert units
Save as .CSV file (optional)
Adjust for temperatures outside of model range

PMP Online – Marinated, Cooked Chicken Breast Example

PMP Online – Marinated, Cooked Chicken Breast Example 3.18-Log Increase (2.57 to 3.80 99% CL) Source: Juneja V.K., Marks H., Huang L., and
Thippareddi H. Predictive model for growth of Clostridium perfringens during cooling of cooked uncured meat and poultry. Food Microbiology 28 (2011). P. 791-795. What about pH, aw, % salt?


Combase – Perfringens Predictor

1.3-Log Increase
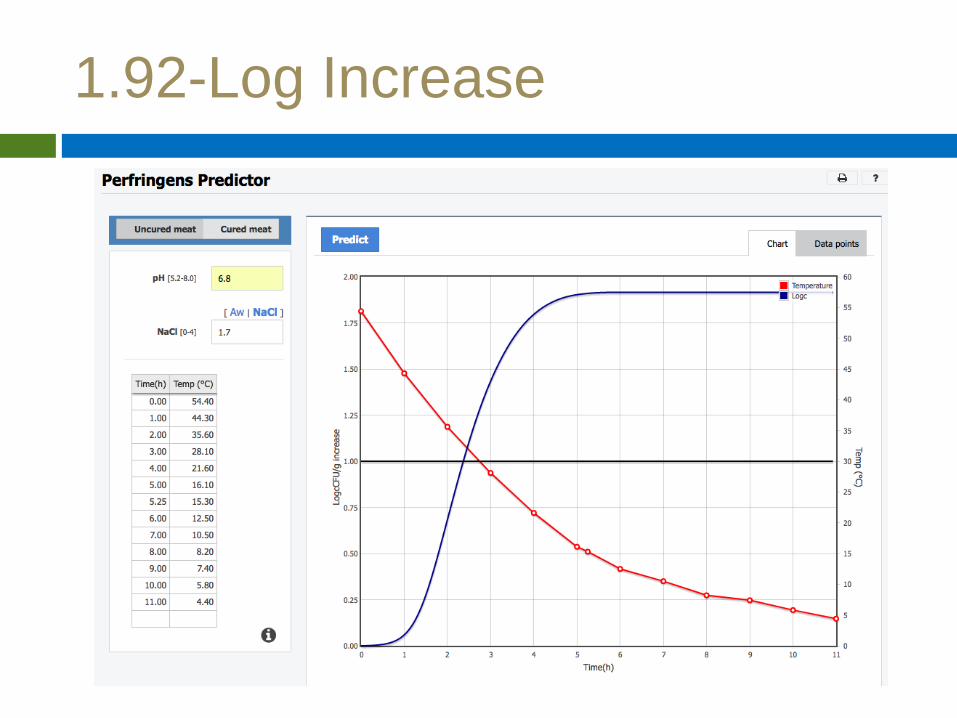
1.92-Log Increase

Cooked Chicken Cooling – Marinated, Cooked Chicken Breast
Chicken breasts are vacuum tumbled in a marinade containing phosphates, sea salt, seasonings, and potassium lactate.
Marinated chicken breasts are cooked through continuous impingement oven, then cooled on racks.
pH 6.8, aw 0.987, 1.7% salt Temperature probes:
5.5 hours from 130 to 60ºF (54.4 to 15.6ºC)


Compare pH, aw, percent lactate in published study with your product.
Kennedy et al., 2013

Gumbo with Rice
Prepared Meal Cooling Example

Prepared Meal Cooling - Gumbo
Gumbo ingredients: Cooked rice, Andouille sausage, vegetables, shrimp, seasonings
Rice is cooked in a commercial rice cooker. Meat, shrimp, and vegetables are cooked separately in a kettle.
Rice is dispensed into plastic trays, and Gumbo mixture is ladled onto rice. Trays are sealed, placed on racks and wheeled into walk-in freezer.
Reaches 41ºF (5ºC) in 6 h.

Prepared Meal Cooling - Gumbo
Oops! Temperature
Deviation
Image source: Bing search – “free to share and use” https://hongkongphooey.wordpress.com/2009/02/

Combase Predictor – Growth Model

Gumbo Example - Combase
Gumbo Example – Combase 0.92-Log Increase Bacillus cereus

Gumbo Example – Combase

Growth of non-proteolytic C. botulinum at 5ºC within about 40 days

Gumbo Example – Combase Shelf Life?

Gumbo Example – Combase Shelf Life?

Growth of non-proteolytic C. botulinum within about 14 days


Summary
Various Tertiary Models Exist Some of which were demonstrated in this webinar
Select Model Based Upon Your Unique Situation and Parameters
Be Careful with Assumptions and Interpretation Read and follow guidelines and disclaimers
Validate and Verify


QUESTIONS & ANSWERS
Dr. Betsy Booren
Dr. Tom Ross Dr. Peter Taormina

Acknowledgements
Organizing Committee
IAFP
Dr. Yuhuan Chen Dr. Marcel Zwietering Dr. Bala Kottapalli
David Tharp Sarah Dempsey Tamara Ford

Future Sessions
Part II – Poultry Winter 2018
Part III – Risk Modeling Spring 2018
Practical Applications of Microbial Modeling Webinar Series


