25
Practical Data Analysis and Reporting with BIRT John Ward Chapter No. 3 "The BIRT Environment and Your First Report"
| Date post: | 11-Nov-2018 |
| Category: |
Documents |
| Upload: | nguyenkhanh |
| View: | 218 times |
| Download: | 0 times |
Practical Data Analysis and Reporting with BIRT
John Ward
Chapter No. 3 "The BIRT Environment and
Your First Report"
For More Information: www.packtpub.com/practical-data-analysis-reporting-with-birt/book
In this package, you will find: A Biography of the author of the book
A preview chapter from the book, Chapter NO.3 "The BIRT Environment and Your First Report"
A synopsis of the book’s content
Information on where to buy this book
About the Author John Ward is a consultant for Innovent Solutions, specializing in BIRT and e-commerce search and navigation solutions. Prior to that, John was an Assistant Vice President for Citibank, North America, managing the training MIS group and overseeing development of new technology-based training initiatives. John actively works with and tests BIRT—an open-source reporting platform built on Eclipse—including development work based on BIRT reports and the BIRT APIs.
John also maintains The Digital Voice blog at http://digiassn.blogspot.com. I'd like to thank my wife Claudia for her love, support, and patience throughout the writing of this book, my Grandfather and Father for their wisdom and advice, and my Mother for her encouragement and support.
Rich and Bamm, thanks for giving me the most tedious task in the department. Without it, this book wouldn't have been possible.
And Scott, thanks for talks about BIRT and help with presentations, which provided a good foundation to start with.
For More Information: www.packtpub.com/practical-data-analysis-reporting-with-birt/book
Practical Data Analysis and Reporting with BIRT BIRT, which stands for Business Intelligence and Reporting Tools, is an Eclipse-based open-source reporting system for Java and J2EE-based web applications. Including the word "Tools" in the acronym is appropriate, since BIRT is in fact a collection of development tools and technologies used for developing reports utilizing the BIRT runtime framework component on your application server. BIRT isn't essentially a product, but a series of core technologies on top of which products and solutions are built, similar in fashion to the Eclipse framework.
This book has a fast-paced, task-driven, tutorial style, which provides understanding and structure, not just lists of steps to follow. The focus is on the most visible and familiar product built with the BIRT framework, which is the BIRT Report Designer. The BIRT Report Designer is an Eclipse plug-in that utilizes BIRT technologies to allow users to design reports in the BIRT document format. Also covered is the BIRT Charting engine, which lets you add Charts to your application.
What This Book Covers Chapter 1 introduces readers to the concepts of business intelligence and open-source software.
Chapter 2 discusses the different installation methods for BIRT, and the list of requirements needed to work with BIRT.
Chapter 3 provides an example of the creation of a simple report using the components of BIRT, such as the Navigator, the Outline, and the Property Editor.
Chapter 4 describes the various visual report elements that can be used to design BIRT reports, such as the Palette and Grid components.
Chapter 5 details the data components of BIRT (the Data Source and the Data Set), different types of data that BIRT supports such as XML files, fl at text files, and databases, and the creation of all of the elements while connecting to Data Sources in reports and Report Projects.
Chapter 6 describes the Report Parameters and Data Set Parameters with their use in designing BIRT reports.

For More Information: www.packtpub.com/practical-data-analysis-reporting-with-birt/book
In Chapter 7 readers are provided with the information related to Report projects, and made familiar with creating a shared development environment using Libraries.
Chapter 8 covers the creation of Styles and Themes to give a consistent appearance to a Reporting Project. It also describes the use of Templates in Report Designs.
Chapter 9 describes the role of Charts, Hyperlinks, and Drill-Downs to enhance the presentation of a report.
Chapter 10 covers some of the Scripting capabilities that BIRT has to offer with Expressions and Event Handlers.
Chapter 11 describes the process of deploying BIRT reports.
Chapter 12 shows a practical example of building reports for Bugzilla.
For More Information: www.packtpub.com/practical-data-analysis-reporting-with-birt/book
The BIRT Environment and Your First Report
OK, so now you have BIRT installed; what now? You have heard so many great things about the BIRT Report Designer, and are eager to jump into creating some reports. However, you haven't ever worked with Eclipse or BIRT for that matter. At fi rst glance the BIRT Designer can look a little intimidating, and in some cases you may not even see the BIRT Designer on your fi rst run. That's OK. In this chapter we will get acquainted with the BIRT working environment, also known as the BIRT Perspective in Eclipse lingo, and we will get started on creating a basic report.
A Basic ScenarioWhen I teach people about development topics of any sort, I like to use scenarios. This book will be no different. These scenarios provide a basic context for the learner to relate the topic information to, and hopefully facilitate absorbing the information.
In this chapter we will look at a very simple scenario, in order to get us started with our fi rst report. You work for a toy company called Classic Cars. Classic Cars specializes in selling models of classic cars and motorcycles. Classic Cars uses a centralized database for all company operations, such as employee listing, offi ces, customers, products, and sales history. This information is in a relational database that is stored locally on your machine, as Classic Cars is a small company.
Through this chapter, I will walk you through creating your fi rst report, which will be a list of all employees who work for the company. I choose this for a number of reasons. First, it is a fairly simple database query to build and understand. If you are not familiar with the SQL language—don't worry—I will provide the queries that you will use. However, I highly recommend getting some basic familiarity with database concepts, and SQL in particular.

For More Information: www.packtpub.com/practical-data-analysis-reporting-with-birt/book
The BIRT Environment and Your First Report
[ 34 ]
In walking through this report, I will introduce you to the BIRT working environment, and show you where to get access to the various portions of the BIRT Designer. Finally, I will show you where you can go through another guided tutorial, accessible from right within the BIRT environment. You might as well have access to all available resources for further learning.
The BIRT Perspective So we are ready to begin. We have defi ned a clear objective for our basic report, and now is the time to jump into the basic concepts of the BIRT Environment.
Once you start BIRT/Eclipse the fi rst time, you will be asked to select a location for a Workspace.
A Workspace is a location where projects get stored. This is very useful for Java developers, who may want to re-use projects; however for a report developer, a single Workspace should suffi ce. In our case, we will set our Workspace to C:\eclipse\birt_book_workspace.
If you're running the BIRT All-in-One package, you will start up in the default Eclipse screen and will need to change to the BIRT report perspective. Eclipse uses different perspectives as interfaces for different functionality and tools for particular tasks. For instance, if you are writing a Java program, you would use one of the several Java perspectives available, which would allow you access to outlines, class views, and other tabs. If you are debugging a program, you would use the debug perspective, it gives you access to a tab with variables, tools bars for controlling the fl ow of programs, breakpoints, and other debugging functions.
For More Information: www.packtpub.com/practical-data-analysis-reporting-with-birt/book
Chapter 3
[ 35 ]
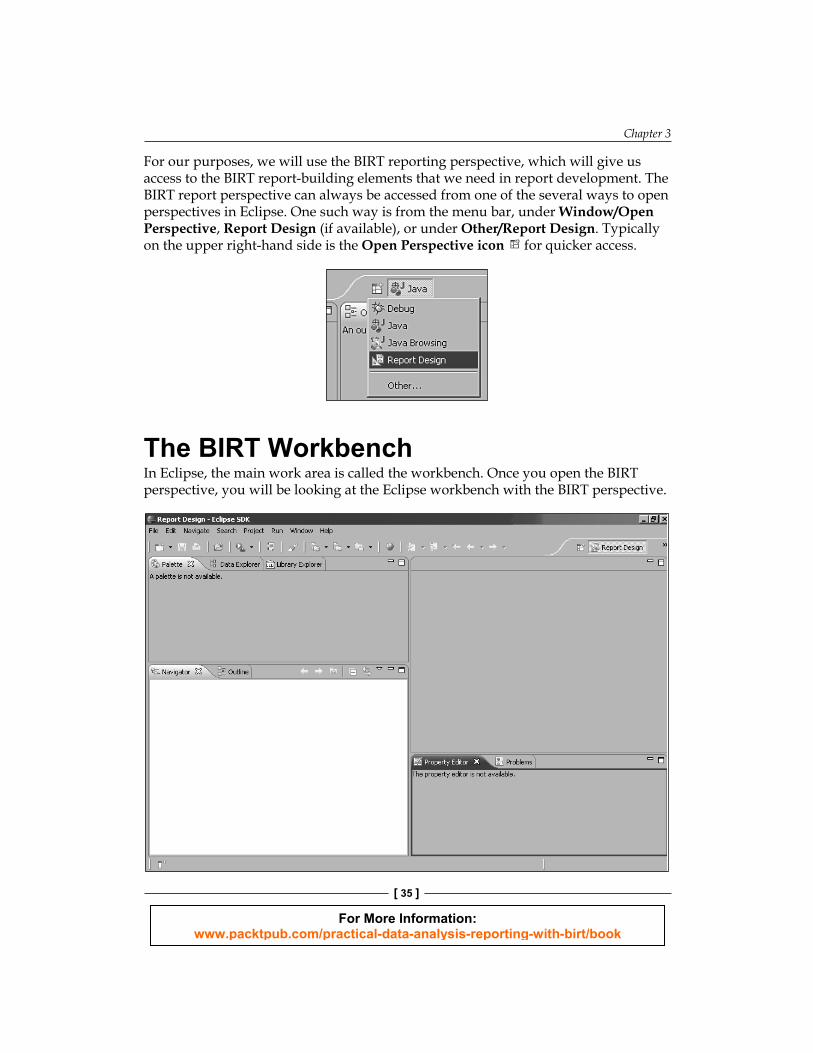
F or our purposes, we will use the BIRT reporting perspective, which will give us access to the BIRT report-building elements that we need in report development. The BIRT report perspective can always be accessed from one of the several ways to open perspectives in Eclipse. One such way is from the menu bar, under Window/Open Perspective, Report Design (if available), or under Other/Report Design. Typically on the upper right-hand side is the Open Perspective icon for quicker access.
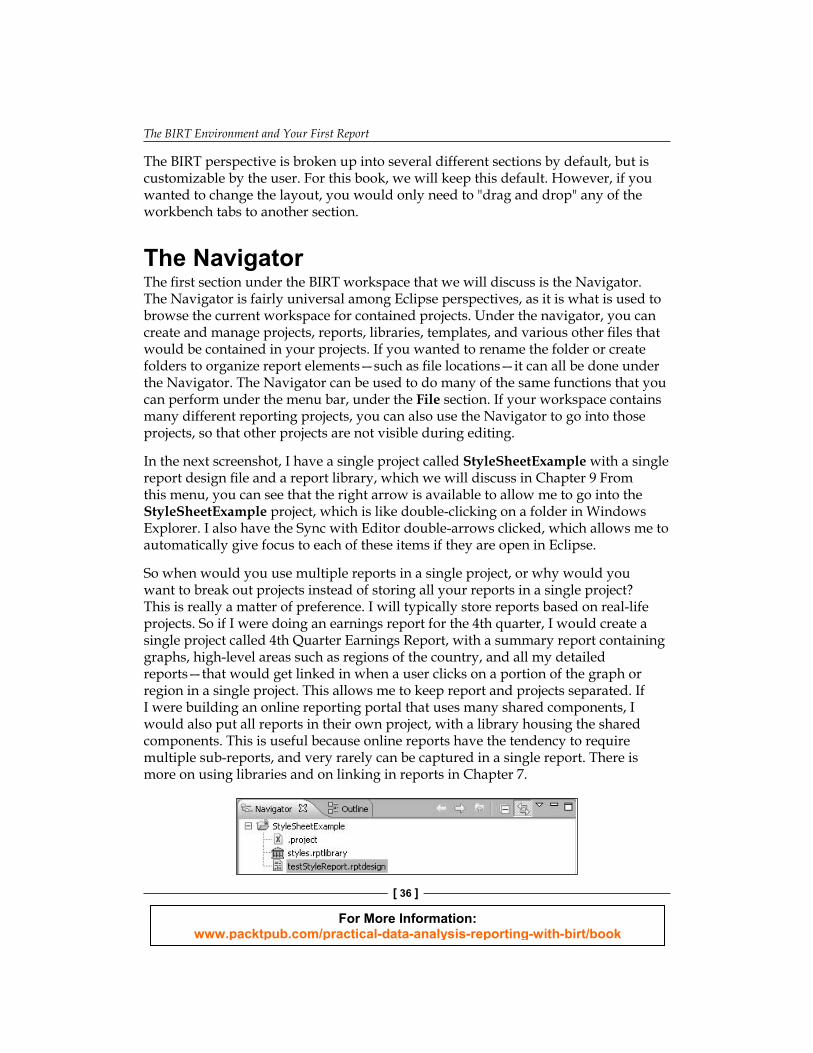
The BIRT WorkbenchIn Eclipse, the main work area is called the workbench. Once you open the BIRT perspective, you will be looking at the Eclipse workbench with the BIRT perspective.
For More Information: www.packtpub.com/practical-data-analysis-reporting-with-birt/book
The BIRT Environment and Your First Report
[ 36 ]
The BIRT perspective is broken up into several different sections by default, but is customizable by the user. For this book, we will keep this default. However, if you wanted to change the layout, you would only need to "drag and drop" any of the workbench tabs to another section.
The NavigatorThe fi rst section under the BIRT workspace that we will discuss is the Navigator. The Navigator is fairly universal among Eclipse perspectives, as it is what is used to browse the current workspace for contained projects. Under the navigator, you can create and manage projects, reports, libraries, templates, and various other fi les that would be contained in your projects. If you wanted to rename the folder or create folders to organize report elements—such as fi le locations—it can all be done under the Navigator. The Navigator can be used to do many of the same functions that you can perform under the menu bar, under the File section. If your workspace contains many different reporting projects, you can also use the Navigator to go into those projects, so that other projects are not visible during editing.
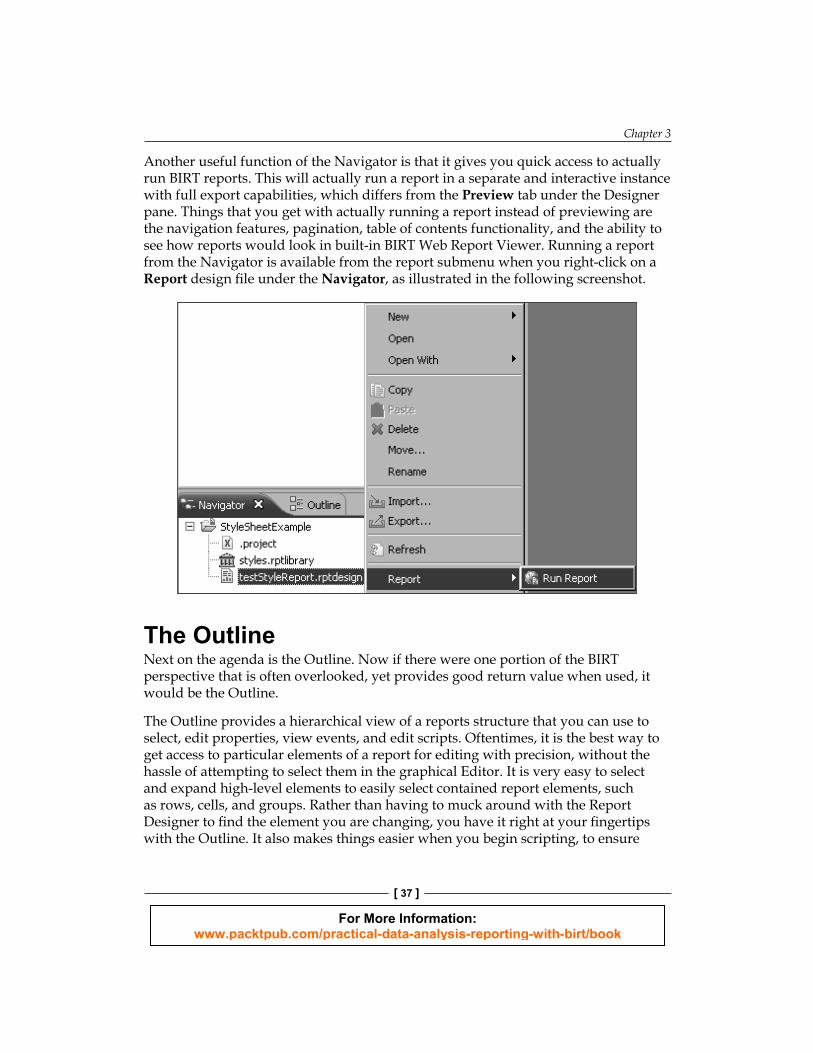
In t he next screenshot, I have a single project called StyleSheetExample with a single report design fi le and a report library, which we will discuss in Chapter 9 From this menu, you can see that the right arrow is available to allow me to go into the StyleSheetExample project, which is like double-clicking on a folder in Windows Explorer. I also have the Sync with Editor double-arrows clicked, which allows me to automatically give focus to each of these items if they are open in Eclipse.
So w hen would you use multiple reports in a single project, or why would you want to break out projects instead of storing all your reports in a single project? This is really a matter of preference. I will typically store reports based on real-life projects. So if I were doing an earnings report for the 4th quarter, I would create a single project called 4th Quarter Earnings Report, with a summary report containing graphs, high-level areas such as regions of the country, and all my detailed reports—that would get linked in when a user clicks on a portion of the graph or region in a single project. This allows me to keep report and projects separated. If I were building an online reporting portal that uses many shared components, I would also put all reports in their own project, with a library housing the shared components. This is useful because online reports have the tendency to require multiple sub-reports, and very rarely can be captured in a single report. There is more on using libraries and on linking in reports in Chapter 7.
For More Information: www.packtpub.com/practical-data-analysis-reporting-with-birt/book
Chapter 3
[ 37 ]
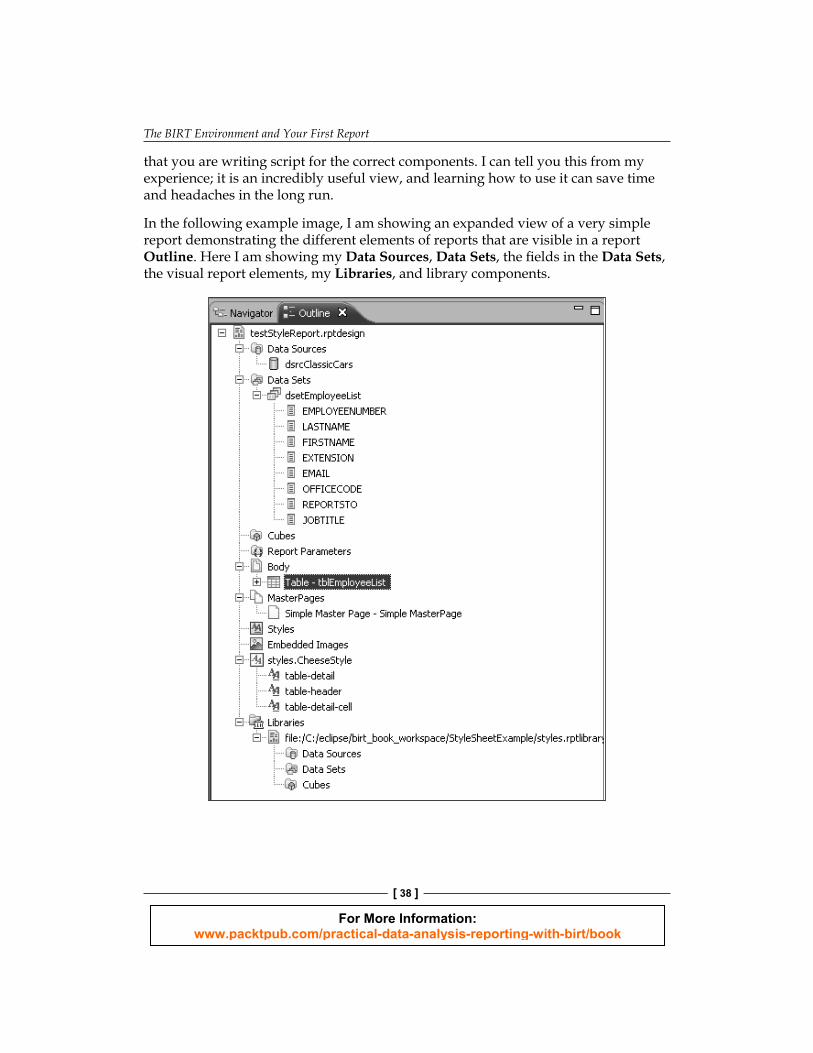
Anoth er useful function of the Navigator is that it gives you quick access to actually run BIRT reports. This will actually run a report in a separate and interactive instance with full export capabilities, which differs from the Preview tab under the Designer pane. Things that you get with actually running a report instead of previewing are the navigation features, pagination, table of contents functionality, and the ability to see how reports would look in built-in BIRT Web Report Viewer. Running a report from the Navigator is available from the report submenu when you right-click on a Report design fi le under the Navigator, as illustrated in the following screenshot.
The OutlineNext o n the agenda is the Outline. Now if there were one portion of the BIRT perspective that is often overlooked, yet provides good return value when used, it would be the Outline.
The Outline provides a hierarchical view of a reports structure that you can use to select, edit properties, view events, and edit scripts. Oftentimes, it is the best way to get access to particular elements of a report for editing with precision, without the hassle of attempting to select them in the graphical Editor. It is very easy to select and expand high-level elements to easily select contained report elements, such as rows, cells, and groups. Rather than having to muck around with the Report Designer to fi nd the element you are changing, you have it right at your fi ngertips with the Outline. It also makes things easier when you begin scripting, to ensure
For More Information: www.packtpub.com/practical-data-analysis-reporting-with-birt/book
The BIRT Environment and Your First Report
[ 38 ]
that you are writing script for the correct components. I can tell you this from my experience; it is an incredibly useful view, and learning how to use it can save time and headaches in the long run.
In the following example image, I am showing an expanded view of a very simple report demonstrating the different elements of reports that are visible in a report Outline. Here I am showing my Data Sources, Data Sets, the fi elds in the Data Sets, the visual report elements, my Libraries, and library components.
For More Information: www.packtpub.com/practical-data-analysis-reporting-with-birt/book
Chapter 3
[ 39 ]
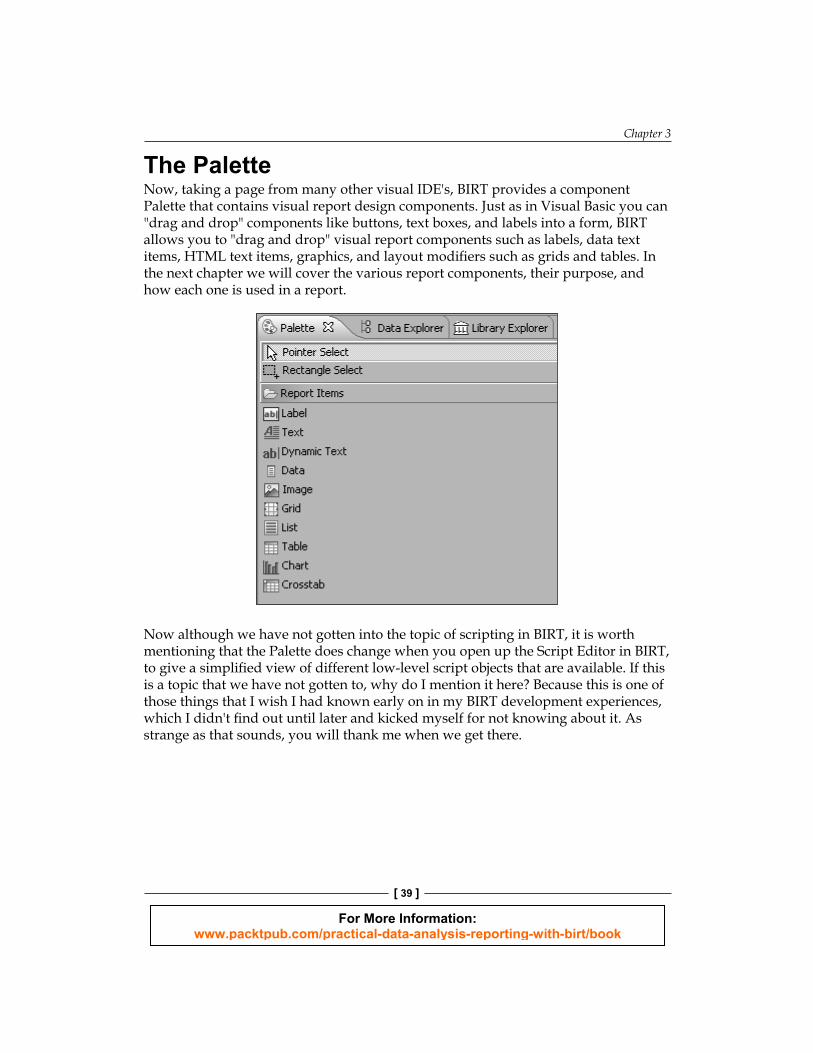
The PaletteNow, ta king a page from many other visual IDE's, BIRT provides a component Palette that contains visual report design components. Just as in Visual Basic you can "drag and drop" components like buttons, text boxes, and labels into a form, BIRT allows you to "drag and drop" visual report components such as labels, data text items, HTML text items, graphics, and layout modifi ers such as grids and tables. In the next chapter we will cover the various report components, their purpose, and how each one is used in a report.
Now although we have not gotten into the topic of scripting in BIRT, it is worth mentioning that the Palette does change when you open up the Script Editor in BIRT, to give a simplifi ed view of different low-level script objects that are available. If this is a topic that we have not gotten to, why do I mention it here? Because this is one of those things that I wish I had known early on in my BIRT development experiences, which I didn't fi nd out until later and kicked myself for not knowing about it. As strange as that sounds, you will thank me when we get there.
For More Information: www.packtpub.com/practical-data-analysis-reporting-with-birt/book
The BIRT Environment and Your First Report
[ 40 ]
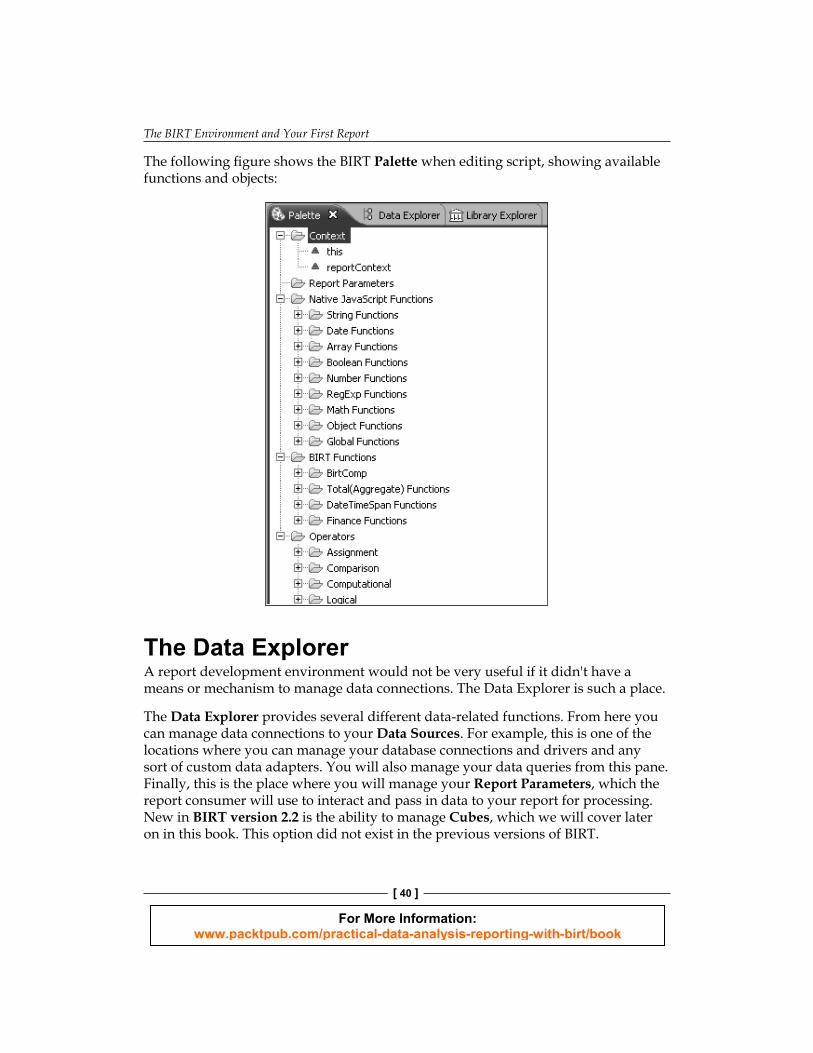
The following fi gure shows the BIRT Palette when editing script, showing available functions and objects:
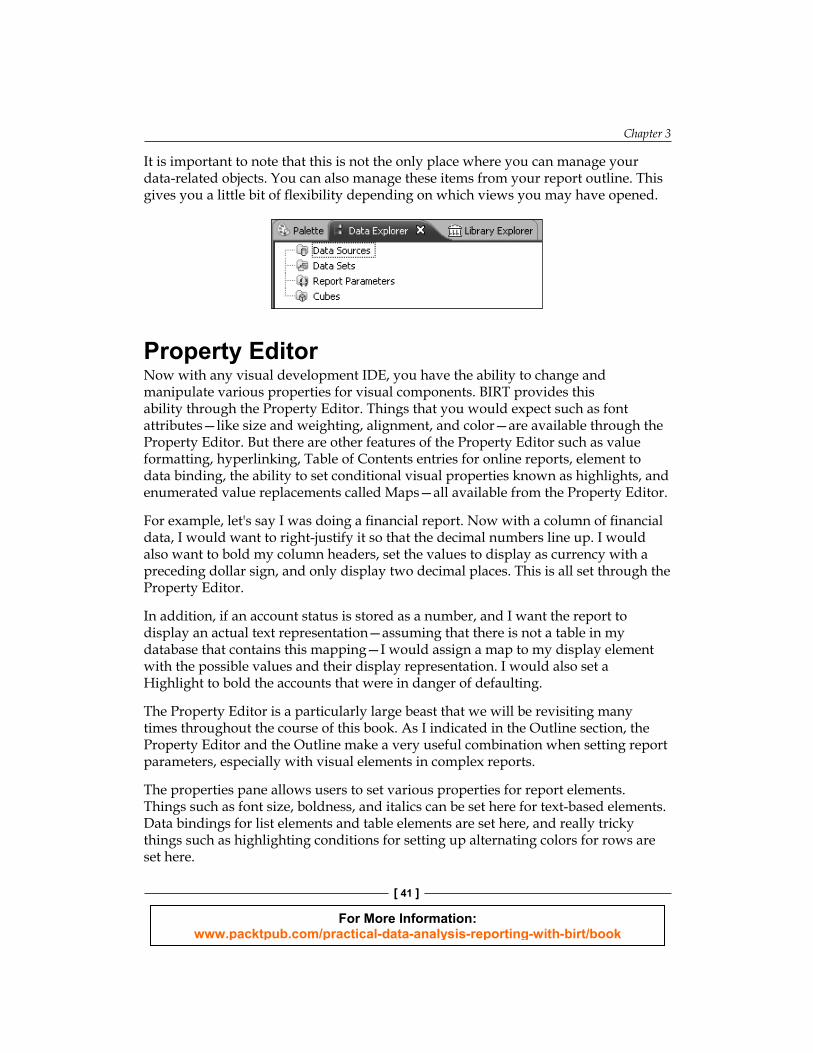
The Data ExplorerA report development environment would not be very useful if it didn't have a means or mechanism to manage data connections. The Data Explorer is such a place.
The Data Explorer provides several different data-related functions. From here you can manage data connections to your Data Sources. For examp le, this is one of the locations where you can manage your database connections and drivers and any sort of custom data adapters. You will also manage your data queries from this pane. Finally, this is the place where you will manage your Report Parameters, which th e report consumer will use to interact and pass in data to your report for processing. New in BIRT version 2.2 is the ability to manage Cubes, which w e will cover later on in this book. This option did not exist in the previous versions of BIRT.
For More Information: www.packtpub.com/practical-data-analysis-reporting-with-birt/book
Chapter 3
[ 41 ]
It is important to note that this is not the only place where you can manage your data-related objects. You can also manage these items from your report outline. This gives you a little bit of fl exibility depending on which views you may have opened.
Property EditorNow with a ny visual development IDE, you have the ability to change and manipulate various properties for visual components. BIRT provides this ability through the Property Editor. Things that you would expect such as font attributes—like size and weighting, alignment, and color—are available through the Property Editor. But there are other features of the Property Editor such as value formatting, hyperlinking, Table of Contents entries for online reports, element to data binding, the ability to set conditional visual properties known as highlights, and enumerated value replacements called Maps—all available from the Property Editor.
For example, let's say I was doing a fi nancial report. Now with a column of fi nancial data, I would want to right-justify it so that the decimal numbers line up. I would also want to bold my column headers, set the values to display as currency with a preceding dollar sign, and only display two decimal places. This is all set through the Property Editor.
In addition, if an account status is stored as a number, and I want the report to display an actual text representation—assuming that there is not a table in my database that contains this mapping—I would assign a map to my display element with the possible values and their display representation. I would also set a Highlight to bold the accounts that were in danger of defaulting.
The Property Editor is a particularly large beast that we will be revisiting many times throughout the course of this book. As I indicated in the Outline section, the Property Editor and the Outline make a very useful combination when setting report parameters, especially with visual elements in complex reports.
The properties pane allows users to set various properties for report elements. Things such as font size, boldness, and italics can be set here for text-based elements. Data bindings for list elements and table elements are set here, and really tricky things such as highlighting conditions for setting up alternating colors for rows are set here.
For More Information: www.packtpub.com/practical-data-analysis-reporting-with-birt/book
The BIRT Environment and Your First Report
[ 42 ]
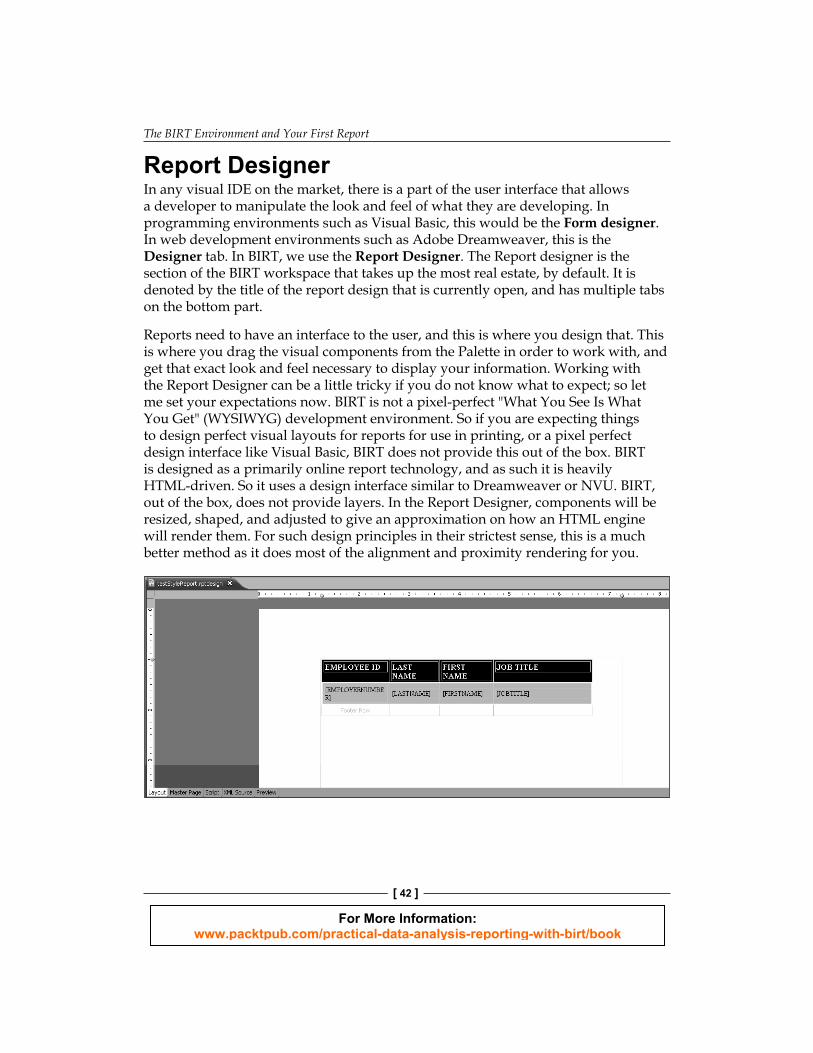
Report De signerIn any vis ual IDE on the market, there is a part of the user interface that allows a developer to manipulate the look and feel of what they are developing. In programming environments such as Visual Basic, this would be the Form designer. In web development environments such as Adobe Dreamweaver, this is the Designer tab. In BIRT, we use the Report Designer. The Report designer is the section of the BIRT workspace that takes up the most real estate, by default. It is denoted by the title of the report design that is currently open, and has multiple tabs on the bottom part.
Reports need to have an interface to the user, and this is where you design that. This is where you drag the visual components from the Palette in order to work with, and get that exact look and feel necessary to display your information. Working with the Report Designer can be a little tricky if you do not know what to expect; so let me set your expectations now. BIRT is not a pixel-perfect "What You See Is What You Get" (WYSIWYG) development environment. So if you are expecting things to design perfect visual layouts for reports for use in printing, or a pixel perfect design interface like Visual Basic, BIRT does not provide this out of the box. BIRT is designed as a primarily online report technology, and as such it is heavily HTML-driven. So it uses a design interface similar to Dreamweaver or NVU. BIRT, out of the box, does not provide layers. In the Report Designer, components will be resized, shaped, and adjusted to give an approximation on how an HTML engine will render them. For such design principles in their strictest sense, this is a much better method as it does most of the alignment and proximity rendering for you.
For More Information: www.packtpub.com/practical-data-analysis-reporting-with-birt/book
Chapter 3
[ 43 ]
The designer also has several other tabs associated with it. The Master Page tab will open a designer that allows users to design a constant header and footer layout that will remain persistent on multi-page reports. These would be separate from the table headers and rows used in the Layout Editor.
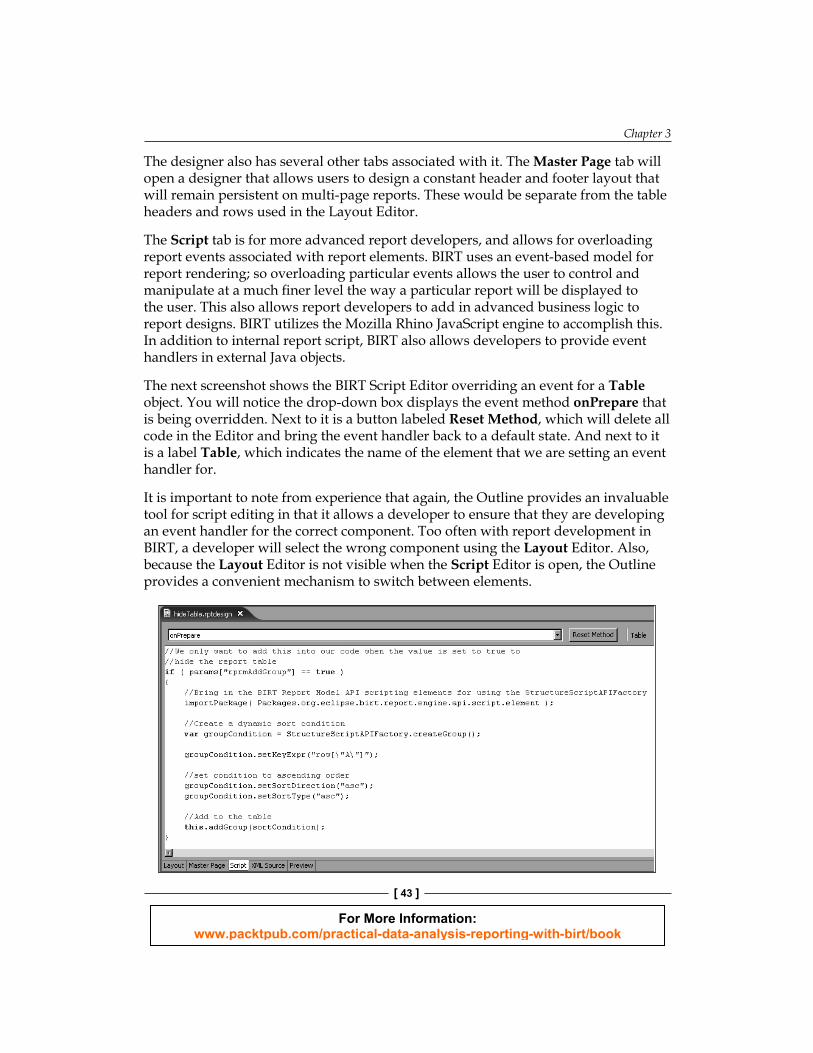
The Script tab is for more advanced report developers, and allows for overloading report events associated with report elements. BIRT uses an event-based model for report rendering; so overloading particular events allows the user to control and manipulate at a much fi ner level the way a particular report will be displayed to the user. This also allows report developers to add in advanced business logic to report designs. BIRT utilizes the Mozilla Rhino JavaScript engine to accomplish this. In addition to internal report script, BIRT also allows developers to provide event handlers in external Java objects.
The next screens hot shows the BIRT Script Editor overriding an event for a Table object. You will notice the drop-down box displays the event method onPrepare that is being overridden. Next to it is a button labeled Reset Method, which will delete all code in the Editor and bring the event handler back to a default state. And next to it is a label Table, which indicates the name of the element that we are setting an event handler for.
It is important to note from experience that again, the Outline provides an invaluable tool for script editing in that it allows a developer to ensure that they are developing an event handler for the correct component. Too often with report development in BIRT, a developer will select the wrong component using the Layout Editor. Also, because the Layout Editor is not visible when the Script Editor is open, the Outline provides a convenient mechanism to switch between elements.
For More Information: www.packtpub.com/practical-data-analysis-reporting-with-birt/book
The BIRT Environment and Your First Report
[ 44 ]
For those who are gluttons for punishment, you can view the actual XML Source for a report page. Personally I rarely ever use the XML Source viewer, except to copy report source code when helping individuals in the BIRT newsgroup.
Finally, the re is the report Preview tab. This is a convenient way to preview how a report will look, without having to have the application launch a separate window with the report viewer. This is different than actually running the report using either the Outline or the Run options under the File menu. For one, it does not provide pagination, so report previews will come out as one giant HTML page. There are no navigation options under the report preview either.
Setting up a Simple ProjectSo now that we are familiar with the different aspects of the BIRT Workspace, what now? What does it all mean? How does it all work together? And how do we use it? Well, that is what we are going to explore next as we build a very simple report. We will describe components more in detail in the next chapter; so for now just follow along and see how to navigate in the BIRT environment.
The fi rst thing we want to do when setting up our simple report project is to defi ne what the project is going to be, and what our fi rst simple report will be. Our fi rst report will be a simple dump of the employees who work for Classic Cars.
So, the fi rs t thing we need to do is set up a project. To do this, we will use the Navigator. Make sure you have the BIRT report perspective open, as described earlier. Use the following steps to create our project:
1. Open up the Navigator by single-clicking on the Navigator tab.2. Right-click anywhere in the white-space in the Navigator.3. Select New from the menu, and under New select project.
For More Information: www.packtpub.com/practical-data-analysis-reporting-with-birt/book
Chapter 3
[ 45 ]
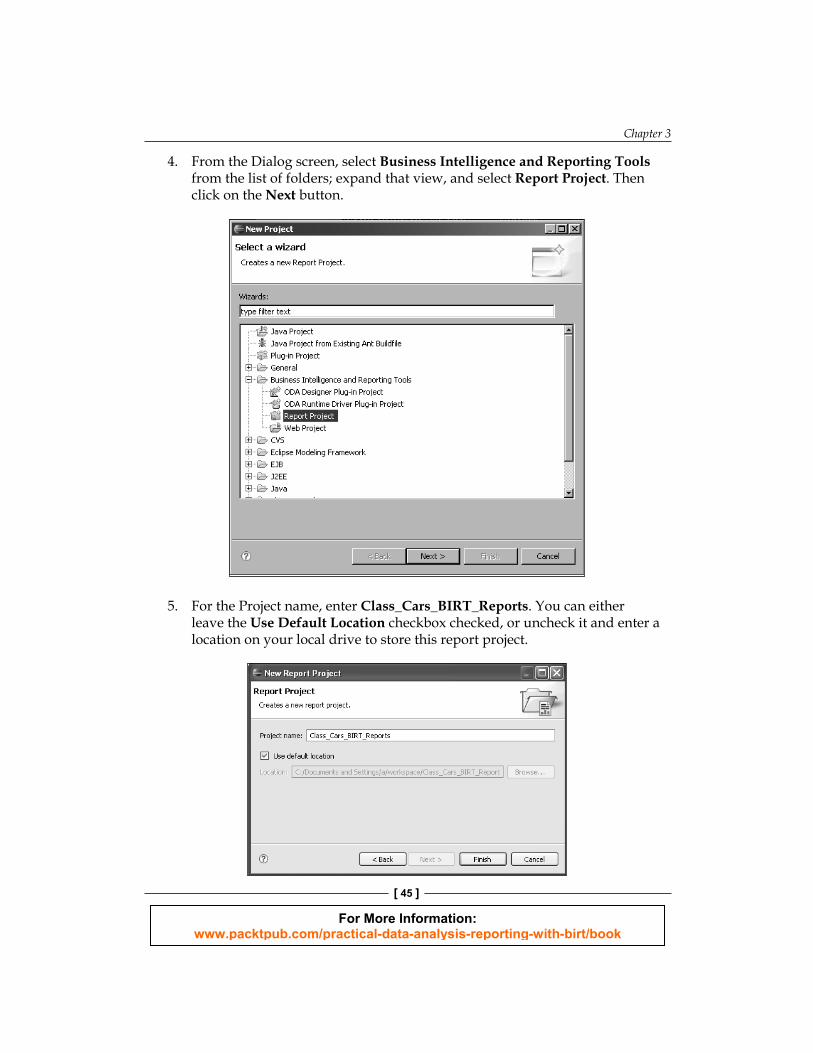
4. From the Dialog screen, select Business Intelligence and Reporting Tools from the list of folders; expand that view, and select Report Project. Then click on the Next button.
5. For the Project name, enter Class _Cars_BIRT_Reports. You can either leave the Use Default Location checkbox checked, or uncheck it and enter a location on your local drive to store this report project.
For More Information: www.packtpub.com/practical-data-analysis-reporting-with-birt/book
The BIRT Environment and Your First Report
[ 46 ]
Now, we have a very simple report project in which to store our BIRT reports that we will build in the fi rst few chapters of the book.
Creating a Simple ReportN ow that we have our fi rst project open, we will look at creating our fi rst report. As mentioned earlier, we will create a basic listing report that will display all the information in the employees table. In order to do this, we will use the following steps:
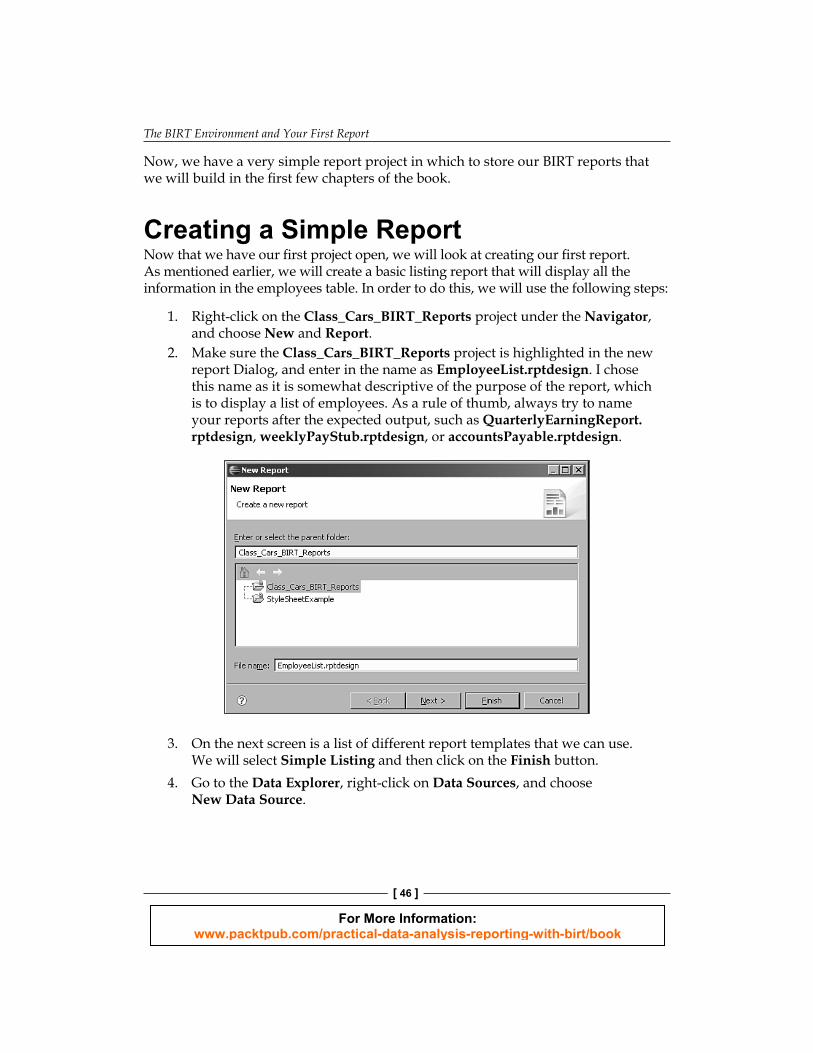
1. Right-click on the Class_Cars_BIRT_Reports project under the Navigator, and choose New and Report.
2. Make sure the Class_Cars_BIRT_Reports project is highlighted in the new report Dialog, and enter in the name as EmployeeList.rptdesign. I chose this name as it is somewhat descriptive of the purpose of the report, which is to display a list of employees. As a rule of thumb, always try to name your reports after the expected output, such as QuarterlyEarningReport.rptdesign, weeklyPayStub.rptdesign, or accountsPayable.rptdesign.
3. On the next screen is a list of different report templates that we can use. We will select Simple Listing and then click on the Finish button.
4. Go to the Data Explorer, right-click on Data Sources, and choose New Data Source.
For More Information: www.packtpub.com/practical-data-analysis-reporting-with-birt/book
Chapter 3
[ 47 ]
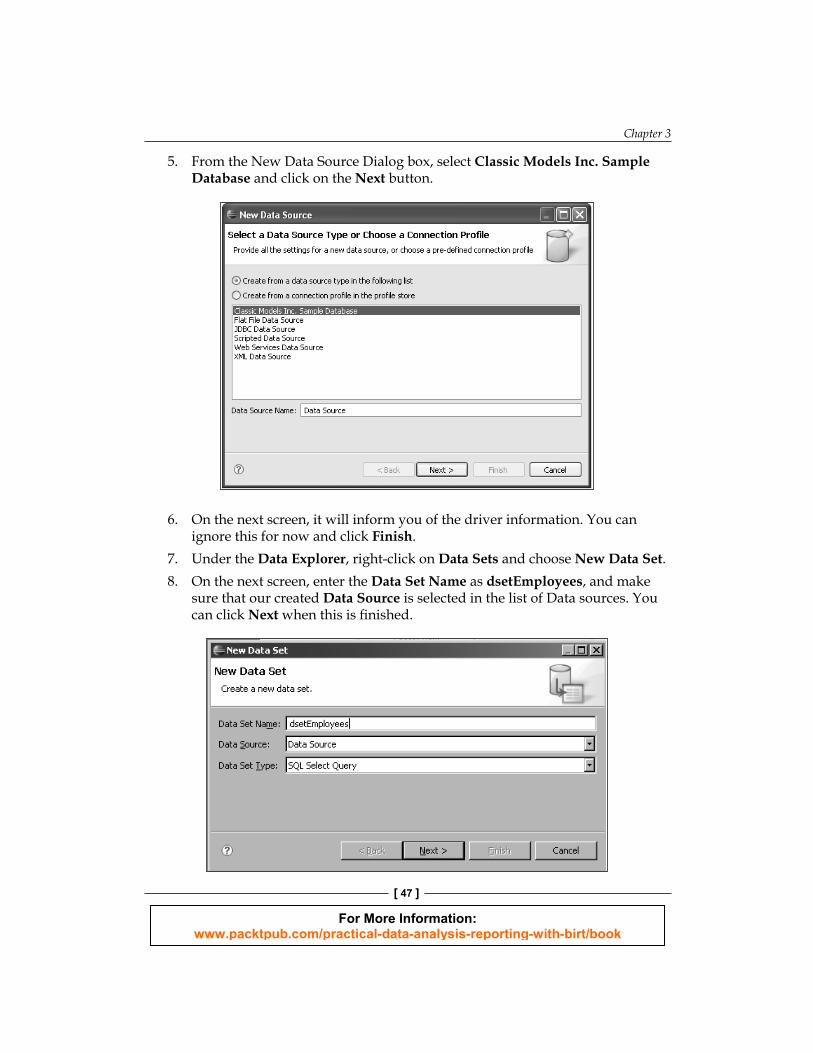
5. From the New Data Source Dialog box, select Classic Models Inc. Sample Database and click on the Next button.
6. On the next screen, it will inform you of the driver information. You can ignore this for now and click Finish.
7. Under the Data Explorer, right-click on Data Sets and choose New Data Set.8 . On the next screen, enter the Data Set Name as dsetEmployees, and make
sure that our created Data Source is selected in the list of Data sources. You can click Next when this is fi nished.
For More Information: www.packtpub.com/practical-data-analysis-reporting-with-birt/book
The BIRT Environment and Your First Report
[ 48 ]
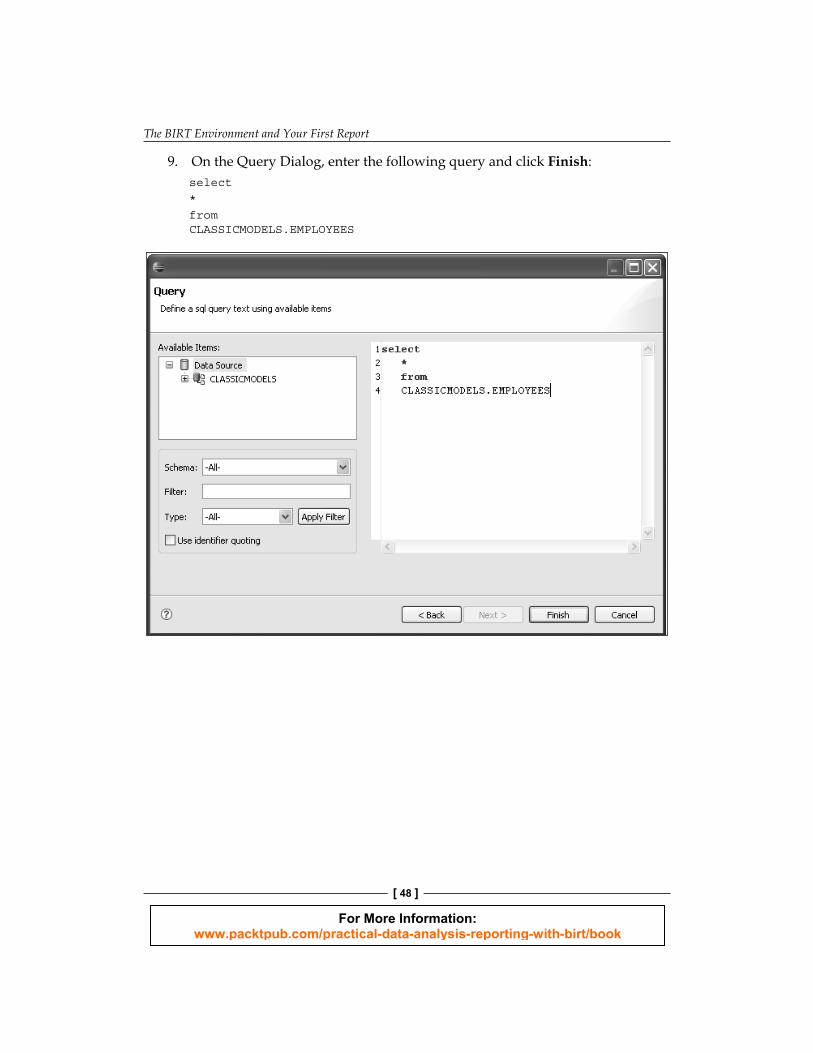
9. On the Query Dialog, enter the following query and click Finish: select * from CLASSICMODELS.EMPLOYEES
For More Information: www.packtpub.com/practical-data-analysis-reporting-with-birt/book
Chapter 3
[ 49 ]
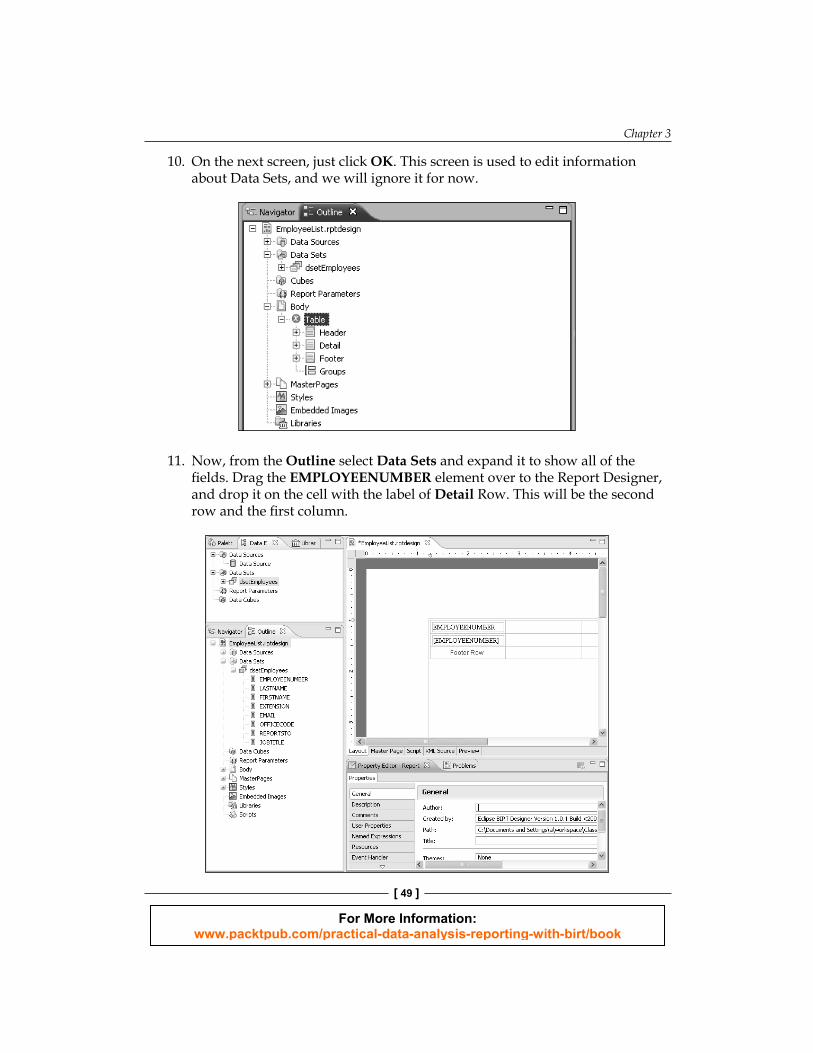
10. On th e next screen, just click OK. This screen is used to edit information about Data Sets, and we will ignore it for now.
11. Now, f rom the Outline select Data Sets and expand it to show all of the fi elds. Drag the EMPLOYEENUMBER element over to the Report Designer, and drop it on the cell with the label of Detail Row. This will be the second row and the fi rst column.
For More Information: www.packtpub.com/practical-data-analysis-reporting-with-birt/book
The BIRT Environment and Your First Report
[ 50 ]
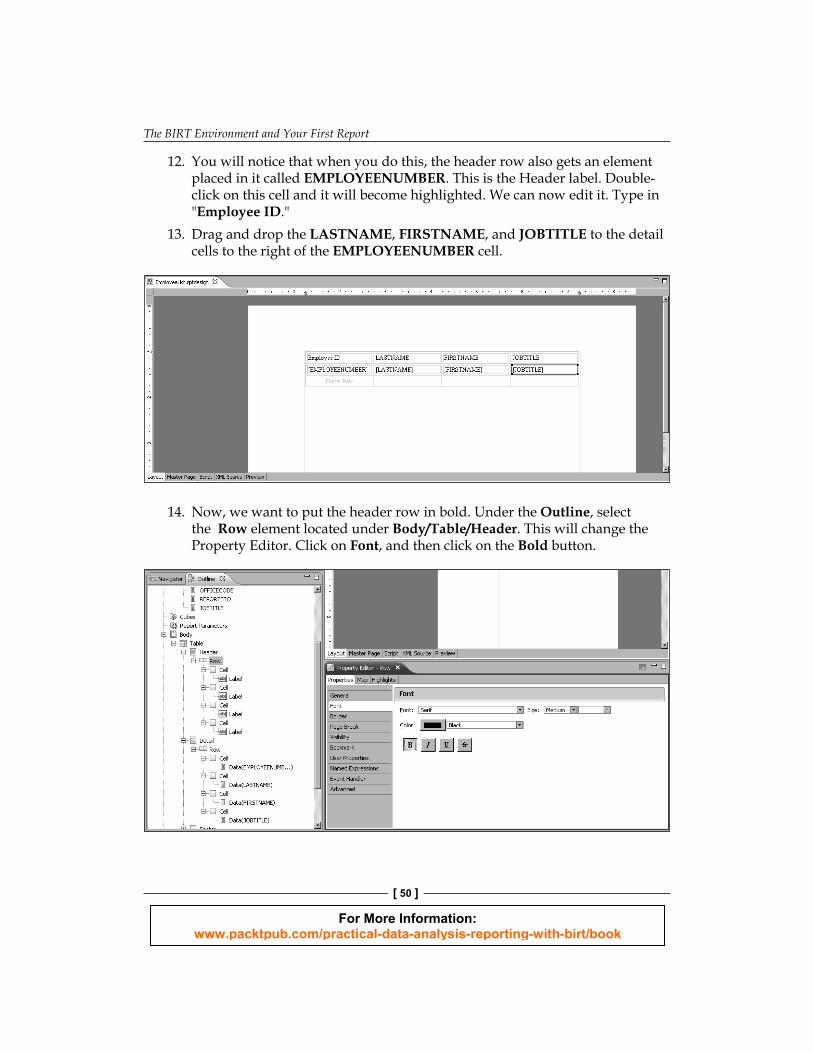
12. You will notice that when you do this, the header row also gets an element placed in it called EMPLOYEENUMBER. This is the Header label. Double- click on this cell and it will become highlighted. We can now edit it. Type in "Employee ID."
13. Dr ag and drop the LASTNAME, FIRSTNAME, and JOBTITLE to the detail cells to the right of the EMPLOYEENUMBER cell.
14. Now, we want to put the header row in bold. Under the Outline, select the Row element located under Body/Table/Header. This will change the Property Editor. Click on Font, and then click on the Bold button.
For More Information: www.packtpub.com/practical-data-analysis-reporting-with-birt/book
Chapter 3
[ 51 ]
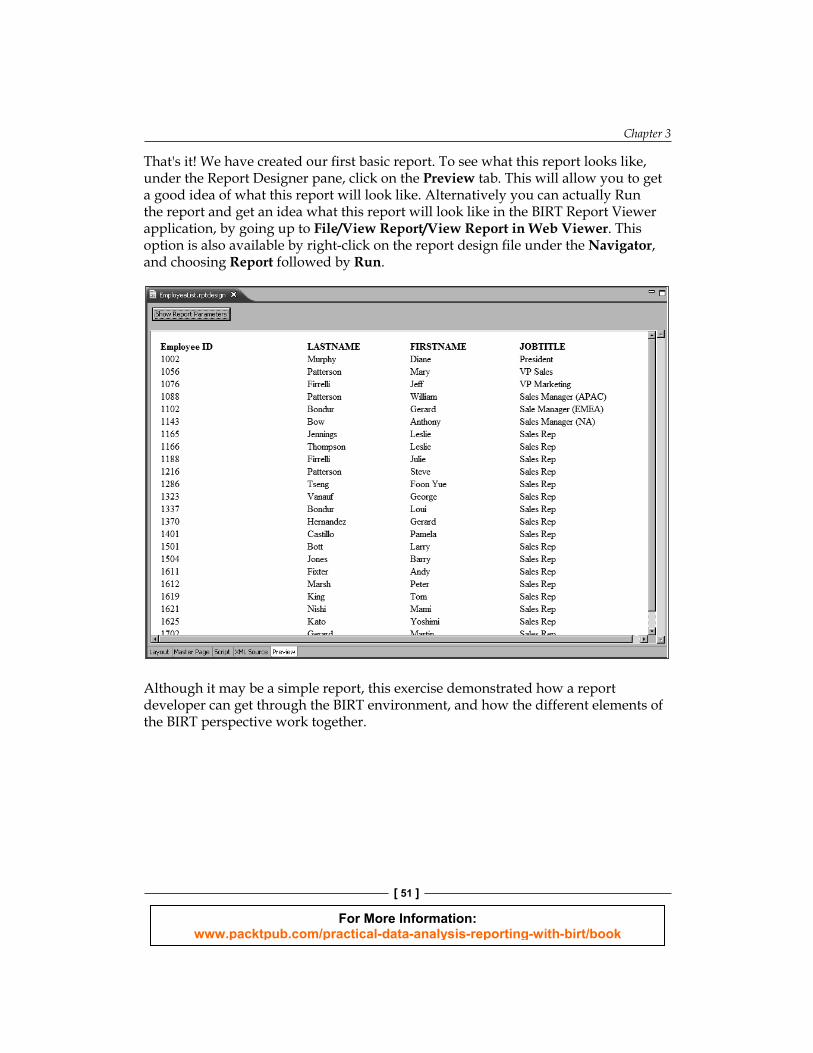
That's it! We have created our fi rst basic report. To see what this report looks like, under the Report Designer pane, click on the Preview tab. This will allow you to get a good idea of what this report will look like. Alternatively you can actually Run the report and get an idea what this report will look like in the BIRT Report Viewer application, by going up to File/View Report/View Report in Web Viewer. This option is also available by right-click on the report design fi le under the Navigator, and choosing Report followed by Run.
Although it may be a simple report, this exercise demonstrated how a report developer can get through the BIRT environment, and how the different elements of the BIRT perspective work together.
For More Information: www.packtpub.com/practical-data-analysis-reporting-with-birt/book
The BIRT Environment and Your First Report
[ 52 ]
SummaryF or a very simple report design, we utilized all of the major areas of the BIRT perspective. We used the Navigator to create a new report project and a new report design, the Data explorer to create out data connection and Data Set, dragged elements from the Outline to the Report Designer to get the data elements into the right place, and used the Property Editor and Outline cooperatively to bold the text in the table header.
In the coming chapters we will build more complex reports, and in the process, explain what the various BIRT report elements are and what they can do.

For More Information: www.packtpub.com/practical-data-analysis-reporting-with-birt/book
Where to buy this book You can buy Practical Data Analysis and Reporting with BIRT from the Packt Publishing website: http://www.packtpub.com/practical-data-analysis-reporting-with-birt/book
Free shipping to the US, UK, Europe, Australia, New Zealand and India.
Alternatively, you can buy the book from Amazon, BN.com, Computer Manuals and most internet book retailers.
www.PacktPub.com


