challenges Article Practical Eco-Design and Eco-Innovation of Consumer Electronics—the Case of Mobile Phones Anders S. G. Andrae 1, *, Mengjun Xia 2 , Jianli Zhang 2 and Xiaoming Tang 2 1 Huawei Technologies Sweden AB, Skalholtsgatan 9, 16494 Kista, Sweden 2 Huawei Device CO., Ltd., 10F, BldgA, Huawei Technologies Cloud Park, Xuegang Road No. 2018, Bantian, Longgang, Shenzhen 518129, China; [email protected] (M.X.); [email protected] (J.Z.); [email protected] (X.T.) * Correspondence: [email protected]; Tel.: +46-739-200-533; Fax: +46-812-060-800 Academic Editors: William Bullock and Joy J. Scrogum Received: 3 December 2015; Accepted: 2 February 2016; Published: 15 February 2016 Abstract: Annually, it is estimated that about 4 billion units of consumer electronics for mobile communications are produced worldwide. This could lead to various ecological imbalances unless the design and disposal of the products are handled optimally. To illustrate how industry looks at and responds to the increasing social awareness, this article describes how sustainability is successfully implemented in practice at a large Chinese company, developing and producing various kinds of electronic products used for communication. It also describes how a variety of eco-innovations and business models contribute to reducing the environmental impact; for example, through increased recovery and recycling. A new kind of eco-design procedure is presented along with a new methodology which shows how a mobile phone gradually becomes more sustainable from one generation to the next. The issues with and set-up of new eco-labeling schemes for mobile phones, eco-rating, is described in detail. The conclusion is that due to high competition between companies, the industry acts resourcefully and a lot is done to the save the ecological environment. Keywords: consumer electronics; eco-design; eco-rating; life cycle assessment; innovation; smartphones; sustainability 1. Introduction With recent explosive growth in the market for new Information and Communication Technology (ICT) devices—smartphones and tablets in particular—and the transition of the television (TV) from a basic receiver into a digital media center and entertainment hub, these digital consumer devices now dominate global sales of consumer electronics [1]. Laptop and mobile phone global sales are expected to rise from around 3 billion units annually to more than 4 billion [1]. This could lead to more and more e-waste accumulation due to short lifetimes of mobile phones and relatively low recyclability and re-use rates, ~10% of all units [2]. Today there are a few legal requirements on some toxic substances, whereas sustainability is characterized by very vague requirements. Sustainability is defined as a vision of a better connected world where economic and social values are created for suppliers and customers by an eco-friendly and low-carbon supply chain. Nevertheless, there is a growing interest of sustainability and methods to measure it as it leads to additional efficiencies. Moreover, it pays to pursue green innovation [3]. Integrating environmental aspects in the product design process is covered by the scientific research. Based on various fields, such as eco-design, design for environment (DFE), design for sustainability, life cycle engineering, and eco-innovation, several specific software programs and methods have been developed to tackle these issues [4,5]. Challenges 2016, 7, 3; doi:10.3390/challe7010003 www.mdpi.com/journal/challenges
Transcript
challenges
Article
Practical Eco-Design and Eco-Innovation ofConsumer Electronics—the Case of Mobile PhonesAnders S. G. Andrae 1,*, Mengjun Xia 2, Jianli Zhang 2 and Xiaoming Tang 2
Academic Editors: William Bullock and Joy J. ScrogumReceived: 3 December 2015; Accepted: 2 February 2016; Published: 15 February 2016
Abstract: Annually, it is estimated that about 4 billion units of consumer electronics for mobilecommunications are produced worldwide. This could lead to various ecological imbalances unlessthe design and disposal of the products are handled optimally. To illustrate how industry looks at andresponds to the increasing social awareness, this article describes how sustainability is successfullyimplemented in practice at a large Chinese company, developing and producing various kinds ofelectronic products used for communication. It also describes how a variety of eco-innovationsand business models contribute to reducing the environmental impact; for example, throughincreased recovery and recycling. A new kind of eco-design procedure is presented along witha new methodology which shows how a mobile phone gradually becomes more sustainable from onegeneration to the next. The issues with and set-up of new eco-labeling schemes for mobile phones,eco-rating, is described in detail. The conclusion is that due to high competition between companies,the industry acts resourcefully and a lot is done to the save the ecological environment.
Keywords: consumer electronics; eco-design; eco-rating; life cycle assessment; innovation;smartphones; sustainability
1. Introduction
With recent explosive growth in the market for new Information and Communication Technology(ICT) devices—smartphones and tablets in particular—and the transition of the television (TV) from abasic receiver into a digital media center and entertainment hub, these digital consumer devices nowdominate global sales of consumer electronics [1].
Laptop and mobile phone global sales are expected to rise from around 3 billion units annually tomore than 4 billion [1]. This could lead to more and more e-waste accumulation due to short lifetimesof mobile phones and relatively low recyclability and re-use rates, ~10% of all units [2].
Today there are a few legal requirements on some toxic substances, whereas sustainability ischaracterized by very vague requirements.
Sustainability is defined as a vision of a better connected world where economic and social valuesare created for suppliers and customers by an eco-friendly and low-carbon supply chain.
Nevertheless, there is a growing interest of sustainability and methods to measure it as it leads toadditional efficiencies. Moreover, it pays to pursue green innovation [3]. Integrating environmentalaspects in the product design process is covered by the scientific research. Based on various fields,such as eco-design, design for environment (DFE), design for sustainability, life cycle engineering, andeco-innovation, several specific software programs and methods have been developed to tackle theseissues [4,5].
Eco-design is a fully integrated activity of the design process in which the product environmentalimpact is checked against targets for improvement, whereas eco-innovation is a new idea, device, orprocess which comparably leads to a more eco-efficient solution. Eco-efficiency implies more economicvalue created with less environmental impacts.
There are many reasons for the implementation of so called eco-design principles in theindustry: from corporate identity to customers’ expectations, from voluntary agreements to mandatoryregulations [4–42].
Numerous studies in the area of life cycle assessment (LCA) and eco-design of mobile consumerelectronics devices used for communication have been carried out, mainly between 1996 and2016 [43–85]. These studies refer to a short list and are non-exhaustive.
The European Commission has been focusing on reducing the environmental impact of the wastedisposal deriving, particularly, from the automotive sector and electric and electronic equipment(EEE) [10]. Eco-design is a part of the process of developing eco-efficient products because it exploresopportunities to reduce environmental impacts throughout entire product life cycles by improvedproduct design (whether these products are goods, services, or processes). Since the whole productlife cycle should be considered, representatives from development, design, production, recycling,marketing, purchasing, and project management should work together on the eco-design of existing ornew products as well other stakeholders in the design and development process. LCA can be used tosupport eco-design by adding up all design measures into one score. However, the data collectionfor an LCA used within the design process should not take longer time than other data collection,suggesting that simplified/rapid LCA methods are the most feasible. The data quality should, ofcourse, still be high enough despite the LCA calculations being rapid.
Previous research shows that application of LCA and eco-design have both been improved andexpanded, owing largely to the development of more environmentally friendly materials, newlyemerging technology, and legislation mandating better handling of consumer electronics—both inmanufacturing and in waste treatment [80]. Generally, academic research is good at finding more orless complicated approaches for eco-design which treat sustainability as a separate issue from theactual design. This is not wrong per se, but industry usually prefers practical tools which are integratedin the design process. Alternatively LCA experts in industry give opinions about the sustainabilitycredentials of design concepts.
No literature could be found describing an easily applicable and apparently cost-effective methodfor integration of eco-design in the product development process for consumer electronics in whichthe role of logic in LCA is fully clarified. The scope of the literature review is from the designer’sperspective, the use of LCA and issues which are handled by design engineers within the timeframeof the development process. Working practice in production facilities is not included. Previousmethods [6,10,11,16,17,19,24–26,30,31,37,38,58,68,73,83] are not necessarily wrong for the purpose ofintegration of eco-design in the complex product development, but do they consider the main task ofproduct designers as much as the sustainability evaluation? A major hurdle in the implementationof life cycle engineering is the lack of systematic and strategic methods to design or plan an entireproduct life cycle [71].
The main aim of this research is to present an eco-design method, described in clauses threeand four, which moves away from complicated implementations of eco-design as it is not themain task of most companies. The purpose is to describe how eco-design is integrated in productdevelopment. The proposed method is more sophisticated than checklist approaches and is usefulfor meeting environmental requirements from the market. Philips’ Green Focal Area method [11,24]has the most similarities with the present method. However, the proposed method differs in severalimportant aspects:
The process of how to use eco-metrics and rapid LCA in the high-level product development islogically explained for non-environmental experts, such as designers:
Challenges 2016, 7, 3 3 of 19
‚ It does not introduce complicated analysis tools which would burden the designers.‚ It does not have high barriers for adoption for fast paced commercial companies.‚ Easy and fast to implement.‚ Fully transparent.‚ Cost-effective.
The present method is admittedly rather defensive and lets the designers do their technical/performance-oriented work without hindrance of extra environmental requirements beyondmandatory laws and regulations. Our main additions to previous body of literature are focusedon smartphone eco-innovation and explanations of eco-rating linked to a new eco-design methodologyshown in practice. Moreover, we show how eco-innovation is fostered by requirements from themarket, eco-rating, and by results from LCAs. The research also aims to confirm and revisit earlier factsand conclusions. Huawei is an example of a company which has made good progress in eco-design ofmobile phones and was, therefore, chosen as an example.
The description of the overall methodological approach is outlined first, followed by ademonstration of an effective and efficient eco-design method, and then a brief description of twoemerging evaluation approaches (Eco-Rating and Sustainability Assessment Standard Framework(SASF)) which drive and will drive eco-innovation in the consumer electronics industry. Finally theresults are discussed and the conclusions drawn, followed by recommendations for the next steps.
Hypothesis
The hypothesis is that an eco-design method based on easily-accessible metrics can bedemonstrated for consumer electronic equipment. The eco-design method is demonstrated in clausefour for two smartphones models, B and C.
2. Materials and Methods—Approach
The overall methodological approach consists of the following steps:
‚ Literature review‚ Describe the eco-design process EcoSmarT.‚ Show an application of EcoSmarT on phone models B and C.‚ Briefly introduce emerging approaches for product sustainability evaluation and show examples
of results for phones A, B, and C.‚ Discuss the results.‚ Conclusions and outlook.
Next follows a description of the proposed eco-design method EcoSmarT applied to thedevelopment of B to C.
3. Eco-Design Method EcoSmarT
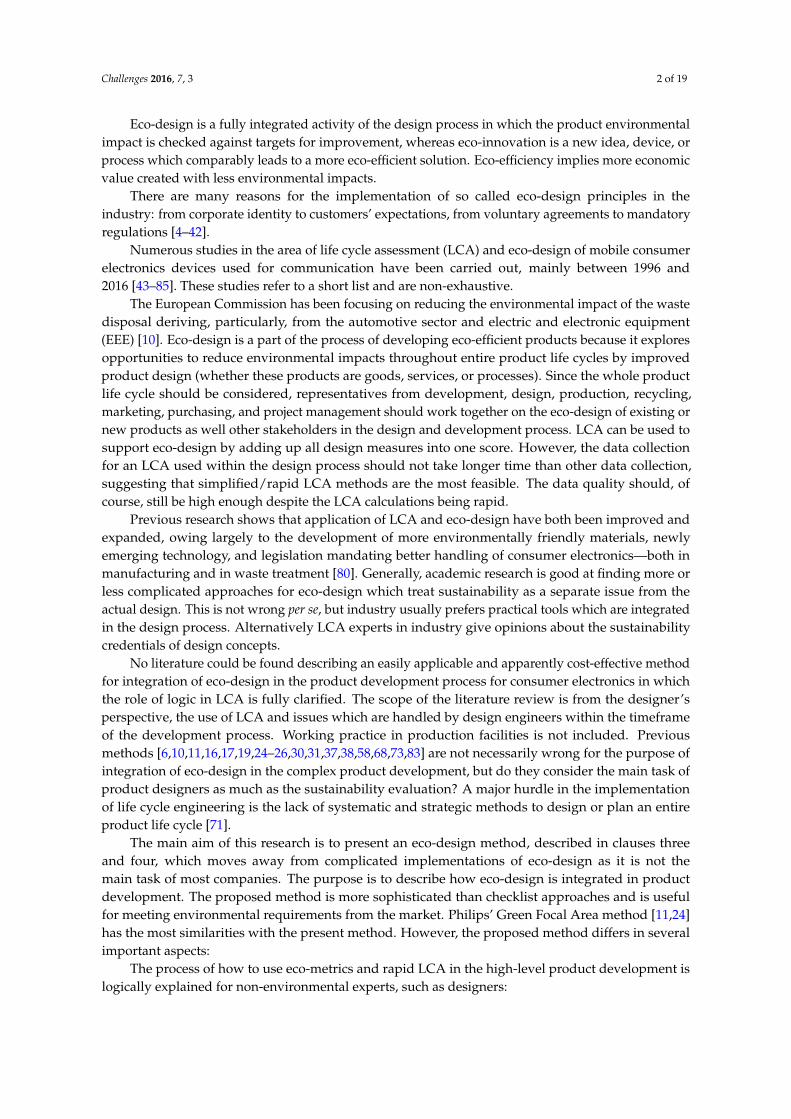
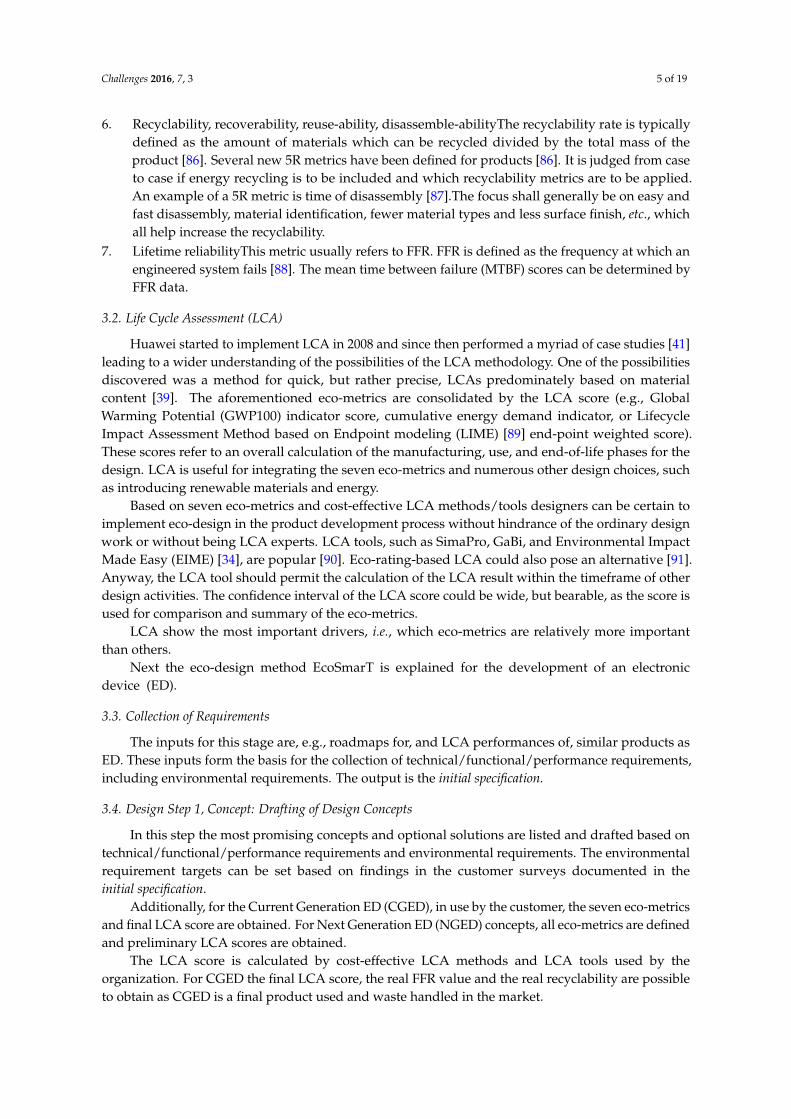
Each company is continuously investigating what characteristics customers want in the nextgeneration (NG) of products. The features are translated into technical requirements, includingenvironmental requirements, and later the designers come up with different concepts which satisfythese requirements. It is necessary to systematically find a way to integrate eco-design in theusual product development process. From the literature review we found that the description ofimplementation of eco-design is too vague and we needed to research the topic further. Startingfrom our original product development process we found a way to implement eco-design in thecompany. The steps of our present product development process and the actions and the targets forthe eco-design method EcoSmarT are shown in Figure 1.
Challenges 2016, 7, 3 4 of 19Challenges 2016, 7, 3 4 of 19
4/19
5.CLOSING1. CONCEPT 2. PLAN 4. VALIDATION3. DEVELOPMENT
5. CLOSING1. CONCEPT 2.PLAN
4. VALIDATION3. DEVELOPMENT
Targets:Eco-environmental
Requirements
Targets are
documented for
NG
Product
NG
Product
Next NG
Product
Targets:7 Eco-metrics and
LCA scores for
CG Product and
same for NG
Product Concepts
Targets:Fine-tune 7 Eco-
metrics and LCA
score for
Prototype of NG
Product
Targets:Quantify 7 Eco-
metrics and LCA
for NG Product in
use
Targets:7 Eco-metrics and LCA score for NG
Product from step 4 and same for Next NG
Product Concepts
0.Requirements including eco-
environmental requirements
are collected and set
Revised specification
Specification baselineFinal NG Product for sale
Initial specification
Field Failure Rate:The Eco-metric Field Failure Rate is
measured in Step 4 and estimated in Step 3
Targets:LCA score for NG
Product in Use
Figure 1. Steps of product development and the actions and targets for the eco-design method EcoSmarT.
The targets for all eco-metrics are set in step 1 (Concept) and baselined in step 2 (Plan). All
eco-metrics are obtained, improved, and fine-tuned in step 3 (Development), however, actual Field
Failure Rate (FFR) and “Rethink, Reduce, Recycle, Refurbish, Resale” (5R) values are obtained in
step 4 (Validation).
The proposed method suggests that the role of LCA in a “Plan, Do, Check, Act” (PDCA) cycle
is to “Check” environmental impacts holistically.
3.1. Eco-Metrics
The proposed method EcoSmarT includes seven eco-metrics and LCA score.
1. Energy efficiency
Energy efficiency is a rather broad concept defined as the quotient between the energy
needed to do useful work and total energy actually used. The metric refers to the use stage
energy and is product-specific. Examples applicable to mobile phones are charger efficiency,
absorbed power, charging time, and receiver sensitivity.
2. Packaging materials mass and volume
This metric refers to the mass and volume of the packaging materials, such as cardboard,
paper, and plastics. The target is to reduce the volume and mass.
3. Hazardous substances
This metric refers to mass of hazardous substances which are neither regulated nor banned.
It can also be qualitative measures such as elimination of substance usage.
4. Precious metals
This metric refers to masses of gold, silver, platinum, palladium, and other valuable metals
such as tantalum, indium, rhodium, ruthenium, osmium, and iridium.
Figure 1. Steps of product development and the actions and targets for the eco-designmethod EcoSmarT.
The targets for all eco-metrics are set in step 1 (Concept) and baselined in step 2 (Plan).All eco-metrics are obtained, improved, and fine-tuned in step 3 (Development), however, actualField Failure Rate (FFR) and “Rethink, Reduce, Recycle, Refurbish, Resale” (5R) values are obtained instep 4 (Validation).
The proposed method suggests that the role of LCA in a “Plan, Do, Check, Act” (PDCA) cycle isto “Check” environmental impacts holistically.
3.1. Eco-Metrics
The proposed method EcoSmarT includes seven eco-metrics and LCA score.
1. Energy efficiencyEnergy efficiency is a rather broad concept defined as the quotient between theenergy needed to do useful work and total energy actually used. The metric refers to the usestage energy and is product-specific. Examples applicable to mobile phones are charger efficiency,absorbed power, charging time, and receiver sensitivity.
2. Packaging materials mass and volumeThis metric refers to the mass and volume of the packagingmaterials, such as cardboard, paper, and plastics. The target is to reduce the volume and mass.
3. Hazardous substancesThis metric refers to mass of hazardous substances which are neitherregulated nor banned. It can also be qualitative measures such as elimination of substance usage.
4. Precious metalsThis metric refers to masses of gold, silver, platinum, palladium, and othervaluable metals such as tantalum, indium, rhodium, ruthenium, osmium, and iridium.
5. Total massThis metric refers to the total mass of the designed product including the accessories.The target is to reduce the mass.
Challenges 2016, 7, 3 5 of 19
6. Recyclability, recoverability, reuse-ability, disassemble-abilityThe recyclability rate is typicallydefined as the amount of materials which can be recycled divided by the total mass of theproduct [86]. Several new 5R metrics have been defined for products [86]. It is judged from caseto case if energy recycling is to be included and which recyclability metrics are to be applied.An example of a 5R metric is time of disassembly [87].The focus shall generally be on easy andfast disassembly, material identification, fewer material types and less surface finish, etc., whichall help increase the recyclability.
7. Lifetime reliabilityThis metric usually refers to FFR. FFR is defined as the frequency at which anengineered system fails [88]. The mean time between failure (MTBF) scores can be determined byFFR data.
3.2. Life Cycle Assessment (LCA)
Huawei started to implement LCA in 2008 and since then performed a myriad of case studies [41]leading to a wider understanding of the possibilities of the LCA methodology. One of the possibilitiesdiscovered was a method for quick, but rather precise, LCAs predominately based on materialcontent [39]. The aforementioned eco-metrics are consolidated by the LCA score (e.g., GlobalWarming Potential (GWP100) indicator score, cumulative energy demand indicator, or LifecycleImpact Assessment Method based on Endpoint modeling (LIME) [89] end-point weighted score).These scores refer to an overall calculation of the manufacturing, use, and end-of-life phases for thedesign. LCA is useful for integrating the seven eco-metrics and numerous other design choices, suchas introducing renewable materials and energy.
Based on seven eco-metrics and cost-effective LCA methods/tools designers can be certain toimplement eco-design in the product development process without hindrance of the ordinary designwork or without being LCA experts. LCA tools, such as SimaPro, GaBi, and Environmental ImpactMade Easy (EIME) [34], are popular [90]. Eco-rating-based LCA could also pose an alternative [91].Anyway, the LCA tool should permit the calculation of the LCA result within the timeframe of otherdesign activities. The confidence interval of the LCA score could be wide, but bearable, as the score isused for comparison and summary of the eco-metrics.
LCA show the most important drivers, i.e., which eco-metrics are relatively more importantthan others.
Next the eco-design method EcoSmarT is explained for the development of an electronicdevice (ED).
3.3. Collection of Requirements
The inputs for this stage are, e.g., roadmaps for, and LCA performances of, similar products asED. These inputs form the basis for the collection of technical/functional/performance requirements,including environmental requirements. The output is the initial specification.
3.4. Design Step 1, Concept: Drafting of Design Concepts
In this step the most promising concepts and optional solutions are listed and drafted based ontechnical/functional/performance requirements and environmental requirements. The environmentalrequirement targets can be set based on findings in the customer surveys documented in theinitial specification.
Additionally, for the Current Generation ED (CGED), in use by the customer, the seven eco-metricsand final LCA score are obtained. For Next Generation ED (NGED) concepts, all eco-metrics are definedand preliminary LCA scores are obtained.
The LCA score is calculated by cost-effective LCA methods and LCA tools used by theorganization. For CGED the final LCA score, the real FFR value and the real recyclability are possibleto obtain as CGED is a final product used and waste handled in the market.
Challenges 2016, 7, 3 6 of 19
All eco-metrics are estimated and the preliminary LCA scores are calculated for the differentNGED concepts which the designers propose. The output from the Concept step is therevised specification.
3.5. Design Step 2, Plan
In the Plan step the design is planned. Additionally the environmental requirement targets indesign are documented in the report from Plan. Examples of targets are for power and resourceusage, as well as energy efficiency. Revised specifications are developed into a specification baseline to befine-tuned during the subsequent Development process. The output from Plan is the specification baselinefor NGED.
3.6. Design Step 3, Development
In the Development step the system architecture and the detailed design for NGED are formed.The detailed NGED design is based on the specification baseline for a NGED concept. Prototypesare created and then fine-tuned repeatedly to meet the technical/functional/performance andenvironmental requirements. Meanwhile, verification and testing will be repeatedly conducted onPrototypes and their fine-tuning models, including estimations of FFR values. Brainstorming, Theory ofInventive Problem Solving (TRIZ) [31], and guidelines can help generate ideas for fine-tuning.
All eco-metrics are quantified and the preliminary LCA scores are calculated for the Prototypeand its fine-tuned models of NGED. The designers find ways of fine-tuning the applicable eco-metricsfurther for the NGED Prototypes resulting in Final product NGED.
The new fine-tuned values of the eco-metrics and the LCA score for the Final product NGED designare quantified and calculated, respectively, and put into the report from Development. The Final productNGED is manufactured and goes for sale.
The requirements from Step 3.2 Plan are checked (Check) to validate how the eco-metrics andthe LCA score were investigated for NGED. It is also checked if the requirements from Step 3.2, Plan,are fulfilled.
The Development step is followed by the Customer Validation.
3.7. Design Step 4, Customer Validation
This step validates data from the use of NGED. Here the final values of the eco-metrics and theLCA score for the final NGED design are quantified and calculated, respectively, and put into the reportfrom Customer Validation. Here the FFR values are based on failure samples returned by customers.As shown in Figure 1 the eco-metrics values from this design step will be used as a benchmark for thenext NGED. The actual recyclability rate can also be measured in this step and used as a benchmarkfor next NGED.
3.8. Design Step 5, Closing Process.
Another LCA score is calculated based on additional data about the life cycle of NGED and thedesign project for NGED is closed. The LCA score from this design step is usually very close to theprevious from Step 4.
Design steps 0 to 5 are then repeated for the next NGED, e.g., starting with collecting new customerrequirements (from, e.g., roadmaps and LCAs).
Next follows an application of EcoSmarT applied to the development of B to C.
4. Application of EcoSmarT to the Development of Phone B to C
Here follows an application of EcoSmarT to mobile phones within the smartphone segment.The accuracy of the absolute numbers given in the examples is of less importance than the logic of the
Challenges 2016, 7, 3 7 of 19
eco-design methodology. The numbers used are, nevertheless, representative for B and C smartphonesdesigned between 2013 and 2014.
4.1. Collection of Requirements
Based on the features obtained from customer surveys and analyses of voluntary trends, severaltechnical/functional/performance requirement targets, and some environmental requirement targets,are set for phone C:
‚ Increase the stand-by time compared to B‚ Introduce a bio-based plastic‚ Eliminate brominated flame retardants/chlorinated flame retardants from the main body‚ Eliminate polyvinyl chloride (PVC)‚ Eliminate phthalates‚ Introduce Forest Steward Council (FSC) certified color box‚ Introduce soy-ink printing
Note that here environmental requirements refer to customer requirements beyond mandatorylegislation. Examples of environmental requirement targets are:
‚ Reach a certain score for various Eco-Ratings (see clause 5),‚ Fulfill Energy Star standards,‚ Fulfill Code of Conducts for energy efficiency,‚ Fulfill various eco-labels.‚ Remove hazardous substances beyond legislation
There are several concepts for C which can fulfill the technical/functional/performance andcost requirements. Design for profitability is the key driver and, therefore, it is strived for low-costand high-performance solutions. Generally, the designers moderate the display, integrated circuits,light emitting diodes, circuit design, battery charging and discharging, and printed circuit boardassembly layout.
In summary one of the concepts for C fulfilling the technical/functional/performancerequirements, and highly likely meet the eco-design requirement targets, compared to B:
‚ Uses bio-based plastics for the front shell instead of petro-based plastics.‚ Has lower packaging materials volume.‚ Has longer talk time and stand-by time.‚ Uses soy ink for the packaging box and manual.‚ Have no painted mechanical parts.‚ Innovated the packaging.
4.2. Design Step 1, Concept: Drafting of Design Concepts for Phone
In Table 1 are shown eco-metrics for phone B and a concept for phone C in step 4.1. Lifetimereliability is outside the scope of this article. Due to confidentiality reasons the detailed methodologyfor obtaining the numbers in Tables 1–4 is not disseminated.
Based on a sensitivity analysis, it is determined that the degree of re-use of C has the strongesteffect on the LCA score. Other metrics have weaker correlation with the LCA score, however goldcontent has the strongest.
4.3. Design Step 2, Plan of Phone
Here the sharp environmental requirement targets in design are documented for C:
‚ fine-tune and improve three of seven eco-metrics
Challenges 2016, 7, 3 8 of 19
‚ has >5% lower packaging volume than B‚ has at least 10% better autonomy time in stand-by than B‚ has better absolute LCA score than B. The LCA methodology used has been extensively
documented elsewhere [39,90].
The place of the precise requirement setting is one of the clearest features of EcoSmarT.The requirements are set on the basis of what can realistically be achieved for C.
Table 1. Eco-metric values for B and a concept of C in Design Step 4.1.
Eco-Metric Value for B Target Value for aC Concept Unit Comment
1. Energy efficiency 422 475 hours Mobile autonomy time in stand-bymode (charged at 100%)
2. Packaging materials volume 825 784 cm3 The metric is also used in Open EcoRating (OER) [91]
3. Hazardous substances
Meet therequirements of
laws andregulations
PVC, Be,phthalates and
triphenylphosphateeliminated
Qualitative. OER [91] contains similar metrics.
4. Precious metals (Au, Ag) 240 150 mg The metric is also used in OER [91].
5. Total mass 392 454 g
Total mass (mobile phone includingbattery + charger + accessories +
packaging). The metric is alsoused in OER [91].
6. Recyclability (metalsand polymers) 80 90 % Can only be measured for C when it
has been used by customer.
7.Lifetime reliability Not specified. Not specified. % Can only be measured for C when ithas been used by customer.
8. LCA score 2460 JPY
2510 JPY, (the effectof improved 5R
and chargingefficiency canbe explored)
JPY
LIMEv2 weighting method [89].For Assembly of C a proxy value isused. Re-use has a relatively strong
correlation with the LCA score,whereas the correlation is low
for Bio-plastics.
4.4. Design Step 3, Development of Phone
The Development step involves fine-tuning of eco-metrics making the Prototypes and Final design ofC. Table 2 shows the eco-metric values and LCA score which are put in the Development report.
These values shall be compared to B values of Table 1. The final verification of all requirementsis made.
Additionally, the environmental requirements for C set in 4.2 Plan are checked.
‚ fine-tuned and improved three of seven eco-metrics (Yes, autonomy time in stand-by, packagingvolume, and total mass)
‚ has >5% lower packaging volume than B (Yes)‚ has at least 10% better autonomy time in stand-by than B (Yes)‚ has better absolute LCA score than B (No, but as more data are collected about actual life cycle
performance it could change in step 4.4)
Next, the final product C is sent for final assembly, assembled, and its final LCA value, includingthe measured impact of the assembly process, is calculated as 2510 JPY (20.3 USD).
Next, C is sold.
Challenges 2016, 7, 3 9 of 19
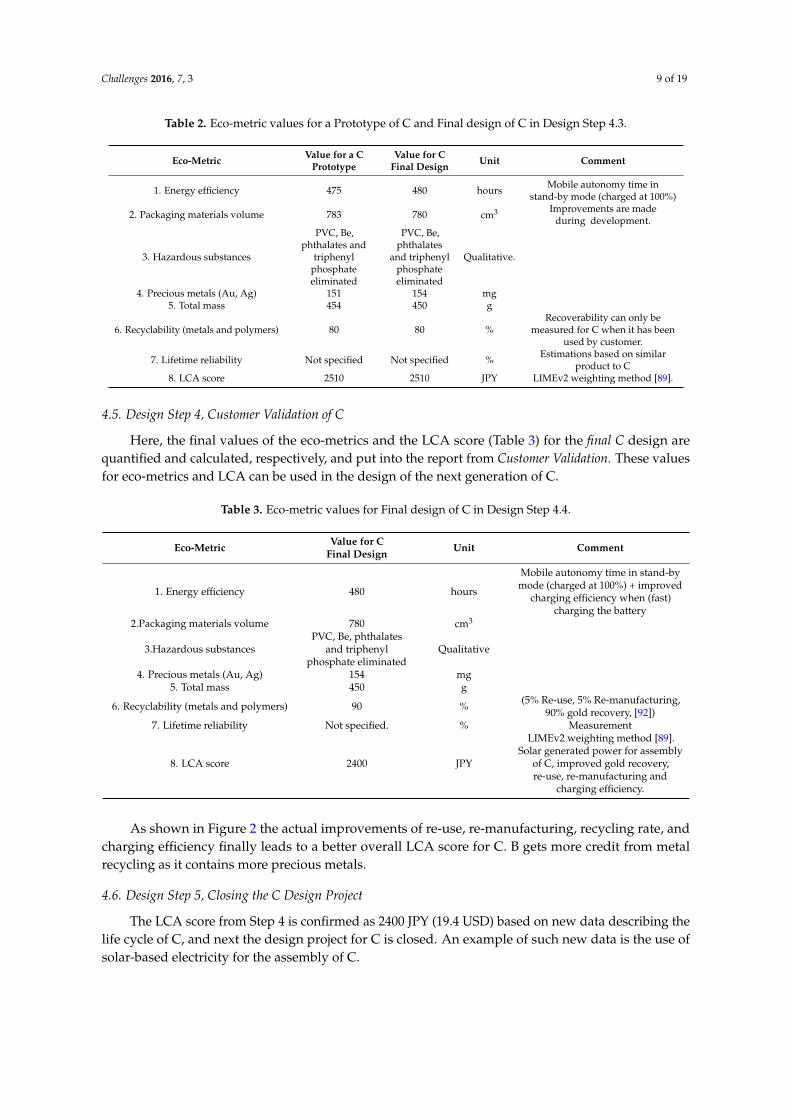
Table 2. Eco-metric values for a Prototype of C and Final design of C in Design Step 4.3.
Eco-Metric Value for a CPrototype
Value for CFinal Design Unit Comment
1. Energy efficiency 475 480 hours Mobile autonomy time instand-by mode (charged at 100%)
Here, the final values of the eco-metrics and the LCA score (Table 3) for the final C design arequantified and calculated, respectively, and put into the report from Customer Validation. These valuesfor eco-metrics and LCA can be used in the design of the next generation of C.
Table 3. Eco-metric values for Final design of C in Design Step 4.4.
Eco-Metric Value for CFinal Design Unit Comment
1. Energy efficiency 480 hours
Mobile autonomy time in stand-bymode (charged at 100%) + improved
charging efficiency when (fast)charging the battery
2.Packaging materials volume 780 cm3
3.Hazardous substancesPVC, Be, phthalates
and triphenylphosphate eliminated
Qualitative
4. Precious metals (Au, Ag) 154 mg5. Total mass 450 g
7. Lifetime reliability Not specified. % Measurement
8. LCA score 2400 JPY
LIMEv2 weighting method [89].Solar generated power for assembly
of C, improved gold recovery,re-use, re-manufacturing and
charging efficiency.
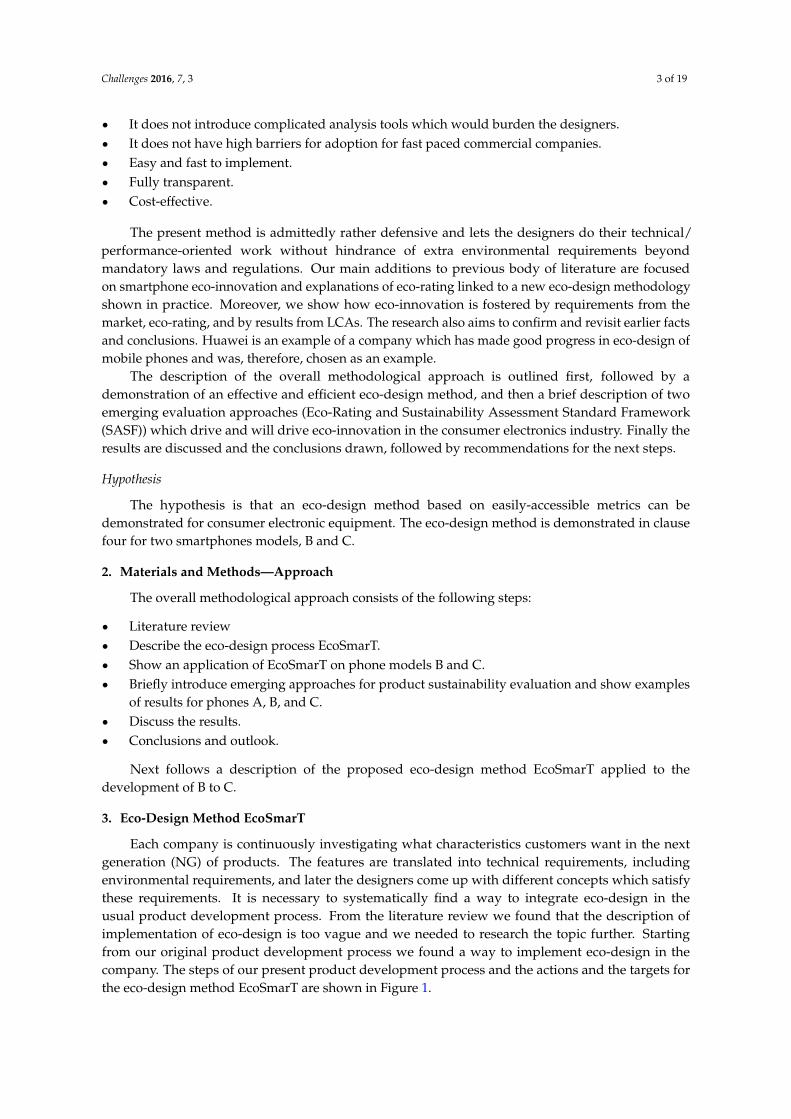
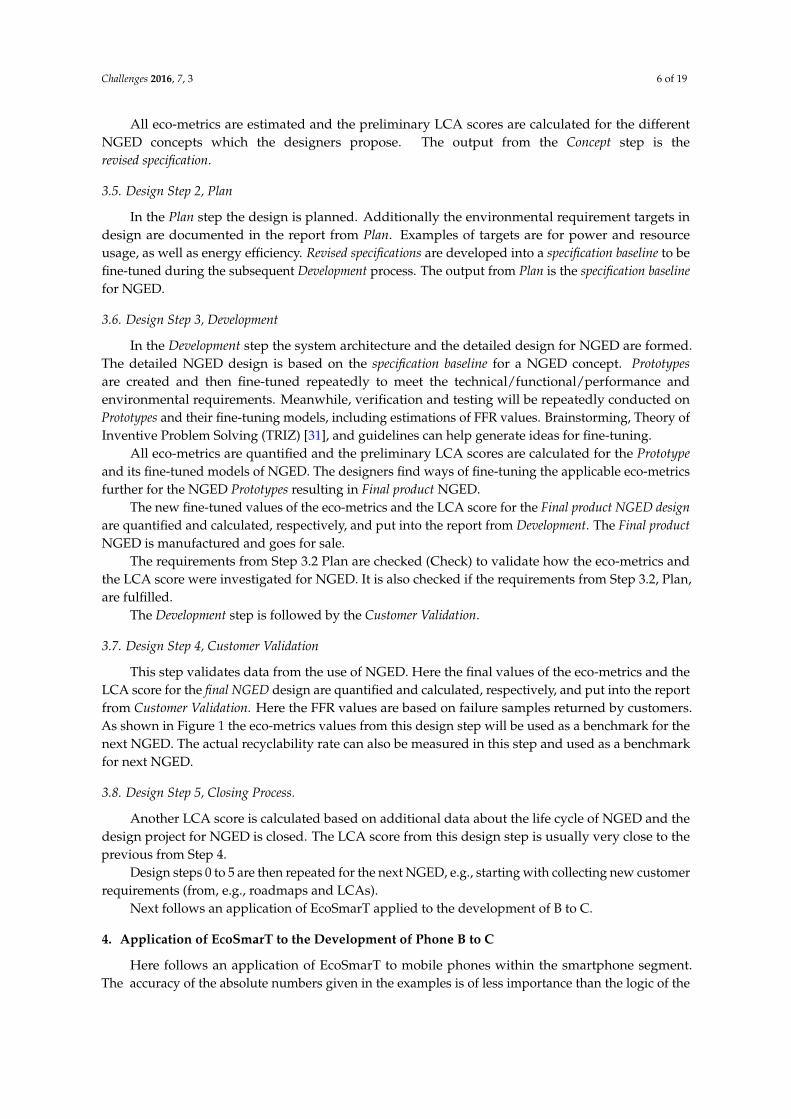
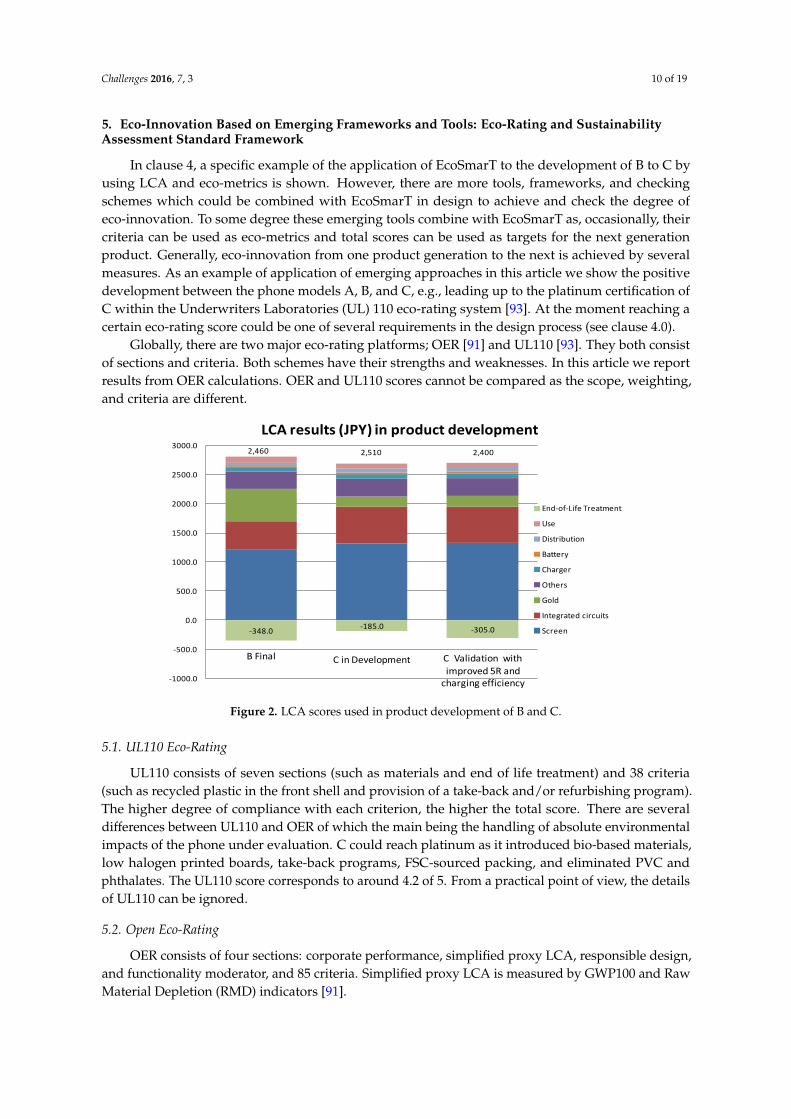
As shown in Figure 2 the actual improvements of re-use, re-manufacturing, recycling rate, andcharging efficiency finally leads to a better overall LCA score for C. B gets more credit from metalrecycling as it contains more precious metals.
4.6. Design Step 5, Closing the C Design Project
The LCA score from Step 4 is confirmed as 2400 JPY (19.4 USD) based on new data describing thelife cycle of C, and next the design project for C is closed. An example of such new data is the use ofsolar-based electricity for the assembly of C.
Challenges 2016, 7, 3 10 of 19
5. Eco-Innovation Based on Emerging Frameworks and Tools: Eco-Rating and SustainabilityAssessment Standard Framework
In clause 4, a specific example of the application of EcoSmarT to the development of B to C byusing LCA and eco-metrics is shown. However, there are more tools, frameworks, and checkingschemes which could be combined with EcoSmarT in design to achieve and check the degree ofeco-innovation. To some degree these emerging tools combine with EcoSmarT as, occasionally, theircriteria can be used as eco-metrics and total scores can be used as targets for the next generationproduct. Generally, eco-innovation from one product generation to the next is achieved by severalmeasures. As an example of application of emerging approaches in this article we show the positivedevelopment between the phone models A, B, and C, e.g., leading up to the platinum certification ofC within the Underwriters Laboratories (UL) 110 eco-rating system [93]. At the moment reaching acertain eco-rating score could be one of several requirements in the design process (see clause 4.0).
Globally, there are two major eco-rating platforms; OER [91] and UL110 [93]. They both consistof sections and criteria. Both schemes have their strengths and weaknesses. In this article we reportresults from OER calculations. OER and UL110 scores cannot be compared as the scope, weighting,and criteria are different.
Challenges 2016, 7, 3 10 of 19
10/19
B Final C in Development C Validation with improved 5R and
charging efficiency
2,460 2,510 2,400
-348.0-185.0 -305.0
-1000.0
-500.0
0.0
500.0
1000.0
1500.0
2000.0
2500.0
3000.0
LCA results (JPY) in product development
End-of-Life Treatment
Use
Distribution
Battery
Charger
Others
Gold
Integrated circuits
Screen
5. Eco-Innovation Based on Emerging Frameworks and Tools: Eco-Rating and Sustainability
Assessment Standard Framework
In clause 4, a specific example of the application of EcoSmarT to the development of B to C by
using LCA and eco-metrics is shown. However, there are more tools, frameworks, and checking
schemes which could be combined with EcoSmarT in design to achieve and check the degree of
eco-innovation. To some degree these emerging tools combine with EcoSmarT as, occasionally,
their criteria can be used as eco-metrics and total scores can be used as targets for the next
generation product. Generally, eco-innovation from one product generation to the next is achieved
by several measures. As an example of application of emerging approaches in this article we show
the positive development between the phone models A, B, and C, e.g., leading up to the platinum
certification of C within the Underwriters Laboratories (UL) 110 eco-rating system [93]. At the
moment reaching a certain eco-rating score could be one of several requirements in the design
process (see clause 4.0).
Globally, there are two major eco-rating platforms; OER [91] and UL110 [93]. They both consist
of sections and criteria. Both schemes have their strengths and weaknesses. In this article we report
results from OER calculations. OER and UL110 scores cannot be compared as the scope, weighting,
and criteria are different.
Figure 2. LCA scores used in product development of B and C.
5.1. UL110 Eco-Rating
UL110 consists of seven sections (such as materials and end of life treatment) and 38 criteria
(such as recycled plastic in the front shell and provision of a take-back and/or refurbishing
program). The higher degree of compliance with each criterion, the higher the total score. There are
several differences between UL110 and OER of which the main being the handling of absolute
environmental impacts of the phone under evaluation. C could reach platinum as it introduced
eliminated PVC and phthalates. The UL110 score corresponds to around 4.2 of 5. From a practical
point of view, the details of UL110 can be ignored.
Figure 2. LCA scores used in product development of B and C.
5.1. UL110 Eco-Rating
UL110 consists of seven sections (such as materials and end of life treatment) and 38 criteria(such as recycled plastic in the front shell and provision of a take-back and/or refurbishing program).The higher degree of compliance with each criterion, the higher the total score. There are severaldifferences between UL110 and OER of which the main being the handling of absolute environmentalimpacts of the phone under evaluation. C could reach platinum as it introduced bio-based materials,low halogen printed boards, take-back programs, FSC-sourced packing, and eliminated PVC andphthalates. The UL110 score corresponds to around 4.2 of 5. From a practical point of view, the detailsof UL110 can be ignored.
5.2. Open Eco-Rating
OER consists of four sections: corporate performance, simplified proxy LCA, responsible design,and functionality moderator, and 85 criteria. Simplified proxy LCA is measured by GWP100 and RawMaterial Depletion (RMD) indicators [91].
Challenges 2016, 7, 3 11 of 19
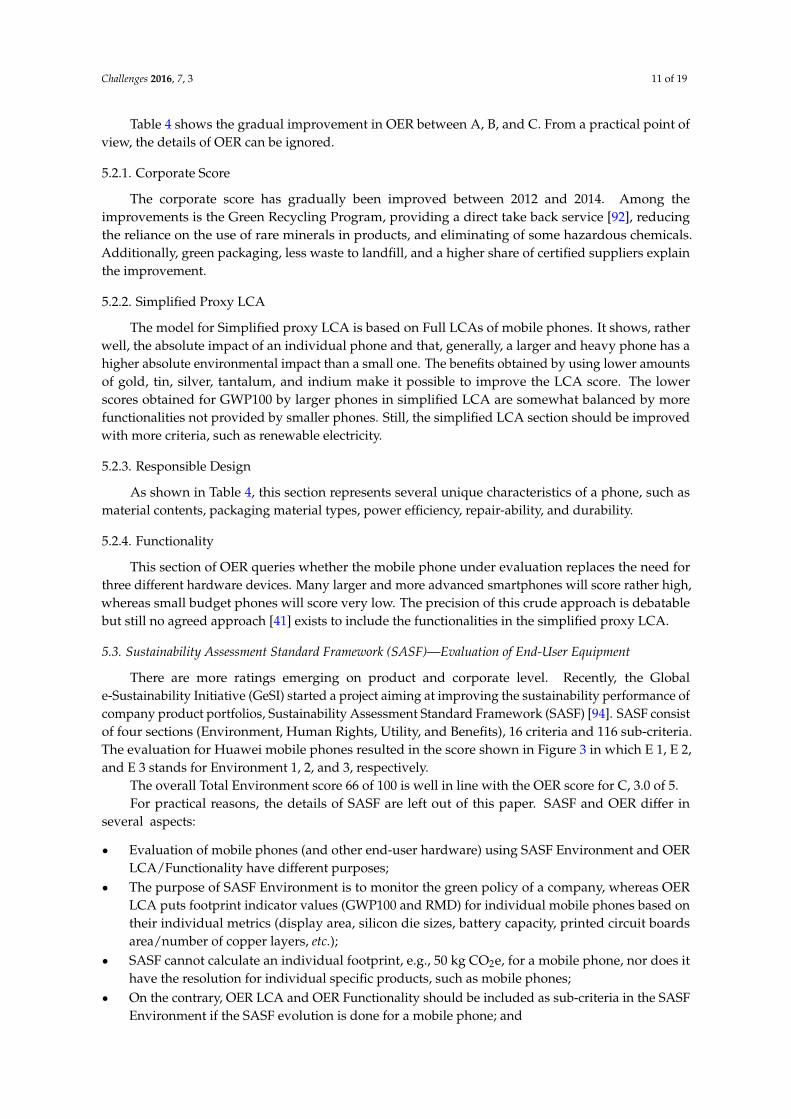
Table 4 shows the gradual improvement in OER between A, B, and C. From a practical point ofview, the details of OER can be ignored.
5.2.1. Corporate Score
The corporate score has gradually been improved between 2012 and 2014. Among theimprovements is the Green Recycling Program, providing a direct take back service [92], reducingthe reliance on the use of rare minerals in products, and eliminating of some hazardous chemicals.Additionally, green packaging, less waste to landfill, and a higher share of certified suppliers explainthe improvement.
5.2.2. Simplified Proxy LCA
The model for Simplified proxy LCA is based on Full LCAs of mobile phones. It shows, ratherwell, the absolute impact of an individual phone and that, generally, a larger and heavy phone has ahigher absolute environmental impact than a small one. The benefits obtained by using lower amountsof gold, tin, silver, tantalum, and indium make it possible to improve the LCA score. The lowerscores obtained for GWP100 by larger phones in simplified LCA are somewhat balanced by morefunctionalities not provided by smaller phones. Still, the simplified LCA section should be improvedwith more criteria, such as renewable electricity.
5.2.3. Responsible Design
As shown in Table 4, this section represents several unique characteristics of a phone, such asmaterial contents, packaging material types, power efficiency, repair-ability, and durability.
5.2.4. Functionality
This section of OER queries whether the mobile phone under evaluation replaces the need forthree different hardware devices. Many larger and more advanced smartphones will score rather high,whereas small budget phones will score very low. The precision of this crude approach is debatablebut still no agreed approach [41] exists to include the functionalities in the simplified proxy LCA.
5.3. Sustainability Assessment Standard Framework (SASF)—Evaluation of End-User Equipment
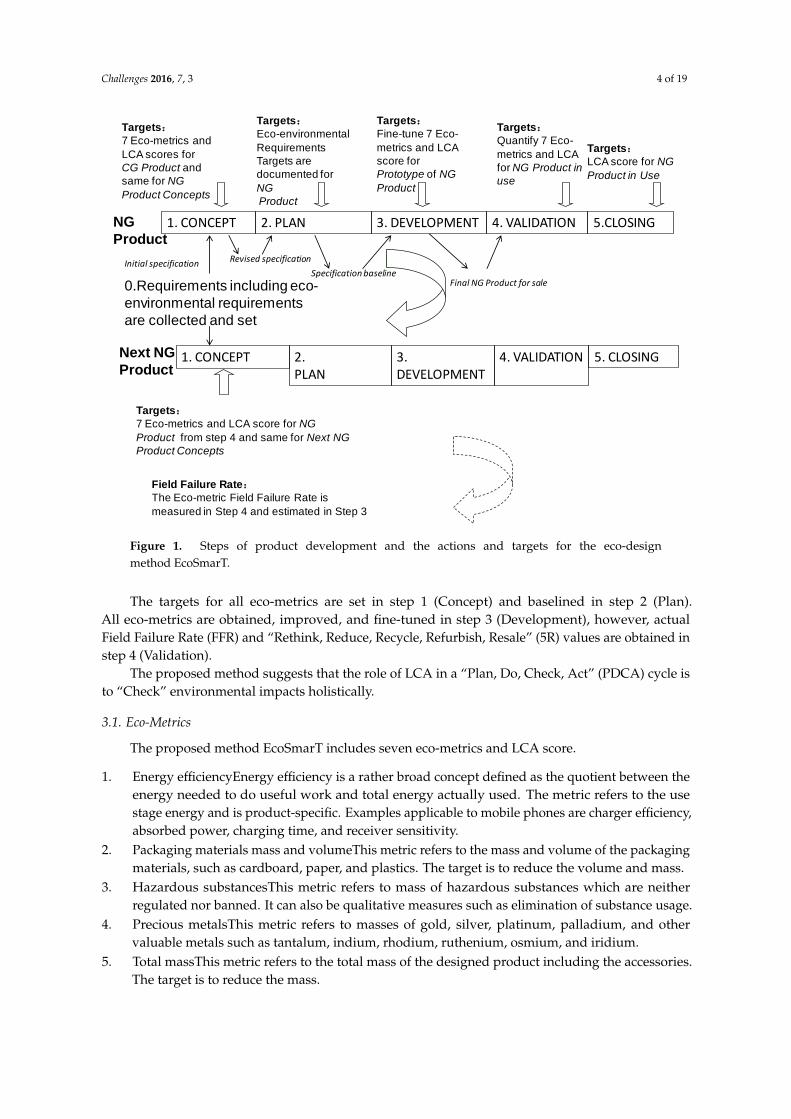
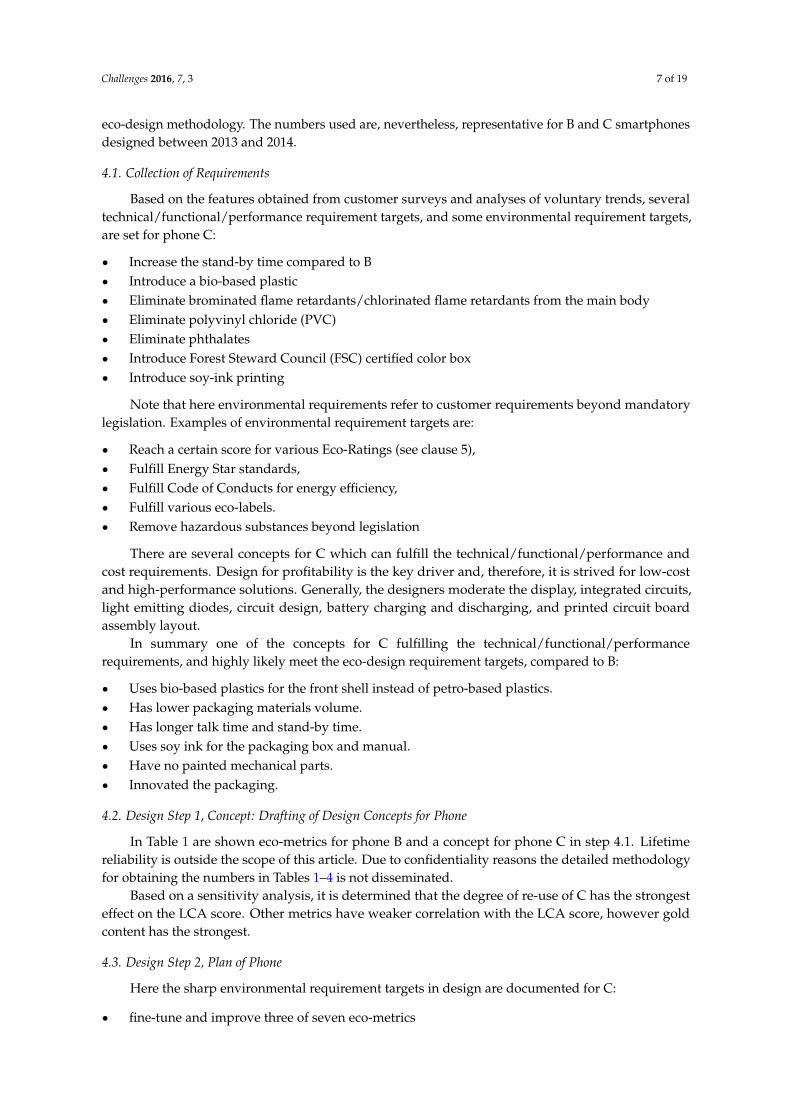
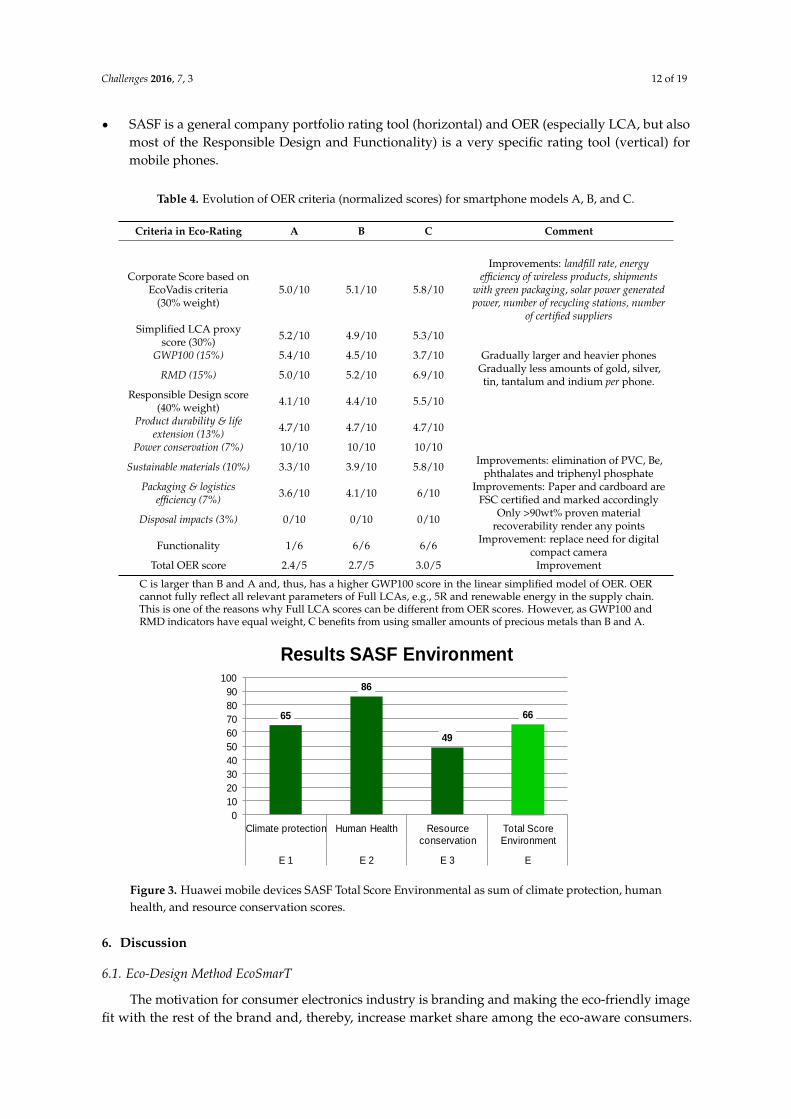
There are more ratings emerging on product and corporate level. Recently, the Globale-Sustainability Initiative (GeSI) started a project aiming at improving the sustainability performance ofcompany product portfolios, Sustainability Assessment Standard Framework (SASF) [94]. SASF consistof four sections (Environment, Human Rights, Utility, and Benefits), 16 criteria and 116 sub-criteria.The evaluation for Huawei mobile phones resulted in the score shown in Figure 3 in which E 1, E 2,and E 3 stands for Environment 1, 2, and 3, respectively.
The overall Total Environment score 66 of 100 is well in line with the OER score for C, 3.0 of 5.For practical reasons, the details of SASF are left out of this paper. SASF and OER differ in
several aspects:
‚ Evaluation of mobile phones (and other end-user hardware) using SASF Environment and OERLCA/Functionality have different purposes;
‚ The purpose of SASF Environment is to monitor the green policy of a company, whereas OERLCA puts footprint indicator values (GWP100 and RMD) for individual mobile phones based ontheir individual metrics (display area, silicon die sizes, battery capacity, printed circuit boardsarea/number of copper layers, etc.);
‚ SASF cannot calculate an individual footprint, e.g., 50 kg CO2e, for a mobile phone, nor does ithave the resolution for individual specific products, such as mobile phones;
‚ On the contrary, OER LCA and OER Functionality should be included as sub-criteria in the SASFEnvironment if the SASF evolution is done for a mobile phone; and
Challenges 2016, 7, 3 12 of 19
‚ SASF is a general company portfolio rating tool (horizontal) and OER (especially LCA, but alsomost of the Responsible Design and Functionality) is a very specific rating tool (vertical) formobile phones.
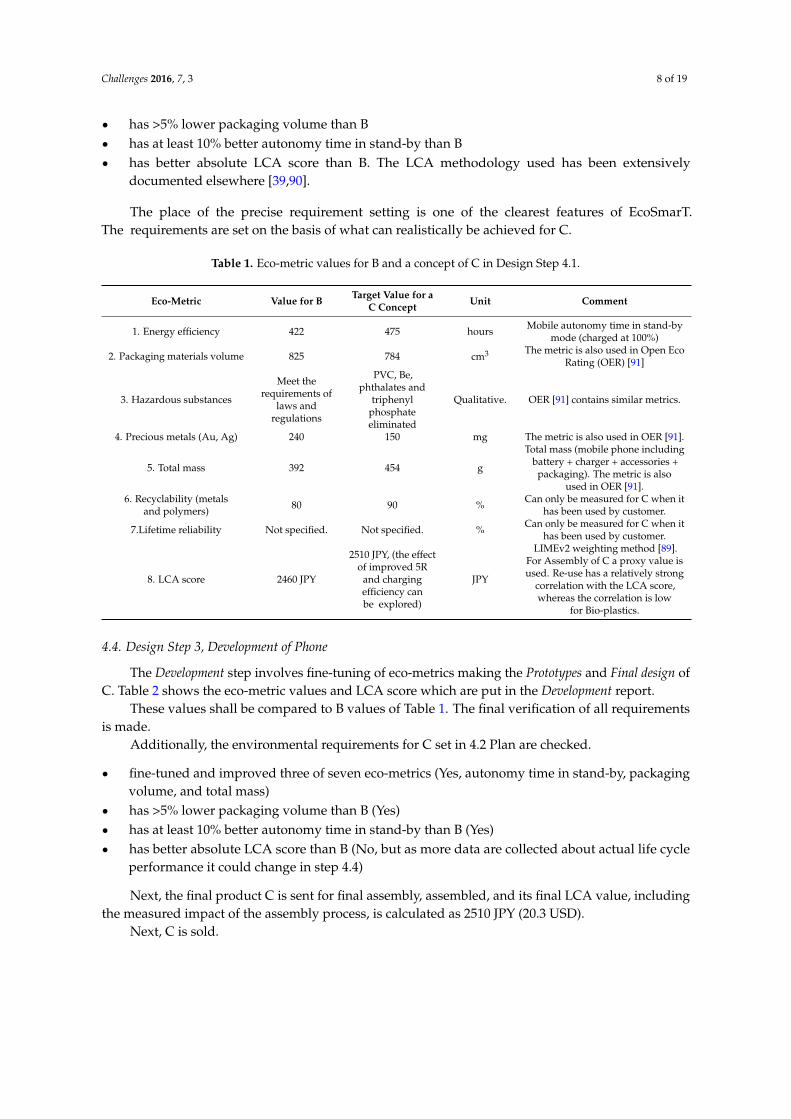
Table 4. Evolution of OER criteria (normalized scores) for smartphone models A, B, and C.
Criteria in Eco-Rating A B C Comment
Corporate Score based onEcoVadis criteria
(30% weight)5.0/10 5.1/10 5.8/10
Improvements: landfill rate, energyefficiency of wireless products, shipments
with green packaging, solar power generatedpower, number of recycling stations, number
of certified suppliersSimplified LCA proxy
score (30%) 5.2/10 4.9/10 5.3/10
GWP100 (15%) 5.4/10 4.5/10 3.7/10 Gradually larger and heavier phones
RMD (15%) 5.0/10 5.2/10 6.9/10 Gradually less amounts of gold, silver,tin, tantalum and indium per phone.
Sustainable materials (10%) 3.3/10 3.9/10 5.8/10 Improvements: elimination of PVC, Be,phthalates and triphenyl phosphate
Packaging & logisticsefficiency (7%) 3.6/10 4.1/10 6/10 Improvements: Paper and cardboard are
FSC certified and marked accordingly
Disposal impacts (3%) 0/10 0/10 0/10 Only >90wt% proven materialrecoverability render any points
Functionality 1/6 6/6 6/6 Improvement: replace need for digitalcompact camera
Total OER score 2.4/5 2.7/5 3.0/5 Improvement
C is larger than B and A and, thus, has a higher GWP100 score in the linear simplified model of OER. OERcannot fully reflect all relevant parameters of Full LCAs, e.g., 5R and renewable energy in the supply chain.This is one of the reasons why Full LCA scores can be different from OER scores. However, as GWP100 andRMD indicators have equal weight, C benefits from using smaller amounts of precious metals than B and A.
Challenges 2016, 7, 3 12 of 19
12/19
65
86
49
66
0
10
20
30
40
50
60
70
80
90
100
Climate protection Human Health Resource conservation
Total Score Environment
E 1 E 2 E 3 E
Results SASF Environment
phones based on their individual metrics (display area, silicon die sizes, battery capacity,
printed circuit boards area/number of copper layers, etc.);
SASF cannot calculate an individual footprint, e.g., 50 kg CO2e, for a mobile phone, nor
does it have the resolution for individual specific products, such as mobile phones,;
On the contrary, OER LCA and OER Functionality should be included as sub-criteria in the
SASF Environment if the SASF evolution is done for a mobile phone; and
SASF is a general company portfolio rating tool (horizontal) and OER (especially LCA, but
also most of the Responsible Design and Functionality) is a very specific rating tool (vertical)
for mobile phones.
Table 4. Evolution of OER criteria (normalized scores) for smartphone models A, B, and C.
Criteria in Eco-Rating A B C Comment
Corporate Score based
on EcoVadis criteria
(30% weight)
5.0/10 5.1/10 5.8/10
Improvements: landfill rate, energy efficiency of wireless products,
shipments with green packaging, solar power generated power, number of
recycling stations, number of certified suppliers
Simplified LCA proxy
score (30%) 5.2/10 4.9/10 5.3/10
GWP100 (15%) 5.4/10 4.5/10 3.7/10 Gradually larger and heavier phones
RMD (15%) 5.0/10 5.2/10 6.9/10 Gradually less amounts of gold, silver, tin, tantalum and indium
per phone.
Responsible Design
score (40% weight) 4.1/10 4.4/10 5.5/10
Product durability & life
extension (13%) 4.7/10 4.7/10 4.7/10
Power conservation (7%) 10/10 10/10 10/10
Sustainable materials
(10%) 3.3/10 3.9/10 5.8/10
Improvements: elimination of PVC, Be, phthalates and
triphenyl phosphate
Packaging & logistics
efficiency (7%) 3.6/10 4.1/10 6/10
Improvements: Paper and cardboard are FSC certified and
marked accordingly
Disposal impacts (3%) 0/10 0/10 0/10 Only >90wt% proven material recoverability render any points
Functionality 1/6 6/6 6/6 Improvement: replace need for digital compact camera
Total OER score 2.4/5 2.7/5 3.0/5 Improvement
C is larger than B and A and, thus, has a higher GWP100 score in the linear simplified model of OER.
OER cannot fully reflect all relevant parameters of Full LCAs, e.g., 5R and renewable energy in the
supply chain. This is one of the reasons why Full LCA scores can be different from OER scores.
However, as GWP100 and RMD indicators have equal weight, C benefits from using smaller
amounts of precious metals than B and A.
Figure 3. Huawei mobile devices SASF Total Score Environmental as sum of climate protection,
human health, and resource conservation scores.
Figure 3. Huawei mobile devices SASF Total Score Environmental as sum of climate protection, humanhealth, and resource conservation scores.
6. Discussion
6.1. Eco-Design Method EcoSmarT
The motivation for consumer electronics industry is branding and making the eco-friendly imagefit with the rest of the brand and, thereby, increase market share among the eco-aware consumers.
Challenges 2016, 7, 3 13 of 19
Policy initiatives are not the foremost drivers for innovative companies who want to make businesscases of the eco-friendly thinking. Complying with policy is mandatory, but what make the companiesand products different are the innovations.
This paper suggests that eco-design cannot be allowed to be a complicated and isolated side taskof the low cost/high performance driven design process.
It is important to be able to estimate the environmental impact in an easily-applicable andlogic manner.
Eco-design, therefore, is rather a check of the actual design and the ecology of the design can bemonitored by eco-metrics and rapid LCA. Specific eco-metrics have been, and can be, developedfor specific product groups based on detailed LCAs. This paper does not outline all possiblesub-eco-metrics for all kinds of electronics.
It is argued that improved design solutions cannot explicitly be deduced from LCA results. Theenvironmental improvements are driven by improvements of the eco-metrics and checked and rankedholistically by LCA. Many previous papers suggest that the LCA is the tool to guide the designer inthe right direction. Here it is argued that the designer is guided by customer-based requirements. Inaddition, most papers fail to show how the process of eco-innovation is carried out. It is very rare thatthe starting point for innovation is sustainability. Instead, the starting point is the features which thebuyers of the products desire. These features can include low use phase energy consumption.
In reality, for most design cases, we can just hope that the cost-driven efficiency thinking alsoleads to lower absolute environmental impact scores. Few improvements are actually driven byenvironmental factors. Energy efficiency is a border case but is mostly driven by lower electricity billsand convenience. Recently fast charging has emerged as an important customer requirement. Improvedfast charging efficiency could lead to power savings thanks to lower power dissipation [95]. In 2016,globally, tablets, smartphones, feature phones, and phablets will use 11–38 TWh for charging [1].We estimate that improved fast charging efficiency can reduce these by 7%, i.e., 0.77–2.7 TWh.
Natural technical developments, such as miniaturization, often automatically leads toenvironmental improvements, depending on the product at hand, without deliberate environmentalconsiderations [29]. Anyway, EcoSmarT helps checking if the profitability-driven design is alsoeco-efficient and sustainable.
The ICT industry could also occasionally benefit from environmental measures which are based onthe performance (capacity) of the product (system) as the system level efficiency has increased rapidlyover the years [1,35]. The challenge at hand is that, per piece, some products will exhibit an increasedenvironmental impact from generation to generation, but decreased impact per performance (capacity).Moreover, for multifunctional products it is challenging to estimate a normalized environmentalimpact. The normalized impact should be investigated whenever appropriate, e.g., by counting thenumber of functions. Anyway, the absolute impact shall always be investigated.
It will be impossible to reduce a product’s absolute environmental impact to zero with continuouseco-design improvements. It will however be possible to reduce the environmental impact per functionif the next generation product has more functions than the current generation, e.g., for storage devices,such as the universal serial bus (USB), it is apparent that the environmental impact per functionaloutput decreases, but for multifunctional equipment, such as smartphones, the corresponding decreaseis less apparent.
The proposed eco-design method EcoSmarT is limited to rather small product designs wherea predecessor has a clear successor and the method is not suitable for design of complex industrialsystems/solutions. An additional disadvantage is the lack of a procedure for weighting the eco-metricsand the LCA score. Additionally, the proposed method does not tell much about system wide effectsof the design changes.
It has to be judged from case to case if the environmental impact has been decreasedper functional capacity.
Challenges 2016, 7, 3 14 of 19
The sheer diversity of pressures that come to bear during the product development process canalso act as a barrier to adoption of eco-design. The present immediately applicable eco-design approachovercomes such pressures.
6.2. Emerging Approaches Which Complement EcoSmarT
Eco-ratings partly drive eco-innovation as shown in Table 4. One example is that a lesser amountof precious metals leads to a higher LCA score, lower material purchase costs, and higher OER score.
The simplified LCA score is not easily improved as currently calculated in OER. However, theapproach facilitates a balance between improved material efficiency and linearly increasing GWP100scores. In the next version of OER the possibility of adding renewable energy to the model would makethe OER closer to a full LCA and LCA used in EcoSmarT. Functionality and 5R are not integrated at themoment in the LCA section, but are to a certain degree in the Responsible Design section. Moreover,the use of renewable energy is included to some degree in the corporate section. In summary the unfairlimitations of OER LCA are not crucial for the overall OER score and all manufacturers will be treatedequally. OER aims at roughly right instead of precisely wrong. UL110 and OER both helped pushingC in a more sustainable direction. UL110 has a ranking system with e.g., Certified and Platinum levels,whereas OER is yet to establish the levels for different segments. Excluding the LCA section, it is notclear how UL110 specifies individual environmental profiles, making UL110 score comparisons ofcompanies rather than specific products. Including an LCA section, OER is more suitable for productcomparisons than UL110.
In a wider perspective it remains to be seen if eco-rating can replace other eco-evaluation toolsaltogether, within the design process of consumer electronics. Clearly, the OER method generally hasclearer possibilities of rewarding elimination of unsustainable materials than LCA.
7. Conclusions
This work concludes that:
‚ A low-barrier eco-design method for convenient measurement of eco-metrics has been presented;‚ Eco-innovation is successfully implemented in the mobile phone industry; and‚ Innovation of materials and energy supply are measured by LCA and eco-rating.
The proposed eco-design method makes eco-design of electronics and beyond a natural part ofthe product development process without extra costs and hindrance of ordinary design work. Usingthe eco-design method a company can show systematic quantifications of the environmental impactfrom one product generation to the next. The proposed method captures the essence of eco-designof electronic equipment and beyond in a straight-forward and cost-effective manner with enoughprecision for use as designer information.
The actual implementation/verification of eco-design changes is solved and moreover theproposed eco-design method does not require specific customization prior to use.
8. Next Steps
Eco-design/DFE is a rather vague design discipline, compared to other more explicit Design forX (X=cost, test, profitability, recycling, logistics, assembly, etc.) disciplines. Eco-design is a part of theactual design work and not the main target for most products. There is not one method, tool, andstrategy that work for all companies, and the best approach is determined by the targeted market [5].The present method shows how eco-metrics and rapid LCA can work practically in a design process.It is recommended to try the method in companies who perform development of electronic hardwareand beyond.
As far as emerging frameworks and tools for eco-evaluation, we suggest that SASF can be usedwithin OER as a proxy for the corporate score.
Challenges 2016, 7, 3 15 of 19
Universal Chargers?
As shown in Figure 2 the production of chargers is not a major contributor to the environmentalimpact of a mobile device [39,90]. Still, its share of the impact could be reduced by >80%.
Globally, per year, around 2.7 billion mobile phone and tablet devices, with one charger perdevice, are released into the market [1]. This number is expected to grow to more than 4 billion in2030 [1]. The average lifetime of the mobile devices and the chargers is around two years.
The mass, environmental cost, and greenhouse gas emissions of one charger is around 0.05 kg,1.4 JPY, and 0.036 kg CO2e, respectively [90]. Between 2016 and 2032, with business as usual, weestimate that 90 million tonnes of CO2e will be released and 2.8 million tonnes of charger e-waste willbe generated.
If, instead, the chargers for mobile devices were universal, i.e., could be used for any brand andany type of mobile phone and tablet, and would last five years, a total of around 2.5 million tonnes ofe-waste, 76 million tonnes of CO2e, and 24 billion USD of environmental costs could be avoided.
Despite uncertainties, this estimation shows that there is significant room for improvement, bothfor user-friendliness and for sustainable development. We recommend further studies clarifying therole of universal chargers in the circular economy.
In the future the definition of eco-innovation should be broadened, as the present one is toonarrow. Otherwise, it would be illustrative to provide other cases (e.g., automobiles and houseappliances) of product environmental improvements expanding the present rather rudimentary ideaof eco-innovation.
Moreover, occasionally a leaner design could use new materials which have a hidden use ofmaterials, energy, and land. Therefore, there should be a wider analysis of the trade-offs that could befound using, e.g., “ecological rucksack” [96] indicators, compared to LIME and GWP100.
Acknowledgments: Huawei Device is acknowledged for the idea for the paper and the data provided.Anonymous reviewers are greatly appreciated for comments, which improved this paper. We thank YasirAbdul Quadir for checking the paper and Guizhen Xu for discussions on the eco-design method.
Author Contributions: Anders S. G. Andrae wrote the paper and Mengjun Xia, Jianli Zhang and Xiaoming Tangcontributed with data on Huawei Device’s progress.
Conflict of Interest: The authors declare no conflict of interest.
References
1. Andrae, A.S.G.; Edler, T. On electricity usage of communication technology: Trends to 2030. Challenges 2015,6, 117–157. [CrossRef]
2. Silveira, G.T.; Chang, S.Y. Cell phone recycling experiences in the United States and potential recyclingoptions in Brazil. Waste Manag. 2010, 30, 2278–2291. [CrossRef] [PubMed]
3. Wong, S.K.S. The influence of green product competitiveness on the success of green product innovation:Empirical evidence from the Chinese electrical and electronics industry. Europ. J. Innov. Manag. 2012, 15,468–490.
4. Ramani, R.; Ramanujan, D.; Bernstein, W.Z.; Zhao, F.; Sutherland, J.; Handwerker, C.; Choi, J.K.; Kim, H.;Thurston, D. Integrated sustainable life cycle design: A review. J. Mech. Des. 2010, 132, 091004. [CrossRef]
5. Unger, N.; Schneider, F.; Salhofer, S. A review of eco-design and environmental assessment tools and theirappropriateness for electrical and electronic equipment. Prog. Ind. Ecol. Int. J. 2008, 5, 13–29. [CrossRef]
6. De Langhe, P.S.; Criel, S.; Ceuterick, D. Green design of telecom products: The ADSL high speed modem asa case Study. IEEE Trans. Comp. Pack. Manuf. Technol. Part A 1998, 21, 154–167. [CrossRef]
7. Nagel, M.H. Environmental supply-line engineering: Eco-supplier development coupled to eco-design—Anew approach. Bell Labs Tech. J. 1998, 3, 109–123. [CrossRef]
8. Andrae, A.S.G.; Östermark, U.; Liu, J. Life cycle assessment of a telecommunications exchange.J. Electron. Manuf. 2000, 10, 147–160. [CrossRef]
9. Mathieux, F.; Rebitzer, G.; Ferrendier, S.; Simon, M.; Froelich, D. Ecodesign in the European electronicsindustry—An analysis of the current practices based on cases studies. J. Sustain. Prod. Des. 2001, 1, 233–245.[CrossRef]
10. Alonso, J.C.; Rodrigo, J.; Castells, F. Design for environment of electrical and electronic automotivecomponents based on life cycle assessment. Gate EHS 2003, 17, 1–7.
11. De Caluwe, N. Business benefits from applied EcoDesign. IEEE Trans. Electron. Pack. Manuf. 2004, 27,215–220. [CrossRef]
12. Andrae, A.S.G.; Zou, G.; Liu, J. LCA of electronic products—An environmental assessment of galliumarsenide monolithic microwave integrated circuit system-in-a-package switch product. Int. J. Life Cycle Assess.2004, 9, 45–52. [CrossRef]
13. Chen, L.; Andrae, A.S.G.; Zou, G.; Liu, J. Characterization of substrate materials for system-in-a-package.J. Electron. Pack. 2004, 126, 195–201. [CrossRef]
14. Andrae, A.S.G.; Möller, P.; Anderson, J.; Liu, J. Uncertainty estimation by Monte Carlo simulation appliedto life cycle inventory of cordless phones and microscale metallization processes. IEEE Trans. Electron.Pack. Manuf. 2004, 27, 233–245. [CrossRef]
15. Andrae, A.S.G.; Andersson, D.R.; Liu, J. Significance of intermediate production processes in life cycleassessment of electronic products assessed using a generic compact model. J. Clean. Prod. 2005, 13, 1269–1279.[CrossRef]
16. Donnelly, K.; Beckett-Furnell, Z.; Traeger, S.; Okrasinski, T.; Holman, S. Eco-design implemented through aproduct-based environmental management system. J. Clean. Prod. 2006, 14, 1357–1367. [CrossRef]
17. Gurauskiene, I.; Varžinskas, V. Eco-design methodology for electrical and electronic equipment industry.Environ. Res. Eng. Manag. 2006, 3, 43–51.
18. Ekvall, T.; Andrae, A.S.G. Attributional and consequential environmental assessment of the shift to lead–freeSolders. Int. J. Life Cycle Assess. 2006, 11, 344–353. [CrossRef]
19. Aoe, T. Eco-efficiency and ecodesign in electrical and electronic products. J. Clean. Prod. 2007, 15, 1406–1414.20. Ge, C.P.; Wang, B. An activity-based modelling approach for assessing the key stakeholders’ corporation in
the eco-conscious design of electronic products. J. Eng. Design 2007, 18, 55–71.21. Andrae, A.S.G.; Itsubo, N.; Yamaguchi, H.; Inaba, A. Screening life cycle assessment of silver-based
conductive adhesive vs. lead-based solder and plating materials. Mater. Trans. 2007, 48, 2212–2218.[CrossRef]
22. Andrae, A.S.G.; Itsubo, N.; Inaba, A. Global environmental impact assessment of the Pb-free shift, Sold.Surf. Mount Technol. 2007, 19, 18–28. [CrossRef]
23. Andrae, A.S.G.; Itsubo, N.; Yamaguchi, H.; Inaba, A. Life cycle assessment of high-temperature Japaneseconductive adhesives. Environ. Sci. Technol. 2008, 42, 3084–3089. [CrossRef] [PubMed]
24. Schoenmakers, T.J.M.; De Caluwe, N. Green DNA. Ind. Eng. 2008, 40, 47–51.25. Cerdan, C.; Gazulla, C.; Raugei, M.; Martinez, E.; Palmer, P.F. Proposal for new quantitative eco-design
indicators: A first case study. J. Clean. Prod. 2009, 17, 1638–1643. [CrossRef]26. Muñoz, I.; Gazulla, C.; Bala, A.; Puig, R.; Fullana, P. LCA and ecodesign in the toy industry: Case study
of a teddy bear incorporating electric and electronic components. Int. J. Life Cycle Assess. 2009, 14, 64–72.[CrossRef]
27. Zhu, Q.; Liu, Q. Eco-design planning in a Chinese telecommunication network company. Benchm. Int. J.2010, 17, 363–377. [CrossRef]
28. Andrae, A.S.G.; Andersen, O. Life cycle assessments of consumer electronics—Are they consistent? Int. J.Life Cycle Assess. 2010, 15, 827–836. [CrossRef]
29. Andrae, A.S.G.; Andersen, O. Life cycle assessment of integrated circuit packaging technologies. Int. J. LifeCycle Assess. 2011, 16, 258–267. [CrossRef]
30. Yung, W.K.C.; Chan, H.K.; So, J.H.T.; Wong, D.W.C.; Choi, A.C.K.; Yue, T.M. A life-cycle assessment foreco-redesign of a consumer electronic product. J. Eng. Design 2011, 22, 69–85. [CrossRef]
31. Yang, J.; Chen, J.L. Accelerating preliminary eco-innovation design for products that integrates case-basedreasoning and TRIZ method. J. Clean. Prod. 2011, 19, 998–1006.
32. Lelah, L.; Mathieux, F.; Brissaud, D. Contributions to eco-design of machine-to-machine product servicesystems: The example of waste glass collection. J. Clean. Prod. 2011, 19, 1033–1044. [CrossRef]
33. Andrae, A.S.G. The effect of revised characterization indices for N2O and CO2 in life cycle assessment ofoptical fiber networks—The case of ozone depletion and aquatic acidification. J. Green Eng. 2012, 3, 12–32.
34. Ma, J.; Yin, F.; Liu, Z.; Zhou, X. The eco-design and green manufacturing of a refrigerator. Proc. Environ. Sci.2012, 16, 522–529. [CrossRef]
35. Andrae, A.S.G. Comparative micro life cycle assessment of physical and virtual desktops in a cloudcomputing network with consequential, efficiency, and rebound considerations. J. Green Eng. 2013, 3,193–218.
36. Chan, H.K.; Wang, X.; Chung, S.H. A fuzzy-AHP framework for evaluation of eco-design alternatives. Int. J.Innov. Manag. Technol. 2013, 4, 147–151.
37. Evrard, D.; Brissaud, D.; Mathieux, F. Synergico: A method for systematic integration of energy efficiencyinto the design process of electr(on)ic equipment. Int. J. Sust. Eng. 2013, 6, 225–238. [CrossRef]
38. Dufrene, P.; Zwolinski, P.; Brissaud, D. An engineering platform to support a practical integrated eco-designmethodology. CIRP Annal Manuf. Technol. 2013, 62, 131–134. [CrossRef]
39. Andrae, A.S.G.; Vaija, M.S. To which degree does sector specific standardization make life cycle assessmentscomparable?—The case of global warming potential of smartphones. Challenges 2014, 5, 409–429. [CrossRef]
40. Andersen, O.; Gilpin, G.; Andrae, A.S.G. Cradle-to-gate life cycle assessment of the dry etching step in themanufacturing of photovoltaic cells. AIMS Energ. 2014, 2, 410–423. [CrossRef]
41. Andrae, A.S.G. Method based on market changes for improvement of comparative attributional life cycleassessments. Int. J. Life Cycle Assess. 2015, 20, 263–275. [CrossRef]
42. Andrae, A.S.G. Comparative screening life cycle impact assessment of renewable and fossil power supplyfor a radio base station site. Int. J. Green Technol. 2015, 1, 258–267.
43. Rose, C.M.; Ishii, K. Product end-of-life strategy categorization design tool. J. Electron. Manuf. 1996, 9, 41–51.[CrossRef]
44. Bras, B. Incorporating environmental issues in product design and realization. Ind. Environ. 1997, 20, 7–13.45. Cramer, J.M.; Stevels, A.L.N. Strategic environmental product planning within Philips Sound & Vision.
Environ. Qual. Manag. 1997, 7, 91–102.46. Cramer, J. Towards innovative, more eco-efficient product design strategies. J. Sustain. Prod. Des. 1997, 1,
7–16.47. Stevels, A.L.N.; Ram, A.A.P.; Deckers, E. Take-back of discarded consumer electronic products from the
perspective of the producer: Conditions for success. J. Clean. Prod. 1999, 7, 383–389. [CrossRef]48. Umeda, Y.; Nonomura, A.; Tomiyama, T. Study on life-cycle design for the post mass production paradigm.
AI EDAM 2000, 14, 149–161. [CrossRef]49. Rose, C.M.; Stevels, A.; Ishii, K. Method for formulating product end-of-life strategies for electronics industry.
J. Electron. Manuf. 2002, 11, 185–196. [CrossRef]50. Rose, C.M.; Ishii, K.; Stevels, A. Influencing design to improve product end-of-life stage. Res. Eng. Des. 2002,
13, 83–93.51. Masui, K.; Sakao, T.; Kobayashi, M.; Inaba, A. Applying quality function deployment to environmentally
Concept of describing product recyclability in terms of environmental value. Int. J. Product. Res. 2003, 41,3649–3665.
53. Fujimoto, J.; Umeda, Y.; Tamura, T.; Tomiyama, T.; Kimura, F. Development of service-oriented productsbased on the inverse manufacturing concept. Environ. Sci. Technol. 2003, 37, 5398–5406. [CrossRef] [PubMed]
54. Bras-Klapwijk, R.M. Procedures and tools for generating and selecting alternatives in LCA. Int. J. LifeCycle Assess. 2003, 8, 266–272. [CrossRef]
55. Huisman, J.; Stevels, A.L.N.; Stobbe, I. Eco-efficiency considerations on the end-of-life of consumer electronicproducts. IEEE Trans. Electron. Pack. Manuf. 2004, 27, 9–25. [CrossRef]
56. Herrmann, C.; Eyerer, P.; Gediga, J. Economic and ecological material index for end-of-life and design ofelectronic products. IEEE Trans. Electron. Pack. Manuf. 2004, 27, 2–8. [CrossRef]
57. Dewulf, W.; Duflou, J.R. Integrating eco-design into business environments. Prod. Eng. 2005, 1, 55–76.58. Park, P.J.; Lee, K.M.; Wimmer, W. Development of an environmental assessment method for consumer
electronics by combining top-down and bottom-up approaches (11 pp). Int. J. Life Cycle Assess. 2006, 11,254–264. [CrossRef]
59. Boks, C. The soft side of ecodesign. J. Clean. Prod. 2006, 14, 1346–1356. [CrossRef]60. Huisman, J.; Stevels, A.L. Eco-efficiency of take-back and recycling, a comprehensive approach. IEEE Trans.
Electron. Pack. Manuf. 2004, 29, 83–90.61. Boks, C.; Stevels, A. Essential perspectives for design for environment. Experiences from the electronics
industry. Int. J. Prod. Res. 2007, 45, 4021–4039. [CrossRef]62. Grote, C.A.; Jones, R.M.; Blount, G.N.; Goodyer, J.; Shayler, M. An approach to the EuP Directive and
the application of the economic eco-design for complex products. Int. J. Prod. Res. 2007, 45, 4099–4117.[CrossRef]
63. Park, P.J.; Tahara, K. Quantifying producer and consumer-based eco-efficiencies for the identification of keyecodesign issues. J. Clean. Prod. 2008, 16, 95–104. [CrossRef]
64. Huisman, J.; Stevels, A. Eco-efficiency as a road-mapping instrument for WEEE implementation. Prog. Ind.Ecol. Int. J. 2008, 5, 30–43. [CrossRef]
65. Kunnari, E.; Valkama, J.; Keskinen, M.; Mansikkamäki, P. Environmental evaluation of new technology:Printed electronics case study. J. Clean. Prod. 2009, 17, 791–799. [CrossRef]
66. Boks, C.; McAloone, T.C. Transitions in sustainable product design research. Int. J. Prod. Dev. 2009, 9,429–449. [CrossRef]
67. Wong, Y.L.; Lee, K.M.; Yung, K.C. Model scenario for integrated environmental product assessment at theuse of raw materials stage of a product. Res. Cons. Rec. 2010, 54, 841–850.
68. Kishita, Y.; Low, B.H.; Fukushige, S.; Umeda, Y.; Suzuki, A.; Kawabe, T. Checklist-based assessmentmethodology for sustainable design. J. Mech. Design 2010, 132, 091011. [CrossRef]
69. Arnold, M.G.; Hockerts, K. The greening dutchman: Philips’ process of green flagging to drive sustainableinnovations. Bus. Strat. Environ. 2011, 20, 394–407. [CrossRef]
70. Kurunsaari, H.; Bu, Z. Eco-control in the Japanese manufacturing industry: A case study of Toyota andPanasonic. Bus. Rev. 2011, 62, 63–86.
71. Umeda, Y.; Takata, S.; Kimura, F.; Tomiyama, T.; Sutherland, J.W.; Kara, S.; Duflou, J.R. Toward integratedproduct and process life cycle planning—An environmental perspective. CIRP Ann. Manuf. Technol. 2012, 61,681–702. [CrossRef]
72. Staniškis, J.; Arbaciauskas, V.; Varžinskas, V. Sustainable consumption and production as a system:Experience in Lithuania. Clean Technol. Environ. Pol. 2012, 14, 1095–1105.
73. Rasamoelina, F.; Bouchard, C.; Aoussat, A. Towards a kansei-based user modeling methodology foreco-design. Int. J. Affect. Eng. 2013, 12, 337–348. [CrossRef]
74. Siderius, P.J.S.; Nakagami, H. A MEPS is a MEPS is a MEPS: Comparing ecodesign and top runner schemesfor setting product efficiency standards. Energ. Efficiency 2013, 6, 1–19.
75. Aschehoug, S.H.; Boks, C. Towards a framework for sustainability information in product development.Int. J. Sust. Eng. 2013, 6, 94–108. [CrossRef]
76. Elduque, D.; Javierre, C.; Pina, C.; Martínez, E.; Jiménez, E. Life cycle assessment of a domestic inductionhob: Electronic boards. J. Clean. Prod. 2014, 76, 74–84. [CrossRef]
77. Bakker, C.; Wang, F.; Huisman, J.; Den Hollander, M. Products that go round: Exploring product life extensionthrough design. J. Clean. Prod. 2014, 69, 10–16. [CrossRef]
78. De Felice, F.; Elia, V.; Gnoni, M.G.; Petrillo, A. Comparing environmental product footprint for electronicand electric equipment: A multi-criteria approach. Int. J. Sust. Eng. 2014, 7, 360–373. [CrossRef]
79. Vasan, A.; Sood, B.; Pecht, M. Carbon footprinting of electronic products. Appl. Energ. 2014, 136, 636–648.[CrossRef]
80. Li, J.; Zeng, X.; Stevels, A. Ecodesign in consumer electronics: Past, present, and future. Crit. Rev. Environ.Sci. Technol. 2015, 45, 840–860. [CrossRef]
81. Hischier, R. Life cycle assessment study of a field emission display television device. Int. J. Life Cycle Assess.2015, 20, 61–73. [CrossRef]
82. Kuo, T.C.; Smith, S.; Smith, G.C.; Huang, S.H. A predictive product attribute driven eco-design process usingdepth-first search. J. Clean. Prod. 2015. in press.
83. Chiang, T.A.; Che, Z.H. A decision-making methodology for low-carbon electronic product design.Decis. Support Syst. 2015, 71, 1–13. [CrossRef]
84. Wu, Y.H.; Ho, C.C. Integration of green quality function deployment and fuzzy theory: A case study ongreen mobile phone design. J. Clean. Prod. 2015, 108, 271–280. [CrossRef]
85. Meyer, D.E.; Katz, J.P. Analyzing the environmental impacts of laptop enclosures using screening-level lifecycle assessment to support sustainable consumer electronics. J. Clean. Prod. 2016, 112, 369–383. [CrossRef]
86. Ardente, F.; Mathieux, F. Identification and assessment of product's measures to improve resource efficiency:The case-study of an energy using product. J. Clean Prod. 2014, 83, 126–141. [CrossRef]
87. Cheung, W.M.; Marsh, R.; Griffin, P.W.; Newnes, L.B.; Mileham, A.R.; Lanham, J.D. Towards cleanerproduction: A roadmap for predicting product end-of-life costs at early design concept. J. Clean. Prod. 2015,87, 431–441. [CrossRef]
88. Finkelstein, M. Failure rate and mean remaining lifetime. In Failure Rate Modelling for Reliability and Risk;Finkelstein, M., Ed.; Springer-Verlag London Limited: London, UK, 2008; Volume 1, pp. 9–44.
89. Itsubo, N.; Sakagami, M.; Kuriyama, K.; Inaba, A. Statistical analysis for the development of national averageweighting factors—Visualization of the variability between each individual’s environmental thoughts. Int. J.Life Cycle Assess. 2012, 17, 488–498.
90. Andrae, A.S.G. A review of methodological approaches for life cycle assessment (LCA) of consumerelectronics. IEEE Consum. Electron. Mag. 2016, 5, 51–60. [CrossRef]
91. Forum for the Future. Open Eco Rating (V3)—A User Guide—September 2015. Available online:https://www.forumforthefuture.org/sites/default/files/Open_Eco_Rating_User_Guide.pdf (accessed on 3December 2015).
92. Huawei. Sustainability Report 2014. Available online: http://www-file.huawei.com/~/media/CORPORATE/PDF/Sustainability/2014%20Huawei%20sustainability%20report-final.pdf?la=en (accessed on 3December 2015).
93. Underwriters Laboratories. Interim Sustainability Requirements (ISR) for Mobile Phones; UL ISR 110:Northbrook, IL, USA, 2011.
94. Global e-Sustainability Initiative (GeSI). Sustainability Assessment Standard Framework (SASF) 2015.Available online: http://gesi.org/portfolio/project/81 (accessed on 3 December 2015).
95. Krieger, E.M.; Arnold, C.B. Effects of undercharge and internal loss on the rate dependence of battery chargestorage efficiency. J. Power Sources 2012, 210, 286–291. [CrossRef]
96. Aoe, T.; Michiyasu, T. “Ecological rucksack” of high-definition TVs. Mater. Trans. 2005, 46, 2561–2566.[CrossRef]