25
Portfolio Management Specific Interest Group Andy Ingleby Essentials, Operations, AstraZeneca 20 th March 2012 Practical Experiences of Portfolio Management
| Date post: | 22-Jul-2015 |
| Category: |
Business |
| Upload: | association-for-project-management |
| View: | 195 times |
| Download: | 0 times |

Portfolio Management Specific Interest Group
Andy InglebyEssentials, Operations, AstraZeneca 20th March 2012
Practical Experiences of Portfolio Management

“However beautiful the strategy………you should occasionally look at the
results”
Sir Winston Churchill.
2

Objective : Share the learning from our Journey to date …………so it can be applied!!
• Journey of Continuous Improvement in one part of AstraZeneca – AZ Essentials
• Focus on Portfolio Management but within the context of other P3 improvement- Governance- Project & Programme Management- Benefits Management
• Initiated in April 2009…..a Journey that has evolved……and continues
• No claim to be class leading…….typical of many organisations?
3

What is AZ Essentials?
• Global/Regional Operations Service delivery Organisation
• ~1000 employees + additional outsourced service providers
• A diverse set of capabilities including:- Facilities Management (Hard & Soft services)- Safety, Health, Environment & Wellbeing- Engineering Projects- Engineering Technology- Real Estate- Security- Operational Excellence
• Very variable P3 maturity in 2009/10
4

What were our drivers for change?
• AstraZeneca payer and government price pressures
• Increasingly more challenging regulatory environment
• At Essentials level - desire to better understand & track delivery of strategy
• Need for greater demonstration of value & visibility of project/programme delivery & performance across diverse set of functions
• Need to ensure success by ensuring we have the right skills & capabilities delivering the right change for both our customers & ourselves
• Clear Sponsorship & Functional Leadership
5 Name, Department

Essentials P3 Governance Network
Mission/Purpose:
• Create a visible Essentials Portfolio – to represent P3 delivery across the AZ Essentials organization (and any associated groups)
• Identify, agree and establish best P3 practice & Governance in the Essentials functions
• Provide assurance to the Essentials board and it’s customer groups that P3 delivery (across the entire change lifecycle) is to the highest standards
• Establish performance monitoring (KPI’s) within/across capabilities, and identify opportunities for Continuous Improvement in P3 processes
• Benefits Realisation - Ensure processes are in place to define and realise benefits from P3 management
• Support decision making - enable the Essentials board to make the best decisions on their portfolio – via the PMO
Vision:‘To ensure Essentials Projects and Programmes are delivered to industry leading
standards within all functions’
6
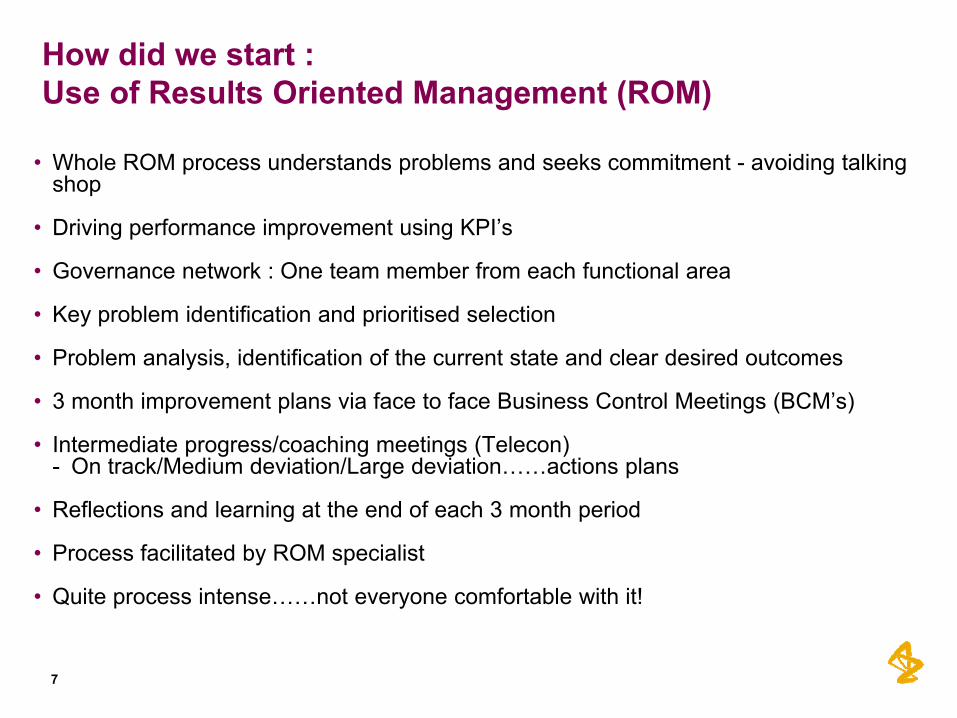
How did we start : Use of Results Oriented Management (ROM)
• Whole ROM process understands problems and seeks commitment - avoiding talking shop
• Driving performance improvement using KPI’s
• Governance network : One team member from each functional area
• Key problem identification and prioritised selection
• Problem analysis, identification of the current state and clear desired outcomes
• 3 month improvement plans via face to face Business Control Meetings (BCM’s)
• Intermediate progress/coaching meetings (Telecon)- On track/Medium deviation/Large deviation……actions plans
• Reflections and learning at the end of each 3 month period
• Process facilitated by ROM specialist
• Quite process intense……not everyone comfortable with it!
7

Portfolio Problem Statement
8
Problem analysis/Defining the problem – KP 3 3rd Nov 09 Problem statement: We don’t know that we’re doing the right projects & programmes
A: Roles & Responsibilities (programme & portfolio) F:Early Project Identification B: Common Language & G: Resources Definitions (People & money) C: What is the H: Portfolio Essentials Portfolio Management (Local vs Essentials) Tools (prioritization
& process) clarity on total resources, clarity on prioritization, maintain portfolio ‘flow’
D: Fit with other strategies (Customer & Internal depts.) E: The Essentials Strategy
Desired Outcome by Q2 2010:
The Essentials board knows it’s doing the
right projects & programmes
(this problem not about doing the programmes and
projects right)

The First Portfolio Data Snapshot
• 700 projects…….have we identified them all? Apples and pears?
• Little visibility of benefits expected or for whom they are delivered
• 75% projects had a Project Manager identified
• <20% projects had a Sponsor identified
• No visible identification of which projects were part of strategic programmes
• >90% projects could identify the stage they were at(aligned to the AZ Project Management Framework)
• No data on project skills levels. Little data on the costs of smaller projects.
• Data availability for capital projects generally better than for revenue ones.
• Data robustness a concern
• Belief that better data was available..….we hadn’t collected it.9
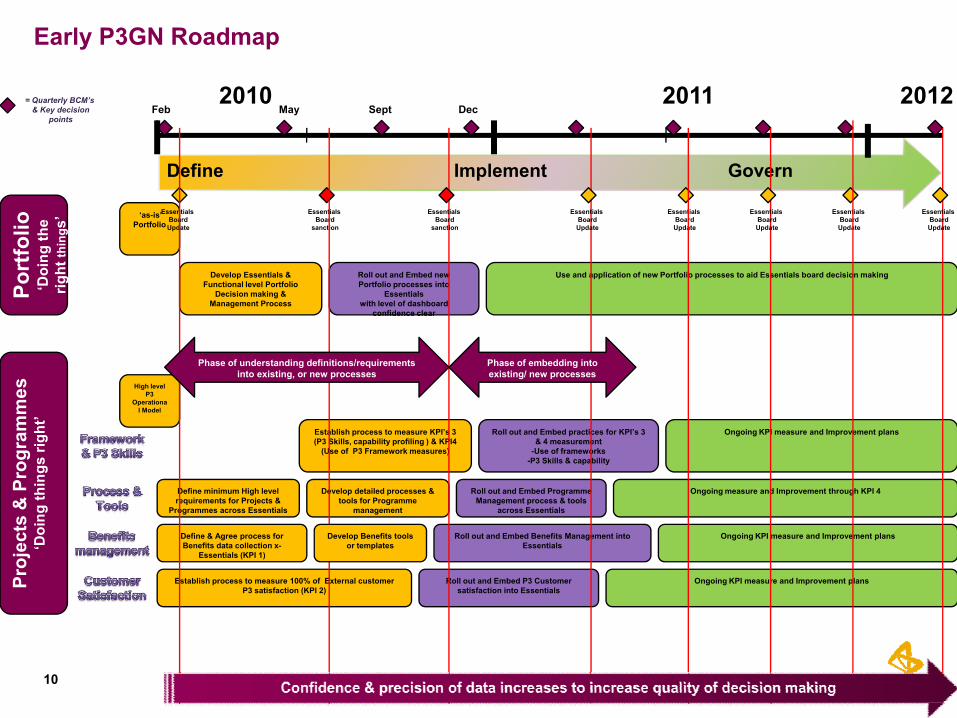
Early P3GN Roadmap
2010
Define Implement Govern
2011 2012Feb Dec
‘as-is’ Portfolio
Develop Essentials & Functional level Portfolio
Decision making & Management Process
EssentialsBoard
sanction
Define minimum High level requirements for Projects &
Programmes across Essentials
= Quarterly BCM’s& Key decision
points
EssentialsBoardUpdate
High level P3
Operational Model
Define & Agree process for Benefits data collection x-
Essentials (KPI 1)
Port
folio
‘Doi
ng th
e rig
ht th
ings
’
Proj
ects
& P
rogr
amm
es‘D
oing
thin
gs ri
ght’
Roll out and Embed new Portfolio processes into
Essentialswith level of dashboard
confidence clear
Use and application of new Portfolio processes to aid Essentials board decision making
May Sept
Establish process to measure 100% of External customer P3 satisfaction (KPI 2)
Roll out and Embed Benefits Management into Essentials
Ongoing KPI measure and Improvement plans
Roll out and Embed P3 Customer satisfaction into Essentials
Develop detailed processes & tools for Programme
management
Ongoing measure and Improvement through KPI 4
Establish process to measure KPI’s 3 (P3 Skills, capability profiling ) & KPI4
(Use of P3 Framework measures)
Roll out and Embed practices for KPI’s 3 & 4 measurement
-Use of frameworks-P3 Skills & capability
Ongoing KPI measure and Improvement plans
Ongoing KPI measure and Improvement plans
Develop Benefits tools or templates
Roll out and Embed Programme Management process & tools
across Essentials
EssentialsBoard
sanction
EssentialsBoardUpdate
EssentialsBoardUpdate
EssentialsBoardUpdate
EssentialsBoardUpdate
EssentialsBoardUpdate
Phase of understanding definitions/requirements into existing, or new processes
Phase of embedding into existing/ new processes
10
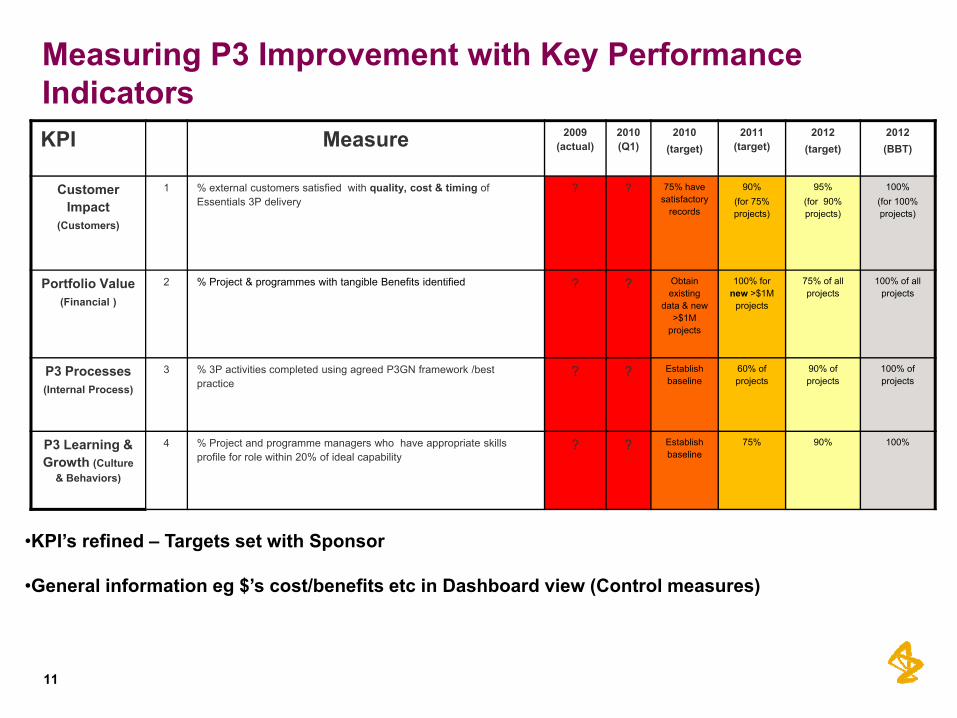
Measuring P3 Improvement with Key Performance IndicatorsKPI Measure 2009
(actual)2010 (Q1)
2010(target)
2011 (target)
2012(target)
2012 (BBT)
Customer Impact
(Customers)
1 % external customers satisfied with quality, cost & timing of Essentials 3P delivery
? ? 75% have satisfactory
records
90% (for 75% projects)
95%(for 90% projects)
100%(for 100% projects)
Portfolio Value(Financial )
2 % Project & programmes with tangible Benefits identified ? ? Obtain existing
data & new >$1M
projects
100% for new >$1M
projects
75% of all projects
100% of all projects
P3 Processes(Internal Process)
3 % 3P activities completed using agreed P3GN framework /best practice
? ? Establish baseline
60% of projects
90% of projects
100% of projects
P3 Learning & Growth (Culture
& Behaviors)
4 % Project and programme managers who have appropriate skills profile for role within 20% of ideal capability
? ? Establish baseline
75% 90% 100%
•KPI’s refined – Targets set with Sponsor
•General information eg $’s cost/benefits etc in Dashboard view (Control measures)
11

Portfolio Management – The Basic Principles
Demand• New Demand on Essentials and it’s
Functions via Business Engagement, or Internal/External Strategic Change
Prioritise• Assess Value (Benefit, Cost &
Risks*), Demand vs Capacity
Manage• Status, Risks, Strategy
Impacts/changes, Stop/maintain/must-win quicker
decisions
Demonstrate• Clearly demonstrate planned &
delivered benefits via Functions and Essentials
‘Dashboard
The Basic principles of Portfolio Management at both the Functionaland single Essentials Portfolio levels
* See value prioritisation slide12

Data Collection Challenges
• Early data collection time consuming based on spreadsheets- Need for clarity about minimum needs- Need for clear definitions- Risk of disengaging Project Managers with onerous & changing data
requirements
• Recognition of the need for a more efficient data management tool- Project in its own right
• Important the basic processes were established before looking at tools
• Need for consistency at project/programme level - key to understanding portfolio value- common language for benefits
13

14
All Essentials Programmes, Projects and Change Activities realise their
planned benefits.
Benefits Management Vision

Assessing the Value of what we plan to deliver will allow for clear understanding and Prioritisation of all projects and programmes within and across Essentials functions (Capital, Revenue, Business Change, IT, Technology)
Business Value
of projectprogramme or
change
RiskCost
Benefit
Tangible $’s
Resources, capital, revenue
($’s)
Probabilityof success
(%)
Business Investment Options, Value and Benefits
F(n) and
15

What are the Benefits of my Project or Programme…..? Examples to help understanding of the different types of benefit
June 16, 200916
Name, Department
Benefits are the advantageous outcomes from Projects and Programmes that will be delivered to the business and by which success of the investment will be measured.
FINANCIAL - Cost Reduction / SavingReduction in future operating budget vs. a current cost resulting in $ savings. Includes reduction in headcount or operating cost removed from a cost centre and should be described in terms of
a measure e.g. %, FTEs and $ cost saving.
Financial benefits are measurable and directly impact operating budgets
Qualitative benefits are difficult to substantiate and measure.
INDIRECT FINANCIAL - Cost AvoidanceAn indirect benefit that can be measured. Avoidance of capital spend ($) that is budgeted for or future spend not budgeted .
Include savings in capital investment, avoidance of expenditure on assets or fines. and should be described in both terms of a
measure (e.g.) $ saving.
Reputational / EthicalMay result in an enhanced corporate image, but not directly contributable to shareprice. For example,
Media coverage, Environmental, Corporate Governance.
Legal / PoliticalA benefit that ensure AZ are compliant with
legislative changes, but not directly contributable to shareprice.
Strategic / Competitive AdvantageBringing new advantages and opportunity to the
future AZ business/Operation, but there is uncertainly in the measurable impact at an early
stage.
FINANCIAL – Income generationOpportunity for potential income generation for AZ resulting in $
savings. Includes disposal of property or surplus equipment/assets and should be described in terms of a
measure e.g. $ income to AZ.
Other Quantitative benefits
INDIRECT – Efficiency / SavingMeasurable, but not possible to calculate impact on bottom line
costs. Improved efficiency or productivity in future operating processes vs. a current process resulting in some measurable
benefit Includes improved Productivity, Quality, Speed, KPI measures and should be described in terms of a measure (e.g.) time, an increase in staff motivation/feeling/Focus measures.
17
• Individuals may strive for outcomes that favour their own endeavours
• Tendency for over optimism about the planned benefits & underestimate costs and timing – optimism bias
• Risk of “benefits being overforcast in order to justify tenuous programmes for self serving ends and in the worst cases, to satisfy over-zealous egos” –2009 Financial Times/Moorhouse Benefits Management Survey……....Could it happen here?
• Cultural pressures to deliver financial hurdle rates of return, even when business circumstances change – rather than stop the project/change
• Do we have the right climate to allow the necessary constructively challenging conversations to happen and do we have the courage to have those conversations………?
Recognise the behaviours – external learning

P3MT Solution components
Project Server
Portfolio Analytics & Selection
Resource Management
Schedule Management
Issue & Risk Management
Team Collaboration
Time Reporting
Business Intelligence &
Reporting
Program Management
Demand Management
Executives Resource Managers
Team Members
Project Managers / Planners
Line of Business Systems
Corporate Project Solutions Microsoft Project Server, SharePoint, P3M Consulting

Unify Project and Portfolio Management
Corporate Project Solutions Microsoft Project Server, SharePoint, P3M Consulting
Transitioning to Business as Usual
• Organisational change prompting move to BAU- Recognition of Portfolio managers roles in each function- Governance of P3
• Further focused improvement still needed
• Training delivered across the organisation - 200 people- Practitioner Training- Awareness Training - Significant effort
• External consultant health check to identify any significant gaps
• Learning review
20

Transition to BAU – Initial P3 Operational Model
Functional level
(Managed within own Leadership
team) Global Engineering
Projects
Engineering Technology
FM Real Estate SHE Operational Excellence
Security
Proprietary and Confidential © AstraZeneca 2008FOR INTERNAL USE ONLYDelivered (Closed) – Year to Date
Total # Projects 20
Total $ cost Portfolio 1,800,000
Total $ Benefits of Portfolio 3,000,000
No Projects at Stage
Justify 20 Initiate 4 Plan 35 Execute 156 Close 20
No projects at Status
RedAmberGreen
1055
RedAmberGreen
004
RedAmberGreen
10025
RedAmberGreen
15600
Example of Customer Portfolio DashboardForecast (Initiate, Plan, Execute stages) to Year End
Total # Projects 195
Total $ cost Portfolio 45,818,000
Total $ Benefits of Portfolio 90,000,000
Current Portfolio Status for Customer
Portfolio OverviewFor Customer
Portfolio Shape(Execute & closed projects)
Portfolio by Function
0200400600
Customer
Financial
Process
Capability & Learning
Customer Portfolio shape(Execute & closed projects)
ideal projectsNo. projects
Caution! Fictional data only for illustration purposes
020406080
100120140
Number projects
CNSP
CVGIRIRA
CIRA0
20406080
100120140
Cost of Portfolio
CNSP
CVGI
RIRA
CIRA0
20406080
100120140
Total Benefits ($000's)
CNSP
CVGIRIRA
CIRA
Proprietary and Confidential © AstraZeneca 2008FOR INTERNAL USE ONLYDelivered (Closed) – Year to Date
Total # Projects 20
Total $ cost Portfolio 1,800,000
Total $ Benefits of Portfolio 3,000,000
No Projects at Stage
Justify 20 Initiate 4 Plan 35 Execute 156 Close 20
No projects at Status
RedAmberGreen
1055
RedAmberGreen
004
RedAmberGreen
10025
RedAmberGreen
15600
Example of Customer Portfolio DashboardForecast (Initiate, Plan, Execute stages) to Year End
Total # Projects 195
Total $ cost Portfolio 45,818,000
Total $ Benefits of Portfolio 90,000,000
Current Portfolio Status for Customer
Portfolio OverviewFor Customer
Portfolio Shape(Execute & closed projects)
Portfolio by Function
0200400600
Customer
Financial
Process
Capability & Learning
Customer Portfolio shape(Execute & closed projects)
ideal projects
No. projects
Caution! Fictional data only for illustration purposes
020406080
100120140
Number projects
CNSPCVGI
RIRA
CIRA0
20406080
100120140
Cost of Portfolio
CNSP
CVGI
RIRACIRA
020406080
100120140
Total Benefits ($000's)
CNSP
CVGI
RIRACIRA
Proprietary and Confidential © AstraZeneca 2008FOR INTERNAL USE ONLYDelivered (Closed) – Year to Date
Total # Projects 20
Total $ cost Portfolio 1,800,000
Total $ Benefits of Portfolio 3,000,000
No Projects at Stage
Justify 20 Initiate 4 Plan 35 Execute 156 Close 20
No projects at Status
RedAmberGreen
1055
RedAmberGreen
004
RedAmberGreen
10025
RedAmberGreen
15600
Example of Customer Portfolio DashboardForecast (Initiate, Plan, Execute stages) to Year End
Total # Projects 195
Total $ cost Portfolio 45,818,000
Total $ Benefits of Portfolio 90,000,000
Current Portfolio Status for Customer
Portfolio OverviewFor Customer
Portfolio Shape(Execute & closed projects)
Portfolio by Function
0200400600
Customer
Financial
Process
Capability & Learning
Customer Portfolio shape(Execute & closed projects)
ideal projects
No. projects
Caution! Fictional data only for illustration purposes
020406080
100120140
Number projects
CNSP
CVGI
RIRA
CIRA0
20406080
100120140
Cost of Portfolio
CNSP
CVGIRIRA
CIRA0
20406080
100120140
Total Benefits ($000's)
CNSP
CVGI
RIRA
CIRA
Dashboard views may be tailored to show Customer/Stakeholder specific functional projects/programmes
Essentials Board-Ownership of Essentials Portfolio and alignment decisions to fit
Essentials and Customers Strategies-x-Essentials issue resolution that cannot be resolved by PMG
Awareness of all Projects, Programmes and issues that cannotbe resolved within the function are escalated to PMG
Awareness of One Essentials Portfolio& it’s performance, issues that cannot be resolved within PMG are escalated
Essentials Portfolio Management Group (PMG)
-Ensure x-Essentials P3 Governance & Assurance-Drive P3 Continuous Improvement & Performance through KPI’s
-Access to the ‘right’ P3 & Change Skills at the ‘right’ time-Demonstrate Essentials Value Proposition for Capital & Revenue portfolios through
support & challenge-Drive realisation of Benefits
-Drive success of x-Essentials projects/programmes
Proprietary and Confidential © AstraZeneca 2008FOR INTERNAL USE ONLYDelivered (Closed) – Year to Date
Total # Projects 20
Total $ cost Portfolio 1,800,000
Total $ Benefits of Portfolio 3,000,000
No Projects at Stage
Justify 20 Initiate 4 Plan 35 Execute 156 Close 20
No projects at Status
RedAmberGreen
1055
RedAmberGreen
004
RedAmberGreen
100
25
RedAmberGreen
15600
Full Portfolio DashboardForecast (Initiate, Plan, Execute stages) to Year End
Total # Projects 195
Total $ cost Portfolio 45,818,000
Total $ Benefits of Portfolio 90,000,000
Current Portfolio Status
Portfolio Overview
Portfolio Shape(Execute & closed projects)
0
50000
100000
150000
200000
250000
Cos
t USD
($00
0's)
Essentials function
Project Cost by Function
Cap ab ility & Lea rnin g
Pro ces s
Finan cial
Cus tomer
No . p roje cts
id eal p ro jects
Portfolio by Function
0
20000
40000
60000
80000
100000
120000
Ben
efits
($'s
)
Essentials Function
Project benefits by Function
Capability & Learni ng
Process
Financial
Customer
020406080
100120140
No.
proj
ects
Projects by Function
Customer Financial
Process Capabili ty & Learning
0200400600
Customer
Financial
Process
Capability & Learning
Essentials Portfolio shape(Execute & closed projects)
ideal projects
No. projects
Caution! Fictional data only for illustration purposes
Board Decision makingAllocation &/or re-allocation
of revenue budget & resources across Essentials
functions
PMG Decision making -Actions to address
Governance issues, KPIs as required
-Access to the right skills and resources
-Stop, Hold, Go, Action Decisions for Prioritised x-
Essentials Projects and Programmes
Demand
Prioritise
Manage
Demonstrate
Demand
Prioritise
Manage
Demonstrate
X-Essentials Strategy
& Direction
GE Project
s
Chaired by Head of Operational Excellence
OpeX
Portfolio manger
Tech
FM
RE
SHE
Security
Portfolio manger
Portfolio manger
Portfolio manger
Portfolio manger
Portfolio manger
Portfolio manger
Portfolio manger
Portfolio manger
Portfolio manger

Critical Success Factors
Progress % along the journey after 15 months:
• Portfolio visibility & establishment of best practice – 60%
• Benefits realisation, processes in place to define and realise benefits – 50%
• Develop the skills and capability to enable professional P3 – 10%
• Establish KPI based performance monitoring – 45%
• Enable effective portfolio decision making – 20%
• Overall 30% complete on a long journey of continuous improvement.
22 Name, Department

Current Status
• Population of the portfolio tool and training to use it underway
• Sponsor training underway
• Project Management capability assessment completed
• Increased focus on prioritisation at company level has put us in a good position to use our learning for broader benefit
• Key components of project/change Governance best practice* are now being addressed
* Directing Change : A guide to governance of Project Management
23

Learning from our journey• Successes
- Significant improvements have been made- Active Sponsorship and leadership commitment were vital to the delivery of
improvement- ROM enabled focused progress & improvement- We’ve used external best practice and our lessons learned have been/are being
applied elsewhere- We’ve adapted & evolved the approach to changing needs and when things
didn’t work well- Empowering workstream sub teams- Have a sense/sanity check from experts – consultant was helpful to us- Recognition that things have moved on and we can empower others to own
future P3 change
• Challenges- Getting basic data is difficult- Having clear definitions prior to collecting any data- Original remit was unrealistic – Portfolio management decision making is
impossible without the data and the right organisational maturity- Ensuring roles very clear from the outset – it’s clear when recommendations
made as to whose role it is to make decisions- We had a learning journey for the ROM process – early energy in - took some
time find how the process worked well for this team.- To ensure continued support for future decision making
24

Confidentiality Notice This file is private and may contain confidential and proprietary information. If you have received this file in error, please notify us and remove it from your system and note that you must not copy, distribute or take any action in reliance on it. Any unauthorized use or disclosure of the contents of this file is not permitted and may be unlawful. AstraZeneca PLC, 15 Stanhope Gate, W1K 1LN, London, UK, Tel: +44(0)20 7304 5000, Fax: +44 (0)20 7304 5151, www.astrazeneca.com
25


