353
ESPON.2.2.2 Pre-accession Aid Impact Analysis Third Interim Report August 2004 PART I: Summary
| Date post: | 15-Mar-2019 |
| Category: |
Documents |
| Upload: | vuongduong |
| View: | 214 times |
| Download: | 0 times |

ESPON.2.2.2
Pre-accession Aid Impact Analysis
Third Interim Report
August 2004
PART I: Summary

ii
Submitted by IRS, Lead Partner
The report is based on contributions by: IRS EPRC RDI CRT EUROREG CRS HAS
Contact Details: Institute for Regional Development and Structural Planning Flakenstraße 28 – 31, D-15537 Erkner Tel: 00 49 3362 793 152 Fax: 00 49 3362 793 111 e-mail: [email protected]

iii
This report represents the interim results
of a research project conducted within the
framework of the ESPON 2000-2006
programme, partly financed through the
INTERREG programme.
The partnership behind the ESPON
programme consists of the EU
Commission and the Member States of the
EU25, plus Norway and Switzerland. Each
partner is represented in the ESPON
Monitoring Committee.
This report does not necessarily reflect
the opinion of the members of the
Monitoring Committee.
Information on the ESPON programme
and projects can be found on
www.espon.lu
The web side provides the possibility to
download and examine the most recent
document produced by finalised and
ongoing ESPON projects.
This report only exists in an electronic
version.
© The ESPON Monitoring Committee and
the partners of the projects mentioned.
Printing, reproduction or quotation is
authorized provided the source is
acknowledged and a copy is forwarded to
the ESPON Coordination Unit in
Luxembourg.

iv
ESPON 2.2.2. Project Partners IRS – Institute for Regional Development and Structural Planning
Flakenstr. 28-31, 15537 Erkner, Germany
Responsible Staff: Dr. Hans Joachim Kujath, Dr. Sabine Zillmer, Kirsten Kunkel
EPRC – European Policies Research Centre
University of Strathclyde; 40 George Street; Glasgow G1 1QE; UK
RDI - Institute of Regional Development
130 Sygrou Avenue, 176 71 Kallithea, Greece
CRT - Centre for Regional and Tourism Research
Stenbrudsveij 55, 3730 Nexö, Denmark
EUROREG - Centre for European Regional and Local Studies
University of Warsaw, ul. Krakowskie Przedmiescie, 30, 00927 Warsaw, Poland
CRT HAS - Centre for Regional Studies of the Hungarian Academy of Sciences
Bazsarózsa u. 70., 1141 Budapest, Hungary
BBR – Bundesamt für Bauwesen und Raumplanung
Deichmannsaue 31-37, 53179 Bonn, Germany
v
Table of Contents Part I
1 Executive Summary……………………………………….…………………………………...vi
1.1 Summary of Interim Report's Contents………………………………………………………..vi
1.2 Indicative Policy Recommendations…………………………………………………………xviii
2 Scientific Summary………………………………………………………………………...xxvii
3 ESPON 2.2.2 within the ESPON Network………………………………………………..xxix
3.1 Networking with other TPGs………………………………………………………………….xxix
3.2 Self-evaluation…………………………………………………………………………………xxix
4 Further Research Issues and Data Gaps……………………………………………….xxxi
4.1 Research Issues Envisaged for the Final Stage of the Project…………………………..xxxi
4.2 Inherent Data Gaps Limiting Territorial Impact Assessment……………………………..xxxii
Part II
5 Methodological Overview……………………………………………………………………...1
5.1 Spaces and Spatial Levels Under Consideration……………………………………………..1
5.2 Relation of EU Funding and National Instruments for Territorial Policies………………….3
5.3 Quantitative Analysis of EU Policies' Impacts and TIA……………………………………….5
5.4 Qualitative Analysis of EU Policies' Impacts and TIA……………………………………….10
5.5 Ex-ante Analysis………………………………………………………………………………...13
5.6 TIA – EU 15 and the Candidate Countries.......................................................................14
5.7 Indicator Development.....................................................................................................14
6 Review of the Acquis and the Implementation of Community Policies....................16
6.1 Introduction.......................................................................................................................16
6.2 Implications for territorial development of the acquis.......................................................18
6.3 Agriculture and CAP.........................................................................................................22
6.4 Environment.....................................................................................................................25
6.5 Transport and TENs.........................................................................................................27
6.6 Regional Policy and Structural Funds..............................................................................28
6.7 Competition Policy............................................................................................................30
6.8 R&D Policy .......................................................................................................................33
6.9 Internal Market..................................................................................................................34
6.10 Conclusion .......................................................................................................................36
7 Comparative Analysis of National Instruments for a Territorial Policy.....................40
7.1 Introduction.......................................................................................................................40
7.2 National Regional Policy...................................................................................................49
7.3 Regional Policy Objectives...............................................................................................51

vi
7.4 Policy Instruments............................................................................................................57
7.5 Spatial Targeting..............................................................................................................64
7.6 Institutional Arrangements................................................................................................69
7.7 Conclusions and Policy Recommendations.....................................................................75
8 Regional and Spatial Impacts of EU Pre-Accession Funds..................................…..82
8.1 Review of Pre-Accession Aid Programmes......................................................................84
8.2 Regionalisation of Pre-Accession Aid Spending..............................................................91
8.3 Quantitative Impact Analysis…………………………………………………………………103
8.4 Qualitative Impact Analysis…………………………………………………………………..134
8.5 Overall Evaluation of Impact Analysis……………………………………………………….149
9 Regional and Spatial Impacts of Trans-national and Cross-border Co-operation.152
9.1 Introduction……………………………………………………………………………………..152
9.2 Impacts of Cross-Border Cooperation………………………………………………………156
9.3 Impacts of Trans-national Integration Measures…………………………………………...173
10 Ex-Ante Analysis of the Influence of Structural Pre-Accession Aid and The Structural Funds on Balanced Territorial Development in the EU Territory………189
10.1 Structural Funds and Pre-Accession Aid 2004-2006………………………………………189
10.2 Meta-Evaluation………………………………………………………………………………..191
10.3 Structural Funds and Balanced Territorial Development Post-2006……………………..203
10.4 Conclusions and Policy Recommendations………………………………………………...212
11 Indicative Policy Recommendations…………………………………………………..…215
11.1 Macro level……………………………………………………………………………………..216
11.2 Meso level………………………………………………………………………………………219
11.3 Micro level………………………………………………………………………………………221

vii
PART I: Summary
1 Executive Summary The study represented below – and in the following two separate parts – represents the 3rd Interim Report of ESPON project 2.2.2 "Pre-Accession Aid Impact Analysis". This project focuses on the contribution of pre-accession aid1 measures in the New Member States and Candidate Countries to the attainment of spatial objectives as formulated in the ESDP. In particular the research relates to the objectives of spatial cohesion, balanced spatial competition and spatial integration and, to a lesser extent, polycentric development.
Thus, the analyses try to identify in how far these objectives have been addressed and influenced by pre-accession aid interventions. In order to achieve a territorial analysis, across programming periods, the latest possible years of pre-accession aid programming are under consideration, i.e. the period between 1998 and 2000 and to some extent also the following years 2001 and 2002. Due to a number of factors limiting such an analysis – these are stressed in the main part of the report – there is no single methodological approach but a number of different access points attempting to shed some light on territorial impacts of pre-accession aid interventions.
For measuring the achievements of these objectives, however, different territorial scales need to be acknowledged as relevant reference points, i.e. the European macro, national meso and regional micro levels. Hence, depending on the issue under investigation and the methodology used, reference is made to either of these spatial levels.
Generally, this 3rd Interim Report is based on the research steps undertaken in the following of the 2nd Interim Report. Yet, it also provides updates of prior analytical steps and sections provided in the 2nd Interim Report, as far as this was asked for in the response to this earlier report and corresponding to the issues mentioned in the Addendum. Consequently, below summary provides the main results of the different analytical steps as they are presented in the second part of this report. This summary will start with chapter 6 on impacts of applying the 'Acquis' rather than with chapter 5, as for the latter a short overview is given in below scientific summary following the content related summary. As of its concluding character, integrating the findings of the different analytical steps, also the final chapter of the second part, i.e. chapter 11 on indicative policy recommendations, is dealt with separately in the last section of below summary.
1.1 Summary of Interim Report's Contents
Territorial Effects of Applying the EU ‘Acquis’
Chapter 6 provides results of the analysis on spatial impacts of the adoption of the acquis. Country by country analysis on this issue already included in the 2nd Interim Report of ESPON project 2.2.2 has been deepened and extended by focusing on the relation between the
1 In this report the term pre-accession aid is generally used not only for ISPA, SAPARD and PHARE funds of the
latest programming period, starting in 2000, but also refers to earlier PHARE, PHARE CBC etc. allocations before the year 2000. However, if special reference is made to one or another programme then the programmes rather than this more general term is utilised.
viii
various chapters of the acquis and their relevance for territorial developments. Implications for territorial developments of all acquis chapters are highlighted and those issues of the acquis assessed as highly relevant for territorial developments, namely agriculture, environment, transport policy, regional policy, competition policy, R&D and Internal Market are discussed in detail with regard to their territorial impacts and potential challenges.
Overall, the analysis demonstrates that many elements of the acquis are in line with territorial and spatial development themes e.g. accessibility and connectivity, environmentally friendly and sustainable development. The adoption of the acquis, therefore, has the potential to influence territorial development issues by addressing (directly or indirectly) regional potential and bottlenecks, e.g. through the promotion of integrated pan-European transport and telecommunications networks, the development of structures for the implementation of future Structural Funds and the introduction of a more unified industrial policy. However, it is important to qualify these findings. First, given the level of development disparities between the old and new Member States, changes to existing territorial development patterns can only be expected over the longer term. Second, it is important to recognise the limitations of EU policy actions. In practice, the course of territorial development will be highly dependent on developments in the wider economic and political realms. Third, explicit links to territorial development goals are not necessarily clear. The territorial impact of the acquis and EU policies could be implicit, coincidental or even accidental. Fourth, the complexity of the policies and the scale of development disparities in the new Member States mean that the impact of the Community Policies on overall territorial balance and cohesion is unlikely to be perceptible in the near future. However, a core aim of EU pre-accession aid and the acquis has been to build the capacity of new Member States to manage and implement these policies and the resulting, enhanced capacity of the new Member States should enable them to utilise funds more effectively and, in doing so, fulfil territorial development objectives. Finally, in the light of national and regional variations, it is clear that the adoption of individual chapters of the acquis will be more/less demanding for some countries than others and accordingly affect the countries regions to different extents. Countries with a significant number of heavy industrial regions, for example, will be more directly affected by requirements of environmental regulation, sustainable development rules and competition laws. In contrast, many capital city regions have prospered as market centres and will benefit from element of the acquis such as the free movement of goods.
The following table highlights the way in which EU policies and key elements of the acquis could promote various aspects of territorial development.

ix
Table 1-1: The Acquis/Community Policies and Territorial Goals Chapter Spatial Cohesion Spatial
Competition Spatial Integration Regional /territorial
impact review Agriculture
Rural development funding
Guaranteed standard of living and income for agricultural communities
Increased productivity
Multi sectoral integrated approach to rural economy
Market Unity
Promotion of rural linkages and connectivity
Rural regions
Lagging rural regions (eastern border regions)
Countries with high percentage of agriculture, e.g. Poland and Romania.
Environment Support for environmentally
disadvantaged regions
Supported for protected regions
Improved quality of life - link to development of competitiveness
Improved environmental infrastructure
EU neighbourhood policy
Cross-border cooperation
Heavy industrial/polluted regions
Improved environmental services for urban region
Vulnerable habitats Transport Policy
Potential to addresses transport bottlenecks to regional development
Improved competitiveness through improved infrastructure and transport services
Cross-border linkages
Urban centres as transport nodes
Capital cities, linked through TENs
Increased internal integration
Regional Policy Support for lagging regions and cohesion countries
Emphasis on regional competitiveness, innovation and R&D
Cross-border cooperation
Support for lagging regions and cohesion countries
Competition Policy State aids to lagging regions
Removal of market barriers
Freer movement of labour (though currently restructured)
Support for lagging regions
Negative impacts of migration
Growth in most competitive regions
R&D Support for R&D and innovation provide through structural funds
New development potential for heavy industrial regions
Development of high tech zones and growth poles
Cooperation between Member States through framework measures
Well endowed urban centres, through higher tech, innovative companies also have the potential to be more ‘footloose’.
Internal Market New development opportunities and markets for regional economies
Free market
CEE regions can compete with EU-15 for investment and business
Freer movement of persons
The most competitive regions - capital cities and western border regions
National regional policies in relation to Pre-Accession Aid
National instruments for territorial policies are analysed in chapter 7 with regard to their likely influence on key aspects of territorial development, as well as their relationship to EU funding programmes. The core elements of national regional policies are analysed on a country by

x
country basis including policy objectives, policy instruments, spatial targeting and policy implementation.
National regional policy covers a wide variety of actions and is implemented for a range of reasons. All the countries analysed have some form of regional policy in place. Switzerland and Norway have a long tradition of policies aimed at supporting lagging regions. Cyprus and Malta also have programmes of support in order to promote more balanced development. In the CEECs, considerable progress has been made towards the development of modern, national regional policies. However, a number of persistent difficulties remain in this policy field. First, and most crucially, there are only limited financial resources allocated to regional policy. Second, EU regional development policy has tended to dominate regional policy debates, activities and resources. And third, the lack of co-ordination between government ministries and levels of governance is a recurring problem.
National Regional Policy and Territorial Development Goals
Regarding the link between territorial development objectives and national regional policy following conclusions can be drawn from the conducted analysis:
First, national regional policy relates in a range of ways to territorial development goals. Overall, the objectives addressed by national regional policy correspond to broad territorial development goals. Policy instruments, such as regional incentives, framework measures and infrastructure investment, link to the goals of spatial cohesion, balanced spatial competition and spatial integration.
Second, different elements of policy have the capacity to correspond to a greater or lesser degree to territorial development objectives. For instance, while policy objectives may appear to reflect a strong commitment to spatial cohesion, the resources allocated to regional policy instruments may suggest otherwise.
Third, as well as identifying components of national regional policy which may complement territorial development goals, it is possible to identify groups of countries where national regional policy approaches appear to be more, or less, consistent with territorial development themes and goals.
1. Slovenia, Estonia and Hungary have adopted regional policies that appear to correspond well with territorial development objectives.
2. Bulgaria and Romania appear to reflect territorial development objectives in their policy objectives, but whether this is translated into practice is more open to question.
3. Other new CEE Member States make up a distinct group. Here, national regional policy takes a ‘middle road’, by attempting to balance traditional approaches to support for lagging regions and the agendas of balanced regional development, endogenous growth and regional competitiveness.
4. In Cyprus, Malta, Switzerland and Norway distinct, national physical characteristics have shaped regional policy approaches. In Cyprus and Malta national regional policy is not a priority due to the size of the countries.
Fourth, national regional policies do not necessarily fit with all territorial development objectives. Even though, on paper, regional policy in the CEECs appears to have a strong commitment to regional equity, equity considerations tend to be subservient to the needs of national economic growth. In terms of policy, the challenge is to avoid jeopardising national efficiency by channelling resources to regions that have little prospect of competing, while retaining some policy orientation towards indigenous development in less-favoured areas.
National Regional Policy and Pre-Accession Aid
Analysis revealed that there are clearly strong linkages between pre-accession aid respectively Structural Funds and national policy priorities and approaches. There are

xi
overlaps and similarities in approach in terms of policy objectives, policy instruments, particularly the use of regional development strategies, and policy delivery.
Structural Funds and pre-accession aid have exerted a strong influence on national regional policy. In the case of the CEECs, EU Funds began to introduce new ways of thinking about regional policy in the mid-1990s. PHARE programmes included regional development initiatives and supported the development of institutions and agencies dedicated to regional development, e.g. PHARE pilot programmes were used to support the establishment of regional development agencies in the Czech Republic and Poland. More generally, reform of regional policy was pushed up the agenda as policy making in the CEECs became increasingly influenced by the requirements of EU accession and Structural Funds implementation. As accession began in earnest, it was apparent that the confused and still centralised system of regional policy formulation and delivery in many counties did not meet EU requirements. The demands of Chapter 21 of the acquis, referring to the creation of regional administrative units meeting the NUTS criteria, inter-ministerial co-ordination over regional policy, the development of regional institutional capacity and the embedding of the partnership principle were clearly not being fulfilled.
As the accession process has progressed, the influence of the European Commission has been very visible on the design of regional policies in the new Member States and Candidate Countries, with national legislation and policy objectives drafted with a view to satisfying the real or perceived requirements of the EU’s structural policies. In several countries (Czech Republic, Hungary and recent draft Slovenian policy proposals), regional policy legislation explicitly refers to the need for regional policy to be “compatible with the Structural Funds”. At the outset, the Hungarian National Concept, like similar documents elsewhere in the (then) Candidate Countries, gives prominence to regional policy being based on partnership and the programming principle, again reflecting Structural Funds concepts.
At the same time, important distinctions exist between EU and national policies. On one level, differences in approach appear to suggest the potential for conflict and tension. For example, national spatial targeting approaches and EU regional policy do not necessarily correspond. National regional policy instruments could also conflict with EU policy instruments and regulations. However, through their differing emphases, national regional policy and the Structural Funds also have the potential to complement one another. The Third Cohesion Report concludes that there is likely to be a complementarity between both policies rather than a conflict. For instance, one can be viewed as aimed at alleviating immediate social concerns, the other tackling more fundamental, longer term problems. If effective, the two together can ensure not only a more balanced distribution of both income and life chances across the regions but also a more territorially balanced economic development path for Member States and the Union as a whole.2
Regional and Spatial Impacts of EU Pre-Accession Funds
The main impact analysis of pre-accession aid interventions in the New Member States and Candidate Countries is discussed in chapter 8. The chapter is divided into five parts, of which four elaborate spatial impacts on the basis of different methodological and analytical steps leaving the last for tentative conclusions.
These analyses are strongly connected with the potential analysis provided in the 2nd interim report of ESPON project 2.2.2. As the potential analysis represents kind of an anchor throughout the whole project's analyses, the 2nd interim report also proposed a generalised typology, which groups the regions of the New Member States and Candidate Countries on the basis of the previous potential analysis. This potential related typology is the frame for the policy analysis, although in many aspects, it will be focused on one or another policy priority and potential at a time, only referring to general potential provision in concluding terms.
2 European Commission, (2004) Towards a new Cohesion for Europe: Convergence and Competitiveness and
Cooperation: Third Cohesion Report European Commission: Brussels

xii
Generally speaking, the potential oriented typology differentiated between: Capital cities and major urban agglomerations; Western border regions; Peripheral Eastern and rural regions; Old industrial regions and Island economies.
Meta-Analysis of Pre-Accession Aid Funds
The first sub-section provides an up-date of the meta-analysis included in the 2nd Interim Report of ESPON project 2.2.23 by highlighting the general character of pre-accession aid. Moreover, hypotheses on spatial impacts of pre-accession aid further elaborated since the last report are presented and are summarised in below box.
Key Working Hypotheses:
1. The primary aim of the pre-accession funds is to support the implementation of the acquis, but in working towards this aim, they also to contribute to the objectives of spatial cohesion, balanced spatial competition and spatial integration.
2. Spatial cohesion: In terms of spatial cohesion, pre-accession support assists the new Member States and Candidate Countries to meet the criteria for EU enlargement, thus promoting equity objectives at an EU level. Support to lagging regions through the Phare programme, which promotes equity at both the national and EU levels.
3. Balanced spatial competition: Pre-accession support has played an important role in addressing regional development bottlenecks and barriers to development. It has also offered support to regions capable of acting as growth poles for the national and EU economies.
4. Spatial integration: Spatial integration between then recipient countries and the EU have been strengthened by pre-accession programmes, economic integration, infrastructure, cultural integration and political integration have all been developed.
5. The volume of resources, scale of development disparities and institutional capacities of the applicant countries mean the impact of pre-accession aids are not easily measurable in terms of standard indicators.
6. Related the impacts of the pre-accession aid on spatial development are not pronounced, given the relatively small amount of funding spread across a wide range and the scale of development disparities.
Pre Accession Instruments
1. The different instruments are likely to affect different aspects of territorial cohesion to varying degrees and in different ways. SAPARD is more likely to affect equity, while ISPA is expected also to affect efficiency and integration. PHARE and the NDPs will affect all three aspects of territorial cohesion.
2. Spatial Cohesion: Phare programmes of support have targeting lagging regions, SAPARD specifically targets rural development.
3. Balanced Spatial Competition: Phare support is to enhance national and regional competitiveness. Transport infrastructure developments will support balanced spatial competition across an enlarged EU and within the New Member States
4. Spatial Integration: Phare CBC and infrastructure investments will support spatial integration
5. Country Groupings: Some countries and regions are in a better position to benefit
3 Kujath, H.J.; Kunkel, K.; Zillmer, S. et.al. (2003): Pre-accession Aid Impact Analysis. 2nd Interim Report to ESPON
Project 2.2.2., chapter 7.2.

xiii
from pre-accession aid than others. Romania and Bulgaria face greater economic development challenge and, related, the impact of pre-accession aid programmes are less likely to be immediately apparent. In contrast, more direct and measurable benefits from pre-accession aid with a more notable impact upon spatial development objectives can be identified elsewhere. For instance, favourably placed, western border regions and heavy industrial regions could build upon existing development potentials and advance their position
Territorial Scales
1. The impact of different instruments on territorial cohesion will vary at different territorial levels.
2. Spatial Cohesion: Given the level of funding provided and the scale of disparities between the Candidate Countries, New Member States and EU-15, the pre-accession programmes have not made a dramatic impact upon spatial inequalities. However, at a regional/local level, pre-accession aid has targeted equity objectives and has contributed towards development in lagging regions. At a national level, cohesion objectives have been targeted though improvements in service provision and institutional capacity building.
3. Balanced Spatial Competition: Pre-accession measures have supported balanced spatial competition. Actions with the most significant impact are evident either at the local level (e.g. promotion of local business) or at the national level (e.g. through promotion of the competitiveness agenda).
4. Spatial Integration: The Phare programme has notable impacts upon spatial integration at the regional level, e.g. through Phare CBC. At the national and EU levels, the Phare programme and ISPA have had a key role in promoting spatial integration.
5. The impact of the different instruments on various aspects of cohesion will depend on specific aspects of each individual country, notably its geographical location, the size of its population and territory, the extent and quality of specific socio-economic and environmental problems, and the degree of inter-regional disparities as well as the size of the national gap towards EU15 levels of development. Countries can be grouped into the following categories:
• Island Economies: Cyprus and Malta
• Small states (new Member States): Slovenia, Baltic States
• New Member States: Czech Republic, Slovakia, Poland and Hungary
• Candidate Countries: Romania and Bulgaria
A similar argument can be made in relation to the impact of pre-accession aid on regions.
• Capital City Regions
• Western Border Regions
• Heavy Industrial Regions
• Eastern Border Regions
Implementation and Governance
1. Pre-accession funds can be considered as contributing to territorial objectives also as regards their method of implementation and governance. In particular, the Phare programme has promoted the involvement of local and regional actors and

xiv
institutions in development planning.
2. Institutional capacities and, related, absorption capacity still need to be further developed in order to capitalise fully on the development opportunities offered.
Regional Pre-Accession Aid Spending
The second sub-section provides an up-dated overview on pre-accession aid spending based on the improved ESPON project 2.2.2 database on national and regional level referring to two periods, 1998 to 2000 and 2001 to 2002, thus allowing also for a comparative approach concerning the development of regional allocation of pre-accession aid.
Summing up, the analysis of regional priorities of spending in the periods 1998-2000 and 2001-2002 revealed, that infrastructure investments in many cases are dominant on regional level, while soft measures addressing human and business resources play a minor role in most regions. In total, however, priorities vary strongly between regions and no clear pattern can be observed in terms of priorities of different countries or different types of regions (border regions, old industrial regions). Comparison of the two periods showed that only limited continuity of priorities is given for most regions. While the tendency of higher priority for transport infrastructure in regions endowed with agglomerations and higher priority for environmental investments is visible in both periods, priorities shift considerably in selected regions. Change of priorities is even more pronounced with regard to spending addressing human and business resources. Moreover, in some cases significant data weaknesses have been highlighted, what once more illustrates the need for sensitive interpretations of data to prevent distorted conclusions.
Quantitative Impact Analysis
The analysis of the relation between pre-accession aid intervention and the development of potential indicators made clear, that for none of the potentials which could be included in the dynamic view of the analysis, straight forward results occurred. Instead, these views even stressed how the different potentials and characteristics of a region, whether quantitative or qualitative, together form the regional performance. This way it becomes also even more obvious that pre-accession funding has been too small to identify a general territorial impact assessment, especially when differentiating between NUTS 3 regions.
The comparison of regional performance development with regional pre-accession aid spending revealed quite different relations for different countries. The results strongly indicate for the necessity of combined provision of a number of potentials, which only in their grouping can stimulate sustainable growth. Thus, to achieve growth in the New Member States and Candidate Countries, first, one or several regional bottlenecks need to be transformed into potentials before they do not further hamper regional development. Together, all these findings, also relating pre-accession aid allocation to the change of economic performance with national respectively European average as reference, indicate not only the limitations of pre-accession impacts in quantitative terms as of the quite restricted amount of funds but also the likely role of other aspects affecting the performance as related to EU and national averages.
As was to be expected against this methodological background, correlation and regression analyses did not reveal any direct relation between pre-accession aid spending and regional development in terms of GDP and employment dynamics. Although for some countries a positive relation between pre-accession aid spending levels and GDP growth per region could be observed no causality between these observations can be assumed. Correlation analysis showed a significant relation between the regional endowment with selected potentials and the regional performance in terms of GDP and employment dynamics. While the geographic position (level of accessibility), urbanisation and localisation advantages (sector structure) and the level of capital supply are potentials, which are related to levels of GDP change, changes of regional unemployment rates are related to the labour market potential (Human
xv
Capital Index) and urbanisation and localisation advantages (sector structure). Besides, preliminary regression analyses indicated for causal relations between the regional potential provision and socio-economic impact indictors, though impacts do not seem to be equally imminent on income growth and unemployment development.
Qualitative Impact Analysis
According to the regional typology six case studies have been chosen for in-depth analysis covering different types of regions and focusing on different policy aspects not covered by the quantitative analysis: Slaskie Voivodship (Poland) represents an old industrial region within the Central and Eastern European “triangle”, the Warsaw Metropolitan Region display characteristis of dynamig capital city regions, Borsod-Abaúj-Zemplén county (Hungary) is an old industrial region/rural region on the periphery of the New Member States, Szabolcs-Szatmár-Bereg county (Hungary) represents an eastern, rural region, Malta stand for specific development problems of small island economies and Estonia stand for a small rather peripheral country showing nevertheless considerable growth and integration dynamics. Case study analysis focused on territorial impacts of selected pre-accession aid programmes or projects within the region.
Case studies included good and bad practice examples with regard to the extent regional potentials and bottlenecks were addressed. Interventions supporting development by a mixture of measures aiming at reduction of several bottlenecks on the one hand (e.g. poor infrastructure) and strengthening of potentials on the other hand (e.g. development of human resources or strengthening innovation capacity) proofed to be adequate to face the complex structure and development problems of the regions under consideration. One-sided investment instead, failed to reveal considerable impacts, since bottlenecks remaining in other fields hampered utilisation of potentials improved by interventions.
Institutional conditions proved to be crucial for the effectiveness of project/programme implementation. In the Hungarian case studies conflicts or missing coordination between institutions on different levels (regional, national, European) constituted the main bottleneck for sound programme implementation. In most other cases implementation within given institutional structures turned out to be advantageous. However it should be noted, that mostly institutions on national not regional level were the overall responsible authorities.
The orientation of pre-accession aid interventions towards territorial objectives depended largely on the field of action and the overall framework determining the intervention. Programmes supporting regional restructuring like the Silesian LGF and the Hungarian regional restructuring programmes or the PHARE ESC programme in Estonia e.g. had an explicit orientation towards territorial development issues.
Case study analysis showed the relevance of the three level approach when discussing policy impacts with regard to territorial objectives. From case study analysis several issues can be highlighted. Firstly, case studies showed that objectives and impacts might be conflicting between different spatial levels. Secondly, reaching of impacts obviously depends on the scale of projects. Thirdly the size of the country determines the relevance of spatial levels.
Regional and Spatial Impacts of Trans-national and Cross-border Co-operation
Territorial impacts of trans-national and cross-border cooperation programmes, particularly relevant under considerations of the spatial integration objective are discussed separately in chapter 9 as their implementation and especially realisation but also the analysis differ from that of the other territorial impact assessment provided. EU’s main financial instruments in this context are INTERREG programmes, PHARE CBC and TACIS CBC, therefore these programmes are assessed with regard to their impact on the objective of spatial integration. Analysis is based on review of existing documents as well as case study findings on both types of co-operation programmes.

xvi
Impacts of cross-border cooperation
The EU takes the special development problems border regions are facing into account by implementing special programmes supporting cross-border cooperation. The main programmes developed for this purpose in the last decade were INTERREG IIA and IIIA as well as PHARE CBC and TACIS CBC. Case studies on regions profiting from these funds have been conducted on all three types of borders: New Member State – EU-15 Member State (Polish-German Border Region - Viadrina), border between two New Member States (Hungarian-Slovakian Border Region) and external border of New Member State (Hungarian-Ukrainian Border Region). Analysis on case study regions focused on assessment of cross-border co-operation activities with regard to potentials and bottlenecks addressed and with regard to overall impacts on territorial developments.
All in all cross-border cooperation programmes addressed the main regional bottlenecks resulting from the border situation, namely missing infrastructure links, weak economic structures due to limited market and commuting areas as well as institutional and mental barriers. However the extent to which the different fields of action affect spatial integration of border regions vary.
Improvements of transport infrastructure can be assessed as important measures in order to overcome the physical barriers of borders. To show impacts in terms of supporting cross-border integrations on the one hand and strengthening regional development in the regions on both sides of the border on the other hand infrastructure projects have to be well chosen and infrastructure investments with high regional importance should have priority. Small Project Funds turned out to be an efficient instrument to foster socio-cultural integration. By addressing and integrating local authorities and the border region’s population cultural and mental barriers could be reduced. Beside the Small Project Funds “soft” measures supporting cooperation in the fields of education, business or culture seem to be of less priority within cross-border cooperation. From the point of view of spatial integration on regional level these measures would however be of great importance.
In case of relatively impermeable borders like the Hungarian-Ukrainian one cross-border cooperation measures seemed to be too restricted in terms of fields of action as well as budget. Since in these cases border relations are dominated by political decisions on national or EU level, e.g. with regard to trade barriers, or national political tensions reflecting at the border regions, regional cooperation can only play a minor part in supporting integrated development of the border regions.
Spatial impacts of cross-border cooperation programmes are twofold: on the one hand they contribute to spatial integration and on the other hand to regional development within the border regions. All in all impacts on regional development within the border regions and thus on spatial cohesion seem to prevail over impacts on spatial integration. Only a minority of projects support cooperative actions in the field of education, culture or business and often projects lack “mirror” projects on the other side of the border. “Single” projects only implemented on one side of the border as well as infrastructure projects, e.g. environmental infrastructure investments often have rather a regional development character than contributing directly to spatial integration. Although prosperous development on both sides of the border might as well support border regional integration in the long run, CBC programmes seem to be often used as additional financial source for development projects, which could be financed from other sources as well (e.g. ISPA, PHARE) instead of concentrating on cooperative and integrative projects.
Impacts of trans-national integration measures
During the 1990s EU Member States recognised the need to get involved in a more operational way in cooperation on regional & spatial planning on trans-national level. This was the result of the increasing economic integration and interdependence between Member States and regions (with the internal market) and of new common challenges resulting namely from major economic trends, such as the globalization of the economy. Under this

xvii
conditions a specific strand was introduced within the INTERREG programme for supporting trans-national co-operation - initially under INTERREG IIC, later continued as INTERREG IIIB.
Two macro-regions, ARCHIMED and Alpine Space, established under these INTERREG programmes have been studied in detail and again with regard to the character of programmes in terms of addressing potentials and bottlenecks and overall territorial impacts, while for other macro-regions in the region a more general and review based analysis has been achieved.
Common foci of both analysed programmes lie in the field of transport infrastructure improvement, preservation of natural and cultural heritage/environmental protection and tourism development. These priorities address main bottlenecks and potentials of the macro-regions. However budget within INTERREG IIC/IIIB seems to be too low to reveal significant impacts on trans-national level and not only on smaller regional level. Spatial integration in economic terms has only been addressed within the Alpine Space programme but has not been included in the ARCHIMED programme. Measures in this field, e.g. business co-operations, co-operation in research or education seem however not to be of high priority. From this observation one might conclude that selection of common fields of action also depend on the already existing level of integration. In case of low levels of trans-national integration less critical fields like cultural heritage and environmental preservation might be more suitable to provide the basis for trans-national integration.
Beside these defined fields of action one major focus of both programmes lay on improving institutional conditions. By establishing common institutional structures basis for improved trans-national communication and development of common approaches has been provided. Thus, improved institutional integration is the most important impact of analysed programmes on the way to increased spatial integration. Although so far this affected only to a limited extent integration in other fields and in socio-economic terms, trans-national institutional and communication structures can be assessed as important prerequisite for further impacts of trans-national co-operation in the future.
Effects on spatial integration were in both cases limited by unequal opportunities of participating countries. Coordination with PHARE or TACIS funds proofed to be not sufficient for securing equal partnership of candidate or third countries. Moreover national interests prevail when it comes to allocation of funds to specific projects, i.e. the funds are not seen as real trans-national funds but rather as national contributions national beneficiaries should profit from. Also concerning priority fields and approaches of implementation national differences hampered the programme implementation, e.g. by refusal of Italian authorities to fund co-operation activities on projects level in the Alpine Space.
Obviously the objective of trans-national co-operation addresses in the first places spatial integration issues on macro-level. However many projects are rather of regional character thus affecting the meso or micro level. To secure the trans-national character of the programme and of impacts stronger programming structures are needed.
Ex-Ante Analysis of Territorial Impacts of Structural Funds and Pre-Accession Aid
Chapter 10 focuses on an ‘ex-ante analysis of the influence of the Structural Pre-Accession Aid and Structural Funds on balanced territorial development in the EU territory’. The chapter begins with an overview of structural support in the enlarged EU. It then focuses on how experiences of Pre-Accession Aid programmes and Structural Funds are likely to address and impact upon balanced territorial development in the enlarged EU. A key component of this element of the work involves a meta-analysis of ex-ante evaluations of the National Development Plans of the New Member States. The chapter concludes with contributions to on-going Structural Funds reform debates.

xviii
Meta-analysis of ex-ante evaluations of National Development Plan
High expectations are associated with Structural Funds in the enlarged EU. For the new Member States, Structural Funds imply a substantial increase in funding levels for a wide range of policy actions, with links to various territorial development goals. However, the impact of the Funds will depend not only on the amount of money available but the development of a sound economic framework, a judicious choice of strategic priorities, the rate of financial absorption, which depends on administrative and institutional capacity and the quality of projects, and effective project selection and implementation systems.4 Experience of Pre-Accession Aid programmes and the conducted ex-ante analysis also suggests that a wide range of factors could constrain the contribution made by Structural Funds and Pre-Accession Aid to balanced territorial development.
First, evaluations of existing programmes suggest that the achievements of Pre-Accession Aid were sometimes below expectations, due to overly ambitious goals, problems in implementing specific types of programmes, frequent changes, which confused and complicated support programmes, lack of co-ordination and difficulty in measuring and identifying the impacts of the programmes.
Second, problems with the quality of background analyses and the strategic objectives of future programmes could limit the impact of Structural Funds, by affecting the identification and prioritisation of development potentials and bottlenecks. Ex-ante evaluations of national programming documents commonly found that the background analyses were too large and not sufficiently focused. These deficiencies were then linked to problems with the identification and prioritisation of suitable Structural Fund priorities and measures.
Finally, an effective implementation structure for the Structural Funds is crucial. In the new Member States, substantial efforts were made to prepare suitable systems for the delivery and development of the programmes. However, weaknesses remain that could limit the effectiveness of the Funds. For instance, lack of identification of final beneficiaries and problems with establishing a project ‘pipeline’ have led to concerns over the absorption capacity in some recipient regions and countries.
Structural funds and balanced territorial development post-2006
As the Third Cohesion Report notes, it is difficult to identify the specific impact of Structural Funds policy. In fact, it is stated that, “most of the effects of cohesion policy cannot be readily expressed in quantitative terms…its added value arises from other aspects, like the contribution made to regional development, by factors such as strategic planning, integrated development policies, partnership, evaluation and the exchange of experience, know-how and good practice between regions”.5 The fact that Structural Funds operate alongside a wide range of other EU policies, notably EU Agricultural, Environmental, R&D, Transport, Competition and Internal Market policies, further complicates identification of their territorial impact. Related, an integrated assessment of the combined impact of all EU policies on balanced territorial development is extremely challenging, particularly given range of policies involved, their technical complexity and the range of impacts they could have. However, it is possible to highlight broad ways in which Structural Funds could complement the territorial development objectives: spatial integration, spatial cohesion and balanced spatial competition. For instance, Structural Fund support for transport infrastructures could promote spatial integration of a target region and promote balanced competition, by linking regional networks with Trans-European transport networks. Cross-border co-operation schemes, funded by Pre-Accession Aid programmes and Structural Funds, have promoted spatial integration between neighbouring regions and countries. Regional support programmes targeting lagging regions have aimed to promote spatial cohesion.
4 CEC (2004) Third Cohesion Report: A New Partnership for Cohesion CEC: Brussels , p.138. 5CEC (2004) Third Cohesion Report: A New Partnership for Cohesion CEC: Brussels, p. 138.

xix
From a ‘spatial development’ perspective, it is important that Structural Funds continue to build on their positive links to territorial development and with other sectoral policies. This argument is particularly relevant in the context of on-going Structural Funds reform debates. The Third Cohesion Report, published by the European Commission on 18 February 2004, has established a new framework for the Structural Fund reform debate. The report sets out the Commission’s proposals for the future of EU Cohesion policy after 2006, which are structured around three key priorities: convergence, competitiveness and co-operation.
These themes represent a broader rational for EU Cohesion Policy. Greater stress is placed upon links to the Lisbon Agenda, by arguing that promoting regional competitiveness will boost the growth potential of the EU economy as a whole. Intervention in support of economic and social cohesion is also linked with action to promote balanced development of the EU territory.6 The implication is that the remit of EU Cohesion policy reaches beyond imbalances in income and employment to address issues such as the polycentric development of urban areas, infrastructure endowment in educational, health and social services, and the specific problems of areas with geographical handicaps (e.g. islands, mountain areas). The EC’s proposal would lead to EU Cohesion policy becoming a permanent, horizontal policy pursuing the goal of balanced territorial development, with all regions eligible for some form of future EU support.
1.2 Indicative Policy Recommendations Apart from providing some common proposals as kind of guidelines for general issues in policy recommendation development for the New Member States and Candidate Countries chapter 11 differentiates especially between the different spatial levels under consideration. Yet, when discussing territorially oriented policy recommendations of pre-accession aid and future Structural Funds interventions in the New Member States and Candidate Countries, the link between these interventions and territorial objectives respectively development needs to be discussed.
In the past, balanced territorial development has only to a limited extent been an explicit objective of pre-accession aid programmes. Although impacts on territorial development are widely expected, the links between pre-accession aid interventions and territorial impacts are rather unclear. For territorial development objectives to be more clearly addressed, pre-accession aid and Structural Funds regulations should define how programmes are expected to address territorial developments. Therefore, the territorial dimension and expected territorial impacts of different fields of action should be discussed and in particular, the spatial levels addressed need to be defined. Since interventions often affect different spatial levels in different ways and to different extends, priorities of objectives according to spatial levels have to be agreed upon. Not only can one element of balanced spatial development be stressed at the expense of others, but also one spatial level can be emphasised at the expense of another, e.g. spatial cohesion on meso-level over balanced spatial competition on macro-level. Thus, the case for territorial development objectives should be thoroughly debated and priorities should be clearly set out in programming documents on all spatial levels.
Macro Level
Although spatial cohesion in social and economic terms is generally aimed at by the European Commission, due to the development differentials observed between and within the New Member States and Candidate Countries this objective might only be achieved in the long run. The objective for the EU to become the most dynamic, most competitive and sustainable knowledge based economy with full employment until 2010 (Martin and Schmeitz
6 The draft EU Constitution proposes that the promotion of territorial cohesion should become one of the Union’s objectives (Article 3) and should be addressed as an area of competence shared between the EU and Member States (Article 13).

xx
2002: 1) does not seem to be realistic at all. Even if the growth of each country arises in specific growth regions and can be transferred to these regions' hinterland and then to the whole country as profits from investments in the growth regions (Martin and Schmeitz 2002: 2), it can be questioned whether such a concentration of funds on sometimes very few growth engines can gain political acceptance and how long such a process would take. Thus, the conception of European funds' allocation to regions where the funds are needed most and where they can contribute to a high value added (Martin and Schmeitz 2002: 8), seems to be contradicting for the New Member States and Candidate Countries. While value added of productive investments tends to be highest in only some types of regions, such as possibly Western border regions, old industrialised regions and especially the major agglomerations, needs in terms of cohesion tend to be highest in the Eastern peripheral and rural regions.
Yet, following the concept of growth through a snowball system, cohesion in the long run is only feasible, for most parts of the EU territory if not for all, if productive investments utilised by the regional economy rather than investments without utilisation represent the major policy intervention. In the latter case, regional income levels are permanently supported by funds rather than retrieved from growth in regional economic activity. In the former case, cohesion policy can create regional growth which expands over time across regional borders into the agglomerations' hinterland and the remainder of the country. This way, cohesion policy also contributes to improving balanced spatial competition, as growth is generated from productive forces. Taking this snowball system together with the potential oriented approach which is the basis for this analysis, then growth is most likely to be achieved in regions which are relatively well endowed with potentials as compared to their neighbouring regions. A regular and even spatial expansion of economic development from the growth engines is less likely than the pointed development across the better endowed regions.
In such a framework, also on macro-level, policy recommendations need to differentiate between types of regions. Most important for macro-level cohesion is the utilisation of the Eastern European agglomerations' growth dynamic. However, so far, none of the capital regions and few other major agglomerations in the New Member States and Candidate Countries has been classified as strong MEGA by ESPON project 1.1.1. Most of them represent weak MEGAs and few potential MEGAs. Thus, they need to be strengthened for European competition in terms of their innovation capacity and the development of human resources. Without such preference, not only these MEGAs but basically all regions in New Member States and Candidate Countries will fall back in view of the Lisbon strategy. However, to compete in international innovation, macro-level accessibility, in terms of transport but also telecommunication infrastructure, for these agglomerations needs to be enhanced as envisaged for instance in TEN networks. Yet, if snowball systems shall work, transferring growth to the hinterland, then the respective local links should not be neglected also in reference to macro-level cohesion.7
Another crucial role for macro-level cohesion and thus balanced spatial competition on European scale play the old industrialised regions. This the more, since they are enclosed by a triangle of weak and potential MEGAs, possibly forming a future Eastern European counterpart to the Western European Pentagon.8 Especially as a possible counterpart to the domination of the Pentagon, these regions, together with the MEGAs surrounding them, could contribute to macro-level cohesion and also policentricity on European level. Thus, spill-over growth from the major agglomerations should be directed to these old industrialised regions. Nonetheless, policy packages encompassing improvements in human resources – adjusted to modern employment needs – and enhancement of the restructuring process are needed for the reduction of the still existing bottlenecks in these regions. Especially the importance of sector employment composition has been stressed in above analyses including the quantitative impact assessment. Thus, sustainable growth in the old industrialised regions
7 See also below policy recommendations for the micro-level.
8 See potential oriented typology in 2nd Interim Report of ESPON project 2.2.2.

xxi
relies on sound restructuring, possibly even differentiating between different types of old industrialised regions, depending on the respective specialisations.
While Western border regions as well as the two island economies are likely to partake in the European cohesion process through regional cohesion and also indirect ways, Eastern peripheral and strongly agricultural dominated regions are particularly short of potentials clearly limiting their growth perspective in the short and medium term. For these regions, especially on national but also regional scale, i.e. meso- and micro-level, it is important not to fall further behind, loosing possibly the last of their potentials. Thus, incentives which can enhance the set up of SMEs with a local market in regional cities are most likely to support these regions' development. Hence, due to sustainable and resistant income differentials, these regions need particular consideration on meso- and micro-levels rather than on macro-level.
To sum up, rather than the differentiation between different priorities of the Structural Funds, policy interventions need to differentiate according to varying spatial needs between countries and regions, thus being more potential rather than priority oriented.
Meso Level
The importance of institutional conditions for territorial impacts of pre-accession aid to develop has been highlighted from various perspectives throughout the report. Strengthening of institutional capacities on meso and micro level alike can be assessed as one major effect of pre-accession aid, be it as result of institution building measures or as side-effect of interventions in other fields of action. A particular strength of pre-accession aid, in this respect, is their capacity to draw together a wide range of policy actors and actions on all spatial levels. This strength should be retained.
Nevertheless, institutional bottlenecks limited full optimal utilisation of pre-accession aid programmes and thus potential impacts on territorial developments. Accordingly, institution building should remain a focus for Structural Funds in the New Member States and especially for pre-accession aid in the Candidate Countries. Although EU policies considerably strengthened institutional structures on the national level, there should be a continued emphasis on building up coordination and partnership in the New Member States and Candidate Countries. This as well applies to the micro level, since there is a particular need to improve programming capacity at the regional level, ensuring that specific regional development concepts and strategies are compatible with and reflected in national and European development plans. Further progress in capacity building will also help to increase absorption capacity of the new Member States and their regions.
Moreover, clear guidelines should be provided for the division of responsibilities among the national and regional levels of the spatial development institutions, with special regard to the establishment of the procedural rules and decision-making powers in programming regional development and utilising decentralised budgetary and international resources. In some countries (e.g. Czech Republic, Hungary) the relationship between the political (NUTS III) level and the administrative (NUTS II) level needs to be further clarified in order to ensure smooth implementation of regional/spatial policy. Furthermore, in some of these countries NUTS levels have been implemented in the course of EU membership preparation not necessarily taking account of historical regional developments or regional identities. This results in regions basically only referred to in statistical yearbooks rather than filled with regional activity. This might be overcome by thorough adjustments of NUTS region assignment.
Complexity of implementation procedures of pre-accession aid programmes themselves proofed to hamper effective and efficient implementation of programmes and projects. Application, implementation and control procedures are frequently regarded as putting unnecessary cost and time pressure on responsible institutions on national level and on regional level as well. Simplification of structures could therefore contribute to enhanced results of implemented programmes and accordingly to stronger territorial impacts. This holds

xxii
the more if procedures are speeded up in the course of simplification, as then project selection and implementation can be more easily react on latest territorial developments.
Our analysis also emphasised the importance of country specific characteristics with regard to, on the one side, setting of territorial development priorities and, on the other side, impacts to be expected from pre-accession aid and Structural Funds interventions.
Relevance and priority of different territorial development objectives vary according to the initial socio-economic situation and their potential provision of countries but also with regard to other country specific features, e.g. with regard to the size or natural conditions of a country. Moreover, the national political, social and cultural context has to be regarded when deciding on territorial development priorities. While, for instance, the emphasis of spatial competition objectives at the expense of spatial cohesion objectives might fit into the national context in some countries it might arouse conflicts in other countries on meso-level.
The distinctive situation of the Central and Eastern European Countries in terms of economic transition should be taken into account with regard to territorial development objectives and selection of interventions. Due to different paces and characteristics of the transition process, still, national differences remain in comparison to development levels of EU-15. The level of institutional and macro-economic developments, however, is crucial for the positioning of these countries within the EU’s Lisbon Strategy. At the same time, transition processes resulted in increasing intra-national and intra-regional disparities in the New member States and Candidate Countries. Thus, equity and efficiency debates and the goals of the Lisbon and Gothenburg strategies pose particular challenges for these countries, which face the multiple challenges of underdeveloped national economies, growing regional disparities and limited financial resources, in both public and private sectors. Discussions on territorial development objectives and policies should not loose sight of these particular contexts differing distinctively from conditions in EU-15 countries.
Similarly, regional specific characteristics need to be taken into account. The most important challenge for achieving territorial development objectives in the New Member States and Candidate Countries is to take varying regional characteristics in terms of potentials and bottlenecks into account and to orientate spatial policy interventions towards the complex regional development situations. Analysis showed that one-sided interventions or interventions not adapted to the regional situation hardly reveal impacts on territorial developments. Therefore, interventions should be combined and coordinated to simultaneously address the main regional bottlenecks. For each region a coordinated strategy of interventions should be developed. Since the types of regions are defined by certain similarities of development problems, overall policy options with regard to relevant fields of action can be developed for each type of region. And, furthermore, in the next step they should even be more differentiated within types of regions, as even within one type of region different development levels can be found. Since specific development strategies tend to be related to the regional level, these policy options will be discussed under the micro level perspective in more detail.
Also on meso level implications of the EU’s Lisbon and Gothenburg strategies need to be discussed for different types of regions. While urban agglomerations, classified as MEGAs – in most New Member States and Candidate Countries these are only the capital cities – have been emphasised as most important regions under the light of the Lisbon Strategy on macro level, from meso level perspective second tier agglomerations have to be regarded as well. To foster balanced spatial competition on meso level and to prevent agglomeration disadvantages to develop in the MEGAs, national counterbalances need to be strengthened. The function of urban agglomerations as engines of competitiveness and innovation has to be fostered in agglomerations of national rather than international importance as well. Therefore, in many cases, existing strong potentials have to be utilised by reducing the most severe bottlenecks in these regions. Moreover, linkages between the respective national MEGAs and the second tier agglomerations and trans-national linkages between agglomerations of similar positions have to be established and strengthened to encourage development of competitive patterns of specialisation adapted to national contexts and regional initial potentials. Form this

xxiii
perspective, agglomerations situated within the Western border regions or within old industrial regions provide high potentials for contributing to balanced spatial competition and spatial integration on meso level alike, since the former are in a favourable situation for integration into urban networks with the neighbouring EU-15 Member States, while the latter can build upon strong national positions in the past and remaining strong potentials.
Finally, as the analysis of territorial impacts of the adoption of the acquis indicated, several sector policies reveal a strong territorial dimension. To foster complementarity of sector and spatial policies and to prevent negative effects of mutually conflicting interventions both types of policy need to be coordinated with regard to their territorial impacts9. For the New Member States and Candidate Countries the adoption of the acquis provided insights into the relevance of specific sector policies for specific types of regions. E.g. the Common Agricultural Policy is of particular importance for rural and often lagging regions, environmental policies are highly relevant for old industrial regions facing severe environmental problems, and many other sectors of the acquis, however, mostly provide development opportunities for the major urban agglomerations, e.g. transport policies in form of TEN investments, R&D policies or policies related to the Internal Market. These regionally varying territorial effects of sector policies have to be taken into account and shall be further investigated for the preparation of the final report.
Micro Level
From a micro level perspective the specific challenge of developing comprehensive regional strategies which utilise existing potentials and reduce main bottlenecks come into focus. Nonetheless, depending on the actual kind of intervention, they might only affect the micro level but could also affect meso and macro levels.
First of all, to be able to draw such integrated strategies on a region by region level adequate systems of analysing initial regional situations and evaluating potentials and bottlenecks need to be in place. So far, only a few countries established extensive SWOT analysis on NUTS 3 level in order to lay a sound foundation for the implementation of pre-accession aid or Structural Funds. Relevant socio-economic statistics and data on policy monitoring (spending levels, fields of action) should be made available on regional level for all countries. Only if comprehensive comparisons across regions within and between countries can be undertaken, it is possible to conduct an appropriate SWOT focussing on not only on the specifics of the region but also relating the regional situation adequately in the national and international context. However, to achieve this, akin and extensive statistics providing information on the different kinds of potentials need to be available.
Bottlenecks related to weaknesses of regional institutional structures provided a frequent constraint for sound definition and implementation of pre-accession aid programmes on regional level. Institutional capacities, therefore, need to be further strengthened in order to provide the basis, on the one side, for development of intervention strategies adapted to the specific regional situation and, on the other side, for effective implementation of measures. Besides, such improved institution building can also enhance absorption capacity at the regional level for different potential oriented interventions, thus contributing to higher effectiveness of possible measures. Yet, capacity building should focus on those interventions and regions, which are in the focus of the next programming period in order to avoid unutilised and thus in the short run wasted institutional measures.
As already mentioned in the preceding section, broad territorial development strategies can be developed with regard to a selected combination of the most important fields of action for each regional type identified by ESPON project 2.2.2. in the New Member States and Candidate Countries, thus orienting the policy interventions on the basis of regional potentials and bottlenecks rather than areas of action defined in the pre-accession aid or Structural
9 This is also emphasised bythe German Beirat für Raumordnung (2004).

xxiv
Funds programmes. Although these types of regions are broadly comparable, country specific influence and situations might lead to different regional characteristics and potentials and should not be disregarded. Moreover, different development levels of regions belonging to one regional type define the scope for action and effectiveness of interventions. Following, broad strategies for each type of region are indicated below, which can be described as policy packages. With more specific differentiation of sub-types revealing differences in the development levels, these packages can be even more specified leaving no more than two to three priorities each region should focus on. Nevertheless, such further differentiation may also reveal again slightly different foci for one or another region than for most parts of the region type.
For the present differentiation of types of regions Map 1-1 gives an abstracting and summarising overview relating the policy strategies to the types of regions. Furthermore, this overview also stresses that, while different types of regions need to focus, to some extent, on similar potentials their actual priorities within these potentials differ noticeably. A more detailed account of the priority settings as proposed is given in chapter 11.

xxv
Map 1-1: Summary of Tentative Policy Packages for Different Types of Regions
* For the description and contents of the policy packages see below box.

xxvi
Policy Package 1 for major agglomerations:
- infrastructure linkages on different levels (geographic position)
- innovation
- sector and business structure (urbanisation and localisation)
Policy Package 2 for western border regions:
- human resources (labour market)
- innovation
- cross-border integration
Policy Package 3 for old industrialised regions:
- business restructering (urbanisation and localisation)
- human resources (labour market)
- infrastructure modernisation (geographic position)
- environment
Policy Package 4 for eastern peripheral and rural regions:
- economic diversification on basis of local SME´s (urbanisation and localisation)
- institution building
- human resources (labour market)
--------------------------------------------
- cross-border co-operation
Policy Package 5 for island economies:
- environmental protection
- trans-national integration measures
- economic diversification (urbanisation and localisation)
xxvii
2 Scientific Summary The spatial outline in the contract for ESPON project 2.2.2. asks for an analysis not only of the candidate countries but the EU 27+2, explicitly including Norway and Switzerland. However, a territorial impact assessment of pre-accession aid can only be approached for the countries which have received such funds, i.e. the candidate countries.
This summary only very shortly refers to the different methodologies utilised in preparation of this interim report, since a much more detailed account is given in chapter 5 in the second part of this report.
Relating EU Funds and National Policies Aiming at Territorial Objectives
As policies with an explicit spatial focus, the analysis of national regional policy was carried out in more in-depth. The analysis required the close examination of a wide range of policy documentation. Particular attention had to be given to data and document availability. In many of the CEECs, recent policy, territorial and governmental reform made data collection particularly challenging, especially in the cases of Romania and Bulgaria. In order to ensure an efficient, standardised approach, checklists were produced and sent to individual country experts. In developing the checklists, the results of an extensive literature review were used. Each of the checklists followed a standard model and aimed to
• give country experts an indication of the type of information EPRC already had;
• identify where more information is required and;
• provide suggestions of where relevant material could be obtained.
The checklists and subsequent cross-country analyses aimed to gain insights into the full range of ways in which national regional policy could complement or conflict with the wider policy frameworks under review. By considering each of the key elements in turn, it was possible to gain a better understanding of how, for instance, policy implementation and policy objectives, as well as policy instruments, could relate to EU development frameworks.
Quantitative Impact Assessment
By means of several steps, regional potential provision, change of economic performance and pre-accession aid allocation have been related to each other, keeping in mind the measure of impacts in reference to the spatial objectives under consideration. Apart from improvements of descriptive static steps, also the changes of indicators – potential and performance – have been included. As far as possible, the different steps have been conducted for both absolute and relative figures and changes, thus allowing to differentiate between different extents of cohesion etc. The quantitative impact assessment also included the development of typologies relating the policies under consideration to regional economic performance and change of economic performance. It concluded with preliminary correlation and regression analyses, which shall be further investigated in the preparation of the final report.
Qualitative Impact Assessment
Apart from literature and evaluation reports review, qualitative impact assessment was strongly based on the realisation of case studies, for both general territorial impact assessment and the spatial integration objective. To enable comparative analysis a common approach was used for the case studies within each of these two case study groups based on

xxviii
a template which defined the main research questions and gave guidance concerning the detailed case study outline.
For the general territorial impact assessment the following overall research questions have been formulated leading the analysis:
• How could the situation and development path of the region be characterised with respect to regional potentials/bottlenecks?
• Which priorities were set by pre-accession aid projects?
• Were pre-accession aid projects directed to meet the regionally specific situation of potentials/bottlenecks?
• Did pre-accession aid projects affect regional potentials / bottlenecks, and if yes how?
• Did pre-accession aid projects contribute to territorial development objectives (equity, efficiency), and if yes how?
• Were pre-accession aid projects embedded in regional development structures (national strategies)?
• Were pre-accession aid projects embedded in regional institutional structures? Did they affect regional governance?
Correspondingly, the case studies focusing on spatial integration achievements covered the following questions:
• What kind of effects (direct / indirect) on developments in the specific fields can be found?
• To which extent net working procedures were successful and contributed to more permanent co –operation structures? Did the respective policies also lead to informal and private co-operation? Are these projects sustainable?
• To what extent do the specific effects also affect broader spatial development objectives?
• Which improvements of intervention and their effectiveness can be expected from future application of Interreg etc.?
In either case, the comparative analysis of case study findings focused on common conclusions in terms of policy assessment with regard to regional potentials and bottlenecks and with regard to the respective territorial objectives. On basis of these issues development for proposed policy recommendations has taken place.
Ex-ante Analysis
A key component of this work involved a meta-analysis of ex-ante evaluations of the National Development Plans of the New Member States. The assessment undertaken in the course of the ex-ante analysis builds upon the work of previous work packages and accompanying literature and policy reviews. It also involves an innovative meta-evaluation of ex-ante evaluation reports of national programming documents. A matrix was developed in order to enable a systematic cross-country comparison.
Apart from giving general comments on the available evaluation material, this matrix summarises the main positive and negative aspects of policy programming and objective setting differentiating between a number of issues. This working step provides a comprehensive ex-ante analysis for Structural Funds in the New Member States also tackling critical issues, such as the absorption capacity. Furthermore, it also provides this evaluation for the remaining Candidate Countries not facing Structural Funds in the next programming period, which supplies valuable information for their further preparation of EU membership.

xxix
3 ESPON 2.2.2 within the ESPON Network
3.1 Networking with other TPGs
As described in the second interim report, respective networking with other ESPON projects has been deepened over time. Emphasis has been put on networking with ESPON project 2.2.1 in order to achieve comparable typologies for the spaces of the EU 15 and the New Member States and Candidate Countries. Furthermore, this networking is envisaged to lead to common policy recommendations in the final reports of these two projects as far as this is possible and appropriate. Besides, networking with the co-ordination project 3.1 has deepened as well, ensuring results of ESPON project 2.2.2 to fit into the whole concept of the ESPON programme. Further networking is envisaged especially on the basis of the final reports of some projects finishing soon and third interim reports of other (in particular policy analysis projects) advanced projects, in order to improve reference to Community and sector policies becoming greater relevance for the New Member States.
3.2 Self-evaluation
A self-evaluation of ESPON project 2.2.2 has been conducted in the course of the 3rd project meeting, end of March 2004. At this point, this project had just passed half of its project duration, thus, it can be regarded as kind of a mid-term evaluation. In accordance with the requests for the self-evaluation provided in the Matera Guidance Paper, the self-evaluation has been realised as a brainstorming addressing issues along three lines, namely gaps and weaknesses related to the contents of the project and concerning organisational aspects, secondly ideas for improvements in this context, and thirdly in terms of ideas for new projects. It shall be stressed, that the issues mentioned at the brainstorming and referred to below, do not necessarily represent the opinion of the whole TPG but can also just portray the opinion of one or another individual partner.
Gaps and Weaknesses of ESPON Project 2.2.2
With regard to the research undertaken quite a few weaknesses have been mentioned. As far as possible, these have already been tackled since the self-evaluation and shall be further improved in the further course of the project, i.e. the remaining project duration. A general problem referred to the broad coverage of this ESPON project, referring not only to Phare and pre-accession aid but also the 'Acquis' and other EU Funds. And at the same time, not only the New Member States and Bulgaria and Romania but Norway and Switzerland are to be covered, too, though the latter two countries have not received any such funds and are in a quite different political, institutional and socio-economic state than the other countries under consideration. This broad coverage complicate the whole analysis and in thus the methodological discussion process in the TPG. This has consequently led to gaps concerning methodology discussions e.g. regarding the case studies and concerning the connection between the case studies and the qualitative and quantitative approaches. However, the methodological outline in below section (in Part II) should assist clarification of these problems.
Another issue mentioned in one or another context refers to different aspects of data bases. For instance limitations of the ESPON data base, e.g. in terms of EUROSTAT updates, have been mentioned, as these slow down research activities in the project, as far as analyses depend upon the respective data availability. Furthermore, especially for the New Member States and Candidate Countries, some data are not available at all or not with respect to several years, which further complicates an impact assessment. But also with regard to the policy data base, limitations have been mentioned. One referred to the limited availability of

xxx
reliable policy data in the different countries. This further complicated the development of a comprehensive and consistent regional policy data base.10
Finally, in terms of the empirical tasks of the research undertaken, some partners of the TPG encountered problems when conducting interviews with responsible actors to the programmes or projects investigated. These problems relate to both, the availability of appropriate actors – due to institutional changes and reorganisation of the administrations / regions – and the knowledge of the actors' concerning the ESDP and its objectives. This also led to limitations concerning the information, that could be obtained on the spatial impacts of different programmes / projects on different spatial levels.
In the context of gaps and weaknesses in organisational terms mainly critical comments concentrated on the coordination with other ESPON projects and financial aspects. The latter refers basically to two general problems. The financial management has been claimed as being pretty complex leading to considerable payment delays and some, if not all, partners suffer exceeding time and staff budgets from the project. Some partners show the willingness to add in additional working hours from other sources to ensure high quality output, however, this can not be taken for granted and certainly does not support sustainable ESPON results.
Some partners feel they would feel better incorporated in the ESPON process if they had more possibilities for meetings / discussions with other TPGs. Due to very limited budgets, some partners cannot afford to come to ESPON seminars though. Consequently, they feel less informed than the partners more closely involved in the whole ESPON process. But these problems are also regarded as being due to differences in methodological approaches between projects and especially as of the different timing between the projects. All these issues hamper the achievement of comparative results across the different projects.
Ideas for Improvement
Analogously, the ideas for improvement could also be assigned along a few lines of arguments. The first relating to the immediate work for ESPON project 2.2.2 achievements and the other corresponding to coordinative improvements with regard to the whole ESPON programme. However, basically all comments were somehow related to the ESPON programme rather than suggesting project internal improvements.
Some partners suggest improvements of term definitions in ESPON to further develop discussions and ESPON output along comparative lines. The above mentioned problem of the inclusion of Norway and Switzerland led to the suggestion to exclude these countries from the analysis in ESPON project 2.2.2. Possibly a solution to this spatial dimension would be to consider these countries in particular in appropriate projects rather than in any project, whether they fit into the analyses' context or not, like in the case of the pre-accession aid analyses.
Also with regard to some of the above mentioned data base problems suggestions for their restitution have been made. In order to avoid similar future data limitations as experienced at present, the data base needs to be continued. This could not only ensure regular updates but also the continuation of newly developed indicators. Furthermore, data collection requirements could be separated from general project work and budgets to allow for better concentration on the realisation of the respective analyses.
The remaining proposals concentrated on the issues of coordination and dissemination of ESPON projects. Coordination between projects and beyond the 3rd tier projects and lead partner could be enhanced through an appropriate role of the ECPs.
As of the extensive number and extents of interim reports summary supports which are separately circulated could support improved circulation of interim results among all ESPON
10 Further problems and details with regard to data limitations are provided in the following section 'Data Gaps'.

xxxi
participants and in general a wider dissemination of ESPON results. Other corresponding suggestions referred to electronic newsletters by the ESPON secretariat, superior communication systems and special funds for conference and seminar participation.
Ideas for New Projects
Some ideas for new ESPON projects were related to general ESPON issues, i.e. as further development of existing projects. However, most ideas were in one way or another associated with ESPON project 2.2.2., especially further investigating the ESDP and territorial developments and policies in the New Member States and Candidate Countries. Some of these suggestions have actually already been incorporated in some way into the latest rounds of calls. The following list just gives an overview over the mentioned possible topics of ESPON research, whether already somehow included or not:
• Macro-regions as great EU sub-areas with stronger institutionalisation
• TINA considered as development axes
• Further development and concretisation of the ESDP (with regard to different kinds of regions)
• 'Pan-European' ESDP in conflict with national / regional / local planning systems
• Continuation of TIA after 2004 in the Candidate Countries
• Structural Funds in the New Member States
• The future of the New Member States and the Candidate Countries – between knowledge economy and manufacturing specialisation
4 Further Research Issues and Data Gaps
4.1 Research Issues Envisaged for the Final Stage of the Project
Generally speaking, ESPON project 2.2.2 could realise the envisaged working steps within the planned schedule, thus delivering in the 3rd Interim Report the corresponding results expected in the Addendum. Nevertheless, there is space for a number of improvements, especially with regard to the results gained so far, though it has to be mentioned that this is at least partly due to late availability of updates for the ESPON database. Some of our analyses could not be realised before the data updates were available. Yet, as far as further updates are available in time, they will be included in the finalisation of ESPON project 2.2.2.
As of the one lasting data limitations, one major task for improvements lies in the finalisation of the quantitative impact assessment11 and the related perfection of the corresponding conclusions. Naturally, the update of these findings is closely connected with further enhancement of policy recommendations. It is envisaged to improve the potential oriented typology presented in the 2nd Interim Report, to provide for a more detailed spatial overview of regional potential provision not only for the types of region identified so far but possibly also for sub-types indicating different levels of development. This more detailed specification of regional potential provision will enable ESPON project 2.2.2 to further elaborate on the policy packages recommended in this report. However, this final and more detailed potential oriented typology is only to be identified once there are no more relevant data updates expected.
11 Here, ESPON project 2.2.2 is particularly grateful for constructive comments on the basis of this interim report.

xxxii
On this basis, policy oriented typology development is also to be expanded. This shall be done in close cooperation with ESPON project 2.2.1 in order to achieve comparable typologies for both, the EU 15 and the New Member States and Candidate Countries. First achievements on these efforts are already visible in the 3rd Interim Reports of these projects. Yet, policy oriented typology development could also be extended either with regard to relevant typologies of other ESPON projects or the aforementioned potential oriented typology.
As far as possible, these improvements will also relate the findings more strongly to the polycentricity objective also analysed in many other ESPON projects rather than concentrating on cohesion. This shall be done on the basis of the then finalised corresponding typologies of ESPON project 1.1.1.
Taking especially account of Community Policies and sector policies, also the Final Report will provide additional insights for the New Member States, as ESPON project 2.2.2 needs to draw on the final results of the respective ESPON projects. But also the own project specific research will be further updated in this context as the ex-ante analysis provided in this report is not yet finalised.
4.2 Inherent Data Gaps Limiting Territorial Impact Assessment Analysis conducted by ESPON project 2.2.2. requires two groups of data: 1. data on indicators measuring regional potentials, e.g. GDP, population density or sector structure, which is provided by the ESPON database, 2. data on policy spending within the pre-accession aid programmes, which is gathered and developed by ESPON project 2.2.2. Data gaps and weaknesses apply to both groups of indicators and are highlighted in the following section.
Data Gaps Related to Potential Indicators
In order to analyse regional development and bottlenecks in the New Member States and Candidate Countries ESPON project 2.2.2 requires several indicators to be provided by the ESPON database. Although indicators envisaged for quantitative analysis have already been strongly revised according to data availability, several indicators are not available at all and the available data shows some significant weaknesses. An overview on potential indicators used and those not available is provided in the respective table in the Annex. Following, weaknesses of available data are discussed.
Data provided by the ESPON database does still not cover the complete ESPON space, but single values are missing for some of the regions/countries. Data gaps are especially significant for Malta and Bulgaria. This applies as well to the periods covered by data since not for all indicators and all countries complete time series are available, what hampers analysis of regional development trends in terms of changes of potential indicators. In addition comparability over time is limited, since for some indicators different data bases and modes of data calculation have been used within different years. This especially applies to the latest data updates provided by ESPON project 3.1 in July 2004. For many indicators considerable inconsistencies between data provided in the ESPON database version 2.4 and the latest New Cronos updates can be detected. Moreover some indicators are only provided on NUTS 2 level, whereas comprehensive policy impact analysis especially in the smaller countries requires more detailed analysis on NUTS 3 level.
Gaps Related to Policy Data
As contribution to the ESPON database and prerequisite for policy impact analysis ESPON project 2.2.2 established country wise databases on policy input data including information on pre-accession aid programmes and projects in terms of amount allocated, year of allocation,

xxxiii
region of implementation, field of action, project’s content etc. Preliminary analysis of these databases were already used in the 2nd Interim Report of ESPON project 2.2.2. However, since then, databases have been improved considerably by completing data especially for Poland and Slovakia. Moreover databases have been cross-checked to improve comparability of data. Nevertheless considerable gaps remain with regard to availability of data as well as correct recording of data that limit reliability and significance of data. A detailed overview on data per country included in the database with regard to data definition, source and main problems is provided in the respective table in the Annex. Following, the main general problems will be discussed.
Data available from the respective national or EU authorities does in several respects not meet the requirements of the analysis conducted by ESPON project 2.2.2. Data weaknesses are related to lacking information on the period of implementation, on the financial amount, on the location of implementation and on the projects content.
For many programmes/projects no detailed information on the period of implementation is provided but only the year of approval. Due to this weakness year of approval has been used as year of financial allocation as far as possible (also if other information was available) to achieve comparability of country wise data. Implementation of project or programmes, however, often start with some time lag after approval and often they run over several years. Accordingly the year of approval does not reflect the period pre-accession aid actually affected regions or countries but rather indicates policy schemes for a rough time period.
Similar reservations apply to information on the financial amount of projects/programmes. Due to largely missing information on the amounts disbursed, the amount allocated was used as far as possible. This again ensures comparability between countries, but does not reflect the actual situation, since the amount allocated often has only been partly actually spend.
Significant problems were related to the regionalisation of data, i.e. the relation of programmes/projects to NUTS 2 or NUTS 3 level regions. Data can only be partially be regionalised due to programmes, especially PHARE programmes, addressing the national level, e.g. institution building measures. These projects obviously can not be assessed with regard to their impact on selected regions. Problems however, occur with regard to projects/programmes which likely are implemented in selected regions but where information on the location is incomplete. This is often the case where only programme information is given and not detailed information on projects, e.g. projects within the PHARE ESC programmes likely are implemented in selected regions, but since often no information was provided on the locations, the programmes had to be attributed to NUTS 0 level. Moreover correct recording of the region affected is difficult in case of projects/programmes affecting more than one region. To meet this difficulty a common recording method was used: in case a project/programme was implemented in two or three regions the financial amount was split equally amongst the region and the project recorded for each region, in case more than three regions were affected, the project/programme was attributed to the next higher spatial level (NUTS2 or NUTS 0). All in all these problems indicate that the amount recorded on regional level remains below the amount actually spent within selected regions and that distribution between regions might be distorted. In addition a general problem is related to the NUTS classification. In many countries NUTS classification is in place only since a few years, e.g. in Poland since 1998 and in the Czech Republic since 2000 (NUTS 2) respectively 2001 (NUTS 3), what leads to assume that data provided on regional basis for earlier years is not in any case reliable and correct.
The main analytical tool used to enable further analysis of policy data is to classify projects/programmes according to the regional potential/bottleneck they mostly address. In order to develop a homogeneous classification a matrix has been developed linking fields of action within all the pre-accession aid programmes to regional potentials they mostly address (see 2nd Interim Report of ESPON project 2.2.212). Although this approach ensured relative
12 Source 2nd IR, p.131f.

xxxiv
coherent recording of data, weaknesses remain. First, often programmes/projects address more than one potential, but due to data processing reasons only one potential could be incorporated. Moreover the information given on the projects contents is often too vague to enable clear decision on which potential is mostly affected. Scope for cross-checking of data in this regard is especially limited, since country databases only contain short descriptions/titles of projects/programmes what hampers controlling of data recorded by the ESPON 2.2.2 project’s country experts. Due to the high number of projects/programmes extended reporting of the projects/programmes contents could not be realised with resources available for ESPON project 2.2.2.
Availability and quality of data differs between the pre-accession aid programmes. For PHARE and PHARE CBC for many countries no other data than information on sub-programmes was available. Since information on these sub-programmes are often not detailed with regard to contents, location and period of implementation, and only indicative figures on financial allocations are provided, detailed recording in terms of correct selection of regions affected and potentials addressed is limited. Even if project data is available, these data often seems not to be reliable especially in the larger countries where PAHRE programmes started early in the 1990s due to a large number of projects and incorrect collection of data in the early years of PHARE implementation. PHARE CBC programmes though not providing detailed information either could at least be located within the respective border regions. Data on ISPA for all countries gives detailed information on projects in terms of location and fields of action, thus, regionalisation and classification of projects according to potentials addressed could be compiled without major problems. Since for nearly all countries ISPA data was gathered from the DG Regio’s Mini ISPA Report 2000-2002 high level of data comparability has been achieved. Data is provided for projects signed, but only an indicative amount of financial allocation is given. Despite these weaknesses of data for PHARE, PHARE CBC and ISPA country databases for these programmes are completed, since further investigations towards improvement of data is not within the scope of ESPON project 2.2.2. Data on SAPARD is the most incomplete, since data for Bulgaria, Latvia and Romania is still missing completely and data for the other countries covers different time periods and includes different data definitions. However, for the countries already included data is mostly available on regional level and due to clearly defined fields of action within SAPARD classification according to potentials addressed could be conducted reliably. Further attempts will be made to fill existing gaps on SAPARD data within the final project period of ESPON project 2.2.2.

1
PART II: Results of the Project
5 Methodological Overview The spatial outline in the contract for ESPON project 2.2.2. asks for an analysis not only of the candidate countries but the EU 27+2, explicitly including Norway and Switzerland. However, a territorial impact assessment of pre-accession aid can only be approached for the countries which have received such funds, i.e. the candidate countries. In order to provide an overview of the different spaces analysed at different steps of the project the following first subchapter explains which area is under analysis at which stage of the project, especially pointing out the role of Norway and Switzerland within the research.
The second part of this chapter refers to the different approaches of quantitative analysis, especially referring to the relation between potentials and EU policies and to the different following steps of quantitative analysis, as the core of analysis in ESPON project 2.2.2. However, before turning to the methodology of EU policies' impact assessment a short methodological overview is given with regard to the analysis of the relation between national spatially oriented policies and EU measures. Due to data limits in the quantitative analysis, as described below and partly also in earlier interim reports1, a deepening qualitative analysis is envisaged as well, which is realised by means of case studies on which in the third part of this chapter a short methodological description is provided. Following, an outline is provided for further steps envisaged in the course of the preparation of the final report, aiming at provision of a comparative TIA of the EU 15 and the candidate countries under consideration of ESPON project 2.2.1. and 2.2.2. results, possibly, and as far as possible, also incorporating outcomes of other policy analysis projects. Finally, the chapter closes with an overview on indicators developed and applied by ESPON project 2.2.2.
5.1 Spaces and Spatial Levels Under Consideration
The New Member States and remaining Candidate Countries present the core territory of analysis, as all policies under examination have only been implemented in these countries. This concentration is also envisaged to avoid overlapping analyses with other ESPON projects under priority 2, especially ESPON project 2.2.1. However, in order to achieve comparative results for the whole ESPON territory, especially typologies are and will be developed in close cooperation with the aforementioned ESPON project (see below section on typologies).
In detail this means, that the quantitative potential analysis has been conducted for the territory of the whole EU 27 + 2, while the policy analysis has to concentrate spatially on the New Member States and Candidate Countries. Consequently, also quantitative territorial impact analysis can only be conducted for the latter territory. However, the remaining ESPON territory has been included in the frame of qualitative analysis steps, as described in more detail further below. Generally speaking, the meta analysis of national spatial policies, being related to EU measures, specifically refers to Switzerland and Norway. Furthermore, the qualitative analysis regarding the spatial integration objective (WP 7) also took account of countries in the ESPON territory other than the New Member States and Candidate
1 See Kujath, Zillmer et.al. (2003: 32-39) and Kujath, Kunkel, Zillmer et.al. (2003: 23-26, 33-34).

2
Countries. This has been realised in the frame of one cross-border case study, where a German-Polish border region has been under consideration and especially in the context of the analysis referring to trans-national macro-regions. Here, the selection took special account for Switzerland in the analysis of the Alpine Space and within the Archimed macro-region, apart of the Mediteranian island economies especially relations with Greece have been comprised.
Appropriate policy indicators have thoroughly been collected and regionalised by ESPON project 2.2.2. However, due to data limits within the established policy data base it is not possible to conduct a consistent policy impact analysis on NUTS 3 level for the whole territory of the New Member States and Candidate Countries. Nevertheless, ESPON project 2.2.2. relates to the NUTS 3 level as much as possible, also in order to be able to conduct any spatially relevant analysis for the small countries, such as the Baltic countries and Slovenia, which each have only one NUTS 2 region. Therefore, for most smaller countries Phare and pre-accession aid policies have been regionalised at NUTS 3 level. However, as for many Phare and pre-accession aid measures a definite allocation on NUTS 3 level is either impossible (in the case of Poland as of the particularly large number of projects) or leads to unnecessary inconsistencies, these policy data have been regionalised on NUTS 2 level only for the larger countries.
Table 5-1: Spatial Level of Regionalised Policy Indicators according to Country
NUTS 2 NUTS 3
Bulgaria, Czech Republic, Hungary, Maltaa, Poland, Romania
Cyprus, Estonia, Latvia, Lithuania, Slovakia, Slovenia
a Though Malta is the smallest country under consideration, no NUTS 3 level allocation of policies has been possible.
Analyses and especially policy recommendations differentiate between the different spatial levels of the 3-level approach in ESPON. In particular with regard to the different spatial objectives under consideration, references are made to the different spatial levels. Thus, for instance the objective of spatial cohesion is analysed for the European macro-level but also on national level. This way, the analysis not only takes account of the development of inter-country disparities but also of the development within the countries2.
Table 5-2: Integration of 3-Level Approach in ESPON Project 2.2.2.
2 See for example map 8-8 in 2nd Interim Report of ESPON project 2.2.2. (Kujath, Kunkel, Zillmer et.al. 2003-2:
157).
e.g. Urban-rural disparities within a
region
e.g. Spatially equal distribution of competition between regions of
a country
e.g. Spatial cohesion between EU 15 and
New Member States/Candidate
Countries
Policy Recommen-dations
e.g. Allocation for local infrastructures
e.g. Allocation for national system of transport
infrastructure
e.g. Allocation for national institutions
in comparison Quantitative Policy DataAnalysis
Effects of policy measures within the
region
NUTS 2 regions' position in relation to other regions in their
country
Macro-regions regarding their
spatial integration Case Studies
Micro-level (regional/local)
Meso-level (national) Macro-level (international)
3
Table 5-2 provides an overview on the different spatial levels as included in the different working steps of ESPON project 2.2.2. The first two lines are related to the qualitative and quantitative approaches of territorial impact assessment of the policies under examination. The last line relates to the approach taken in the final section of Part 2 of this Interim Report. The table only gives examples for one or another spatial objective in either step of the analysis and recommendation development. However, within the respective analysis and recommendation sections below, it is tried to follow the whole structure of the 3-level approach consistently for each of the spatial objectives ESPON project 2.2.2. is interested in. Nevertheless, as of data limits and/or other constraints, in some cases the analysis might not refer to all three levels but to selected spatial levels only.
5.2 Relation of EU Funding and National Instruments for Territorial Policies
Work package 4 considers the potential for conflict or complementarity between national instruments for a territorial policy and two elements of the wider policy context: territorial development goals and EU funding programmes.
The foundations of this report are in the methodologies and theoretical frameworks outlined in the interim reports of ESPON 2.2.2. The European Policies Research Centre (EPRC) has prepared the report on the basis of a series of country reports, which were allocated as follows:
Bulgaria, Hungary and Romania: Centre for Regional Studies of the Hungarian Academy of Sciences
Czech Republic, Switzerland and Norway: European Policies Research Centre
Estonia, and Lithuania: Centre for Regional and Tourism Research
Slovenia and Latvia: Institute for Regional Development and Structural Planning
Poland and Slovakia: Centre for European Regional and Local Studies, Warsaw University – Euroreg
Malta and Cyprus: University Research Institute of Regional Development/ University of Social and Political Sciences of Athens.
As a ‘comparative analysis of national instruments for a territorial policy’, this report had the potential to cover an extremely large number and wide range of policies. This problem is exacerbated by the diverse range of countries to be covered, making broad generalisations difficult. The fourteen countries include West European, non-EU Members (Switzerland and Norway), island economies (Malta and Cyprus), East European Candidate Countries (Romania and Bulgaria) as well as the ten New Member States. The report also has the potential to cover a vast range of policies. Virtually all functions performed by government that involve public expenditure have the potential to affect regional balance (European Commission: 2004: 81). With this in mind, the report provides a summary of key policy areas with the potential to have significant spatial/territorial development impacts, particularly in relation to cohesion at the national and EU level. Key policy objectives, policy instruments and policy impacts are highlighted, using selected examples from the countries covered in the report.
As policies with an explicit spatial focus, the analysis of national regional policy was carried out in more in-depth. The analysis required the close examination of a wide range of policy documentation. Particular attention had to be given to data and document availability. In many of the CEECs, recent policy, territorial and governmental reform made data collection particularly challenging, especially in the cases of Romania and Bulgaria. In order to ensure an efficient, standardised approach, checklists were produced by EPRC and sent to individual
4
country experts. In developing the checklists, the results of an extensive literature review were used. Each of the checklists followed a standard model and aimed to
• give country experts an indication of the type of information EPRC already had;
• identify where more information is required and;
• provide suggestions of where relevant material could be obtained. The checklists were structured around the following key themes:
• Territorial Administrative Structure: Detail the territorial administrative structure of the country, including the number of sub-national divisions and the responsibilities of the authorities at these levels.
• Evolution and Objectives of Policy: Evolution, philosophy, rational and concept of regional policy and or national spatial development policy.
• Policy Documents and Instruments: What are the main national regional/spatial policy instruments? Spatial targeting?
• Implementation: What are the national level institutional structures for regional policy?
• Compatibility with EU policy: To what extent have recent changes, or anticipated developments in regional policy compatible with the EU, e.g. are references made to the compatibility of these policies with EU regional policy approaches, EU-pre-accession instruments, EU State Aid Guidelines, EU spatial development objectives?
The report also draws upon the results of existing programmes of research carried out by EPRC.3 The project makes particular reference to reviews of national regional policy, carried out for the EoRPA consortium of European governments,4 comparative papers prepared for the ‘Benchmarking Regional Policy in Europe’ conference5 and Wishlade, Yuill et al. (1996).6 The research team has also particularly benefited from the opportunity for consultation and exchange with partners involved the ESPON 2.2.1 project, Work Package 5. This contribution has proved to be invaluable.
The checklists and subsequent cross-country analyses aimed to gain insights into the full range of ways in which national regional policy could complement or conflict with the wider policy frameworks under review. By considering each of the key elements in turn, it was possible to gain a better understanding of how, for instance, policy implementation and policy objectives, as well as policy instruments, could relate to EU development frameworks.
3 Of particular value have been insights and feedback provided by Professor Douglas Yuill and Professor John
Bachtler.
4 http://www.eprc.strath.ac.uk/eprc/projectLookup.cfm?ID=96 .
5 Benchmarking Regional Policy in Europe Conference Forest Hills Hotel, Loch Ard, Scotland 9-12 September 2001
6 Wishlade, F. and Yuill, D. et al. (1996) Economic and Social Cohesion in the European Union: The Impact of Member States’ Own Policies Report to the European Commission (DGXVI).
5
5.3 Quantitative Analysis of EU Policies' Impacts and TIA Further territorial impact assessment needs to be analysed under the three objectives, already mentioned in the first two interim reports, namely
• Spatial cohesion
• Balanced spatial competition
• Spatial integration
But before pre-accession aid can be measured against these spatial objectives, it needs to be related to the regional situation. Since Phare project data is not complete for the early years across all candidate countries and since Phare programmes were started at different points of time in the 1990s, only the last years of Phare programmes and pre-accession aid starting with 1998/1999 will be under consideration. Any consideration of earlier programmes is likely to incline not comparative results. Furthermore, in the early years, most Phare funds have been used for national rather than regional project implementation, which makes a territorial impact assessment the more difficult for the respective period of time.
Relation of Regional Potentials and Pre-accession Aid Allocation
Several steps of analysis should be distinguished, which could help to understand the spatial pattern and development in the regions of the candidate countries.
First Step – Improving Descriptive Analysis under Spatial Cohesion Objective
While the 2nd Interim Report already outlined a number of different regional potentials for the Candidate Countries and New Member States, further analysis elaborates more strongly on the policy dimension and provides improved descriptions on the spatial allocation of pre-accession aid measures as related to regional GDP. However, apart of the purely descriptive part of financial policy allocation, the analysis also relates to spatial objectives, as a kind of location quotients have been calculated (Miller, Gibson and Wright 1991:65-66 and Mack and Jacobson 1996: 5-8). In contrast to the usual utilisation of location quotients on the basis of economic sectors' activity, here, they depict the relative importance of the structure of pre-accession aid spending in the respective country's context. A regional quotient with a value above one then reflects an above national average intervention with respect to the relevant potential, while a regional quotient below one displays an intervention level below national average. This quotient allows to show the main regional emphasis of pre-accession aid allocation in relation to each of the potentials.
Alternatively, these quotients could also be calculated in relation to the spending structure in all countries under investigation. However, such an approach could distort the results as of the large differences in respective financial resources. Hence, the analysis concentrates on a regional comparison per country. In the second step, this relative importance of potential i oriented spending can then be mapped against the respective potential in t0.
Second Step - Relation between Potentials and Pre-Accession Aid Measures
Before the different objectives of pre-accession aid are related to the respective potentials, first an overall relation between total pre-accession aid allocation and general regional situation shall be given. Simultaneously, this general relation is also suitable as policy oriented typology and is to be developed on a comparative basis to the respective typology of ESPON project 2.2.1, since both projects can only refer their policy typologies to parts of the whole EU 27 + 2 territory.

6
For the potential oriented relations of the location quotients, the structure of table 7-24 of the 2nd interim report could provide the basis as well as the data which represent the foundation of the maps in the 2nd interim report depicting regional pre-accession aid allocation aiming at the improvement of different potentials.
Apart of improvement of table 7-24 in terms of national focus, further improvement of table 7-24 data goes beyond national level on regional level, providing an answer on the question ‘how much or what share has been spent on which potential in which region?’. This regional allocation aiming at different potentials can be utilised in relative terms (relating total allocation to GDP or population) to correlate policies with potentials. On a descriptive level, this relation can be mapped in a simplified way, distinguishing between regions of low, medium respectively high intervention level of pre-accession aid. Combined with the respective potential indicator a first relation between potentials and pre-accession aid allocation can be reflected as indicated in Figure 5-1.
Figure 5-1: Indication of descriptive relation between potentials and pre-accession aid allocation
Relative pre-accession aid allocation aiming at potential i
low medium high
low
medium
Potential indicator i
high
By means of such a grouping, regions with high potential specific intervention and high respectively low potential can be identified, which suggests whether pre-accession aid allocation is used for improvement and utilisation of existing potentials or aims at the reduction of existing bottlenecks. Thus, these maps for the different potentials can show, in how far regional pre-accession aid allocation focuses on potentials and bottlenecks. Consequently, at this stage potential indicator values at the beginning of the observation period are used for the relation between policies and potentials.7
In order to achieve a comparative division of groups for the different potentials, it is necessary to group each of the indicators according to the same rule. While grouping on the basis of the same number of region per group (each a third of the regions fall in the low, medium and high group) seems to be most appropriate at first glance, it is not feasible as of the distribution of indicator values across regions. E.g. for some of the policy indicators much more than a third of the regions have not received any aid directly, thus the respective indicator value would be zero and the regions could not divided into three equal slices. Thus, we suggest to take instead the difference between the highest and lowest indicator value and divide this difference by three.
Third Step – Developing Comparative "Double Indicators" for Each Region and Nation
Based on the policy and potential indicator values for each potential group a combined indicator can be developed, which we call a "double indicator". To gain these indicators, policy and potential indicator values are put into relation. Since in quite a number of cases, the policy indicator might take the value of zero, it is most appropriate to take this indicator as numerator:
7 However, these maps can only be provided for those potentials, for which adequate and verified data are
available. More information on data problems is provided in Part I, Data Limitations.

7
ri
rir
i indicatorpotentialquotientlocation
indicatordouble = with i = potential group and r = region.
Although this approach simplifies the characterisation of potentials by reducing the number of indicators, it allows to get comparable indicators across regions showing the relation between potentials and pre-accession aid allocation.
Fourth Step – Developing a Policy and Potential Related Typology
Having conducted all these preparatory steps for a policy analysis relating pre-accession aid allocation to regional potentials a typology of EU policy intervention in the candidate countries can be developed by means of cluster analysis. To achieve this typology, all regions are clustered across all double indicators for the different kinds of potentials under consideration. However, such a typology is not yet related to territorial impacts of pre-accession aid. Instead, it classifies the regions according to policy intervention on the basis of region specific characteristics at the beginning of the observation period. Nevertheless, as this step is only reasonable once the database not only for policy data but potential data is as comprehensive as possible, this analytical step will be postponed for the final report.
Fifth Step – Typology for Territorial Impact Assessment Approach
To try to achieve a territorial impact assessment of pre-accession aid implies to include the development of regional potentials into the analysis. Although there are certainly a number of additional influences, which affect regional potentials – like national policy interventions of different kinds, natural events and other policy independent developments – the depiction of potential changes in relation to pre-accession interventions might in most cases provide an idea about the direction of policy effects.
01 tri
ri
tri
rir
i indicatorpotentialquotientlocation
indicatorpotentialquotientlocation
indicatordouble −=∆
with t0 = beginning of observation period, i.e. 1998/1999 and t1 = end of observation period.
As of the existence of other possible effects affecting regional potentials, a typology based on a cluster analysis of these development indicators however, does certainly not point out the scale of effects. Instead, it only might provide a first idea about the direction of effects. Special attention needs to be directed towards those regions where the change of the double indicator suggests a deteriorating rather than an improving potential despite policy interventions aiming at the respective potential. In such cases a deeper analysis needs to search for specific influences which might have contradicted pre-accession aid objectives. Also regions with low or none obvious impact might have to be looked at more closely, as other influences might have reduced positive effects of pre-accession aid projects. Anyhow, above classifications help to identify the different kinds of cases which can then be looked at more precisely in order to identify actual relations between policies and potentials, supporting territorial impact analysis.
However, apart of the above mentioned role of additional effects affecting regional potential indicators, there are further limits to this step of analysis involving the development of the changes of double indicators as well as the corresponding cluster analysis. These limits are basically
• data limits – not for all potentials comprehensive data covering all regions of all Candidate Countries and New Member States are available both for the beginning as well as the end of the period under consideration;
• time limits – many economic indicators (also included in the potential analysis) need, due to time lags, a number of years until effects of policy interventions are reflected in the respective indicator.

8
So far, an approach is made for territorial impact assessment in terms of change of potential indicators as a possible and partial result of pre-accession aid intervention. However, this is done without any reference of territorial objectives, for which the following sections provide additional methodological steps of analysis.
Analysis of Spatial Cohesion
The objective of spatial cohesion is related to converging conditions of life and usually measured in terms of per capita GDP and unemployment rate distribution8. Although there are other indicators as well depicting life conditions more accurately, we will rely on income and unemployment indicators as other indicators are even more difficult to gather on NUTS 3 or at least NUTS 2 level for all regions of the candidate countries.
In order to analyse the ESDP objective of spatial cohesion the development of the respective indicators has to be observed. For additionally achieving a territorial impact assessment, it has not only to be shown whether the regions have converged or diverged in terms of income and unemployment but in how far a relation between income respectively unemployment development and pre-accession aid allocation can be identified. In order to accomplish this relation simple regressions are to be conducted, which at a first stage show whether any significant effects of pre-accession aid allocation in total, i.e. without dividing according to different potentials, can be observed. As of the low level of intervention in terms of total funds spent within the pre-accession programmes such a general regression can help to quantify the role of pre-accession aid funds.
ct
rrtNN
rt
rt
r DPAAPOTUEGDPOneGDP ⋅+⋅+⋅+⋅+⋅+=∆ ∑−− εδχβα000 ,11
with GDP = per capita GDP, one = constant, UE = unemployment rate, POT = potential indicators, PAA = relative pre-accession aid expenditure, Dc = Dummy for country c and α, β, γ, δ, ε = coefficients.
Similar regression equation can also be developed for the second cohesion indicator, namely ∆UEr. After testing for correlations between above variables, these seem to be the most important and possible variables to be incorporated in such regressions. In addition, the constant is likely to show significant values as of the other influences which cannot be included into the regression appropriately, such as national policies, influences of economic and political transformation, natural disaster.
A positive coefficient δ in the income regression reflects a positive relation of pre-accession aid with GDP per capita growth, independently of the aid's priority or objective. However, only if this coefficient is significant a perceptible influence can be assumed. Theoretically possible are also regressions which distinguish pre-accession aid allocation according to its objectives and potentials addressed. But due to different quantitative funding levels for the various priorities, the outcome is likely to depend on the relative amount spent for one or the other priority rather than the impact per Euro spent. Therefore, significant results of pre-accession aid differentiated according to the priorities of spending can easily be misleading.
Despite this simplicity of analysis, it has a number of shortcomings which are mostly connected with the length of the period of time under consideration as well as the amount of pre-accession aid spent in the candidate countries, especially on regional level. With regard to the period of time it has to be noticed that impact variables like GDP and unemployment rates adjust with time lags, thus, if only a few years of time can be included in the regression, impacts on GDP and unemployment might not yet have occurred but can still be expected. On the other hand, a longer period of time rather than those suggest in above section does not seem to be appropriate, e.g. as of the still declining incomes in most candidate countries until the middle of the 1990s under transformation influence. This argument is also closely
8 See e.g. the differentiation of indicators in Kujath, Zillmer et.al. (2003-1: 30-31).

9
linked with the allocation of pre-accession aid on regional level, where very little funds have been allocated to regional projects rather than national projects until the late 1990s. Finally, EU-funds spent in the candidate countries often amount to only very few percentage points of national aid, which stresses that pre-accession aid is likely to have qualitative rather than only quantitative impacts on spatial cohesion.
Thus, even if coefficients of pre-accession aid are not significant, results need to be interpreted cautiously in order to avoid the conclusion, that these funds do not support spatial cohesion. E.g. they also can induce growth and cohesion in a more indirect way, i.e. by mobilising other funds from national or regional sources which were not mobilised without EU funding.
Despite its shortcomings, this approach is closely related to the one taken by Biehl (1995: 73-77), where he tested the potential factor approach by means of quasi production functions. The central hypothesis there is, that a region's development potential is the higher the better its equipment with potential factors. In this context, potentials are exogenous variables and the development potential is endogenous. Biehl (1995: 70-73) has conducted such an analysis for the EU 12 on NUTS 2 level by taking account of the economic geographic location, agglomeration, sector structures, infrastructure, country dummies and an error term. These different potentials have also been included in the analysis of ESPON project 2.2.2, even to a more detailed degree. Similarly to the approach related to employment and income, this analysis can also be conducted for productivity as the endogenous variable, which is described in the next section of this chapter.
Analysis of Balanced Spatial Competition
The objective of balanced spatial competition aims at comparable competitiveness of regions. Thus, despite differing resources between regions and regional specialisation, this objective seeks to improve productivity of regions. Consequently, productivity and productivity changes are prominent indicators for measuring spatial competition.9 Analogously to the analysis of the impact of pre-accession aid policies on spatial cohesion also for the impact on balanced spatial competition a regression approach is envisaged, for which the corresponding equation can be written as follows:
rtr
t
rt
t
r
rtNN
rt
rtr
rr
SecEmpEmpGDP
PAA
POTUEGDPOneEmpGDPoductivity
0
0
0
000
,3,2,13,2,1
,11Pr
⋅+
⋅+⋅+
⋅+⋅+⋅+=
∆=∆
∑
−−
φεδ
χβα
with Emp = Employment rate, SecEmp = sectoral employment rate in primary, secondary and tertiary sector respectively and ε and Φ = additional coefficients.
This regression aims at showing the likely effect, pre-accession aid measures might have on regional productivity changes. Again, if a positive relation between funds' allocation and productivity development can be identified, different policy options could be followed. Firstly, a policy aiming at improving productivity while also seeking spatial cohesion would have to focus productivity increasing policy measures on lagging regions. This way, they should be enabled to reduce the productivity gap between advantageous and disadvantageous regions. And secondly, such a policy could also be used for 'maximising' overall (national) productivity by explicitly supporting regions with a comparatively high productivity level, which is thus likely to contradict the objective of spatial cohesion.
9 See e.g. description on balanced spatial competition in Kujath, Zillmer et.al. (2003: 18-19).

10
Regarding the limits of interpretation and data availability and quality, the same restrictions apply as described in above chapter on the quantitative analysis of spatial cohesion.
Analysis of Spatial Integration
For a comparative analysis of the spatial integration objective a similar regression approach could be thought of as described above. Then, spatial integration would have to be measured by means of different indicators, such as the development of regional and national trade balances, trade development with regard to commodities, transport flows and personal border crossings based on different kinds of interaction10. However, many of these data are not available for all regions under consideration. Thus, rather than going for a quite incomplete and hence not convincing quantitative approach, the analysis the spatial integration objective concentrates on the qualitative aspects and methodologies as discussed in below section.
5.4 Qualitative Analysis of EU Policies' Impacts and TIA
In accordance with the differentiation between the territorial impact assessment with regard to spatial cohesion and territorially balanced competition in WP 5 and the spatial integration objective in WP 7, also the qualitative analysis, i.e. the case studies, is divided in these two groups. Consequently, the process of case study selection was divided accordingly and the comparative case study approaches have been adjusted to the respective work package's needs.
Case Studies Focussing on Spatial Cohesion and Balanced Spatial Competition
Based on considerations of the fields of intervention, which are not covered by the quantitative analysis due to lack of data, e.g. institutional or environmental conditions, and the specific country knowledge of the project partners the following case study regions were chosen:
Table 5-3: Responsibilities for case studies in WP 5 and regional case study specification
Region (NUTS 2 /NUTS 3)
Type of region Thematic field focused on
Responsible Partner
Estonia Peripheral small country
Environmental quality, regional disparities in a small country context
IRS
Malta Peripheral island economy
Institutional conditions CRT
Warsaw Metropolitan Region, PL
Capital city region Transport infrastructure EUROREG
Slaskie Voivodship, PL
Old industrial region Industrial restructuring EUROREG
Szabolcs-Szatmár-Bereg County, HU
Peripheral eastern and rural region
Rural development, institution building
HAS-CRS
10 For different elements measuring spatial integration see for instance EUROREG et al. (2003).

11
Borsod-Abaúj-Zemplén County, HU
Declining industrial region
Industrial restructuring, institution building
HAS-CRS
The selection of case study regions in Table 5-3 reflects especially these fields of intervention and considers that different types of regions are to be covered and that different policy approaches with regard to the potentials/bottlenecks addressed are to be analysed.
To enable comparative analysis a common approach was used for the case studies based on a template which defined the main research questions and gave guidance concerning the detailed case study outline.
The following overall research questions have been formulated leading the analysis:
• How could the situation and development path of the region be characterised with respect to regional potentials/bottlenecks?
• Which priorities were set by pre-accession aid projects?
• Were pre-accession aid projects directed to meet the regionally specific situation of potentials/bottlenecks?
• Did pre-accession aid projects affect regional potentials / bottlenecks, and if yes how?
• Did pre-accession aid projects contribute to territorial development objectives (equity, efficiency), and if yes how?
• Were pre-accession aid projects embedded in regional development structures (national strategies)?
• Were pre-accession aid projects embedded in regional institutional structures? Did they affect regional governance?
Basic research was conducted as desk research aiming at analysing the regional situation and the general structure of regional policies in the region, including pre-accession aid as well as national policy. Then, an impact analysis in the defined thematic field had to be approached by conducting expert interviews in the region. Analysis could either focus on project or programme level depending on the chosen region and thematic field.
Comparative analysis of case study findings focuses on common conclusions in terms of policy assessment with regard to regional potentials and bottlenecks and with regard to territorial objectives. On basis of these issues development for proposed policy recommendations has taken place.
Case Studies Focussing on Pre-accession Aid's Impacts on Spatial Integration
The case studies focussing on the spatial integration objective of the ESDP represent the core of the analysis of WP 7. They are supplemented by a meta-analysis taking account of programming documents and existing evaluation reports of the respective INTERREG and PHARE CBC programmes. These analyses comprise not only the substance and effectiveness of regional cooperation in different trans-national macro-regions but the development of the challenges for cross-border cooperation as well. In addition, the analysis of the ability of the thematic structural priorities of the implemented spatial policies is of major importance, as well the relevant supporting financial mechanisms for the promotion of cross-border spatial integration and transnational regionalism. In the end, these analyses bring about the development of proposed policy recommendations for transnational networking measures and cross-border cooperation.

12
In total, five case study regions have been selected and conducted by four different partners of the TPG, as below table stresses:11
Table 5-4: Responsibilities for case studies in WP 7 and regional case study specification
Partner Case Study Region
UEHR Trans-national macro-region ARCHIMED
IRS Trans-national macro-region ALPINE SPACE
EUROREG (supported by IRS) Germany-Poland – Euroregion Viadrina (cross-border region EU 15 – New Member States)
CRS HAS Hungary-Slovakia (cross-border region between New Member States) and Hungary-Ukraine (cross-border region of new extern EU 25 border)
This differentiation shows, that apart of trans-national macro-regions, which also involve neighbouring countries (Switzerland in Alpine Space), reference has been made to the three different kinds of border regions as institutional aspects are concerned. Due to this selection it has been thus possible to made reference to the different kinds of cross-border programs encountered in the EU 15, former Candidate Countries and Neighbouring Countries. The remaining selection within each of these possible types of border regions had to be made on the basis of pragmatic decisions in dependence of language knowledge and data availability minimizing data gaps and additional (often complicated) data collection.
Referring to the methodology, it has to be mentioned, that after having a really useful collaboration with the Institute for Regional Development and Structural Planning (IRS) in Germany as the leader of ESPON 2.2.2 TPG, RDI – as the responsible partner for WP 7 – decided to divide this work package into two stages. The first stage representing the different steps of the partners' case study conduction and the second stage referring to the elaboration of the comparative analysis including additional desk research on the basis of overall evaluation reports etc.
In the first stage each case study research team had to fill in a template, which was compiled and distributed among the respective partners by RDI. This template served as guideline for coordinated outputs and timetable. This template consisted of two parts: Part A "Desk Research" and Part B “Empirical Work”.
The Part A "Desk Research", gives some basic information upon the portrait of each region in general, the structure of policies (European or/and national), that have been implemented and the evaluations as well that came up from the PHARE CBC, TACIS & INTERREG interventions in each region. The territorial dimension and impact with special regard to the integration objective is appointed as the crucial priority for the research. Generally speaking, this analysis focused on the role of the pre-accession aid for the emergence of trans-national and cross-border cooperation and secondly on additional national, regional and local factors in the respective countries, playing a role for the cooperation in these macro- and cross-border regions.
The Part B "Empirical Work", pays special attention to each case study and offers useful data and evaluations by experience through interviews and other related documents. Mostly, interviews have been conducted at both, program and project level, the latter directed on highlight projects. On the basis of the desk research undertaken in both parts and the interview results, case study reports focused on networking related questions in the specific field chosen. Within their chosen field, which had to be of particular relevance for the case
11 A spatial overview of the respective case study regions is also given in the respective map in the Annex.

13
study region, and apart of specific questions for each region, all case studies had to answer similar questions in order to achieve a comparative approach:
• What kind of effects (direct / indirect) on developments in the specific fields can be found?
• To which extent net working procedures were successful and contributed to more permanent co –operation structures? Did the respective policies also lead to informal and private co-operation? Are these projects sustainable?
• To what extent do the specific effects also affect broader spatial development objectives?
• Which improvements of intervention and their effectiveness can be expected from future application of Interreg etc.?
At the same time RDI proceeded with desk research analysis of the European Initiatives basic policies & finance (Interreg, Tacis, Phare CBC), as well as to develop some conclusions based on the official evaluations (ex-ante or ex-post), highlighting their spatial impact to the New Member States mainly. Also, in this part, the macro-regions' case studies have been complemented by supplemented desk research on the two other macro-regions in the space of the New Member States and Candidate Countries, i.e. the Baltic Sea Region and CADSES regions.
In the second stage the final reports of the five case studies had to be reviewed by RDI, in order to be able to represent the final document preparing a comparative analysis and evaluation, as well as policy recommendations for the future, in terms of the European Initiatives' eligibility criteria, aiming to support further cross-border cooperation and the emergence of transnational macro-regions.
Overall, the WP7 final and comparative report consists of an introduction and two main chapters. The latter are divided between the two steps of comparative research, i.e. first reference and evaluation of the basic European Initiatives' measures and second the comparative analysis of the case studies heading for respective policy recommendations.
5.5 Ex-ante Analysis
Work Package 6 of ESPON 2.2.2 is entitled an ‘ex-ante analysis of the influence of the Structural Pre-Accession Aid and Structural Funds on balanced territorial development in the EU territory’. As this work package is not finalised yet, here only the methodology for those analytical steps is provided in short which have already been accomplished.
A key component of this work involved a meta-analysis of ex-ante evaluations of the National Development Plans of the New Member States. In the context of Structural policies, the ex-ante evaluation process has a number of core elements, namely
Evaluation of existing programmes – taking account of previous experiences and thus providing the link between ex-post and ex-ante evaluation;
Evaluation of the adequacy of the socio-economic context of the programmes – integrity and accuracy of analysis, description and explanation of main problems, whether the objectives and priorities stipulated by the programmes correspond to this analysis;
Evaluation of strategic choices and the action priorities selected and their internal and external consistency – assessment of the justification of selection of priorities, content of strategic objectives, internal and external consistency of the NDP;
The quantification of objectives;
Evaluation of anticipated socio-economic impacts and the allocation of funds;
Evaluation of the implementation system of the programme. Blažek and Vozab (2003)

14
The assessment undertaken as part of WP6 uses this structure as a framework for analysis. The analysis builds upon the work of previous work packages (1-5) and accompanying literature and policy reviews. It also involves an innovative meta-evaluation of ex-ante evaluation reports of national programming documents. A matrix was developed in order to enable a systematic cross-country comparison. Apart from giving general comments on the available evaluation material this matrix summarises the main positive and negative aspects of policy programming and objective setting differentiating between a number of issues:
• Key challenges
• Coherence of strategy
• Integration of horizontal/sectoral themes and EU policy
• Integration of territorial themes
• Programming
• Implementation and monitoring
• Level of decentralisation
• Absorption capacity
In this matrix explicit reference is made to territorial development, regional development issues and spatial development trends. Thus, this working step provides a comprehensive ex-ante analysis for Structural Funds in the New Member States also tackling critical issues, such as the absorption capacity. Furthermore, it also provides this evaluation for the remaining Candidate Countries not facing Structural Funds in the next programming period, which supplies valuable information for their further preparation of EU membership. Finally, this analysis can also be very useful for the implementation of preparation measures in further (future) Candidate Countries (Turkey, Croatia and other Balkan countries) not receiving pre-accession aid yet.
5.6 TIA – EU 15 and the Candidate Countries
For the last stage of the project, i.e. the final report, it is envisaged to combine the territorial impact assessment of ESPON projects 2.2.1 and 2.2.2 as far as possible, by e.g. providing combined policy oriented typologies. Also a comparative level of the policy meta-analyses undertaken in both projects is foreseen, since EPRC has been the responsible partner for these tasks in both ESPON projects. However, in how far these combinations are reasonable and actually lead to comparable results for both, the EU 15 area and the New Member States and Candidate Countries can only be reviewed on the basis of the 3rd Interim Reports of both projects. Thus, further methodological comments on the combination of both projects' results are envisaged for the final report.
5.7 Indicator Development
ESPON project 2.2.2. provided a first input to the ESPON database including the main indicators developed, which concentrate on the pre-accession aid policies in the New Member States and Candidate Countries12. Additional indicators to those provided for the ESPON database have been developed in order to conduct quantitative analysis presented in the following chapters. Up-dates to the ESPON database will be delivered in the final period of the project. A full list of policy indicators developed so far is provided in the Annes. All policy indicators refer only to the candidate countries, therefore they do not include
12 On the problems for developing policy indicators also compare chapter 4.2.

15
information on Interreg measures in Norway and Switzerland. Data structure does not allow to include these 2 countries connection with EU policies in the framework of Interreg into the present data base and thus into below given indicators.
Beside the policy indicators further indicators have been developed by ESPON project 2.2.2 by combining policy indicators with indicators measuring regional development potentials provided by the ESPON database. A list of spatial indicators applied from the ESPON database is provided in the Annex.

16
6 Review of the Acquis and the Implementation of Community Policies
6.1 Introduction Analysis on spatial impacts of the adoption of the acquis in the New Member States and Candidate Countries based mainly on country analysis has already been provided in the second Interim Report of ESPON project 2.2.2. This analysis has been deepened and extented by focusing on the relation between the various chapters of the acquis and their relevance for territorial developments. Those issues of the acquis assessed as highly relevant for territorial developments will be discussed in the following section in more detail followed by common conclusions taking country-wise and chapter-wise analysis likewise into account.
The acquis communautaire comprises all the treaties, regulations and directives passed by the European Union institutions as well as judgments by the Court of Justice. Adoption of the acquis by the new Member States and Candidate Countries is at the centre of the enlargement process. Each applicant country has to ‘close’ all 31 chapters of the acquis before they enter the EU, see Table 6-1. The acquis incorporates an extremely wide range of often highly technical issues ranging from arrangements for the implementation of Structural Funds to border controls and nuclear safety. The Candidate Countries and new Member States have varied in their progress towards the adoption of the acquis. In this context, it is important not only to consider what chapters have been adopted in which countries. It is equally important to take into account the distinct national contexts in which these developments are taking place, as this enables a more accurate understanding of respective levels of progress and of variations between countries. For instance, some countries are likely to have found the process more or less demanding than others depending on their economic, political and social developmental backgrounds. Table 6-1: Chapters of the Acquis Chapter Comments
1 Free Movement of
Goods
Free movement of goods is one of the corner stones of the internal market. Much of this chapter of the acquis deals issues relating to the adoption of common regulatory framework to ensure products can move freely from one part of the Union to another. Taken as a whole, this chapter could have links to trade flows, patterns of economic development.
2 Free Movement of
Persons
This area of the acquis covers: mutual recognition of professional qualifications, citizen’s rights, free movement of workers and co-ordination of social security schemes. Legislation to ensure the free movement of workers could have particular consequences for patterns of migration, especially migration to major urban centres.
3 Freedom to Provide Services
The acquis in this sector lays down the minimum requirements for the different types of banking, insurance and investment services.
4 Free Movement of
Capital
Prohibits all but a few restrictions on the movement of capital between Member States.
5
Company Law The acquis in this chapter covers very different legislative fields: company law, accounting law, protection of intellectual and industrial property rights.
6
Competition Policy
The competition acquis is based on Article 31 (State monopolies of a commercial character), Articles 81-85 (Rules applicable to undertakings), Article 86 (public undertakings and undertakings with special or exclusive rights) and Articles 87-89 (Rules applicable to State aid) of the EC Treaty, as well as Articles 65 and 66 of the ECSC Treaty, due to expire in 2002. The control of mergers is done on the basis of the EC Merger Regulation 4064/89 (as amended).
7
Agriculture Agriculture is the largest of the negotiation chapters and covers a wide range of issues including: financial and market related aspects of agriculture and veterinary and phytosanitary aspect of agriculture. The first element of this chapter, through payments to

17
farmers and rural development measures, could have major impact on the structure and development of rural areas, the rural environment and linkages between urban and rural areas.
8
Fisheries Covers legislative alignment and administrative capacity of countries to manage the Common Fisheries Policy.
9
Transport Policy
The road, rail, aviation and maritime -related acquis covers a vast area of social, technical, fiscal, safety and environmental requirements. Upon accession the infrastructures of the new Member States will form part of an enlarged Trans European Network.
10
Taxation The EU acquis in this chapter mainly covers indirect taxation, in particular the Value Added Tax (VAT) and excise duties regimes, while on direct taxation the acquis is limited to legislation on corporate taxation.
11
EMU The participation in EMU presupposes the adoption of the Single Market acquis by the new Member States, in particular of the acquis on free movement of capital (chapter 4), as was the case for present member states.
12
Statistics The main issue is rather whether the countries are able to produce accurate and harmonised data in a permanent and sustainable way.
13
Social Covers labour law, equality of treatment between women and men, anti-discrimination, health and safety, social protection, social dialogue, employment, public health and institutions for the implementation and enforcement of the above.
14
Energy The energy acquis represents the body of all energy related EU law, regulations and policies. Implementing the acquis requires not only adequate legislation but also well functioning institutions (for example a regulatory body as required in the electricity and gas directives, a nuclear safety authority etc). Of particular relevance are requirements to address the social, regional and environmental consequences of the restructuring of mines; waste less energy and increase the use of renewable energies such as wind, hydro, solar and biomass in their energy balance and improve energy networks in order to create a real European market.
15 Industrial Policy
The acquis under this chapter consists of general industrial competitiveness policy guidelines.
16
SMEs Covers the area of enterprise policy, distributive trades, tourism, and social economy. The subject of this chapter is important in the context of economic development and the capacity to withstand competitive pressure, in particular overall Enterprise/SME policy formulation and implementation and general business environment.
17
Science and Research
The acquis consists of a large number of Council and Commission Decisions concerning two areas: Framework Programmes of European Community activities in the field of research, technological development and demonstration and of the European Atomic Energy Community for research and training activities; Science and Technology Co-operation agreements with third countries.
18
Education and Training
Education, training and youth is primarily the competence of the Member States. The Community's acquis consists of a Directive (education of the children of migrant workers) and various other issues (e.g. equality of opportunity, illiteracy, safety in schools, facilities for minorities, etc)
19 Telecommunications and IT
EU policy on telecommunications and the postal sector
20 Culture and Audiovisual
Policy
The focus of this chapter is alignment by the new Member States and Candidate Countries with the "Television Without Frontiers" Directive and participation in EU programmes such as Culture 2000.
21 Regional Policy and Co-
ordination
Upon accession new Member States will have to comply with certain regulations: appropriate legislative framework, territorial organisation, programming capacity, administrative capacity and financial and budgetary management.
22 Environment In broad terms EU environmental legislation covers environmental quality protection, polluting and other activities, production processes, procedures and procedural rights as well as products.
23 Consumer Health and Protection
Consumer health and protection legislation.
24 Justice and Home Affairs
Perhaps the most visible component of the EU’s Justice and Home Affairs policies is the Schengen acquis, which results in the lifting of internal border controls.
25 Customs Union
The acquis under this chapter consists mainly of a number of instruments ensuring the functioning of the Customs Union and the effective protection and control of its external borders.
26 External Relations
Covers the Community’s economic and trade relations with third counties.
27 CFSP Most of the acquis relates to intergovernmental co-operation.

18
28 Financial Control
Pertaining to the agreed principles of sound financial management and control.
29 Finance and Budgetary Provisions
Covers rules concerning the organisation, establishment and implementation of the EU budget.
30 Institutions Mainly covers the composition and functioning of institutions and bodies established under treaties or secondary legislation.
31 Other
The aim of this analysis is to provide an overview of the territorial impacts of the acquis and community policies. A detailed analysis of all the territorial impacts of the entire acquis and such complex community policies as CAP and the Structural Funds is not possible within the confines of this project. Partner ESPON projects, e.g. 1.1.3, 2.2.1 and 2.1.2, deal with these issues in much more depth. The broad impact of enlargement on the EU territory and nation states is also the subject of numerous studies, including ESPON 1.1.3, and will not be the primary focus of this analysis. Where this analysis can ‘add value’ is by providing a broad review and synthesis across policies, legislation, and geographic scales. With reference territorial development goals, the analysis summarises broad development trends and processes, details the complexity of implementing policies and legislation and highlights potential variations between countries and regions
6.2 Implications for territorial development of the acquis Adoption of the acquis by the new Member States and Candidate Countries is central to the enlargement process. Progress with adoption of the EU acquis is also of significant importance to the territorial development of each of the acceding countries and to the territorial cohesion of the enlarged EU.
On an EU level, numerous accounts demonstrate that integration between Member States and the EU-15 increased in the lead-up to enlargement, and capital cities and western-border regions have been amongst the main beneficiaries, in both the new Member States and the EU-15. EU enlargement, and the application of the acquis, can only strengthen these links. However, as previously noted, it is important to take into account the distinct national contexts in which these developments are taking place.

Table 6-2: Country Analyses: Summary Table
Regional Disparity Country Population (000), 2001
Average Annual real
Growth Rate, 1995-
2001
GDP per head (PPS
in % of EU-15 average
2001)
Unemployment rate (%)
2002 NUTS II Region with lowest unemployment rates (2002)
NUTS II Region with highest unemployment Rates (2002)
Bulgaria 7913 0 26.0 18.2 Yugozapaden (13.3) Severen Tsentralen (26.9)
Cyprus 706 3.8 77.8 3.3 - -
Czech Republic 10219 1.5 60.6 7.3 Praha (3.6) Moravskoslezsky (13.4)
Estonia 1367 5.2 38.5 10.3 - -
Hungary 10188 4.0 51.5 5.9 Kozep-Magyarorszag (5.9) Eszak-Magyarorszag (8.9)
Latvia 23555 5.7 33.4 12.1 - -
Lithuania 3481 5.1 37.2 13.7 - -
Malta 393 4.8 69.5 5.2 - -
Poland 38641 6.3 40.9 19.9 Malopolskie(16.2) Lubuskie (26.3)
Romania 22408 -0.1 24.4 8.4 Sud-Vest (6.7) Sud-Est (10.6)
Slovakia 5403 3.9 44.7 18.7 Bratislavsky kraj (8.7) Vychodne Slovensko (22.2)
Slovenia 1992 5.1 67.8 6.3 - -
Sources DG EcFin, DG Enlargement and CEC (2004) Third Report on Economic and Social Cohesion. European Commission: Brussels.

20
It is important to note that some chapters of the acquis have a more direct relevance for spatial/territorial development issues than others. Before looking in greater detail at the potential spatial/territorial implications of the adoption of the acquis, a number of qualifying remarks should be made.
• The number of chapters where there is an explicit link to spatial/territorial development themes is limited. These include, for example, Chapter 9 dealing with ‘Transport’ or Chapter 21 ‘Regional policy and co-ordination’.
• A large number of chapters are only tangentially, or partially, related to the themes under analysis. It is either the case that a certain aspect of the acquis under a particular chapter is related to spatial development themes or only certain spatial themes are relevant to a specific chapter.
• A number of chapters are unlikely to have direct impacts on territorial or spatial development - but may, in combination with other chapters, have an indirect influence.
• Some chapters are not relevant.
Taken as a whole, the adoption of many of the chapters of the acquis could have a potential impact on balanced spatial competition and spatial integration through the removal of bottlenecks and barriers to development. It should be noted, however, that much of the work involved in the adoption of the acquis involves highly technical changes to legislative and administrative structures, which make them of less direct relevance to spatial and territorial developments.
Table 6-3 highlights areas where potential linkages between acquis chapters and spatial/territorial development issues can be identified.
Table 6-3: Acquis Chapters and Territorial Development Themes
Chapter
Spatial cohesion
Balanced Spatial
Competition
Spatial integration
Wise management of natural and
cultural heritage
Notes: √ - indicates a potentially strong relationship; √ - indicates a tangential or weak relationship 1 Free Movement of
Goods √ √ √ - 2 Free Movement of
Persons √ √ √ - 3 Freedom to Provide
Services - √ √ - 4 Free Movement of
Capital √ √ √ - 5
Company Law - - - - 6
Competition Policy √ √ √ -
7
Agriculture √ √ √ √ 8
Fisheries - √ - √ 9
Transport Policy √ √ √ - 10
Taxation - - - - 11
EMU - - - -
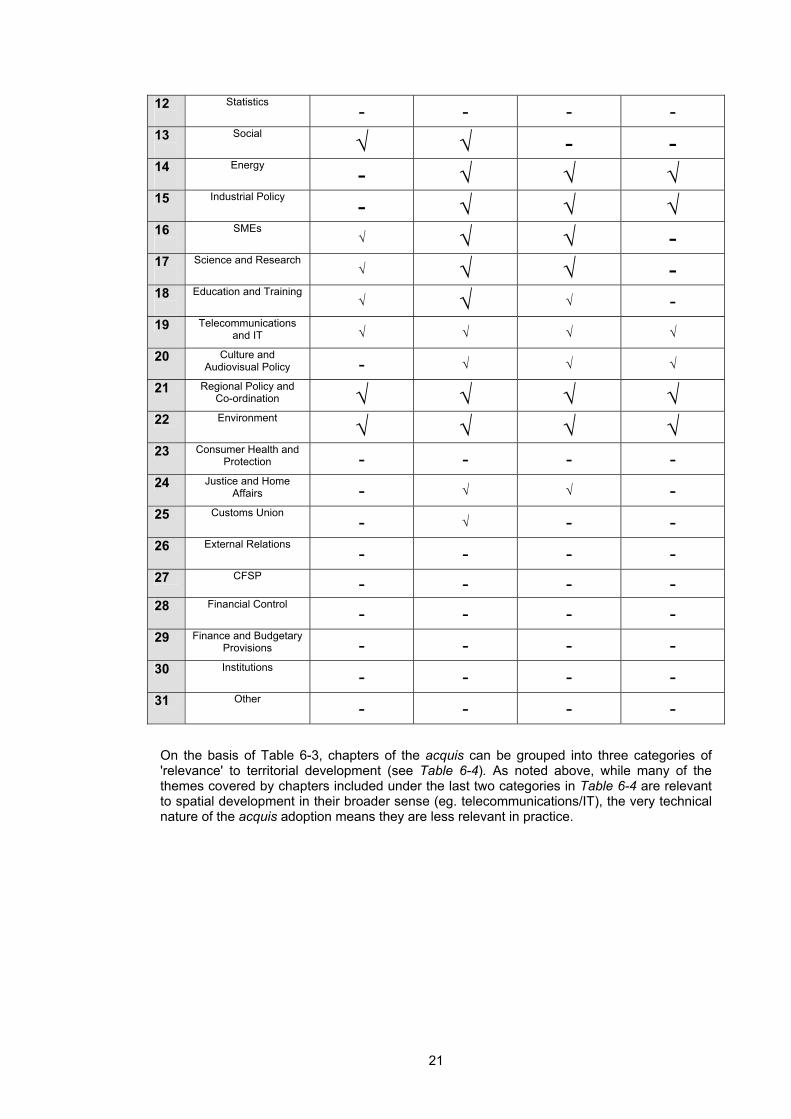
21
12
Statistics - - - - 13
Social √ √ - - 14
Energy - √ √ √ 15 Industrial Policy - √ √ √ 16
SMEs √ √ √ -
17
Science and Research √ √ √ -
18
Education and Training √ √ √ -
19 Telecommunications and IT √ √ √ √
20 Culture and Audiovisual Policy - √ √ √
21 Regional Policy and Co-ordination √ √ √ √
22 Environment √ √ √ √ 23 Consumer Health and
Protection - - - - 24 Justice and Home
Affairs - √ √ - 25 Customs Union - √ - - 26 External Relations - - - - 27 CFSP - - - - 28 Financial Control - - - - 29 Finance and Budgetary
Provisions - - - - 30 Institutions - - - - 31 Other - - - -
On the basis of Table 6-3, chapters of the acquis can be grouped into three categories of 'relevance' to territorial development (see Table 6-4). As noted above, while many of the themes covered by chapters included under the last two categories in Table 6-4 are relevant to spatial development in their broader sense (eg. telecommunications/IT), the very technical nature of the acquis adoption means they are less relevant in practice.

22
Table 6-4: Relation of the Acquis to Territorial Development
Relation to territorial themes
Chapter
Chapter 1 Free Movement of Goods Chapter 2 Free Movement of Persons Chapter 7 Agriculture Chapter 9 Transport Policy Chapter 6 Competition Policy Chapter 14 Energy Chapter 15 Industrial Policy Chapter 16 SMEs Chapter 21 Regional Policy and Co-ordination C
hapt
er w
here
som
e el
emen
ts o
f the
acq
uis
stro
ngly
rela
te to
asp
ects
of
terri
toria
l dev
elop
men
t th
emes
Chapter 22 Environment Chapter 3 Freedom to Provide Services Chapter 4 Free Movement of Capital Chapter 8 Fisheries Chapter 17 Science and Research Chapter 13 Social Chapter 18 Education and Training Chapter 19 Telecommunications and IT Chapter 20 Culture and Audi-Visual Chapter 24 Justice and Home Affairs C
hapt
ers
whe
re s
ome
elem
ents
of t
he a
cqui
s re
late
d to
a g
reat
er o
r le
sser
ext
ent
to a
spec
ts o
f te
rrito
rial d
evel
opm
ent
Chapter 25 Customs Union Chapter 5 Company Law Chapter 10 Taxation Chapter 11 EMU Chapter 12 Statistics Chapter 23 Consumer Health and Protection Chapter 26 External Relations Chapter 27 CFSP Chapter 28 Financial Control Chapter 29 Finance and Budgetary Provisions Chapter 30 Institutions Chapter 31 Other C
hapt
ers
unlik
ely
to h
ave
little
di
rect
impa
ct o
n th
eir o
wn
The following sections expand on the points raised in Table 6-4 and present a review of the anticipated impacts of the acquis and associated community policies in the key areas of agriculture, environment, transport, regional policy, competition policy, R&D policy and the internal market.
6.3 Agriculture and CAP
Context
In terms of agriculture, enlargement is expected to double the agricultural labour force as well as the arable area of the EU, and to add over 100 million food consumers to the internal market. The EU already provides a Special Accession Programme for Agriculture and Rural Development (SAPARD) in the new Member States and Candidate Countries, which has an annual budget of € 520 million for the period 2000-06. CAP is widely regarded as one of the most important EU policy areas. First, a large share of the EU budget is devoted to CAP (almost 50 percent). Second, a vast number of people and territory are directly affected by CAP expenditure. Third, the extent of sovereignty transferred from the national to the European level is considerable, in comparison to other policy areas.
23
Territorial impact/benefits
CAP, and the associated acquis on agriculture, also had important impacts for the territorial development of the New Member States and Candidate Countries and is likely to impact upon spatial cohesion, spatial competition and spatial integration as Table 6-5 illustrates. See also ESPON 2.1.3. Table 6-5: Agriculture and Territorial Goals Agriculture and CAP
Spatial Cohesion (equity)
Rural development funding to promote development of lagging regions.
CAP aims to assure the availability of supplies, promoting equity across the EU.
CAP aims to ensure that supplies reach consumers at reasonable prices, which could promote equity objectives through supporting regions where physical conditions could limit supply and increase cost.
Equity goals are addressed by the aim to provide a guaranteed standard of living for the agricultural community, in particular by increasing the individual earnings of persons engaged in agriculture.
Moves to promote the multi functionality of agriculture, i.e. its varied role over and above the production of foodstuffs, could promote more balanced development in lagging rural regions.
Spatial Competition (efficiency)
Efficiency objectives could be addressed by the aim to increase agricultural productivity by promoting technical progress and by ensuring the rational development of agricultural production and the optimum utilisation of the factors of production, in particular labour.
Multi sectoral and integrated approach to the rural economy in order to diversify activities, create new sources of income and employment and protect the rural heritage.
Flexible aids for rural development, based on subsidiarity and promoting decentralisation, consultation at regional, local and partnership level.
Spatial Integration
Promotion of rural linkages and connectivity.
Market unity: A single market with a common system of marketing and pricing and free competitiveness of agricultural commodities in domestic and world markets.
Flexible aids for rural development, based on subsidiarity and promoting decentralisation, consultation at regional, local and partnership level.
Potential issues/challenges
The impact of CAP and the agriculture acquis will vary according to the size, structure and economic importance of agriculture in each of the new Member States and Candidate Countries (see Figure 6-1). For instance, Poland has high levels of employment in agriculture, while the Czech economy is less reliant on income from the agriculture scetor. Considerable differences exist among the new Member States and Candidate Countries. The contribution to GDP varies between 15.8 percent in Bulgaria and 2.9 percent in Slovenia. The equivalent range for the EU-15 Member States is between 6.6 percent in Greece and 0.6 percent in Luxembourg. High average employment in agriculture in the Central East European Countries is mainly explained by Romania, Poland, and Lithuania, where 42 percent, 18.8 percent and 19.6 percent, respectively, of the active work force is in the agricultural sector.13 In the other countries the share of employment in agriculture is comparable to the figures in the old Member States. Obviously, within each country there are also likely to be strong disparities between regions in how they will be affected by CAP, with some more likely to benefit than others depending on regional economic structures, e.g. rural vs urban amount of land under cultivation etc.
13 EPRC, (2003) EU ENLARGEMENT, STRUCTURAL FUNDS AND THE IMPLICATIONS FOR GREECE, Report to the Ministry of National Economy, Greece, European Policies Research Centre, Glasgow

24
Figure 6-1: Employment Structures in the New Member States
Source: Weise C, Bachtler J, Downes R, McMaster I and Toepel K (2000) The Impact of Enlargement on Cohesion,, Contribution to the Second Report on Economic and Social Cohesion, Study Area 11, DG Regio of the European Commission, Brussels. http://www.europa.eu.int/comm/regional_policy/sources/docgener/studies/study_en.htm
Based on the priority given to agriculture, the demands of the acquis and the high level of resources attached to CAP, it can be assumed that the combined impact of the new Member States will be substantial. More specifically, positive associations can be made to the promotion of territorial goals, as previously set out in Table 6-5.
The unfavourable farm structure in the Central and Eastern Europe, in particular the large number of small farms and the existence of durable semi-subsistence farming, combined with the presence of an emerging commercial farming sector pose a range of administrative and economic dilemmas for the Common Agricultural Policy.14 While the commercial sector needs to invest and restructure, subsistence farming continues to play a major role as a social safety net in rural areas and part of the subsistence sector may still develop and integrate itself in a market economy. If direct aids are introduced too quickly in the new Member States, there is
14 CEC (2002) Enlargement and Agriculture: Successfully integrating the new Member States into the CAP – Issues
Paper http://europa.eu.int/comm/enlargement/docs/financialpackage/sec2002-95_en.pdf, p.3 and Ardy, B. (2000) EU Enlargement and Agriculture: Problems and Prospects South Bank European Papera no. 4/2000 South Bank University, European Institute

25
a risk that necessary restructuring would be slowed or even stopped. It is also unclear how CAP would deal with unclear ownership structures that exist in some countries.
CAP and the acquis may fail to address the specific needs of the new Member States. Criticisms of CAP have several aspects. The need for countries to invest heavily to meet EU standards and higher EU guaranteed prices for some farm products could push up prices in the Central East European (CEE) new Member States. CEE producers will also face increased competition from efficient EU producers, an increased global competition and could lose competitiveness as a result of EU membership.15 It is argued that the CEE countries need an agricultural policy which will enable them to exploit their advantages of low labour and land costs to expand production where it is competitive, keep food prices relatively low, whilst facilitating the inevitable contraction of employment in agriculture.16 In CEE, not only farm structures but ‘up and down stream infrastructure’, services, and off-farm employment opportunities will require development.17 Another key risk during the early years after accession is that the restructuring process and Community Instruments will be associated with growing rural unemployment and poverty.
It is also worth noting that not all elements of CAP will be applied in full in the new Member States after enlargement. The 10 new Member States will gradually phase in EU agricultural direct payments between 2004 and 2013. Direct payments will start at 25 percent in 2004, 30 percent in 2005 and 35 percent in 2006 of the present system and increase by 10 percentage steps to reach 100 percent of the then applicable EU level in 2013. Rather than applying the standard direct payment scheme applicable in the current EU, the new Member States have the option, during a limited period, of granting their farmers CAP direct payments in the form of decoupled area payment (a simplified payment scheme). The new Member States will have special additional financial aid for rural development for a limited period. Also, certain rural development measures have been adapted or created in order to reflect better the requirements of the new member states in the first years of accession.
6.4 Environment
Context
Levels of pollution in the new Member States and Candidate Countries are significantly higher than those in the current EU, where strict European environmental laws have been applied for many years. In preparation for EU membership, the new Member States and Candidate Countries have had to bring their environmental laws and standards into line with those in the EU. EU environmental legislation covers a vast range of issues: sustainable development, waste management, noise pollution, air pollution, climate change, water protection and management, protection of nature and biodiversity, soil protection, chemical products and civil protection.18 In preparation for compliance with this array of legislation, particular assistance has been given to the Environmental Ministries of the acceding countries to raise the profile of environmental policy in their respective countries.
ISPA has been the main Community financial pre-accession instrument for supporting big environmental infrastructure projects helping the CEE countries meet the acquis’ requirements. Half of the total ISPA budget of €1 billion per year for the 10 countries has been earmarked for environment projects, which have mostly involved large infrastructure in the water and waste sectors.19 According to DG Environment, although there was no ear-marking of funds for the environment, a significant number of Phare national and Cross-Border-Cooperation projects were either specifically related to the environmental acquis or included components related to environmental integration (such as in context of development
15 http://www.bcemag.com/y2000/jul_aug00/survey/0007survey.htm 16 Mayhew, A. (2000) Financial and Budgetary Implications of the Accession of Central and East European Countries to the European Union SEI Working Paper No. 33, Sussex European Institute, University of Sussex, March. 17CEC (2002) Enlargement and Agriculture: Successfully integrating the new Member States into the CAP – Issues
Paper http://europa.eu.int/comm/enlargement/docs/financialpackage/sec2002-95_en.pdf, p.3 18 http://europa.eu.int/comm/environment/index_en.htm 19http://europa.eu.int/rapid/pressReleasesAction.do?reference=MEMO/04/86&format=HTML&aged=0&language=EN
&guiLanguage=en

26
projects).20 The SAPARD programme and a range of other Community Programmes, (e.g. LIFE-Environment and the IMPL Network), also provide the new Member States with an opportunity to promote environmental development.
Territorial impact/benefits
The general ways in which EU environmental legislation and policies could impact on territorial development are highlighted in Table 6-6. Table 6-6: Environment and Territorial Goals Environment Spatial Cohesion
(equity) Support for environmentally disadvantaged regions, e.g. regions with high levels of pollution or environmentally protected regions.
Spatial Competition (efficiency)
Addresses pollution as a bottleneck to development.
Improved quality of life/environment.
Improved environmental infrastructure.
Spatial Integration
EU neighbourhood policy - working with neighbouring states.21
Cross-border co-operation in the establishment of protected regions, environmental management, flood management.
As a result of this assistance and the efforts of the countries in question, the adoption of the acquis and EU environmental policies has already made a substantial impact on developments in the acceding countries. From a territorial development perspective, some interesting examples include:
• The former ‘Black Triangle’ area situated on the borders of Poland, the Czech Republic and the former East Germany was formerly one of Europe’s most polluted industrial regions. The region now has improved water quality in rivers, reduced levels of acid rain and improved air quality levels. Poland and Czech Republic now jointly manage a nature reserve in the region, and the air quality monitoring systems designed for the project are in permanent use.
• Czech Republic, Hungary, Malta and Poland increased the percentage of residential population connected to waste water treatment between 1996 and 2001. In the programme “City towards Compliance Awards”, there a number of cities which have implemented all the EU legislation concerning water treatment and achieved encouraging results in the management of air quality and waste management; Gyongyos in Hungary, Valmiera in Latvia, Rimavska Sobota in Slovakia, and Domzale et Maribor in Slovenia.
• A trans-national cooperation programme has been established between Poland and Slovakia, in the region of Mount Babia Gora, in the framework of a nature conservation programme to protect the exceptionally rich flora and fauna of the area (more than 100 species of birds, hundreds of bears, wolves and lynxes).22
Potential issues/challenges
Given the demands of EU environmental legislation and the amount of ground that the new Member States have had to make up, it is not surprising that some transitional period have had to be granted to allow that sufficient time for compliance, mainly in the water, waste and
20http://europa.eu.int/rapid/pressReleasesAction.do?reference=MEMO/04/86&format=HTML&aged=0&language=EN
&guiLanguage=en 21 EUROSTAT (2003) A selection of Environmental Pressure Indicators for the EU and Acceding countries 2003 EDITION Luxembourg: Office for Official Publications of the European Communities 2003 22http://europa.eu.int/rapid/pressReleasesAction.do?reference=MEMO/04/86&format=HTML&aged=0&language=EN
&guiLanguage=en

27
industrial pollution sectors. Requests for transitional measures needed to be justified by detailed implementation plans ensuring that compliance with the acquis will be reached over time.23
In the longer term, European Commission data shows that EU environmental policy in the new Member States will bring significant benefits not only for the countries themselves, but also for the EU and for other neighbouring regions.24 Benefits include:
• Better public health: as people are less exposed to air pollution
• Less damage to forests, fields and fisheries, and to buildings.
• Cleaner water
• Safer and sounder waste management: public health will improve because of lower emissions and leakage from landfills.
• Protected natural areas will increase, and the protection will cover a wide range of species.25 The acceding countries have a large variety of eco-systems and well preserved natural resources, extensive unspoiled regions.
After accession, assistance in the environment field will almost treble and the territorial impacts of environmental actions are likely to be amplified. Until the end of the current budgetary period in 2006, the new Member States will receive €8 billion.26 Structural Funds programmes will be a key source of funding and targeting will correspond to strategies set out in NDPs and associated programming documents.
6.5 Transport and TENs
Context
The acquis in Chapter 9, "Transport policy", is based on Articles 70-80 of the EC Treaty. The transport acquis consists mainly of secondary legislation, i.e. several hundred Regulations, Directives and Decisions, 27 covering railway, roads aviation and maritime transport.
The EU’s programme of Trans-European Networks aims to promote the interconnection and interoperability of national networks as well as the access to them. In doing so, they are perceived to promote the implementation and development of the internal market, as well as re-enforcing economic and social cohesion. The new Member States and Candidate Countries generally have less well-developed infrastructure networks than in the EU-15 and poor infrastructure is commonly identified as a key bottleneck to development. Hence, the construction of the trans-European transport network is a major element in economic competitiveness and a balanced and sustainable development at the EU, national and regional level.28
Territorial Impacts/benefits The acquis on Transport and investment in TENs has important impacts on spatial cohesion, balanced spatial competition and, in particular spatial integration, see Table 6-7, see also ESPON 1.2.1 and 2.1.1.
23http://europa.eu.int/rapid/pressReleasesAction.do?reference=MEMO/04/86&format=HTML&aged=0&language=EN
&guiLanguage=en 24 http://www.eplp.org.uk/implicationsenv.pdf 25 http://www.eplp.org.uk/implicationsenv.pdf 26http://europa.eu.int/rapid/pressReleasesAction.do?reference=MEMO/04/86&format=HTML&aged=0&language=EN
&guiLanguage=en 27 CEC (2003) Report on the results of the negotiations on the accession of Cyprus, Malta, Hungary, Poland, the Slovak Republic, Latvia, Estonia, Lithuania, the Czech Republic and Slovenia, CEC Brussels, January to the European Union 28 http://europa.eu.int/comm/ten/transport/index_en.htm

28
Table 6-7: Transport, TENs and Territorial Development TENs & Transport
Spatial Cohesion Improved transport links and infrastructure to promote economic development in lagging regions.
Improved regional competitiveness for lagging regions.
Spatial Competition
Improved competitiveness achieved through improved communications links.
Transport infrastructure promoting the development of growth poles at regional, national and EU level.
Spatial Integration Improved linkages between regions and Member States.
Co-operation on cross border transport projects.
Higher connectivity between the Member States.
Potential issues/challenges
As partner ESPON projects have demonstrated, the impact of EU transport policies on the new Member States and Candidate Countries will also vary across countries, regions and address different territorial development goals. For example, as ESPON 1.2.1 demonstrates the types of investments made, e.g. in road or rail infrastructure, could lead to variable contributions to aspects of spatial development. Some infrastructure investments have a greater impact on spatial competition than spatial cohesion. Transport networks focusing on cities, particularly capital city regions, could promote development in already advantaged regions, at the expense of lagging regions. ESPON 1.2.1’s analysis of the impact of rail investments during the last decade reveals there is limited impact on equity. A scenario of combined road and rail investments revealed a greater impact on cohesion.
Various aspects of policy could also impact differently on spatial development goals. For instance, pricing policies, (e.g. increasing private transportation costs), were found to work against the general objectives of cohesion and polycentricity. Differing types of regions are also more or less likely to benefit from EU transport policy. In the short term, transport investments could have the greatest impact upon central regions and cities, but with important ‘spill-over’ benefits for neighbouring regions. Border regions with the EU-15 are also likely to benefit particularly from improved transport and service links with neighbouring regions. However, in many cases, infrastructure deficits are such that only prolonged investment will fully address the countries development needs and meet the goal of balanced competition and polycentric development.
6.6 Regional Policy and Structural Funds
Context
The influence of the acquis and Structural Funds, particularly the availability of vital resources to tackle regional problems, has been a key driver for reform of regional policy across the acceding countries. In the past, regional development initiatives were piecemeal in many of the acceding countries, e.g. focusing, for example, on unemployment ‘black-spots’ or border regions. EU programmes have provided support to develop and strengthen more ‘appropriate’ institutions and programmes for the development and delivery of regional policy. Related results are: more integrated regional support programmes; reform of regional development institutions; establishment of NUTS II and NUTS III regions; and, a greater policy emphasis on regional development.29 In the late 1990s, the prospect of EU accession and future Structural Funds increased the pressure to meet Commission requirements for administering
29 Ferry M and McMaster I (2003) Implication of EU Regional Assistance Programmes in Moravia-Silesia and Upper Silesia, in S. Smith and M. Myant (eds) EU Accession, Regional Policy, Social and Economic Development in East Central Europe European Studies Occasional Paper(New Series) Number 2003/03 PBS Working Paper Series Number 2003/03 http://www.paisley.ac.uk/business/cces/downloads/smithmyant.pdf

29
regional aid was pressing. On accession, the new Member States were expected to comply with requirements, listed in Chapter 21 of the acquis relating to regional policy and co-ordination of structural instruments. Key among these are:
• Programming capacity: the creation of a structured programming framework, including National and Regional Development Plans, to select the projects that contribute most to achieving regional development objectives.
• Administrative capacity: the new Member States have to clearly define the tasks and responsibilities of all the bodies and institutions involved in the preparation and implementation of Structural Funds and the Cohesion Fund to ensure effective Ministerial co-ordination.
• Partnership/decentralisation: regional development programmes should be prepared and funds administered in close co-operation between Member States and the European Commission, as well as with national, regional and socio-economic partners within the Member States.30
Territorial impact/benefits
The EU’s Structural Funds and the associated acquis are not necessarily designed to take territorial cohesion into account. However, a number of reports have examined the relationships and linkages between the Funds and territorial development, including two reports on the Spatial and Urban Dimensions of the 2000-06 Objective 1 and 2 Programmes and ESPON project 2.2.1.31 These reports conclude that, while Structural Fund programmes have not set out to incorporate territorial development goals, there is “an important implicit response of the programmes to the guidelines and aims of, for example, the ESDP”.32 The ESPON project 2.2.1, Work Package 2, puts forward a similar interpretation:
1. It is possible to identify explicit and implicit (mostly) coherence between the objectives of programming documents and the objectives of territorial cohesion.
2. Structural Fund programmes can be considered as contributing to territorial cohesion also through their method of implementation and governance.
3. The Structural Funds contribute to the achievement of the goals of territorial cohesion (and potentially of polycentrism) in two ways:
• direct support occurs when the goals of territorial cohesion are directly targeted by Structural Fund policies, either explicitly or implicitly.
• indirect support occurs when the Structural Funds are used as a lever for national policies aiming towards the objectives of territorial cohesion, to promote trans-national links, and to support new thinking and new approaches to economic development.33
More specific examples of how the acquis and Structural Funds could impact on territorial objects are set out in Table 6-8.
30 From European Commission web-site on Chapter 21 – Regional policy and co-ordination of structural instruments
http://europa.eu.int/comm/enlargement/negotiations/chapters/chap21/ 31 Rooney ML and Polverari L with McMaster I, Michie R, Raines P and Taylor S (2001) The Spatial and Urban
Dimensions in the 2000-06 Objective 2 Programmes, Report to DG XVI of the European Commission, Brussels. Polverari L and Rooney ML with Bachtler J, McMaster I, Raines P, Böhme K and Mariussen A (2001) The Spatial and Urban Dimensions in the 2000-06 Objective 1 Programmes, Report to DG XVI of the European Commission, Brussels. Polverari and L and Bachtler J (Forthcoming), La dimensión territorial de la cohesión económica y social: política regional y planificación territorial en Europa, Book Chapter in Joan Romero González and Farinós Dasí Joaquín (Eds.) "El Gobierno de los territorios".
32 Polverari L and Rooney ML with Bachtler J, McMaster I, Raines P, Böhme K and Mariussen A (2001) The Spatial and Urban Dimensions in the 2000-06 Objective 1 Programmes, Report to DG XVI of the European Commission, Brussels. p. 1
33 Polverari and L and Bachtler J (Forthcoming), La dimensión territorial de la cohesión económica y social: política regional y planificación territorial en Europa, Book Chapter in Joan Romero González and Farinós Dasí Joaquín (Eds.) "El Gobierno de los territorios" and ESPON . 2.2.1.

30
Table 6-8: Regional Policy, Structural Funds and Territorial Development Regional Policy + Structural Funds
Spatial Cohesion Support for lagging regions and Cohesion Countries.
Emphasis on endogenous development based on regional resources.
Spatial Competition
Emphasis on regional competitiveness, innovation R&D.
Programming documents aiming to promote balanced, integrated development measures across the whole country.
Spatial Integration Heightened profile of the EU.
Promotion of international exchange and cross-border co-operation.
Potential issues/challenges
It is worth noting that there is scope for substantial variation across countries. First, the acquis is relatively imprecise in the area of regional policy. It does not define how the specific structures for the practical management of Structural and the Cohesion Funds should be set up and acknowledges that the administrative structures to be put in place also differ from small candidate countries without regionalisation to big candidate countries with a strong regionalisation.34 Differences also stem from the fact that the Structural Funds’ ‘regionalising’ objectives and New Member State regional policy agendas and philosophies are not always compatible. Reconciling the priorities and objectives of this new, Structural Funds- influenced regional policy with the existing socio-economic context is a challenge. The tension between the traditional approach to regional policy, based on central interventions in targeted regions, and the more modern focus on utilising all regions’ endogenous potential, has an impact on the political debate in these countries on the division of regional policy responsibilities between administrative tiers, producing different outcomes.
In the context of accession to the EU, the most important problem for many of the new Member States is not differentiation but the comparatively low economic potential of all regions: the EU’s richest regions are much richer than these countries’ and the poorest regions in Poland and the Czech Republic are much poorer than the EU’s. It is clear that after accession some peripheral regions may require greater external support and input than others and this argues for a strong central government role. While the principle of encouraging regions throughout the country to develop their individual potential and capacities is logical, given comparatively low levels of regional development generally, it seems likely that resource constraints and the particularly underdeveloped state of peripheral regions are going to ensure that considerable selectivity will have to apply in practice. Work packages 4 and 6 of this study will go on to examine these issues in greater depth.
6.7 Competition Policy
Context
Competition policy is covered by Chapter 6 of the acquis and it includes the relevant articles of the EC Treaty (as well as subsidiary legislation), namely: Article 31 (State monopolies of a commercial character), Articles 81-85 (Rules applicable to undertakings); Article 86 (Public undertakings and undertakings with special or exclusive rights) and Articles 87-89 (Rules applicable to State aid). Furthermore, mergers are monitored on the basis of the EC Merger Regulation 4064/89. In the field of State aid, part of the competition acquis is addressed under other chapters of the negotiations, e.g. transport, coal, agriculture and fisheries. Competition policy covers a wide range of areas of action:
34 http://europa.eu.int/comm/enlargement/negotiations/chapters/chap21/index.htm

31
• Antitrust & cartels: The elimination of agreements that restrict competition (e.g. price-fixing agreements, or cartels, between competitors) and of abuses by firms who hold a dominant position on the market (e.g. for example the case for predatory pricing aiming at eliminating competitors from the market).
• Merger control: The control of mergers between firms.
• Liberalisation: Introducing competition in monopolistic economic sectors (e.g. telecommunications). Article 3 of the EU Treaty which states that the "activities of the Community shall include (...) g) a system ensuring that competition in the internal market is not distorted".
• State Aid control: The control of state aid measures by Member State governments to ensure that such measures do not distort competition in the Common Market (e.g. the prohibition of a state grant designed to keep a loss-making firm in business even though it has no prospect of recovery).
Competition policy has already had major impacts on economic practices in the acceding countries. Key areas of industrial policy, such as subsidies to important economic sectors, such as coal and steel, and the privatisation of state owned enterprises have been shaped by competition policy. Given the spatial concentration of these industrial sectors, substantial reductions in state subsidies or restructuring as a result of privatisation could have a significant impact on the local area. However, this is an indirect impact on territorial development.
Territorial impact/benefits
From a territorial development perspective, the most explicit impact of Competition Policy comes via State Aid, see Table 6-9. The EC Treaty allows exceptions to the ban on state aid where the proposed aid schemes may have a beneficial impact in overall Union terms.35 For instance, Article 87 of the EC Treaty allows aid designed to promote the economic development of underdeveloped areas (regarded as particularly backward in accordance with Community criteria). In relation to regional aid, the new Member States adopted regional aid maps, in line with EU regulations, and implemented necessary reforms to their national regional policies. However, there are a number of potential areas of ‘conflict’ between national regional policy and EU policy approaches. A number of the schemes currently on offer may have to be phased out, or be heavily modified, as they fail to comply with current State aid regulations. The European Commission has already judged a number of tax incentives schemes and ‘special economic zones’ in Poland to be ‘harmful’ to the EU internal market.36 The issues surrounding regional aid programmes are considered in more detail in chapter 7.
35 http://europa.eu.int/comm/competition/state_aid/overview/ 36 Financial Times, (2003) New Members’ Tax Rules ‘Harmful’ to EU, Financial Times 21 July.

32
Table 6-9: Competition Policy and Territorial Development Impact
Spatial Cohesion Support to lagging regions through State Aid programmes and instruments, e.g. grant aid.
Spatial Competition Policy aims to promote ‘fair’ competition.
Spatial Integration Aid schemes, indirectly, support the goals of spatial integration.
Free movement of persons.
Potential challenges/issues
Looking to the future, the impact of enlargement on resources means that greater priority needs to be given to those measures that have the greatest impact on EU competition and trade.37 In the post-2004 period, a substantial proportion of the new Member States’ territories will be eligible for some form of regional aid. However, across an enlarged EU, regional aid available in many of the EU-15 countries can be expected to decrease following State Aid reform. In advance of any reform, the Commission has launched a review of its rules on regional aid for the period after December 2006.
Figure 6-2: State Aid Map – Czech Republic
Source: MMR, 2003
37 Wishlade, F. (2003) REGIONAL AID CONTROL AFTER 2006: THE FORCES OF CHANGE, paper presented to the EoRPA Consortium Annual Meeting University of Strathclyde: Ross Priory, October 2003.

33
6.8 R&D Policy
Context
The EU supports R&D and Innovation through the Framework Programmes and Structural Funds. These policies are of crucial importance to the EU’s development agenda of competitiveness, e.g. see the Lisbon Agenda. Science and research also forms a vital part of the acquis. A key priority for EU R&D policy is to promote networking and cooperation in the fields of science and technology through the European Research Area (see Figure 6-3). This is based on the recognition that centres of excellence are scattered across the continent and not necessarily linked.38
Figure 6-3: European Research Area: Key policies and Instruments
Source: http://europa.eu.int/comm/research/era/index_en.html
Territorial impact/benefits
The new Member States are diverse in terms of their research potential and the profile of R&D and innovation policy varies between the countries. However it is possible to highlight a number of common trends. For instance, R&D and innovation policy systems of the countries of Central and Eastern Europe (CEE) have so far been treated as marginal within the overall institutional transformations that are taking place in these nations. Further, in some countries, the transition of the innovation system is importantly linked with the privatisation of the former state-owned firms and their intra-mural R&D activities. Consequently, the acceding countries have a relatively low R&D investment in comparison to the EU average. Also the share of high-tech exports in total exports is generally very low in the Central East European Countries– far behind the EU average of 19.7percent - reflecting their specialisation in other non-high tech sectors.39
A common feature for is their strong potential to produce and absorb scientific and technological knowledge which is reflected in high levels of human resources in Science and Technology. The case of Malta is notable in this respect. The share of high-tech in total exports is 64.4 percent, well above the EU average. Hungary and Estonia also achieve values just above the EU average, probably as a result of considerable foreign direct
38 http://europa.eu.int/comm/research/era/index_en.html 39 CEC (2002) Towards a European Research Area Key Figures 2002: Science, Technology and Innovation, CEC: DG Research ftp://ftp.cordis.lu/pub/indicators/docs/ind_kf2002.pdf

34
investment.40 This suggests that some countries will be in a better position to integrate into EU R&D programmes. Table 6-12 highlights some potential territorial impacts of R&D policy and relevant elements of the acquis, though ESPONN project 2.1.2.focuses on the territorial impact of EU research and development policy in much greater detail. Table 6-10: R&D Policy and Territorial Development
Impact of EU R&D policy
Spatial Cohesion Selective supports for R&D and innovation provided through Structural Funds to lagging regions.
R&D and Innovation offering new opportunities for exploiting regional development potentials, or overcoming bottlenecks.
Spatial Competition
Development of high tech development zones in growth poles, cluster development, promotion of higher education-business links. R&D and Innovation have the potential to be less ‘place’ specific, i.e. they are less constrained by the availability of raw materials and transport costs.
Spatial Integration Co-operation between Member States, new Member States and the Candidate Countries, Competitiveness at an EU –level, through pursuing the Lisbon agenda.
Potential issues/challenges
In the future, one of the big challenges facing the acceding countries is a gradual switch from a ‘low-road’ to a ‘high-road’ strategy of competitiveness, which implies a greater emphasis on R&D and Innovation policy. Existing assessments of the impact of R&D policy41 suggest that in the EU-15, Framework Programmes and the Structural Funds have supported the development of R&D and innovation. However, levels of support from these sources have varied across regions. Looking to the future, it is likely that city regions, with greater concentrations of skilled workers, universities, high tech industry and FDI, will be in a better position to attract R&D and Innovation funding and activities. In many of the CEE heavy industrial regions, which also have high concentrations of skilled labour, universities and infrastructure provision, selective support to promote R&D and Innovation could be used to simulate growth. It is also worth noting that EU’s Framework Programmes constitute only around five percent of the overall public spending on R&D in Europe. The other 95 percent consists of national investments and programmes as well as the activities undertaken by other European organisations for research cooperation. Therefore, there is a need for more coordination, the aim being to make a reality out of what has been called the European Research Area and, thus improve spatial integration.42
6.9 Internal Market
Context
Various elements of the acquis support the internal market. The four cornerstones of the internal market, known as the ‘four freedoms’ make up the first four chapters of the acquis:
• Chapter 1: Free Movement of Goods: deals with issues relating to the adoption of the common regulatory framework to ensure products can move freely from one part of the Union to another.
• Chapter 2: Free Movement of Persons: mutual recognition of professional qualifications, citizen’s rights, free movement of workers and co-ordination of social security schemes.
40 CEC (2002) Towards a European Research Area Key Figures 2002: Science, Technology and Innovation : DG Research ftp://ftp.cordis.lu/pub/indicators/docs/ind_kf2002.pdf 41 http://www.ecotec.com/expertise/eurd/ 42 http://www.eu2002.dk/news/news_read.asp?iInformationID=25310

35
• Chapter 3: Freedom to Provide Services: the acquis in this sector lays down the minimum requirements for the different types of banking, insurance and investment services.
• Chapter 4 Free Movement of Capital: prohibits all but a few restrictions on the movement of capital between Member States.
Territorial impacts/benefits
Individually these elements of the acquis can be linked to specific territorial impacts, (see Table 6-11). For instance, legislation to ensure the free movement of workers could have particular consequences for patterns of migration, especially migration to major urban centres, see also ESPON project 1.1.4. Their combined impact on territorial development is even more substantial, particularly in the spheres of trade, FDI and migration. Table 6-11: Internal Market and Territorial Development
Internal market
Spatial Cohesion New development opportunities and markets for regional economies.
Spatial Competition Free market. CEE regions can compete with EU-15 for investment and business.
Spatial Integration Freer movement of persons, (though still constrained).
Potential issues/challenges
In advance of enlargement, market barriers between the EU-15 and the new Member States were already substantially reduced. As a result, the immediate trade effects of enlargement are not likely to be significant. However, there are predictions that accession will generate gains for EU 15 countries and that these gains are likely to be unevenly distributed.
Gains from EU enlargement are likely to benefit particular sectors over others. Within CEECs, sectors with a high R&D intensity which substituted for imports from the world market have already been negatively affected by the removal of trade barriers. EU exports in investment goods are expected to remain high as CEE industry undergo restructuring processes and businesses consequently ‘re-tool’.43 EU business and financial services are also expected to retain a clear competitive advantage.44 Over the medium- to longer-term, the adoption of the acquis, including standardisation, certification and product liability rules, will reduce transaction costs for trade in goods and services. It is also possible that the commodity composition of CEECs may shift. In the short-term, however, accession is expected to increase production costs in the CEECs at the same time as firms are facing increased competition from a fully integrated market. However, CEE regions are also in a position to become the lowest cost producers inside the EU in textiles steel and bulk chemicals.45
Foreign capital flows into CEECs largely take the form of foreign direct investments. Cumulative net inflows of FDI into the CEE region amounted to $50 billion between 1991 and 1997.46 In terms of FDI, a similar re-alignment towards the EU has taken place as it was the case for trade flows. Experience from past enlargements demonstrates that accession to the EU can considerably increase capital inflows, at least for a transitional period. It has been
43 Mayhew, A. (1998), Recreating Europe – The European Union’s Policy Towards Central and Eastern Europe, Cambridge University Press, Cambridge. 44 RWI/EPRC (2000), Impact of the Enlargement of the European Union on Small and Medium-sized Enterprises in the Union Final Report to the European Commission DG Enterprise. 45 Rollo, J. (1998), Economic Aspects of EU Enlargement, in: M. Maresceau (ed.), Enlarging the European Union: Relations Between The EU and Central and Eastern Europe, Longman, London, pp. 252-275. 46 Boeri, T. and Brücker, H. et al. (2000), The Impact of Eastern Enlargement on Employment and Labour Markets in
the EU Member States, Report for European Commission’s Employment and Social Affairs Directorate, European Integration Consortium (DIW, CEPR, FIEF, IAS, IGIER), Berlin/Milan, Germany/Italy

36
predicted that capital flows to the CEE countries may double in the wake of accession and the inflow of portfolio capital will pick-up as the harmonisation of the regulation of financial markets gains momentum.
Geographical proximity seems to play an important role in determining bilateral trade and investment flows. The main investing countries of the EU are Germany, France, Austria and the Netherlands. These main investing countries account for approximately two thirds of all EU FDI stocks in the CEECs. The distribution of FDI is expected to continue to be uneven across CEECs and between regions in countries. FDI is likely to be heavily concentrated in the more advanced CEE countries. Further, accession may even widen disparities according to some studies, CEECs which remain outside the EU will lose out as FDI diverts to the new member states.
Post enlargement migration flows from the east has been one of the most controversial accession issues amongst the EU-15, particularly regarding the potential impact on domestic labour markets. The wage differential between the CEECs and the EU Member States (much larger than in any previous enlargement round), the relative economic underdevelopment of the candidate countries, and the more highly integrated EU market have all led to fears of massive post-enlargement migration flows into the EU. A key component of current, as well as future post-enlargement, migration is its geographical concentration, primarily in the neighbouring countries of Germany and Austria. Of current CEE residents in the European Union, 73 percent of the working age population and 80 percent of the employees are found in these two countries.47
A number of studies, (e.g. OECD, 1998), conclude that, large-scale migration flows from east to west are not likely to occur and should not be overemphasised in the enlargement agenda. However, transition arrangements for the application of the free movement of persons are in place. A two year period, during which national immigration policy measures are still applied by EU-15 Member States to new Member States. Depending on how liberal these national measures are, they may result in full labour market access (UK and Ireland). Following this period, reviews will be held: one automatic review before the end of the second year and a further review at the request of the new Member State. The procedure includes a report by the Commission, but essentially leaves the decision on whether to apply the acquis up to the Member States. The transition period should come to an end after five years, but it may be prolonged for a further two years in those Member States where there are serious disturbances of the labour market or a threat of such disruption. Safeguards may be applied by Member States up to the end of the seventh year. The EU has not requested a transition period in relation to Malta and Cyprus.
6.10 Conclusion The aim of this analysis has been to provide an overview of the territorial impacts of the acquis and community policies. This is an inherently ambitious goal and it is an extremely broad topic to cover within the confines of this project. To provide a detailed analysis of the impacts of the entire acquis and such complex community policies as CAP and the Structural Funds is an entirely unrealistic objective. Partner ESPON projects, e.g. 1.1.3, 2.2.1 and 2.1.2, deal with these issues in much more depth than can hoped to be achieved here. However, where this analysis can ‘add value’ is by providing a broad review and synthesis across policies, legislation, and geographic scales. With reference to territorial development goals, the analysis conveys broad developmental trends and processes, details the adoption of policies and legislation and highlights potential variations between countries and regions.
With the exception of Bulgaria and Romania, negotiations with the ten new Member States were successfully concluded at the Copenhagen Council Meeting in December 2002 when all negotiation chapters of the acquis were closed. According to the EC’s 2002 Regular Reports, the majority of countries have made significant progress in terms of both the transposition of
47 Boeri, T. and Brücker, H. et al. (2000), The Impact of Eastern Enlargement on Employment and Labour Markets in
the EU Member States, Report for European Commission’s Employment and Social Affairs Directorate, European Integration Consortium (DIW, CEPR, FIEF, IAS, IGIER), Berlin/Milan, Germany/Italy
37
the acquis and administrative capacity. In a number of areas where there have been restrictions of both scope and time, new member states have been granted transition periods for the full application of chapters of the acquis. Management of these transition periods will be closely monitored. Synthesising central themes from the country analyses, key areas, where on-going progress with applying the acquis is particularly important from a spatial perspective are summarised below:
Transport
• Efforts to develop transport infrastructure in line with the Trans-European Transport Networks; and
• Various actions required in the road, rail, air and maritime sectors.
Industry
• Significant spatial and territorial implications of the on-going process of privatisation and restructuring of heavy industry and energy sectors are anticipated also in the future – this will be seen in a number of relevant areas including employment and the environment;
• Further advances are needed with regard to the functioning of labour markets with active measures in favour of disadvantaged groups; and
• There is a need to reinforce private and public infrastructure necessary for the mobility of the workforce.
Regional Policy
• There is a need to focus on building up adequate and efficient administrative capacity for the management of the Structural Funds and Cohesion Fund at all levels;
• There is a need to improve the technical preparation of projects eligible for Community funding; and
• There is a need to improve administrative capacity to implement the Common Agricultural Policy and the EC rural development schemes.
Environment
• Close attention is required with regard to such issues as waste management, water quality, industrial pollution control, chemicals and nature protection.
In the light of national and regional variations, it is also clear that the adoption of individual chapters of the acquis will be more/less demanding for some countries than others. Countries with a significant number of heavy industrial regions, for example, will be more directly affected by requirements of environmental regulation, sustainable development rules and competition laws. In contrast, many capital city regions have prospered as market centres and will benefit from element of the acquis such as the free movement of goods.
The analysis also demonstrates that particular chapters of the acquis are likely to have a more direct impact on spatial/territorial development than others. Overall, many elements of the acquis are in line with territorial and spatial development themes e.g. accessibility and connectivity, environmentally friendly and sustainable development, see table Table 6-12. The adoption of the acquis, therefore, has the potential to influence territorial development issues by addressing (directly or indirectly) regional potential and bottlenecks, e.g. through the promotion of integrated pan-European transport and telecommunications networks, the development of structures for the implementation of future Structural Funds and the introduction of a more unified industrial policy. Table 6-12 highlights way in which EU policies and key elements of acquis could promote various aspects of territorial development. However, it is important to qualify these findings. First, given the level of development disparities between the old and new Member States, changes to existing territorial development patterns can only be expected over the longer term. Second, it is important to

38
recognise the limitations of EU policy actions. In practice, the course of territorial development will be highly dependent on developments in the wider economic and political realms. Third, explicit links to territorial development goals are not necessarily clear. The territorial impact of the acquis and EU policies could be implicit, coincidental or even accidental. Fourth, policy may conflict with territorial goals or act to promote some developments over others. Table 6-12: The Acquis/Community Policies and Territorial Goals Chapter Spatial
Cohesion Spatial Competition
Spatial Integration
Regional /territorial impact review
Agriculture Rural development funding
Guaranteed standard of living and income for agricultural communities
Increased productivity
Multi sectoral integrated approach to rural economy
Market Unity
Promotion of rural linkages and connectivity
Rural regions
Lagging rural regions (eastern border regions)
Countries with high percentage of agriculture, e.g. Poland and Romania.
Environment Support for environmentally
disadvantaged regions
Supported for protected regions
Improved quality of life - link to development of competitiveness
Improved environmental infrastructure
EU neighbourhood policy
Cross-border cooperation
Heavy industrial/polluted regions
Improved environmental services for urban region
Vulnerable habitats
Transport Policy Potential to
addresses transport bottlenecks to regional development
Improved competitiveness through improved infrastructure and transport services
Cross-border linkages
Urban centres as transport nodes
Capital cities, linked through TENs
Increased internal integration
Regional Policy Support for
lagging regions and cohesion countries
Emphasis on regional competitiveness, innovation and R&D
Cross-border cooperation
Support for lagging regions and cohesion countries
Competition Policy State aids to
lagging regions Removal of market barriers
Freer movement of labour (though currently restructured)
Support for lagging regions
Negative impacts of migration
Growth in most competitive regions
R&D Support for R&D and innovation provide through structural funds
New development potential for heavy industrial regions
Development of high tech zones and growth poles
Cooperation between Member States through framework measures
Well endowed urban centres, through higher tech, innovative companies also have the potential to be more ‘footloose’.
Internal Market New development opportunities and
Free market Freer movement of persons
The most competitive

39
markets for regional economies
CEE regions can compete with EU-15 for investment and business
regions - capital cities and western border regions
Regarding the implementation of community policies in an enlarged EU, a core aim of EU pre-accession aid and the acquis has been to build the capacity of new Member States to manage and implement these policies. The resulting, enhanced capacity of the new Member States should enable them to utilise funds more effectively and, in doing so, fulfil territorial development objectives. However, the complexity of the policies and the scale of development disparities in the new Member States mean that the impact of the Community Policies on overall territorial balance and cohesion is unlikely to be perceptible in the near future. Funds are difficult to access and there are concerns over the ability of the new Member States to develop a sufficient volume of projects. Many EU funding programmes, e.g. CAP and the Structural Funds can be too complex for both administrations and end beneficiaries.
It is also important to take into account the distinct national and regional contexts in which these developments are taking place. From the country analyses provided in the second Interim Report of ESPON project 2.2.2. it is clear that economic, political, social and regional conditions within the Candidate Countries and Member States vary. Equally it is important to consider not just how single policies or chapters of the acquis will impact on territorial development but also what their combined impact will be.

40
7 Comparative Analysis of National Instruments for a Territorial Policy
7.1 Introduction The primary focus of the ESPON 2.2.2 project is the territorial impact of EU pre-accession funds. However, it is also important to take into account the regional policy context within which this funding is implemented. In all of the countries covered in this study (the ten new EU Member States, the two Candidate Countries and Switzerland and Norway) national regional policy measures exist to support disadvantaged regions, to develop key economic centres or to promote regional economic development in general. This report focuses on these policy measures and assesses their likely influence on key aspects of territorial development, as well as their relationship to EU funding programmes. Following this introduction to the chapter and research methodology, subsection 2 provides a brief introduction to national regional policy. National regional policies commonly aim to promote regional and/or balanced territorial development. They incorporate a range of policy objectives, involve a variety of policy measures, differ in terms of area designation approaches and use distinct policy delivery systems. The chapter is structured around these core elements of policy: policy objectives (discussed in Subsection 3), policy instruments (Subsection 4), spatial targeting (Subsection 5) and policy implementation (Subsection 6). A final section draws together some conclusions and policy recommendations. Throughout the chapter, the aim is to consider the potential relationship between national regional policy, EU Structural Funds and territorial development objectives.
Territorial Development Goals and Regional Policy
Over the last decade, territorial development goals have gained increased attention. The adoption of the ESDP in 1999 marked a renewed interest in the territorial dimension as a framework for cohesion policies in the EU countries. However, the ESDP is not binding and represents a compromise between different policy traditions and the different aims of national governments and the European Commission.48 The concepts and characteristics of ‘territorial development’ are not clear-cut and debate is still ongoing around the meaning of key terms. However, based on work carried out in the First Interim Report, this analysis focuses on the territorial development goals outlined in Box 1.
48 Polverari L and Rooney ML with Bachtler J, McMaster I, Raines P, Böhme K and Mariussen A (2001) The Spatial
and Urban Dimensions in the 2000-06 Objective 1 Programmes, Report to DG XVI of the European Commission, Brussels.

41
Box 1: Territorial Development Goals
• Spatial cohesion (equity): This objective states that inequalities between social groups and regions should be reduced by setting minimum standards of public goods provided or by transfer of payments from richer to poorer regions. Examples include: polycentric development, balanced spatial development, reducing social and economic disparities between different regions.
• Balanced spatial competition (efficiency): This objective states that policy measures should help towards an efficient spatial allocation of resources by taking away bottlenecks and barriers to development. It also implies that policies should take into consideration not only the core regions. For balanced spatial competition, smaller towns and remote regions should also benefit from policy measures improving their competitiveness. Examples include: urban systems, territorial division of labour, comparative advantages of specialised towns and city regions, urban-rural relationships
• Spatial integration: European integration means, in spatial terms, improving the linkages between peripheral and central regions by transport networks and telecommunications infrastructure, by transnational institutional co-operation or networking of firms. Examples include: transnational networking, growing transnational flows of capital, commodities, movement of persons, transnational governance networks, transnational common projects
It is important to note that none of the countries involved in this study was directly involved in the development of the ESDP. However, they are all engaged in broader debates around the issues of regional/spatial development. Debates arising out of the tensions which exist between pro-equalisation and pro-development agendas are on going. ‘New’ regional policies are “framed in terms of maximising the contribution of all regional economies to national growth” in a more competitive global environment.49 In response, the policy emphasis is increasingly being placed on balanced development and economic competitiveness, whilst the previous commitment to ‘cohesion’ objectives and redistributive regional policy appears to be weakening. At the same time, this trend has drawn criticism. Lovering, for instance, suggests that the role of the central state as an employer and investor in regions is downplayed in new regional policy models. Instead, regional administrations are expected to increase ‘regional competitiveness’, which is regarded by Lovering as an over-simplified approach, one which neglects the potential consequences of increased competitiveness for regional labour forces and which acts as a means for national government to abdicate responsibility for addressing the problems of lagging regions.50
Debates about the appropriate balance between ‘equity’ and ‘efficiency’ have particular resonance in the Central East European Countries (CEECs). In the context of accession to the EU, the most important problem is not the differences which exist between regions but the comparatively low economic potential of all regions. At the same time, regional disparities within the CEECs remain severe, which implies the need for targeted government assistance. While the principle of encouraging regions throughout the country to develop their individual potential is logical, given comparatively low levels of regional development generally, it seems likely that resource constraints and the particularly underdeveloped state of peripheral regions are going to ensure that considerable selectivity will have to apply in practice.51
49 Bachtler J. (2001) Where Is Regional Policy Going? Changing Concepts of Regional Policy, EPRC Discussion
Paper, University of Strathclyde, October 2001, p. 5
50 Lovering J. (1999) ‘Theory Led by Policy: the Inadequacies of the ‘New Regionalism (Illustrated from the Case of Wales)’, International Journal of Urban and Regional Research, 23 (2) pp. 379-90.
51 Bachtler, J. and Downes, R. (2001) Benchmarking Regional Policy in Europe: Patterns, Trends and Issues Report to international conference ‘Benchmarking Regional Policy in Europe’, Forest Hills Hotel, Loch Ard, 9-12 September 2001.

42
National Regional Policies and EU Funding Programmes
As well as considering the relationship of national regional policies to territorial development goals, this report also reviews the compatibility of national regional policies with European Union funding programmes. EU policy approaches are widely acknowledged to have exerted a strong influence on national policy approaches towards regional and spatial development, particularly in the new Member States and Candidate Countries. The prospect of EU accession gives the Commission considerable leverage over aspiring members. The publication of Regular Reports and Accession Partnerships exerts pressure by assessing applicants’ adoption of the acquis communautaire and sets out short- and medium-term objectives for future reform. Chapter 21 of the acquis stresses the importance of a number of aspects linked to regional policy and EU Funds: the need to have an appropriate legal framework, allowing for the implementation of the specific provisions in this area; the requirement for there to be an appropriate form of territorial organisation for the implementation of Structural Funds; sufficient programming capacity, including a National Development Plan, procedures for multi-annual programming, implementation of the partnership principle and monitoring and evaluation provisions; administrative capacity, with a clear definition of tasks and responsibilities and effective inter-ministerial co-ordination; and compliance with the control provisions applicable to the financial and budgetary management of the Structural Funds.52
Meeting the demands of the acquis and preparing a suitable system for the administration of reoriented EU funds required major institutional and administrative reforms in the new Member States and Candidate Countries. At the end of the 1990s, a series of national legislative reforms set out new frameworks for regional policy, bringing national approaches into line with EU requirements. In addition, regional assistance programmes and policy instruments have been developed to accord with EU competition policy regulations. National efforts to meet accession requirements have been supported by pre-accession aid programmes, which are another key mechanism through which the EU has shaped regional policy approaches in the Candidate Countries and new Member States. For instance, the PHARE programme is linked to the launch of a pilot regional development programmes, regional investment funds, and the development of institutional capacity in the regional policy field. The influence of the EU in Poland is acknowledged explicitly: “EU multilateral assistance was and remains an important improvement factor of programming capacity and of administrative efficiency in the regional policy sphere”.53
Many of the developments outlined above are linked to the requirements of EU Structural and Pre-accession Aid, from which the majority of these countries will benefit. Key elements of these Funds are outlined in Box 2.
Box 2: EU Policy Approaches: Structural Funds & Pre-accession Aid
The Structural Funds act on economic and social structures to:
• develop infrastructure, such as transport and energy;
• extend telecommunications services;
• help firms and provide training for workers; and
• disseminate the tools and know-how of the information society.
The Cohesion Fund currently provides direct finance for specific projects relating to environmental and transport infrastructure in Spain, Greece, Ireland and Portugal.54
Assistance is channelled through multi-annual programmes, defining priorities for the use of Commission funding, and drawn up and implemented by partnerships involving the
52 http://europa.eu.int/comm/enlargement/negotiations/chapters/chap21/index.htm
53 Committee for European Integration, Poland (2003) Integrated Operational Programme for Regional Development [ZPORR] 2004-2006 Warsaw, February 2003. p32
54 http://europa.eu.int/comm/regional_policy/intro/regions2_en.htm
43
Commission, national government, local authorities and other actors.
Areas eligible for Structural Fund assistance are defined according to Community-wide criteria, resulting in a map of assisted areas through the EU. Eligible regions are designated either:
• Objective 1: to promote the development and structural adjustment of regions whose development is lagging behind (with a GDP per capita of less than 75 percent of the EU average).
• Objective 2: to support the economic and social conversion of areas facing structural difficulties. The overall population in Objective 2 regions could cover up to a maximum of 18 percent of the EU population and could include residents in areas undergoing socio-economic change in the industrial and service sectors, declining rural areas, urban areas in difficulty and depressed areas dependent on fisheries.
• Objective 3: to support the adaptation and modernisation of policies and systems of education, training and employment. Areas eligible for financing under the Objective 3 were all areas not covered by the Objective 1.
The funds are allocated according to five broad principles:
• Partnership – all relevant partners should be involved as far as possible in the planning and implementation of investment
• Subsidiarity – decisions should be taken at the lowest practical level.
• Additionality – EU money is given in addition to the government budget.
• Programming – all investments have to be planned as part of a coherent investment strategy over a number of years.
• Concentration – funds should be concentrated where they have most effect.
Pre-accession aid, available to the Candidate Counties, is designed to shadow the Structural Funds.
• The PHARE programme targets economic and social cohesion and institutional capacity building.
• The Structural Action Programmes for Agriculture and Rural Development (SAPARD) is designed to shadow the European Agricultural Guidance and Guarantee Fund, providing support for rural development and the sustainable development of agriculture.
• The Instrument for Structural Policies for Pre-accession (ISPA) targets high priority transport and environmental investments and parallels the Cohesion Fund.
Cyprus and Malta are not eligible for the three pre-accession funds described above. Instead, Pre-accession funding in Cyprus and Malta involves cooperation projects and operations in the form of grants.
Similar to national regional policy, the Structural Funds are not necessarily designed to take territorial cohesion into account. However, a number of reports have examined the relationships and linkages between the Funds and territorial development, including two reports on the Spatial and Urban Dimensions of the 2000-06 Objective 1 and 2 Programmes and ESPON project 2.2.1.55 These reports conclude that, while Structural Fund programmes
55 Rooney ML and Polverari L with McMaster I, Michie R, Raines P and Taylor S (2001) The Spatial and Urban
Dimensions in the 2000-06 Objective 2 Programmes, Report to DG XVI of the European Commission, Brussels. Polverari L and Rooney ML with Bachtler J, McMaster I, Raines P, Böhme K and Mariussen A (2001) The Spatial and Urban Dimensions in the 2000-06 Objective 1 Programmes, Report to DG XVI of the European Commission, Brussels. Polverari L and Bachtler J (Forthcoming) La dimensión territorial de la cohesión económica y social:

44
have not set out to incorporate territorial development goals, there is “an important implicit response of the programmes to the guidelines and aims of, for example, the ESDP”.56 The ESPON project 2.2.1, Work Package 2, puts forward a similar interpretation:
1. It is possible to identify explicit and implicit (mostly) coherence between the objectives of programming documents and the objectives of territorial cohesion.
2. Structural Fund programmes can be considered as contributing to territorial cohesion also as regards their method of implementation and governance.
3. The Structural Funds contribute to the achievement of the goals of territorial cohesion (and potentially of polycentrism) in two ways: directly and indirectly
• direct support occurs when the goals of territorial cohesion are directly targeted by Structural Fund policies, either explicitly or implicitly.
• indirect support occurs when the Structural Funds are used as a lever for national policies aiming towards the objectives of territorial cohesion, to promote trans-national links, and to support new thinking and new approaches to economic development.57
The potential for the Structural Funds to complement and work towards territorial development objectives suggests that, in as far as it complements or mirrors particular aspects of Structural Fund policy, national regional policy may also indirectly impact upon the achievement of territorial development goals.
At the same time, when considering national regional policy, it is important to note that EU policy approaches have neither had a complete, nor uniform, influence. The impact of EU regional policy is modified by the specific features of national policy systems, not least the existing distribution of competences between national and sub-national levels.58 In the new Member States and Candidate Countries, reconciling the practices of existing domestic regional institutional systems with the principles of Structural Funds management is particularly challenging. The emphasis on the partnership principle, the need for clarity in the allocation of responsibilities and the preference for integrated approaches based on inter-institutional co-ordination and cooperation have all made the adaptation process difficult, especially given the often severe time pressures faced. Generally, in the CEECs, there is a lack of a tradition of partnership working between administrative levels. Hierarchical systems have dominated and institutional inertia means that, even where sustained efforts have been made, change can be slow. Efforts to develop ‘network-like’ cooperation and partnership can be impeded by embedded norms amongst institutions and actors. All of the many different directions of co-operation and communication are potentially weak, including between the national and sub-national levels and amongst organisations within each tier. Institutions are accustomed to defending their own sphere of responsibility; submitting competences, information or resources to a new, coordinated regional policy framework is a very new departure. Of particular consequence for regional policy is the weak co-ordination between regional and central/sectoral authorities59
política regional y planificación territorial en Europa in Joan Romero González and Farinós Dasí Joaquín (Eds.) El Gobierno de los territorios ,
56 Polverari L and Rooney ML with Bachtler J, McMaster I, Raines P, Böhme K and Mariussen A (2001) The Spatial and Urban Dimensions in the 2000-06 Objective 1 Programmes, Report to DG XVI of the European Commission, Brussels. P. 1
57 Polverari, L. (2004) ESPON 2.2.1 Work Package 2: Formulation of Working Hypotheses on the Territorial Effects of past (1994-99) and current (2000-06) Structural Fund Programmes p. 69-70.
58 Jeffrey, C. (1997) The Regional Dimension of the European Union: Towards a Third Level in Europe? (London: Frank Cass), Börzel, T. (1999) ‘Towards Convergence in Europe? Institutional Adaptation and Europeanisation in Germany and Spain’ Journal of Common Market Studies , Vol. 37. No 4 pp. 573-96
59 McMaster I and Ferry M (2003) Regional Governance in Industrial Regions in Central and Eastern Europe: Case Study of Moravia Silesia, Paper presented at RSA Conference - 'Reinventing Regions in a Global Economy', Pisa, April 2003 and Blažek J (1999) ‘(In)consistency and (In)efficiency of the Czech Regional Policy in the 1990s’, Acta Universitatis Comenianae Geographica, Bratislava, Slovakia, and available at: http://www.natur.cuni.cz/~mak/clanky/blazblava.htm.

45
Country and Policy Coverage
As a ‘comparative analysis of national instruments for a territorial policy’, this report had the potential to cover an extremely large number and wide range of policies.
This problem is exacerbated by the diverse range of countries to be covered, making broad generalisations difficult. The fourteen countries include West European, non-EU Members (Switzerland and Norway), island economies (Malta and Cyprus), East European Candidate Countries (Romania and Bulgaria) as well as the ten new Member States. Further, these countries have very different relationships with the EU and EU policies. For instance, the new Member States and Candidate Countries have agreed to adopt the EU acquis, are benefiting from EU pre-accession aid and, after accession, will participate in Structural Fund programmes. Switzerland and Norway are not EU Members, though Norway is covered by the EEA Agreement and they both participate in cross-border programmes with neighbouring EU Member States. The differing relations of these countries with the EU means that the direct influence and relevance of EU policy varies considerably. Bearing this point in mind, it is useful to make some broad distinctions between the countries covered, according to their links with the EU and their development background.
• New Member States – full members of the EU as of May 2004 (Cyprus, Czech Republic, Estonia, Hungary, Latvia, Lithuania, Malta, Poland, Slovakia and Slovenia)
• Candidate Countries – countries that have applied for EU Membership, but which will not join in 2004 (Romania and Bulgaria).
• Central East European Counties, CEECs – (Bulgaria, Czech Republic, Estonia, Hungary, Latvia, Lithuania, Poland, Romania, Slovakia and Slovenia)
• Island Economies – Cyprus and Malta
• Non-EU Member States – Switzerland and Norway
As previously stated, the main focus of this study is national regional policy. However, virtually all functions performed by government that involve public expenditure have the potential to have an effect on regional balance and support for incomes in less prosperous regions.60 For instance, public sector policy in Norway has a dramatic impact on regional development, through employment and a commitment to equal service provision in all districts. A wide range of spatially discriminating policies, other than regional policy, is also in operation. These may be national, or sub-national, government policies, e.g. rural development policies, policies for ‘crisis’ areas or urban policy. Although the distinction between regional policy and other spatial policies is not always immediately apparent, there is a difference in emphasis between the two. The main objective of national regional policy is economic development through the use of economic development instruments. For other spatial policies, social and political objectives are more immediate, although economic development instruments may be among the measures used. 61 Table 7-1 provides a summary of key policy areas with the potential to have significant spatial/territorial development impacts, particularly in relation to cohesion at the national and EU level. Key policy objectives, policy instruments and policy impacts are highlighted, using selected examples from the countries covered in the report. Rather than providing an exhaustive account, the objective here is to give an indication of the types of policies that are in place and how they relate to territorial development goals.
60 European Commission, (2004) Towards a new Cohesion for Europe: Convergence and Competitiveness and
Cooperation: Third Cohesion Report European Commission: Brussels p. 81
61 Wishlade, F. Yuill, D. et al. (1996) Economic and Social Cohesion in the European Union: The Impact of Member States’ Own Policies Report to the European Commission (DGXVI).

Table 7-1: Typology of key policies with territorial impacts
Policy Development Context Policy Type Potential Territorial Impact U
rban
Pol
icy
Due to their population and economic performance alone, cities are a major factor influencing national development. At the same time, many of the economic and social development problems faced by governments are also focused in conurbations.
The particular concentration of development potentials and bottlenecks within urban areas has spawned numerous policies that specifically target cities, e.g. urban regeneration strategies, brown field development, city plans, infrastructure development and housing policy.
Czech Republic - Metropolitan Economic Strategies to generate viable uses for redeveloped brownfield sites that contribute to job creation, business investment, and income growth.62
• Development of growth poles
• Contribution towards polycentric spatial development
• Spatial Integration –improved linkages between urban centres and peripheries, transnational networking
• Balanced spatial competition – removal of barriers and bottlenecks to development
Rur
al P
olic
y
Rural-Urban disparities, rural poverty and the specific development needs of rural economic development are the focus of a wide range of policy initiatives.
Most notably, the Central and Eastern European have been going through a severe agricultural depression since their centrally planned economies collapsed in the early 1990s. On the other hand, CEECs still retain a significant proportion of Europe's biodiversity. The existing low input and low intensity agriculture practised in these countries can be perceived in certain respects as an opportunity for environmental sustainability in the agricultural sector.63
Rural economic diversification, rural infrastructure and service provision, agro-tourism, support/grants to formers, rural development strategies
Hungary - Rural Development is targeted for rural economic development and reduction of social disparities – key policy areas include: agricultural modernisation; diversification of the rural economy; infrastructure development and human resource development.64
Latvia - Rural Development Programme: promotion of dynamic development of rural economy.
• Promotion of balanced development
• Improved spatial integration - rural urban linkages
• Balanced spatial competition - development of rural potentials through rural economic diversification
• Spatial Cohesion – through aiming to reduce social and economic disparities
R&
D In
nova
tion The profile of R&D and innovation policy varies between
the countries covered in this study. For instance, unlike Switzerland and Norway, R&D and innovation policy systems of the countries of Central and Eastern Europe (CEE) have so far been treated as marginal within the overall institutional transformations that are taking place in these nations. However, one of the big challenges facing Candidate Counties is a gradual switch from ‘low-road’ to a ‘high-road’ strategy of competitiveness, which implies a greater emphasis on R&D and Innovation policy.
Poland - Silesian Regional Innovation Strategy project in collaboration with Nord-Pas de Calais (France) and Limburg (Belgium). The project will establish a process of structured co-operation between Silesia’s principal innovation actors, in order to develop a practical regional innovation strategy focusing on sectors critical for successful economic restructuring, and to improve the flow of information between SMEs, business support suppliers and policy-makers. The project also hopes to stimulate direct co-operation between Silesia’s SMEs and those of its western partner regions.65
• Targeted assistance to high potential or assisted areas
• Balanced spatial competition
• Spatial cohesion
• Spatial integration
62 http://www.pragueinstitute.org/pro_brownfields.htm
63 http://www.ncl.ac.uk/cre/publications/working_papers/wp60.htm
64 Kovács T. (2001) Rural development in Hungary Centre for Regional Studies of the Hungarian Academy of Sciences Discussion Papers no. 34.
65 http://www.innovating-regions.org/download/IREnetwork_press_release.pdf

Tran
spor
t &
Com
mun
icat
ion
Policies, institutions and investments to support an appropriate modal mix, will be required as an important basis for improved competitiveness, economic growth and environmental benefits.
Major investments in transport infrastructure, including motorways and rail networks, and telecommunications infrastructure.
Hungary - ‘Resolution on the Hungarian Transport Policy (1996), defines the detailed objectives and instruments on a strategic level until 2000 and 2010, respectively.66 Lithuania - Priorities of transport infrastructure development are mainly directed to the reconstruction and modernisation of those transport infrastructure, which coincide with the components of the transport network within the TINA concept. About 2/3 of all transport infrastructure investment currently are allotted and in the future will be allocated to Lithuania’s TINA network.67
• Targeted investments to tackle regional development bottlenecks
• Interventions to promote spatial integration at national or EU level, e.g. through investment in TENs and cross-border links
• Rural Urban linkages
• Promotion of regional competitiveness
Envi
ronm
ent P
olic
y Environmental policy has important implications for sustainable development, the balance of social cohesion and sustainability with competitiveness and the markets; conservation of the rich territorial variety of Europe, contribution to local and global climate change control.68 Many of the countries covered in the this study have specific environmental development needs, e.g. addressing the needs of mountainous areas, coastal areas, heavily polluted regions.
Development assistance to protected areas, investment in ‘environmentally-friendly’ technology and practices, establishment of nature reserves, redevelopment of environmentally damaged regions
Czech Republic - designation of ‘afflicted areas’ which have suffered considerable environmental damage
Romania - Protection of the Danube Delta region69
• Targeted assistance to promote the preservation of the natural and cultural heritage
• Development assistance to, frequently, rural, remote, or peripheral regions.
• Promotion of regional competitiveness by ‘harnessing’ the quality of the natural environment as a resource.
Indu
stria
l Res
truc
turin
g Geographic concentrations of heavy industry, e.g. coal and steel production mean policies aimed at industrial restructuring are likely to have a pronounce impact on particular regional and local economies, linked to high unemployment and plant closures. Industrial privatisation and restructuring are on going processes in the CEECs.
Privatisation
Coal and Steel Restructuring Programmes
• Pronounced impact on heavy industrial regions, which tend to be spatially concentrated
• Part of long-term strategies to promote economic competitiveness, but also accompanied by job losses and plant closures
• Spatial integration - sales to foreign investors and the promotion of international trade is capable of promoting transnational integration
• Aim to tackle substantial bottlenecks for national and regional development
66 http://www1.oecd.org/cem/topics/ceec/ceecdoc.htm
67 http://www1.oecd.org/cem/topics/ceec/ceecdoc.htm
68 European Consultative Forum on the Environment and Sustainable Development (1999) The European Spatial Development Perspective, http://europa.eu.int/comm/environment/forum/spatreport_en.pdf
69 Carter, F.W. and Turnock, D. (1993) Environmental Problems in Eastern Europe Routledge

Spat
ial P
lann
ing
Spatial development planning is increasingly linked to the need for integrated development in the regions, at the national and EU level. Spatial Planning has an important role to play in promoting spatial integration, balanced territorial development and spatial competition spatial., Both the East-expansion of Europe has brought up the need to cope with spatial development planning issues on European scale.70
Malta - Structure Plan provides a strategic framework for spatial development in Malta and Gozo and sets down industrial, residential and rural policies and also includes policies in relation to tourism development, heritage protection, social and community facilities and transport infrastructure. New Structure Plans will draw upon the European Spatial Development Perspective and take account of the fundamental role of European policy.71
Poland - Concept of National Spatial Arrangement Policy (Koncepcja PolPrzestrzennego Zagospodarowania Kraju). This spatial development plan as framework for preparing government programmes and stresses the neecounter the “clear division between a relatively underdeveloped eastern and a more developed western part of the country”.72
• Aim to promote balanced development
• Spatial plans and instruments to promote integration of policy measures and objectives
• References to the ESDP goals
• Balanced spatial competition
Reg
iona
l Dev
elop
men
t
National government policies that aim to promote regional and, or, balanced spatial development can be employed for a wide variety of reasons, in diverse conditions, in a range of ways through various means. Regional development policy is now operating in a context that is heavily influenced by EU policy structures, an emphasis on regional and national competitiveness and endogenous development. Regional policy in Central And Eastern Europe has had to face the additional challenge of pronounced increases in interregional disparities.
Traditionally regional policies were implemented to tackle underdevelopment and depopulation in rural areas and geographically concentrated unemployment. More recently, a new regional and local dimension to economic development policy is apparent. Regional policy thinking is also shifting to the promotion of endogenous regional or local development, with an emphasis on entrepreneurship, innovation, business networks, SMEs and local development potentials. The policy response has been a new type of regional policy concerned with the strategic management of development.
• Spatial targeting of policy instruments
• Policy objectives and instruments targeting endogenous development of all regions
• Policy objectives and instruments targeting lagging regions in order to promote balanced development
Source: European Policies Research Centre, University of Strathclyde
70 http://www.raumplanung.uni-dortmund.de/rgl/euro_inh.htm
71 http://www.mic.org.mt/Malta-EU/position_papers/chap_21.htm
72 The Concept of National Spatial Arrangement Policy („Koncepcja Polityki Przestrzennego Zagospodarowania Kraju”) Monitor Polski No 26 Warsaw item 432 of August 16th, 2001.

49
As Table 7-1 demonstrates, an extremely wide range of policies has the potential to impact on territorial development at the regional, national or EU levels. For instance, in the CEECs, where development disparities are particularly pronounced, broad infrastructure policies have a marked impact on development in surrounding areas. In the case of these countries, economic reform and restructuring policies are also likely to have dramatic impacts on regional disparities within and between countries. The strong regional concentration of industries, such as coal and steel production, mean that the plant closures and job cuts associated with economic restructuring have particularly harsh effects on specific regional economies.
Having characterised national policies affecting territorial development in broad terms, this report now considers the particular case of national regional policy. This more narrow focus allows a more detailed and insightful analysis to be made of the interrelationships between national territorial policy, EU policy and territorial development goals than would otherwise be possible. The focus on national regional policy is appropriate for a number of reasons. First, regional policy incorporates elements of all of the policy areas outlined in Table 1 as relevant to territorial development, thus allowing the conclusions of this study to have a wider application. Second, national regional policy and EU regional policy are already strongly linked, e.g. through EU and national co-financing of development projects and through the influence of Structural Fund management on national regional policy approaches via pre-accession aid for regional development in the Candidate Countries and preparations for EU enlargement and Structural Funds in the new Member States. Third, regional policies have the potential to address a wide range of territorial development themes and issues, as the remainder of this report will discuss.
7.2 National Regional Policy73 National government policies that aim to promote regional and/or balanced spatial development can be employed for a wide variety of reasons, in diverse conditions, in a range of ways and through various means. Traditionally, regional policies were implemented to tackle underdevelopment, depopulation in rural areas and geographically-concentrated unemployment. Policy instruments included infrastructure projects and regional investment or employment incentives for business. The delimitation of designated aid areas and the delivery of policy instruments were generally undertaken by central government, with support usually being demand-driven in line with individual project applications.
More recently, a strong regional and local dimension to economic development policy has become apparent. In the current Member States this trend is closely linked to regional institution building and to associated increases in local responsibility for economic development. Regional policy thinking is also shifting towards the promotion of endogenous regional or local development, with an emphasis on entrepreneurship, innovation, business networks, SMEs and local development potentials. This policy response has been characterised as a new type of regional policy concerned with the strategic management of development.
Structural Funds in the current Member States, and the pre-accession aids in the new Member States and Candidate Countries, have strongly promoted this strategic approach to regional development. Eligible regions are required to submit development plans for spending EU resources, at the heart of which are development strategies which are created and delivered through partnership of regional and local actors. In parallel with the increasingly ‘strategic’ approach to regional development policy are new views on the role of spatial planning. Traditionally spatial planning is most closely associated with the regulation of land use. However, a more ‘extensive interpretation’ is gaining prevalence. This involves treating
73 This section is drawn from: Bachtler J and Yuill D (2001) Policies and Strategies for Regional Development: A
Changing Paradigm? Regional and Industrial Policy Research Papers, No. 46, European Policies Research centre, University of Strathclyde, Glasgow, and McMaster I and Yuill, D. (2001) Benchmarking Regional Policy in Europe: National Regional Policies, Report to international conference ‘Benchmarking Regional Policy in Europe’, Forest Hills Hotel, Loch Ard, 9-12 September 2001.

50
spatial planning as a strategic public activity of policy-thinking and orientation across all sectoral policies to achieve balanced economic, social and environmental development.”74
Compared to the current Member States, the recent history of regional policy in the CEECs has occurred within a very different macro-economic, political and social environment.75 Regional policy in the CEECs is not, of course, a totally new phenomenon. Spatial planning within a sectoral framework was carried out during the socialist period, and regional policy actions along western European lines was undertaken (to a limited extent) in some countries with a more liberal economic approach e.g. Hungary and Slovenia. There is also a long and rich intellectual tradition of debate and research on regional development in CEE. In some ways, therefore, current trends have to be seen as part of a longer-term history of regional development in CEE, albeit affected considerably by fundamental political, economic and institutional systemic changes.76
However, in the immediate post 1990 period, market-economy-based regional policies were initially slow to develop in the ten CEE applicant countries; instead, priority was given to political and macro-economic reforms at a time of scarce resources and in the face of national economic crisis. There was also a time lag in the emergence of the territorial impact of reform, a lack of requisite institutional capacity and unresolved issues of territorial administrative reform. In contrast, more recently, regional policy has been the focus of much greater attention. Increasing regional disparities (see ESPON 2.2.2, Second Interim Report) and the requirements of EU accession have moved regional policy up the political agenda in Central and Eastern Europe. Regional policies, in some form, are now in operation in each of the new Member States and Candidate Countries, relevant institutions are being created at national and regional levels and a range of policy instruments are in place.
In Switzerland, Norway, Cyprus and Malta, the rationale for regional policy is most closely associated their geographical – rather than their industrial – characteristics. For instance, in Norway, mountainous terrain and severe weather have resulted in sparse settlement patterns, economic vulnerability for many communities, outmigration and unbalanced development between the peripheral and the core regions of the country. Consequently, Norwegian policy is constantly aiming to maintain communities and encouraging development in the northern parts of the country while reducing the danger of overheating in the southern, more prosperous and populated regions, particularly the Oslo area. In the case of Cyprus and Malta, their small size means that ‘regional’ development policy is not a policy priority. However, even in Malta, the Government has recogniseed need to decentralise certain development actions to the local level in order to ensure that local needs and expectations are properly addressed. The Ministry for Gozo has regional co-ordination responsibilities for Government programmes and projects on the island. The government will support the implementation of locally based integration action plans which focus on co-ordinating activities that target local needs and provide support and linkages across a range of policy areas.77
74 Polverari L. and Bachtler J (2003) Op cit.
75 Bachtler J, Downes R and Gorzelak G (2000) Transition, Cohesion and Regional Policy in Central and Eastern Europe, Ashgate Publishers, Aldershot and Bachtler J and Downes R (1999) Regional policy in the Transition Countries: A Comparative Assessment, European Planning Studies, Vol. 7, No. 6
76 McMaster I and Yuill, D. (2001) Benchmarking Regional Policy in Europe: National Regional Policies, Report to international conference ‘Benchmarking Regional Policy in Europe’, Forest Hills Hotel, Loch Ard, 9-12 September 2001.
77 http://www.ndp.gov.mt/sectoral.html

51
7.3 Regional Policy Objectives In the course of the mid- to late 1990s, a number of major regional policy documents, strategies and concepts were adopted in the countries covered in this study, particularly in the Candidate Countries and new Member States in advance of EU enlargement. In this group of countries, new policy legislation and associated policy objectives were developed in line with the demands of EU enlargement, specifically the requirements of Chapter 21 of the acquis and of Structural Fund implementation. Indeed, a number of national policies and objectives intentionally mirrored those of the Structural Funds. In Latvia, for instance, the integration of EU and national regional policy was one of the key objectives listed in the 1996 Concept of Regional Development Policy. The Slovak Act on Support of Regional Development similarly takes into account the basic principles of economic and social cohesion of the European Union, i.e. the principles of programming, partnership, concentration and complementarity. Even in Switzerland and Norway, non-Member States, the EU has had a direct impact on the thinking behind regional policy. In particular, through the EEA Agreement, Norway is directly affected by EU State Aid Guidelines.78
Frequently, national regional policy objectives are broad and they are rarely very specific. A number of commonly stated goals include: balanced, sustainable development; improvement of quality of life and equalising opportunities of citizens; increased competitiveness of regions; and reducing regional disparities in levels of development, especially in rural areas. Overall, the objectives set out correspond to the broad territorial development objectives originally identified in Box 1. As Table 7-2 shows, the themes of spatial cohesion and spatial competition are reflected in the regional policy objectives of a large number of the countries under review.
Table 7-2: Regional Policy Objectives and Territorial Development Goals
Country
Spatial cohesion (equity) Bulgaria, Cyprus, Czech Republic, Hungary Estonia, Latvia, Lithuania, Malta, Poland, Romania, Slovakia, Slovenia, Norway
Spatial competition
(efficiency)
Bulgaria, Czech Republic, Estonia, Hungary, Lithuania, Poland, Slovenia, Switzerland, Norway
Spatial integration Bulgaria, Latvia, Romania, Switzerland, Poland
Note: A detailed overview of regional policy objectives by country can be found in Summary Table 1 at the end of this section.
The general objective of spatial cohesion at the national level is incorporated through the inclusion of objectives aimed at, for example, reducing regional disparities in employment and income (Bulgaria), reducing differences between the levels of development of different regions (Czech Republic) and the control of significant differences in levels of development between the capital and the rest of the country, towns and villages, and developed and under developed regions (Hungary).
‘Equity’ objectives are commonly set out alongside ‘efficiency’ oriented goals and aims. For instance, the majority of countries incorporate the objective of sustainable development of regions – in many cases across the country as a whole – while also aiming to reduce economic disparities and equalise opportunities. In Norway, alongside a long standing commitment to support peripheral regions, government policy also advocates greater emphasis on regions and centres with particular growth potential.79 In the CEECs, the
78 More than this, Norway is also making a significant contribution towards meeting the costs associated with EU
enlargement. For more details, see http://secretariat.efta.int/WEB/EuropeanEconomicArea/EEAAgreement/eeaenlargementagreement
79 http://www.odin.dep.no/krd/norsk/distrikts/016061-990106/index-dok000-b-n-a.html

52
problem of implementing a regional development policy in the context of national economies which themselves are underdeveloped relative to the EU, creates a tension between national prosperity and regional disparity. For instance, the objectives of Lithuanian national regional policy include support to the development of a market economy in each region, which implies assistance even to the most prosperous regions with the greatest development potential. At the same time, policy also aims to reduce disparities between the Lithuanian regions. The Czech “Principles of Regional Policy” state that the overall objective of regional policy should be to ‘give an equal chance to all regions to allow them to make full use of their democratic, natural, economic and any other potential’. An emphasis on the construction and modernisation of infrastructure to strengthen the competitiveness of Polish regions, implies a similar commitment to the principle of spatial competition. Of particular note is Slovenia, which also makes specific references to the objectives of ‘polycentric development’ and sets out ‘principles’ of balanced development:
• integrity of implementing the policy in the entire territory,
• partnership co-operation among the national and local authorities and co-operation of the public and private sector,
• the principle of subsidiary,
• the programming of development incentives,
• evaluating and monitoring the impacts and transparency of using regional development funds, and
• co-funding.
The majority of the objectives set out under national regional policy focus on regional and national development, as opposed to referring to the national position within the EU as a whole. As a result, the objective of spatial integration at the EU level is less widely referred to. On the other hand, Bulgaria, Latvia, Poland and Romania include objectives to:
• open up the country through cross-border co-operation as a way to face regional and local development challenges (Bulgaria)
• create the preconditions for integration into the EU and its regional development (Latvia)
• develop international co-operation of the regions (Poland)
• stimulate of inter-regional co-operation, both internal and international, as a possible means to contribute to economic development (Romania).
Whilst explicit references to the objectives of spatial integration at the EU level are limited in the policy objectives of the CEECs, the objective of ‘catching up’ with the rest of the EU, and thus promoting cohesion, spatial competition and integration at the EU level, is widely implied.80
As well as common policy challenges and objectives, national regional policies also reflect the particular territorial development challenges faced by individual, or groups of, countries. For instance, a number of regional development concepts highlight specific practical tasks or development issues. Regional policy objectives in Norway, Switzerland, Cyprus and Malta are strongly linked to geographical conditions in these countries, including peripheral areas, mountainous regions and islands. In Norway, core aims of regional policy are to maintain rural and northern communities and encourage development in the north of the country, whilst reducing the danger of overheating in the south. In Slovenia and Estonia, long-standing problems linked to rural development are targeted. In Slovenia, regional policy has traditionally targeted ‘demographically endangered areas’ in an attempt to halt out-migration and the de-population of highland and peripheral areas. In their regional development guidelines, Lithuania and Estonia highlight the need to develop infrastructure and improve levels of connectivity between regions. In particular, Estonia’s Regional Development
80 It is worth noting that National Development Plans, which are used in conjunction with the Structural Funds, make
more frequent references to the goal of ‘catching-up’ with the EU-15.

53
Strategy refers to the importance of increasing mobility and access to rural and island areas of the country. Variations in regional policy objectives suggest that, as well as being subject to external policy pressures and influences, national regional policy is also rooted in specific national territorial development conditions.
The above analysis appears to suggest a strong coherence between national regional policies, EU regional development policy and territorial development objectives. However, a number of points should be made to qualify these findings. First, national regional policies are not obliged to take territorial development goals into account or to shadow Structural Fund programmes. Consequently, the degree of correspondence between national policy objectives and the wider policy context should not be considered as either validating or undermining the legitimacy of a policy. This is most obviously the case in Switzerland and Norway, which are not EU Member States.
Second, national governments may define ‘national region policy’ differently. Some may choose to set out broad, national regional development objectives within their policy documents which integrate spatial development agendas; this is likely to allow for a greater level of coherence with the territorial development goals set out in this report. However, others may choose to adopt a more focused approach to regional development, e.g. covering support to lagging regions, while broader objectives are addressed either in National Development Plans or in dedicated, spatial development strategies (Slovakia).
Third, particularly in the CEECs, links between national policy goals and territorial development objectives may be more apparent on paper than they are in practice. Market-oriented national regional policy is still at a relatively early stage in its development. Regional policy was not a major government priority in the early post-socialist period, when efforts were focused on macro-economic and political reform. In the majority of cases, national regional policies were not adopted until the mid- to late 1990s and are weakly resourced, which limits the opportunity to make any substantive impact on territorial or regional development. Further, policy implementation has frequently been delayed by lack of resources, inter ministerial disputes and the lack of appropriate institutional frameworks, (see Section 6). For instance in Bulgaria, despite the adoption of broad regional policy objectives, regional development policy was neglected for much of the 1990s. The plans and strategies that emerged during this period did not receive institutional or financial support from the government. Municipalities, suffering from lack of experience and resources, were to a large extent not involved in the formulation and implementation of regional initiatives.
Fourth, in the majority of cases, national regional policy objectives address an extremely broad and general range of policy goals, which may undermine the relevance of the policy and weaken its impact. In a number of cases regional policy objectives are relatively ambiguous, e.g. ‘reduction of differences in the levels of economic development’ (Slovakia) or ‘the reduction of existing regional disparities’ (Romania). These types of policy objectives have the potential to mean either a lot or very little. Generally, policy objectives do not detail specific targets, so a ‘reduction’ in disparities could be anything from a substantial change to a slight narrowing of developmental gaps in specific areas of activity. Related to the generality of regional policy, national regional policies are also commonly vague on the issue of resources, concrete tasks and competencies. Resulting difficulties in agreeing and operationalising national regional policy have delayed and hampered government efforts to meet policy objectives. Further, such a broad range of activity is covered that regional development resources are often considered to be spread too thinly.
Finally, external pressure may skew national regional policy objectives to meet EU requirements. The combined pressures of EU accession and arrangements for EU funding have exerted a considerable influence on the direction and profile of national regional policy in the new Member States and Candidate Countries. A number of CEECs did have relatively well-established regional policies in place at an early stage, e.g. Hungary. However, without the external influence of the EU, others may have chosen a different path of policy development. For instance, the small size of some of the new Member States may limit the perceived relevance of regional policy. In addition, some countries may have chosen to devote already limited resources to national economic development, as opposed to lagging regions. A lack of national ‘ownership’ of and commitment to national regional policy may limit its longer-term impact.

Table 7-3: Summary Regional Policy Objectives
Status Country Policy Key Objectives
Czech Republic
1998 – Principles of Regional Policy
2000 - Act on Support for Regional Development (No. 248/2000)
• Equal chances to all regions
• Contributing to balanced and harmonious development,
• Reducing unjustified differences between the levels of development
• Improving regional economic structure”.81 Estonia 1994 - Guidelines of Regional Policy
1999 - Regional Development Strategy of Estonia
• Balanced socio-economic growth of all the regions
• Sustainable development
• National territorial integrity
Hungary 1998 - Act on Regional Development and Physical Planning (amended)
2003 - National Spatial (Physical) Development Plan.
• The promotion of the social market economy in all regions of the country
• The control of significant differences in terms of living standards,
• The encouragement of the harmonious development of the spatial structure and settlement network of the country;
• The maintenance and strengthening of national and regional identity.
• Principal directives for land use development
Cen
tral
Eas
t Eur
opea
n N
ew M
embe
r Sta
tes
Latvia 1996 - Concept of Latvian Regional Development Policy
2002- Law on Spatial Planning
2002 - Regional Development Law
• Favourable and equal environmental, living and working conditions in all regions
• Reduce and eliminate unfavourable regional disparities
• Ensure sustainable and balanced development
• Integration of Latvia into the EU and its regional development process
• Promote sustainable and balanced development
• Promote and ensure balanced sustainable development of the state
• Reduce the unfavourable differences between them
• Preserve and development the chracteristic of the natural and cultural environment
81 National Development Plan http://www.mmr.cz/index_en.html p.86

Lithuania 1998 - Government Decree no. 902 on ‘Regional Policy Guidelines’
1999 - Decree no 538 on the Implementation of Regional Policy Guidelines’ (1999)
(2002 a reform of the Law on Regional Development was approved by the Parliament)
• Support to the development of a market economy in each region;
• Creation of favourable conditions for long-term development;
• Improvement of infrastructure responding to social-economic and environmental demands; and
• Reduction of economic, cultural, educational disparities as well as disparities of living conditions between the Lithuanian regions.
Poland 2000 - Law on the principles of supporting regional development,
National Strategy for Regional Development
• Construction and modernisation of infrastructure to strengthen the competitiveness of regions
• Restructuring of the economic bases of the regions and creating conditions for their diversification
• Development of human resources and strengthening the institutions of regional policy
• Supporting areas requiring activation and threatened by marginalisation
• Develop the international co-operation of regions
Slovakia 2000 - Principles of the Regional Policy of the Slovak Republic
2002 - Act on Support of Regional Development
• Provide for a well-balanced economic development and social development
• Remove or mitigate disparities
• Prevent the origination of new regions with lower economic performance and living standard of population,
• Sustainable economic development and social development of regions.
Slovenia 1999 - Law on Balanced Regional development
2003 - Spatial Planning Act
• Promotion of balanced economic, social and spatial development aspects;
• Reduction of the differences in the levels of economic development and living conditions,
• Preventing the emergence of new areas with major development problems;
• Preserving settlements in Slovenia
• Promotion of environment-friendly production, including the protection of natural resources, cultural heritage.
Cen
tral
Eas
t Eu
rope
an
Can
dida
te
Cou
ntrie
s
Bulgaria 1998 - Regional Development Act
2001 - Law on Spatial Planning
2004 - Regional Development Act
• Stable, sustainable and balanced development of the individual regions;
• Reducing regional disparities in employment and income; and
• Opening up Bulgaria through cross-border co-operation as a way to face regional and local development challenges.
• Use, protection and building of the territory as well as with the required spatial and urban development schemes and plans.
• Came into force on the 1st of January 2004.

Romania 1998- Regional Development Act • the reduction of existing regional disparities
• the prevention of new regional imbalances;
• the correlation of regional development policies with the government’s sectoral development policies; and
• the stimulation of inter-regional co-operation, both internal and international, as one of the possible ways to contribute to economic development.
Cyprus In view of the size of the island and its partition, Cyprus does not have a regional policy as such. The government of the Republic has set up a National Development Plan administered by the Planning Bureau and an Island Plan administered by the Town and Country Planning Service. Both are aimed at the harmonious development of all areas of the island. However, since 1974, the planning documents have been limited to the southern part of the island.
New
Mem
ber
Stat
es (I
slan
d Ec
onom
ies)
Malta The Development Planning Act (Cap. 356) governs land-use. It requires the preparation of a twenty-year national Structure Plan and subsidiary plans including local plans, action plans and subject plans. The Structure Plan provides a strategic framework for spatial development in Malta and Gozo and sets down industrial, residential and rural policies and also includes policies in relation to tourism development, heritage protection, social and community facilities and transport infrastructure.
The Planning Authority is currently in the process of undertaking a review of the Structure Plan. The new Structure Plan will draw upon the European Spatial Development Perspective and take account of the fundamental role of European policy in this respect.
Norway The present government presented their regional and district policy to the Parliament on 30 April 2002.
2001 White Paper on Regional Policy proposed to transfer greater spending powers to the county
• Establish frameworks that are sufficient that activity, capital, and labour will remain in Norway and to attract foreign investments.
• Focus more on regions and centres that have growth potential. The government wants to strengthen growth where it exists and at the same time ensure the basis for good living conditions in all parts of the country.
• Prioritise instruments that can contribute to strengthening the ability for innovation and new establishments in all parts of the country with an emphasis on reaching potential entrepreneurs and innovators.
• Delegate and decentralise more responsibilities and more tasks to regional and local level.
Non
-EU
Sta
tes
Switzerland 2003 - Strategy for Swiss regional policy • Strong centres and agglomerations that function as motors of development for the whole of Switzerland
• Dynamic rural and peripheral regions, that are able to profit from the impulses generated from the centre, oriented towards the broader spatial economy and able to generate added value
• Exploitation of potentials to create regional added value through innovation and a culture of enterprise.
• The incorporation of sustainable development principles
Source: European Policies Research Centre, University of Strathclyde

57
7.4 Policy Instruments Regional policy comprises of a range of instruments. The most widely utilised are:
• regional incentives (investment related support to firms)
• support for the business environment (framework measures)
• infrastructure provision
• planning instruments/development of regional strategies82
As Table 7-4 shows, national regional policy instruments can be complementary to territorial development goals and objectives. This is very obviously the case with respect to the development of regional strategies. In addition, support for business development and infrastructure provision in lagging regions can help to promote more balanced development. Efficiency objectives can also be addressed through the development of strategies to promote competitiveness in all regions and through support for the development of infrastructure which links key growth poles.
Table 7-4: Policy Instruments and Territorial Goals
Policy Instrument
Spatial cohesion (equity)
regional incentives – support for lagging regions
support for the business environment – innovation and competitiveness for lagging regions
infrastructure provision – improved connectivity for lagging, peripheral, or rural regions
planning instruments/development of regional strategies – integrated programme of support measures for target regions
Spatial competition (efficiency)
support for the business environment – support for all regions to promote development and competitiveness
support for the business environment – support measures for growth poles
infrastructure provision – improved connectivity between urban centres
planning instruments/development of regional strategies – regional development strategies for all regions to promote endogenous development
Spatial integration infrastructure provision – improved cross border linkages
planning instruments /development of regional strategies – incorporation of cross border development objectives
Note: A detailed overview of regional policy instruments by country can be found in Summary Table 2 at the end of this section.
The types of policy instruments listed are used to varying extents in different countries. In the majority of the CEECs, regional incentives form a core component of regional policy. Bulgaria, the Czech Republic, Latvia, Lithuania, Romania, Slovakia and Slovenia all have, or propose, systems of regional incentives for private-sector firms. However, the specific types of incentive offered vary and are applied in various combinations. Amongst the available types of financial incentive are: soft loans, grants, guarantees for bank loans, credit
82 Yuill D and McMaster I (2001) Benchmarking Regional Policy in Europe: National Regional Policies, Report for
international conference 'Benchmarking Regional Policy in Europe', Forest Hills Hotel, Loch Ard, 9-12 September 2001.
58
incentives, depreciation allowances and subsidies. Where financial incentives are in place they are applied in one of two main ways, which differ in terms of the emphasis placed on equity or efficiency goals. First, the level of financial incentive granted can be regionally differentiated. For instance, in Estonia regionally differentiated credits are available. In the Czech case, standard economic and financial instruments are applied with greater intensity in certain areas or are regionally differentiated (efficiency). Second, particular financial incentives are targeted solely at designated areas. For instance, in Latvia the Regional Development Fund provides financial support for SMEs in ‘disadvantaged areas’ (equity).
Another form of regional policy instrument implemented in a number of countries consists of framework measures to improve business conditions in problem regions. As already mentioned, this form of assistance can include the provision of physical infrastructure, together with softer measures. Specific national policies and the types of measure employed vary between countries. For example, indirect action to promote framework measures is proposed in Bulgaria. One of the aims of national regional policy is to expand the capacity of local governments and authorities to promote development. More specific actions to improve the business environment include: business promotion centres operating at the county level (Estonia); support for business services, including incubator units and business parks (Hungary) and future measures to improve local and regional infrastructure and enhance access to vocational training (Romania). These types of measure are applied either to single regions (in the interests of boosting the development of lagging regions) or across all regions (to promote endogenous development). Frequently, the use of such instruments reflects a shift towards support for regional competitiveness through enhancing indigenous innovation capacity (e.g. in Estonia and Norway).
A lack of appropriate infrastructure, e.g. transport infrastructure and telecommunications networks, is also seen as a key area of economic weakness in many CEE regions. Switzerland and Norway also face particular physical barriers to the provision of balanced infrastructure networks. However, specific regional policy measures to develop infrastructure are not clearly expressed in many countries. Most often, only very general references are made to infrastructure development in national policy documents, e.g. national regional development strategies or national development plans. For instance, in their regional development guidelines, Lithuania and Estonia highlight the need to develop infrastructure and improve levels of connectivity. The current National Development Plans of Bulgaria, Latvia, and Slovakia also all have infrastructure development as one of their main programming objectives. However, these plans are more closely related to EU development programmes than national regional policy; as such, they have the potential to offer greater financial resources and support for large-scale infrastructure developments.
Combinations of national plans, national regional development strategies, regional development strategies and district plans are either in operation, or are being developed in each of the countries covered in this study. For instance, regional development policy in Poland is increasingly perceived from a strategic, long- or medium-term reform perspective, rather than as a series of one-time annual initiatives. The country has developed a National Strategy for Regional Development, which forms the basis of regional policy. Similar roles are fulfilled by Bulgaria’s National Programme for Regional Development, the Estonian Regional Development Strategy and the National Regional Development Concept in Hungary. In Cyprus, the Town and Country Planning Law provides for four main instruments for formulating, monitoring and implementing urban and regional planning, namely the Island Plan, Local Plans, Area Schemes and the Statement of Policy for the Countryside. A national, Strategic Development Plan (1999-2003) is the basis for the development of more local action plans. All of these plans offer the potential to deliver more integrated, coherent policy instruments. When developed by, or in consultation with the regions, they also have the potential to address the specific development needs of individual regions, taking into account their development potentials and bottlenecks.
The influence of EU approaches to programming and integrated regional policy actions means that national regional policy in the new Member States and the Candidate Countries has become increasingly compatible with the Structural Funds and pre-accession aids. In fact, in a number of countries, national regional policy feeds directly into EU regional policy and visa versa. For example, in the Czech Republic, regional development strategies, which relate to national regional policy, were used as the basis for inputs into the Joint Regional

59
Operational Programme, which will be utilised for the disbursement of Structural Funds. On the other hand, EU Structural Funds may be used, in order to resource national policy instruments, e.g. though co-financing arrangements.
Whilst there are a number of useful parallels between national regional policy, EU Funds and territorial development, it should also be noted that national regional policy instruments may also conflict with EU policy instruments and territorial development goals. For instance, there are a number of potential areas of ‘conflict’ between national regional policy and EU policy approaches. A number of the schemes currently on offer may have to be phased out, or be heavily modified, as they fail to comply with current State aid regulations. The European Commission has already judged a number of tax incentives schemes and ‘special economic zones’ in Poland to be ‘harmful’ to the EU internal market.83
In addition, the regulations governing national policy instruments and EU programmes frequently differ. They are based on different timescales, are targeted differently and involve separate implementation frameworks. Uncoordinated national and EU regional policy could run the risk of a duplication of efforts. Alternatively, variable approaches could mean that regions could suffer from over exposure to uncoordinated policy measures. It is even the case that national regional policy instruments themselves may clash, or at least fail to support one another. In Hungary, the poor co-ordination of resources has been a significant factor constraining the practical impact of a number of schemes. In order to implement a project, applicants often have to receive funds from a variety of sources; lack of funds from one source of support can jeopardise the implementation of the whole project.84
Lack of funding for policy instruments is an obvious constraint on the extent to which they may impact positively on territorial development. Limited absorption capacity for both EU funds and national regional policy is another. In the lead up to EU enlargement, concerns have been raised in relation to the ability of the new Member States to appropriately use all the money available to them. Similar concerns have been expressed about national regional policy instruments. In Hungary, considerable sums linked to regional policy support cannot be utilised in practice and remain in the budget each year. In other cases, awareness of national regional policy instruments is not necessarily high and regional policy instruments are not used to their best effect or do not reach suitable end-beneficiaries. In conditions where there are limitations to both national regional policy resources and the capacity to use those resources, involvement in EU programmes adds an additional level of complexity. Moreover, EU co-financing commitments has the potential to divert scarce regional policy resources away from the national policy instruments, which were established by national governments in repose to local, regional and national pressures. Alternatively, national resources could be more usefully diverted to co-financing.
The preceding points suggest that the relationship between EU funding approaches and national policy instruments are not necessarily clear-cut and complementary. For a number of reasons, the same can be said for the link between national policy instruments and territorial objectives and goals. First, the scale of regional disparities, especially in the CEECs, is immense relative to the resources allocated to regional policy instruments. Consequently, the actual impact of policy may not have a pronounced impact on territorial development. In Poland, in the early 1990s, the lack of public funds was a limiting factor for regional development support by the State, to such an extent that it was little more than a ‘token’ policy. In fact, in a number of countries policy 'instruments' still have no resources attached, e.g. regional development strategies in the Czech Republic.85
With the exception of framework measures and regional development strategies, policy instruments are often narrowly focused. They do not directly aim at 'mobilising regional
83 Financial Times, (2003) New Members’ Tax Rules ‘Harmful’ to EU, Financial Times 21 July.
84 Recognition of this problem has led to efforts to achieve better coordination between sectoral budgets, which could have an important impact on regional economic development. For instance, Hungary’s Integrated Regional Programme (IRP) provides financial resources for infrastructure and social investments and comprises around 20 percent of the ‘expenditures for development’ envelope of the state budget.
85 A notable exception is Hungary: The growth in the amount of regional development resources is considerable, Hungary spends 0.42% of its GDP on regional development purposes.

60
potentials and bottlenecks' but instead offer, for example, tax incentives to mobile capital. There are also broad elements of territorial development that are not commonly targeted by national policy instruments, e.g. cross-border co-operation. The sectoral emphasis of a large number of policy instruments and lack of regional input also appears to undermine the sensitivity of policy instruments to specific, regional potentials and bottlenecks. In the CEECs, ‘reactive’ policies remain in place. These are, frequently, uncoordinated measures developed by central ministries for areas with particularly serious economic problems. In these cases, isolated policy instruments are simply used as a way for government to be seen as 'doing something', as opposed to programmes of support developed in consultation with regions, and in response to their perceived needs. For instance, in Hungary, the lack of approved regional development programmes and the availability of only short term funding means that the support available does not always fit the real problems of the regions – and this despite the availability of regional development funding. In the longer term, a challenge for the new Member States and the Candidate Countries is implementing a switch from short-term ‘low-road’ to longer-term, coherent ‘high-road’ strategies of competitiveness. For example, the current emphasis of state policy for inward investors could refocus from traditional investment incentives, firstly, to after care programmes aiming at maximising positive effects of existing foreign investments and, secondly, at improving their structure towards industrial branches with higher added value and with more sophisticated production requiring high-quality human capital.

Table 7-5: Summary Indicative Regional Policy Instruments86
Status Country Type Regional Policy Instrument
Czech Republic
Regional Incentives
Framework
Measures/Infrastructure
Development Strategies
Targeted financial support for industrial enterprises; SME development; and entrepreneurship
Support for redevelopment and construction of technical infrastructure in designated areas.
Support for redevelopment and construction of technical infrastructure in the former military bases
National Development Plan, Regional Development Strategies
Estonia Regional Incentives
Framework Measures
Infrastructure Support
Development Strategies
Regional Development Fund with the ability to provide regionally differentiated credits; regional tax relief, corporate tax reductions
Business promotion centres in counties, regional development zone status. support for new entrepreneurs and SMEs.
Local public transport and communications subsidies.
National Development Plan, Estonian Regional Development Strategy , 7 Regional Development Programmes
Hungary Regional Incentives
Framework Measures
Infrastructure Support
Development Strategies
Targeted Decentralised Assistance: tax relief for longer term investments
Support for business services (including incubator and innovation parks).
Integrated regional programme (IRP) provides financial resources for infrastructure
National Development Plan, National Regional Development Concept, Regional Development Plans
Latvia Regional Incentives
Framework Measures
Development Strategies
Tax incentives and support for SMEs. Incentives include. Two free ports
Support for SMEs in disadvantaged regions Improve business environment of economic zones
National Development Plan; District Development Plans
Lithuania Regional Incentives
Framework Measures
Development Strategies
Free economic zones
Future national regional policy is to be implemented by giving assistance to enterprises and by regulating local government revenue.
National Development Plan Cen
tral
Eas
t Eur
opea
n N
ew M
embe
r Sta
tes
Poland Regional Incentives
Framework Measures
Development Strategies
Grants, which are channelled to beneficiaries through the voivods.
Support for the development of entrepreneurship, economic competitiveness and innovation; environmental, education and cultural programmes.
National Development Plan, National Strategy for Regional Development,Voivodships carry out their own policy of regional development and have their own strategies of regional development.
86 Information accurate for 2001

Slovakia Regional Incentives
Framework Measures
Development Strategies
Support to structurally disadvantaged and economically weak regions:
State support for the development of services for regional development; support for the development of new technologies
National Regional Development Plan Regional Development Concepts Slovenia Regional Incentives
Framework Measures/Infrastructure Investment
Development Strategies
Soft loans and guarantees for bank loans for productive investment by SMEs and small agricultural businesses
Local infrastructure investment
National Development Plan
Bulgaria Regional Incentives
Framework Measures
Development Strategies
Investment subsidies, direct investment, preferential state and local charges, financial guarantees, transfer of physical infrastructure resources
Structures that support local business activity e.g. regional development agencies, business incubators etc.
Regional Development; District Plans for Regional Development
Cen
tral
Eas
t Eu
rope
an C
andi
date
C
ount
ries
Romania Regional Incentives
Framework Measures/Infrastructure Investment
Exemption from customs duties, exemption for tax on profit
Future measures to support regional development improvements to local and regional infrastructure, improved access to vocational training
National Development Plan, Range of planning instruments including national and regional strategies.
Malta Regional Incentives
Development Strategies
Grants for Gozo based companies to cover the costs of transport of raw material and equipment between Malta and Gozo
Grants for approved training programmes
National Development Plan, and Planning Documents for Malta and Gozo
New
Mem
ber S
tate
s (Is
land
Eco
nom
ies)
Cyprus Incentives (national)
Framework Measures
Development Strategies
Grants, loans, tax allowances, loan guarantees, though gradual shift in emphasis towards aid supporting SMEs, technology, research and development.
Industrial Free zones
National Development Plan
Non
-EU
St
ates
Norway Regional Incentive
Framework Measures
Infrastructure
Regional selective support to businesses, Support for ‘Action Zones’, investment grant, regional risk loan is one of a number of loans with a specifically regional development purpose
Cluster development
Transport aid scheme for businesses - partial refund on goods transported to and from enterprises.
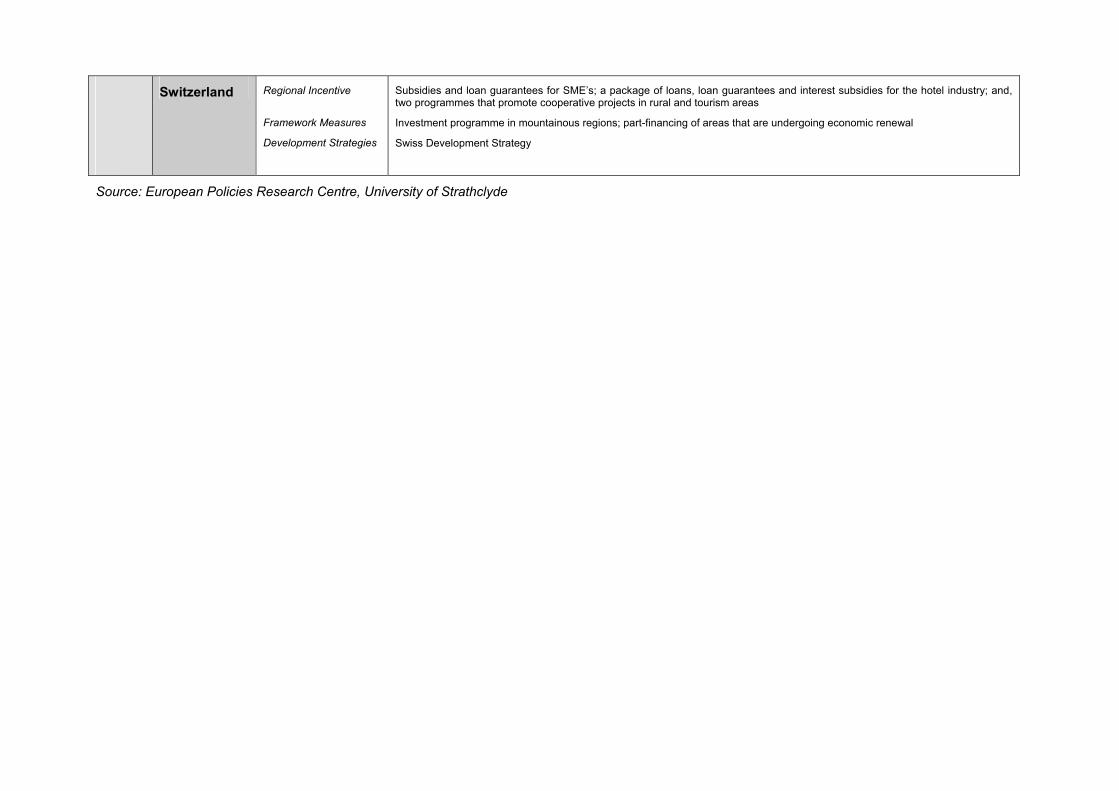
Switzerland Regional Incentive
Framework Measures
Development Strategies
Subsidies and loan guarantees for SME’s; a package of loans, loan guarantees and interest subsidies for the hotel industry; and, two programmes that promote cooperative projects in rural and tourism areas
Investment programme in mountainous regions; part-financing of areas that are undergoing economic renewal
Swiss Development Strategy
Source: European Policies Research Centre, University of Strathclyde

64
7.5 Spatial Targeting In each country some form of area designation procedure has been used either to identify the eligibility of areas for support programmes or to determine financial allocations to regions. The main territorial development objective to be addressed through the targeting of regional support is spatial cohesion. Designation of structurally weak regions, economically lagging areas or regions with particular physical characteristics (e.g. mountainous, island or peripheral areas) reflects a clear emphasis on reducing social and economic disparities between regions (see Table 7-6).
Table 7-6: Spatial Targeting
Spatial Targeting
Spatial cohesion (equity) Bulgaria, Czech Republic, Estonia, Hungary, Latvia, Lithuania, Malta, Poland, Slovakia
Spatial competition (efficiency)
Bulgaria (growth districts), Hungary, Latvia
Spatial integration
Note: A detailed overview of spatial targeting by country can be found in Summary Table 3 at the end of this section.
Formal area designations reflecting the territorial objectives of spatial competition and spatial integration are less common, though there is an emerging emphasis on wider territorial development policies. According to the National Strategy for Regional Development of Poland, ‘the aims of the state’s regional development policy are formulated from an all-Poland perspective’. This is, in part, based on the recognition that the main challenge for regional policy is development in all regions. In Hungary, between 1991–1996 regional development support focused on the least developed areas, the North Great Plain and North Hungary. More recently, the Act on Regional Development and Physical Planning brought fundamental changes in the spatial breakdown of the regional development support. With the exception of Budapest, all regions of Hungary are now eligible for regional development support. Reflecting the difficult balance in terms of equity and efficiency aims, an interesting feature of area designation is the scope to include ‘growth districts’ as priorities for regional development policies. This approach is formalised, for example, in the Bulgarian system in respect of areas where municipal income exceeds respectively five times and 1.5 times the national average.
The objective of spatial integration is not widely referred to. The emphasis within area designation systems is on targeting support on regions rather than supporting development between regions or countries. Having said that, improved integration between target regions and their surroundings is likely to be one of the spin-off effects of regional aid. For instance, specific regions may be eligible for tax-incentives to attract FDI or infrastructure support to promote transnational linkages.
Especially in the new Member States and Candidate Countries, external influences on policy have been strong, particularly to bring designation systems into line with European Commission priorities and principles in preparation for future Structural Funds receipts. The influence of the EU is already evident, particularly in encouraging countries to adopt area designation systems that reflect the EU approach to Structural Fund eligibility. However, it is interesting to note that national governments have also developed their own maps, using distinct area designation criteria, to guide the spatial targeting of policy instruments (see Figure 7-1 to 7-3). These maps tend to identify smaller target regions than the NUTS II level used by the Commission.

65
Figure 7-1: Slovenia Development Aid Areas
Figure 7-2: Area Designation Map for the Czech Republic
Source: Ministry for Regional Development of the Czech Republic

66
Figure 7-3 : Czech Regions with Concentrated Support
Source: Ministry for Regional Development of the Czech Republic
As with the discussion of the preceding components of national regional policy, there is separation as well as synergies between forms of spatial targeting and wider policy aspects. First, as previously mentioned, the current spatial targeting of support does not fit with all territorial development objectives. Generally, it focuses on support to lagging regions and equity objectives as opposed to efficiency and integration.
Second, area designations for national and EU regional policy do not necessarily match. Regularly, national regional policies are based on much smaller territorial units, e.g. NUTS III and IV, whilst EU regional policy uses the NUTS II level. EU area designation criteria also differ in that they require EU-wide regional data – in effect, GDP per head and unemployment. However, their availability does not mean they are the best indicators to use, especially as the phenomenon of ‘hidden unemployment’ remains a major problem in many CEECs. National governments have the potential to access a wider range of more appropriate data and, in doing so, are able to be more responsive to dynamic economic conditions. That said, at the national level, there is perhaps more potential for “political” criteria to drive area designation decisions, which could lead to bias. For instance, regions with strong industrial lobby groups could benefit at the expense of rural regions.
EU area designations are also made on a longer-term basis involving fixed ceilings of support. In the context of on going economic restructuring and adaptations linked to enlargement in CEE, a national designation system which allows regions to quickly exploit any emerging potentials and address development bottlenecks could be extremely advantageous. As a result, tensions may arise between the long-term and more broad brush approach of EU area designation and the need for short-term flexibility and narrowly-defined target areas. This potential problem is somewhat lessened by the fact that almost all regions in the new CEE Member States will be eligible for Objective 1 funding. However, Prague and Bratislava, two key centres of economic growth in their respective countries, will not be eligible for support.

Table 7-7: Summary Spatial Targeting
Status Country Areas Benefiting from Targeted Regional Assistance
Czech Republic • regions with structural problems
• economically weak regions
• rural areas
• other regions - for example border regions, former military areas, regions affected by natural disasters, regions with a highly disturbed or damaged environment
Estonia • agriculture dependent regions;
• industrial regions undergoing restructuring, and
• isolated regions
Hungary • industrial regions
• rural-agricultural regions
Latvia • Economically weak
• Less favoured territories
Lithuania • Unemployment level in a region is significantly higher than the country’s average; and/or
• Living conditions in a region are significantly worse than in other regions of the country.
Poland • Northern and Eastern regions facing barriers to the utilisation of the endogenic development potential
• Regions with underdeveloped or worn down metropolitan functions
• Regions with low levels of development, weak industrial structures and restructuring agricultural areas.
• Also state support for special economic zones.
Slovakia • Economically weak regions that on the basis of economic and social development indicators
• Regions with an adverse structure
Cen
tral
Eas
t Eur
opea
n N
ew M
embe
r sta
tes
Slovenia • Regions where per-capita GDP deviates by more than 20 % of national average
• Areas with special development problems: economically weak, de-populating areas, industrial areas with structural problems and high unemployment and border areas and other areas with limited development potential.

Bulgaria • Growth districts and development districts
• Underdeveloped rural areas
• Regions of industrial decline high annual unemployment.
• Border Areas
• Mountainous areas
• Areas of high unemployment
Cen
tral
Eas
t Eur
opea
n C
andi
date
C
ount
ries
Romania • mono-industrial productive structures
• mining zones
• the occurrence of collective dismissals, which affect more than 25 per cent of employees living in the area;
• an unemployment rate which is greater than 25 per cent of the national unemployment rate; and
• a lack of means of communication and a poor infrastructure.
Cyprus • The Town and Country Planning Law (No. 90/72) of 1972, as amended and entered into force in 1990, provides four main instruments for formulating, monitoring and implementing urban and regional planning, namely the Island Plan, Local Plans, Area Schemes and Statement of Policy for the Countryside. Is
land
Ec
onom
ies
Malta • The Island of Gozo
Norway • Northern, peripheral areas, Finnmark and North Troms
• Nord-Trøndelag counties, and several municipalities in Sør-Trøndelag, Møre og Romsdal and Sogn og Fjordane counties as well as the northernmost municipalities of Hedmark and Oppland counties.
Non
-EU
St
ates
Switzerland • Investment Aid for Mountain Regions
• Areas Undergoing Economic Renewal
Source: European Policies Research Centre, University of Strathclyde

69
7.6 Institutional Arrangements Throughout the new Member States and Candidate Countries, important changes have been made to territorial administrative structures and the relative division of powers between levels of government.87 These institutional reforms have had a direct impact on the way regional/spatial development policies are formulated and implemented. New approaches emphasise the delegation of political and economic power to sub-national levels so that regions can steer spatial development within their own territories and so develop competitive advantages to deal with the pressures of an increasingly globalised environment.
In the CEECs, the implementation of EU pre-accession financial aid instruments, as well as preparations for the receipt of Structural and Cohesion Funds, has exerted an additional influence on the institutional frameworks for regional policy. An overview of the main national and sub-national institutions involved in national and European regional policy is provided in Summary Table 4 (at the end of this section). Although institutional frameworks for the development and implementation of regional policy vary, certain common elements and themes are emerging, most notably a new role for central government and a degree of regionalisation.
In many of the CEECs, central-level ministries tended to be organised along sectoral lines during most of the 1990s. Some regional responsibilities were divided between ministries, but regional policy interventions were generally ad hoc and uncoordinated. Now, as Summary Table 4 demonstrates, responsibility for the elaboration and implementation of regional development programmes has, in most instances, been allocated to a single central government department. National ministries and agencies are also increasingly acting as coordinators and partners in regional development, setting down the framework or guidelines and overseeing the coordination mechanisms within which the regional level can formulate and implement policy. Almost all of these countries have established inter-ministerial institutions with the aim of increasing levels of cooperation and consistency in regional policy. For example, Hungary has the National Council for Regional Development to prepare regional policy decisions and coordinate activities between national ministries, national economic chambers, national-local government partnerships, foundations and academic organisations.
Several countries have also established separate organisations to support the design and implementation of regional policy. The specific competences of these bodies differ between countries. Some institutions were established merely as support services, while others play a more active role in policy implementation. The Czech Centre for Regional Development was established as the main implementing agency for PHARE regional development programmes, but also plays a wider role by offering objective and methodological support for the actions of regional development agencies. The Estonian Regional Development Agency plays a more active policy implementation role. The Agency was established to work on behalf of government ministries with regional development interests, counties, local governments and business associations. The Agency manages regional policy activities, such as the administration of regional development programmes and regional incentives, and also provides technical support to regional development institutions. Thus, the last few years have witnessed a marked shift toward a more coherent and co-ordinated approach by those central institutions involved in regional policy.
However, there are some caveats to these positive trends. First, the institutional framework for regional policy at central level can be very unstable. The allocation of ministerial responsibility for regional policy is often subject to significant political factors. For instance, in Poland the decision to transfer regional co-ordination duties from the Ministry of Economy to a new dedicated Ministry for Regional Development in 2000 was reversed by a new coalition government in 2001. Second, new co-ordination mechanisms for regional policy at the central government level are only beginning to address entrenched norms and attitudes. Ministries
87 Gorzelak G. (1996) The Regional Dimension of Transformation in Central Europe, Jessica Kingsley; Blažek J.
(1999) Regional Development and Regional Policy in CEECs in the Perspective of EU Enlargement, in Hampl M. (ed) Geography of Societal Transformation in the Czech Republic, Charles University.

70
continue to play separate roles in the regional policy field, operating their own ‘regional policies’ with their own budgets, programmes, regional offices or agencies. In some cases, sectoral ministries have remained resistant the idea of their activities being co-ordinated within a broader regional policy framework. In the past, the regional administrative tier tended to be weak or non-existent in many of these countries, but the situation is changing. Increasingly dense networks of sub-national bodies are emerging to participate in regional policy. Despite some diversity, the development of these new modes of regional policy governance has produced common, basic elements in the new regional institutional architecture. These are now discussed briefly in turn.
(i) Regional Development Agencies (RDAs)
In many CEECs, RDAs were among the first regional-level institutions to become involved in the policy process. RDAs are usually non-profit organisations and their key activities can include: the development of their regions through regional operational programmes and development projects; providing support for the entry of foreign investment into regions; and assistance in the promotion of entrepreneurship and industrial parks. RDAs play a variety of roles in different national contexts. Where sub-national administrative tiers are weak, RDAs may be used as a precursor to or substitute for regional administrative units. In Slovenia, for example, sub-national authorities have had little significant involvement to date in the design or administration of regional policy. In other cases, RDAs have more limited roles. Bulgarian RDAs, for instance, focus primarily on the development of SMEs and private enterprise. In fact, the wide range of RDA activities, coupled with the emergence of new regional institutional frameworks, has created some uncertainty about their precise functions and institutional relationships.88 For instance, the activities of Romania’s RDAs have been hampered by a lack of clarity in their relationship with government bodies, their lack of resources and their ambiguous legal status.
(ii) Planning Regions
New planning regions have been established in several CEECs to comply with European Commission criteria for NUTS II or III levels. These new regions have been created for the purposes of regional development planning and statistical analysis, providing wider coverage than the district or local levels. The creation of planning regions is often accompanied by the setting of coordination mechanisms to promote the participation of lower administrative tiers in the identification of regional development priorities. For example, in Hungary, Regional Development Councils at the planning region level may include representatives of counties or municipalities in their membership.
(iii) Deconcentrated Units
In many CEECs, recent reforms have bolstered the role of the regional level in policy-making by delegating competences downwards from the centre. These new “deconcentrated” institutions often serve to coordinate regional policy plans emerging from the local level with national strategies. For instance, at the regional level in Hungary, decentralised state administrations, subordinate to higher administrative levels, exercise their powers independently of the county and municipal authorities. In Bulgaria and Lithuania, too, sub-national levels are administrative units of the central state. Districts have the main responsibility for carrying out regional policy and the task of achieving balance between national and local interests rests with the District Governor.
(iv) Associations of Municipalities
Recent reforms have bolstered the role of the regional level by aggregating power upwards from traditionally strong locally-elected representatives. For example, in the Baltic States, local level county and district authorities are increasingly involved in regional policy delivery through cooperative mechanisms. In Latvia, legislation has strengthened local autonomy and encouraged local governments to improve cooperation with neighbouring territorial units. New institutions, based on the upward aggregation of local power, have created a platform for the
88 Agencje Rozwoju Regionalnego w Polsce: Raport, National Association of Regional Development Agencies,
Warsaw 2003 p1 (see http://www.narda.org.pl/raport_pol/rap_wst.htm)

71
distribution of funding and an intermediate planning tier. Of the possible intervention levels of spatial development, the micro-regional level has become – through the bottom-up co-operation of local governments – an important element of regional policy.
(iv) Self-governing Regions.
In the Czech Republic, Poland and Slovakia, recent reforms have created self-governing regions. These have facilitated greater levels of local/regional level participation in regional policy implementation and development. For instance, in Poland, new regional self-governments are responsible for agreeing ‘contracts’ with the centre. On the basis of such agreements, they then develop and administer their own Regional Development Strategies and Programmes and Plans of Spatial Development (Regional Plans).
However, boosting the role of regional self-governments as a partner of the centre in steering regional development is proving difficult in practice. A major obstacle is the continued centralisation of public finances: regional units of self-government often remain dependent on the centre for subsidies, grants and shares in national taxes. In Poland, the dominant position of the centre over the regions in terms of finance has undermined the validity of the ‘region-centre contracts’ as a symbol of a new, decentralised approach to regional policy-making. The fact that a large proportion of the finances provided for regional projects are central subsidies means that, in effect, central government determines how much is allocated and how it should be used. In Slovakia, regions are also dependent on financial transfers from the State budget, which is often unable to respond to specific regional conditions.89
So far, the main focus of this discussion has been on the course of developments within the CEECs. However, it is also important to consider the distinct position of Switzerland and Norway and, to an extent, Cyprus and Malta. The federal structure of Switzerland means that the cantons play a particularly influential role in regional policy. Levels of decentralisation are not as pronounced in the other three countries but decentralisation is on the increase. Even in Malta, the need to decentralise certain development actions to the local level has been recognised in order to ensure that local needs and expectations are properly addressed. The Ministry for Gozo has regional co-ordination responsibilities for Government programmes and projects on the island. The government will support the implementation of locally based integration action plans which should focus on co-ordinating activities that target local needs and provide support and linkages across a range of policy areas.90
In summary, the last few years have witnessed a marked shift towards a more coherent and co-ordinated approach to regional policy based on more regional-level interventions though the true extent of the regionalisation process remains unclear. Certainly at the central level, efforts have been made to clarify and coordinate ministerial responsibilities for regional policy and provide the necessary institutional support for policy formulation and implementation. However, the powers of sectoral ministries remain strong in most countries. At the regional level, ifferent approaches to organising regional-level participation in policy-making are apparent. In some countries, the regional tier is being institutionalised as: the location of regional development tasks and agencies; an operational level for deconcentrated state administrations; and the base for self-governing units with elected bodies. On the other hand, the fact that regional development finance is very often centrally determined can undermine the development role of the regional level.
The direct impact of these various changes on territorial development is not as easily traced as for the preceding policy elements. However, it is possible to identify some important associated impacts (see Table 5).
The influence of the European Commission has been apparent in the institutional and programming changes that have occurred recently in the field of regional policy in the CEECs. The impact of the Commission on domestic regional policies has been widely acknowledged by commentators.91 Generally speaking, progress in meeting the Commission’s accession
89 Benc, V. (2003) ‘Readiness of the Slovak Republic for EU Regional Policy’, paper presented at the conference
‘Readiness of the Candidate Countries for the EU Regional Policy’ Bratislava 3-5/11/03, p187.
90 http://www.ndp.gov.mt/sectoral.html
91 See, for instance, Benc, V. op. cit. p185.

72
conditions in the area of regional policy has not just facilitated the distribution of European funding but furthered the development of new territorial structures of local and regional administration. The principles of partnership, programming and subsidiarity support the right of regions to contribute to regional development strategies and operational programmes and give regional bodies a more strategic role than they had before.
Table 7-8: Institutional Arrangements
Institutional Arrangements
Spatial cohesion (equity) Greater regional participation could give weaker, lagging regions a stronger ‘voice’ in development debates.
Spatial competition (efficiency)
Regional development actors in all regions can act on their own behalf
Regional potentials and bottlenecks for development can be identified by regions for regions.
Spatial integration Greater integration of regional institutions and actors into national, transnational and EU development debates and fora
Note: A detailed overview of institutional arrangements by country can be found in Summary Table 4 at the end of this section.
Commission influence has, however, not been uniform; its impact has been modified by the specific features of national systems, including the existing distribution of competences between national and sub-national levels. In some countries, such as Poland, preparations for the implementation of Structural Funds have run in parallel with domestic regionalising reforms. EU programmes are administered using established domestic regional policy resource allocation routes, policy decision-making channels and institutions. In other countries, the implementation of Structural Funds has stimulated the creation of specific frameworks and institutions that help fill an institutional void at the regional level, provide practical experience in the design and steering of regional development programmes and encourage a multi-level perspective to the coordination of regional policy.
Paradoxically, the administration of the Structural Funds can also contribute to the continuing dominance of the centre over the regional tier. EU funding is negotiated between the European Commission and central governments and is associated with the spending of national ministries. Thus, by controlling the implementation of EU regional programmes and the flow of funding, national governments can further their own development agendas at the expense of regional interests.92 The Commission’s PHARE 2000 Review accepts this practice, stating that national ministries or agencies rather than regional structures can implement regional programmes ‘if more appropriate’.
92 See, for instance, Bache, I. (1999) ‘The extended gatekeeper: central government and the implementation of EC
regional policy in the UK’ Journal of European Public Policy 6(1).
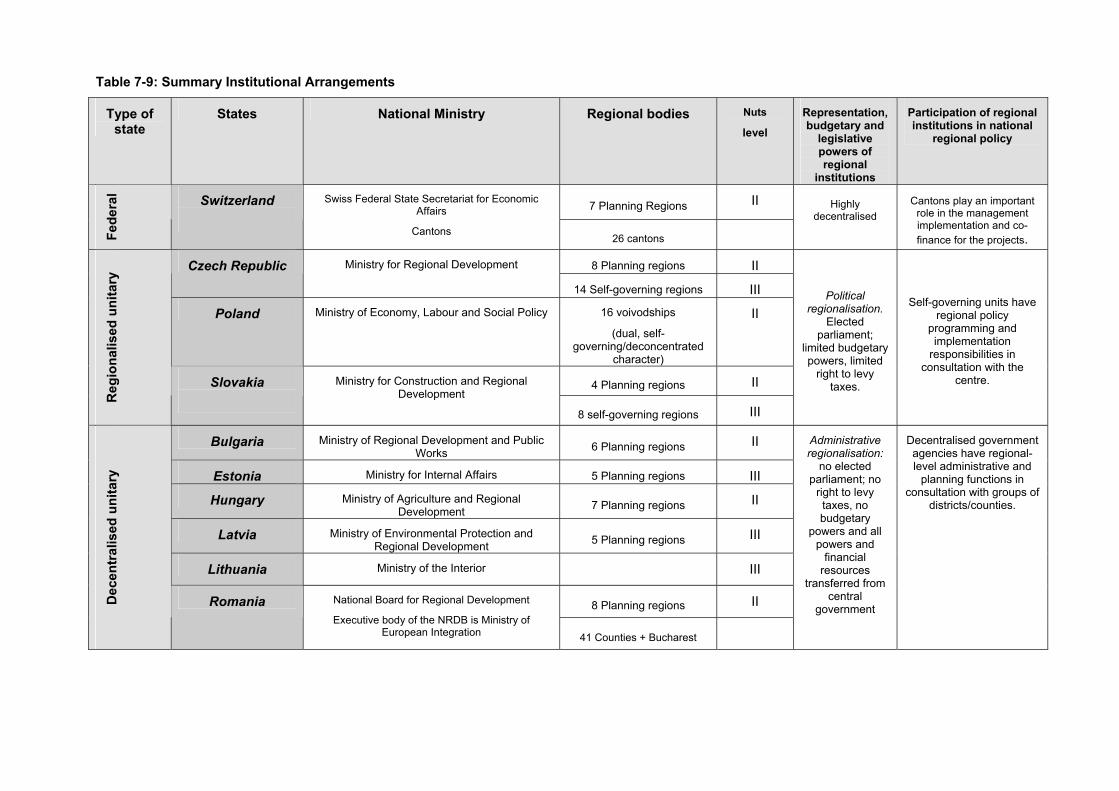
Table 7-9: Summary Institutional Arrangements
Type of state
States National Ministry Regional bodies Nuts
level
Representation, budgetary and
legislative powers of regional
institutions
Participation of regional institutions in national
regional policy
7 Planning Regions II
Fede
ral Switzerland
Swiss Federal State Secretariat for Economic Affairs
Cantons 26 cantons
Highly decentralised
Cantons play an important role in the management implementation and co-finance for the projects.
8 Planning regions II Czech Republic Ministry for Regional Development
14 Self-governing regions III
Poland Ministry of Economy, Labour and Social Policy 16 voivodships
(dual, self-governing/deconcentrated
character)
II
4 Planning regions II
Reg
iona
lised
uni
tary
Slovakia
Ministry for Construction and Regional Development
8 self-governing regions III
Political regionalisation.
Elected parliament;
limited budgetary powers, limited
right to levy taxes.
Self-governing units have regional policy
programming and implementation
responsibilities in consultation with the
centre.
Bulgaria Ministry of Regional Development and Public Works 6 Planning regions II
Estonia Ministry for Internal Affairs 5 Planning regions III
Hungary Ministry of Agriculture and Regional Development 7 Planning regions II
Latvia Ministry of Environmental Protection and Regional Development 5 Planning regions III
Lithuania Ministry of the Interior III
8 Planning regions II Dec
entr
alis
ed u
nita
ry
Romania National Board for Regional Development
Executive body of the NRDB is Ministry of European Integration 41 Counties + Bucharest
Administrative regionalisation:
no elected parliament; no
right to levy taxes, no budgetary
powers and all powers and
financial resources
transferred from central
government
Decentralised government agencies have regional-level administrative and
planning functions in consultation with groups of
districts/counties.
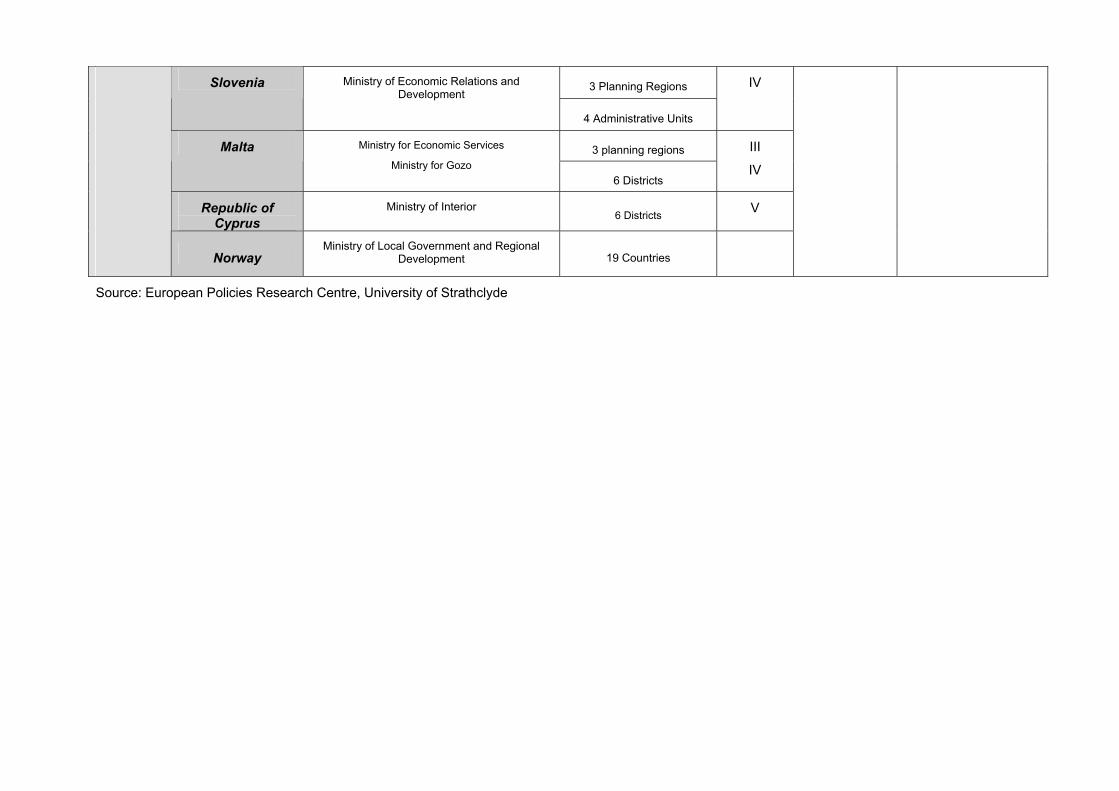
3 Planning Regions Slovenia Ministry of Economic Relations and Development
4 Administrative Units
IV
3 planning regions Malta Ministry for Economic Services
Ministry for Gozo 6 Districts
III
IV
Republic of Cyprus
Ministry of Interior 6 Districts V
Norway Ministry of Local Government and Regional
Development 19 Countries
Source: European Policies Research Centre, University of Strathclyde

75
7.7 Conclusions and Policy Recommendations As the preceding sections have demonstrated, national regional policy covers a wide variety of actions and is implemented for a range of reasons. All the countries in this study have some form of regional policy in place. Switzerland and Norway have a long tradition of policies aimed at supporting lagging regions. Cyprus and Malta also have programmes of support in order to promote more balanced development. In the CEECs, considerable progress has been made towards the development of modern, national regional policies. However, a number of persistent difficulties remain in this policy field. First, and most crucially, there are only limited financial resources allocated to regional policy. Second, EU regional development policy has tended to dominate regional policy debates, activities and resources. And third, the lack of co-ordination between government ministries and levels of governance is a recurring problem.
National Regional Policy and Territorial Development Goals
It is possible to draw a number of conclusions regarding the link between territorial development objectives and national regional policy.
First, national regional policy relates in a range of ways to territorial development goals. Overall, the objectives addressed by national regional policy correspond to broad territorial development goals. Policy instruments, such as regional incentives, framework measures and infrastructure investment, link to the goals of spatial cohesion, balanced spatial competition and spatial integration.
Second, different elements of policy have the capacity to correspond to a greater or lesser degree to territorial development objectives. For instance, while policy objectives may appear to reflect a strong commitment to spatial cohesion, the resources allocated to regional policy instruments may suggest otherwise.
Third, as well as identifying components of national regional policy which may complement territorial development goals, it is possible to identify groups of countries where national regional policy approaches appear to be more, or less, consistent with territorial development themes and goals.
1. Slovenia, Estonia, Hungary have adopted regional policies that appear to correspond well with territorial development objectives.
2. Bulgaria and Romania appear to reflect territorial development objectives in their policy objectives, but whether this is translated into practice is more open to question.
3. Other new CEE Member States make up a distinct group. Here, national regional policy takes a ‘middle road’, by attempting to balance traditional approaches to support for lagging regions and the agendas of balanced regional development, endogenous growth and regional competitiveness.
4. In Cyprus, Malta, Switzerland and Norway distinct, national physical characteristics have shaped regional policy approaches. In Cyprus and Malta national regional policy is not a priority due to the size of the countries.
Fourth, national regional policies do not necessarily fit with all territorial development objectives. Even though, on paper, regional policy in the CEECs appears to have a strong commitment to regional equity, equity considerations tend to be subservient to the needs of national economic growth. In terms of policy, the challenge is to avoid jeopardising national efficiency by channelling resources to regions that have little prospect of competing, while retaining some policy orientation towards indigenous development in less-favoured areas.

76
National Regional Policy and the Structural Funds
National regional policy is a distinct policy area. On the other hand, there are clearly strong linkages between the Structural Funds and national policy priorities and approaches. There are overlaps and similarities in approach in terms of policy objectives, policy instruments, particularly the use of regional development strategies, and policy delivery.
Structural Funds and pre-accession aid have exerted a strong influence on national regional policy. In the case of the CEECs, EU Funds began to introduce new ways of thinking about regional policy in the mid-1990s. PHARE programmes included regional development initiatives and supported the development of institutions and agencies dedicated to regional development, e.g. PHARE pilot programmes were used to support the establishment of regional development agencies in the Czech Republic and Poland. More generally, reform of regional policy was pushed up the agenda as policy making in the CEECs became increasingly influenced by the requirements of EU accession and Structural Funds implementation. As accession began in earnest, it was apparent that the confused and still centralised system of regional policy formulation and delivery in many counties did not meet EU requirements. The demands of Chapter 21 of the acquis, referring to the creation of regional administrative units meeting the NUTS criteria, inter-ministerial co-ordination over regional policy, the development of regional institutional capacity and the embedding of the partnership principle were clearly not being fulfilled.
As the accession process has progressed, the influence of the European Commission has been very visible on the design of regional policies in the new Member States and Candidate Countries, with national legislation and policy objectives drafted with a view to satisfying the real or perceived requirements of the EU’s structural policies. In several countries (Czech Republic, Hungary and recent draft Slovenian policy proposals), regional policy legislation explicitly refers to the need for regional policy to be “compatible with the Structural Funds”. At the outset, the Hungarian National Concept, like similar documents elsewhere in the (then) Candidate Countries, gives prominence to regional policy being based on partnership and the programming principle, again reflecting Structural Funds concepts.
At the same time, important distinctions exist between EU and national policies (see Table 7-10). On one level, differences in approach appear to suggest the potential for conflict and tension. For example, national spatial targeting approaches and EU regional policy do not necessarily correspond. National regional policy instruments could also conflict with EU policy instruments and regulations. However, through their differing emphases, national regional policy and the Structural Funds also have the potential to complement one another. The Third Cohesion Report concludes that there is likely to be a complementarity between both policies rather than a conflict. For instance, one can be viewed as aimed at alleviating immediate social concerns, the other tackling more fundamental, longer term problems. If effective, the two together can ensure not only a more balanced distribution of both income and life chances across the regions but also a more territorially balanced economic development path for Member States and the Union as a whole.93
93 European Commission, (2004) Towards a new Cohesion for Europe: Convergence and Competitiveness and
Cooperation: Third Cohesion Report European Commission: Brussels

Table 7-10: EU Cohesion Policy and National Regional Policy Compared (excludes Switzerland and Norway)
EU Cohesion Policy National Regional Policy Remark
Policy Objectives
Integrity of approach
Economic and Social Cohesion
Integrated multi-sectoral approach
General objectives and a mix of practical tasks
Narrow interpretation of regional policy and lack of coordination with other policies
Development of regional and national development strategies have contributed towards the development of more strategic and integrated approaches.
Policy Instruments
Funding available
Size of projects
Regional Programmes
Wide spectrum of incentives
Substantial
Often large
Already third generation of programming documents
Limited spectrum of incentives used in any one country
Limited resources
Small projects prevailing
Until recently without programming documents now some countries (Czech Republic) ‘over programming’
Regional Development Acts in line with EU incentives
Spatial Targeting NUTS II Regions Area designation at a range of levels including NUTS III and IV
Institutional Arrangements
Implementation structure
Partnership
Management and Evaluation
Emphasis on regional participation and subsidiarity
Often distinct systems for EU funds
Strong tradition
Clear separation of management, monitoring and control function. Systematic attention paid to evaluation and pressure for further enhancement
Often sectoral and centralised
Either strongly sectoral and heavily centralised or plagued by instability and uncertainty
Weak Tradition
Weak tradition and problems with transparency and accountability
Substantial regional and institutional reforms
Note: Based on Blažek, J. (2001) Regional Development and Regional Policy in the Czech Republic: An Outline of the EU Enlargement Impacts. Informationen zur Raumentwicklung Heft 11 p.766

78
Policy Recommendations
In order to gain a more rounded view, it is important not just to consider how one policy area should adapt to meet the requirements of another. Instead it is more useful to consider how policies and frameworks could influence, learn and adapt to one another. Consequently, for the purposes of this report, it is important not only to draw lessons for the reform of Structural Funds but also to consider how national policies and territorial development frameworks could work together with EU Cohesion policy to promote more balanced territorial development throughout Europe.
The following policy recommendations are set out according to the three main policy areas under consideration, territorial development, national regional policy and EU Cohesion policy. The recommendations follow the same structure as the report, by considering broad policy debates, policy objectives, practical policy issues and institutional arrangements.
Territorial Development
• Territorial development objectives are the subject of on going debates surrounding their precise meaning, applicability, policy relevance and relation to existing policy priorities. For territorial development objectives and themes to be more effectively targeted by policy, the terminology involved, development objectives and relevance for existing policies should be more clearly established.
• Territorial development debates throw up some complex policy choices for national governments. For instance, economic arguments for a focus on polycentric development and the development of growth poles may not be supported by national political, social and cultural contexts. Targeting development resources in some regions at the expense of others has the potential to be politically contentious. Consequently, the political, social and cultural context of regions should be taken into account when developing policy recommendations. Additionally, focussing assistance only on economic hubs could have negative impacts on surrounding regions, e.g. through migration from poorer rural regions. The distinctive situation of the CEECs regions in terms of economic transition should also be taken into account. Supports offered should take account of the distinct challenges still facing restructuring regions facing the on going challenges of industrial restructuring and adaptation.
• Equity and efficiency debates pose particular challenges for the new Member States and Candidate Countries, which face the multiple challenges of growing regional disparities, underdeveloped national economies (relative to EU-15), and limited financial resources. In such countries, national development priorities may work against development in some of the lagging regions. An emphasis on balanced development at the EU level should not lose sight of the extreme problems faced by lagging regions in the new Member States.
• Spatial cohesion, balanced spatial competition and spatial integration all demand a cross-functional approach that ensures cooperation between sectoral policies at national, regional and local level. Efforts could be directed at developing capacity in institutional co-operation and co-ordination. This should be particularly the case in the CEECs which have long standing weaknesses in this area of policy.
National Regional Policy
• One of the big challenges facing the new Member States and the Candidate Countries is implementing a gradual switch from ‘low-road’ to ‘high-road’ strategies of competitiveness. For example, the current emphasis of state policy for inward investors could refocus from traditional investment incentives, firstly, to after care programmes aiming at maximising positive effects of existing foreign investments and, secondly, at

79
improving their structure towards industrial branches with higher added value and with more sophisticated production requiring high-quality human capital.
• There is the potential for national regional policy to place a greater emphasis on the objective of spatial integration, e.g. through network activities. An existing example is an initiative in the Czech Republic. Eight cities, the so-called ‘Czech Inspiration’, are cooperate the in the sphere of cultural and congress tourism.94
• In Central and Eastern Europe it seems likely that resource constraints and the particularly underdeveloped state of peripheral regions are going to ensure that considerable selectivity in national regional policy will have to apply in practice. Thus, at the same time as advocating the development of new initiatives, it is also important to consider rationalising existing ones in order to provide fewer, but more effective forms of support. There may even be an argument for reduced spending on national regional policy and a greater focus on the provision of Structural Funds co-financing, especially for the CEECs. The task of national regional policy should be to eliminate current constraints on the provision of support from the Structural Funds in the form of matching grants. Poorer regions are often faced with difficulties in providing sufficient financial resources to co-finance eligible projects. In such situations, national regional policy might provide, for example, a higher percentage of project co-finance in the most needy regions to allow local beneficiaries to draw support from the Structural Funds.95
• The reorientation of national policy towards EU cohesion policy would require a change in its time horizon from an emphasis on annual programmes to a multi-annual approach.96 It is also worth noting that national policy is also weak in terms of monitoring and evaluation provisions to ensure the efficient use of public resources. In order to promote, a more effective national policy, lessons could be drawn from the experience of the Structural Funds and pre-accession aid.
• Related, lessons drawn from Structural Fund experiences of partnership and programming could add value to national regional policy, which tends to be relatively centralised and sectorally oriented. More integrated, coherent programmes of support, developed and implemented in co-operation with a range of actors, have the potential to be more sensitive to actual development needs.
• It is clear that, after accession, some peripheral regions may require greater external support and input than others. At the same time, according to Gorzelak,
“ The traditionally strong economic agents, the public authorities, and mainly the nation states, now have withdrawn from direct intervention in the economic process and no longer act as direct investors, what deprives the less developed regions from one of their strongest chances for modernisation: direct public investment.”97
As Lovering observes,
“the role of the central state as an employer and investor in regions is being downplayed in new regional policy models. Putting the onus on regional administrations to increase ‘regional competitiveness’ is perceived to be over-simplified, neglecting a consideration of the potential consequences of increased
94 Blažek, J. (2001) Regional development and Regional Policy in the Czech Republic: An Outline of the EU
Enlargement Impacts. Informationen zur Raumentwicklung Heft 11, p760
95 Blažek, J. (2001)Regional development and Regional Policy in the Czech Republic: An Outline of the EU Enlargement Impacts. Informationen zur Raumentwicklung Heft 11 p. 764
96 Blažek, J. (2001) Regional development and Regional Policy in the Czech Republic: An Outline of the EU Enlargement Impacts. Informationen zur Raumentwicklung Heft 11
97 Gorzelak,G. (2001) Regional Development in Central Europe and European Integration, Informationen zur Raumentwicklung Heft 11, p744

80
competitiveness for regional labour forces and acting as a means for national government to abdicate responsibility for addressing the problems of lagging regions.98
• These points, combined with the particular regional development difficulties faced by the CEECs, could argue for redeveloping a strong central government role in regional development.
• Alternatively, increasing the proportion of financial resources for spatial development objectives under the direct control of the appropriate regional administrative body could allow for more accurate identification and targeting of regional potentials and bottlenecks. A more integrated regional/spatial policy requires the consolidation of a medium-level network of regional development institutions, the elaboration of and preparations for the implementation of programmes, as well as the smooth operation of central co-ordination and the determination of competencies related to the receipt of EU funds.
• In order to capitialise on the potential contributions of central government and local/regional output, measures should be put in place to improve co-ordination and communication between levels of governance.
Structural Funds
• If Structural Funds and pre-accession aid are to be more closely linked to territorial development objectives, there is a need to clarify the benefits involved and Commission expectations on these points. In the new Member State, the integration of horizontal objectives into programming documents has already proved challenging. Adequately reflecting territorial development goals adds another level of complexity to programme development and management.
• According to the Third Cohesion Report, policies on cohesion and state aids are complementary; both are aimed at contributing to the Lisbon and Gothenburg agenda for pursuing growth, competitiveness and sustainable development. However, in the less developed countries the challenge of achieving the Lisbon and Gothenburg agenda is significantly greater than elsewhere; hence the need for increased aid.
• The particular problems faced by lagging regions, especially those with in the new Member States, should not be overlooked as a result of an emphasis on global development objectives, e.g. the Lisbon Agenda and national economic convergence. Adequate support from the Structural Funds should be provided to new Member States, and in particular lagging regions within these countries.
• A long-standing criticism of the Structural Funds is their complexity. For instance, the Third Cohesion Report draws attention to the fact that the control procedures required are frequently regarded as putting unnecessary cost and time pressures on Member States.99 Conversely, many of the more traditional national regional policies have often retained simpler structures, with related benefits for end beneficiaries and policy practitioners.
• In the new Member States, institutional capacity building should remain a focus for EU programmes. It will take time for the organisations involved in regional policy to establish themselves as respected subjects. In particular, there should be a continued emphasis on building up coordination and partnership in the new Member States and Candidate Countries. There is a particular need to improve programming capacity at
98 Lovering J. (1999) ‘Theory Led by Policy: the Inadequacies of the ‘New Regionalism (Illustrated from the Case of
Wales)’, International Journal of Urban and Regional Research, 23 (2) pp. 379-90.
99 European Commission, (2004) Towards a new Cohesion for Europe: Convergence and Competitiveness and Cooperation: Third Cohesion Report European Commission: Brussels p. 23

81
the regional level, ensuring that specific regional development concepts and strategies are compatible with and reflected in national and European development plans. Further progress in capacity building will also help to increase absorption capacity of the new Member States and their regions.
• Clear guidelines should be provided for the division of responsibilities among the different levels of the spatial development institutions, with special regard to the establishment of the procedural rules and decision-making powers in programming regional development and utilising decentralised budgetary and international resources; and, specifically, in some countries (e.g. Czech Republic, Hungary) clarifying further the relationship between the political (NUTS III) level and the administrative (NUTS II) level in order to ensure smooth implementation of regional/spatial policy.

82
8 Regional and Spatial Impacts of EU Pre-Accession Funds
The following analyses are strongly connected with the potential analysis provided in the 2nd interim report of ESPON project 2.2.2. As the potential analysis represents kind of an anchor throughout the whole project's analyses, the 2nd interim report also proposed a generalised typology, which groups the regions of the New Member States and Candidate Countries on the basis of the previous potential analysis. This potential related typology is the frame for the policy analysis,100 although in many aspects below, it will be focused on one or another policy priority and potential at a time, only referring to general potential provision in concluding terms. In order to remember the overall outcome of the potential analysis, this section starts with a short summary on these findings and the general characterisation of the identified types of regions. This way also the different levels of development in the New Member States and Candidate Countries, which are comparable with EU 15 regions to a very limited extent only, can be pointed out. This characterisation is also important as for the conclusions taken from the policy analyses and the following development of policy recommendations on different spatial levels.
• Generally speaking, the potential oriented typology differentiated between
• Capital cities and major urban agglomerations;
• Western border regions;
• Peripheral Eastern and rural regions;
• Old industrial regions;
• Island economies.
In the New Member States potentials concentrate in the capital cities and few other major urban agglomerations. These regions have the most favourite socio-economic indicators within the regions of the New Member States and Candidate Countries. They benefit, for instance, from relatively high investments, high levels of human capital, more developed infrastructure, higher shares of service employment etc. Furthermore, also potentials not measurable through secondary statistics on European scale for the regional level, such as the availability of training facilities or the access to decision making processes and responsible actors obviously also concentrate in these agglomeration regions. In these regions, potentials allow for higher income and more modern economic structures than in other regions within these countries. In some cases, like those of Budapest, Prague or Bratislava, the capital's potential provision even dominates the respective national economic structures. This strongly affects the objectives of spatial cohesion and polycentric development. This concentration is, apart from historical groundings, at least partly due to the spatial intensity of economic activities, in particular, in the early years of the catch up process after the beginning of the transformation process. Consequently, while these regions domination opposes the polycentrism, they are still regions with an integrative function for the surrounding regions, which only few if any other regions in these countries can provide.
The Western border regions are more heterogeneous than the major urban agglomerations. However, their most important common characteristic is related to their spatial closeness to the former external EU 15 border. Nevertheless, also this characteristic represents an important potential, as it encourages Western investments, trade, tourism and cross-border
100 This initial typology could possibly be improved and especially made more specific through clustering the regions
on basis of the potential data. However, respective data gaps are still significant and as the primary objective of ESPON project 2.2.2 it the impact assessment of EU policies in the New Member States and Candidate Countries, this certainly very helpful clustering has not been conducted, yet.

83
retail but also initiatives in educational and technological terms. In addition, though many of these regions are of rural characteristic, in addition to the spatial closeness to the EU 15, they tend to show more potentials and less bottlenecks than the peripheral Eastern and rural regions. Consequently, policies can more easily be translated into regional growth and development rather than in regions dominated by bottlenecks. This holds in particular with regard to these regions' role for trans-national networking. Yet, they can only comply to these tasks if the necessary prerequisites for successful business cooperation etc. are fulfilled, like the provision of appropriate infrastructures to overcome the limitations of potentials typical for rural and/or peripheral regions.
These regions' chances are somewhat opposed by the characteristics and developments of the peripheral Eastern and rural regions. Generally speaking, these are the regions most disadvantaged in economic terms in the New Member States and Candidate Countries. The geographical unfavourable location there coincides with mostly poor infrastructure in all aspects, low investments and business activities, limited access to high level education etc. Furthermore, these regions are also confronted with the economic results of such disadvantages as they face relatively low income and they tend to have high unemployment rates, especially as compared to the capital regions. Although these regions need political support in order to participate in national and European restructuring many of these regions are in a position where structural political interventions result in transfers rather than sustainable investments. Thus, the comparatively low level of development observable in the Eastern peripheral and rural regions claims for different political strategies other than those generally followed in the EU 15 in order to realise sustainable support rather than temporary transfers.
In spatial terms centrally located in the New Member States are the old industrialised regions. They are also somehow enveloped by the potential development axes of the Eastern European triangle. Under the socialist regime, these regions have been important drivers of economic activity. Despite the availability of some potentials, like comparatively high accessibility and population density, the old industrialised regions have suffered from the privatisation process, comprehensive enterprise restructuring often leading to their closure, sudden loss of subsidies and the force to reorient activities to market structures. Regions were particularly hard hit the less diversified the regional industry had been structured. Furthermore, to set up modern highly competitive industries and other high-value added economic activities entrepreneurship and respective qualifications of the labour force are needed. Especially entrepreneurship qualities cannot be set up quickly but need special stimulus. Finally, for attracting modern economic sectors, these regions also need to overcome their environmental problems representing severe bottlenecks at least in parts of the old industrialised regions.
Lastly, the island economies are faced with largely different problems than the other New Member States, which is due to their quite different structure. Although the island economies also differ strongly in their structures, they have some common features, which relate to specific problems as of their small nations located at the European periphery. While they benefit from environmental potentials, they are faced with bottlenecks related to their geographic position etc. Therefore, these island economies play a specific role in the context of international networking to overcome their solitary situation. Other spatial objectives, i.e. social and economic cohesion and competitiveness, are of lower importance for these regions on meso- and micro-levels, as of their small territory. Yet, they are relevant also for the island economies in terms of European spatial development. Due to their different levels of economic development and quite different economic structures, Malta and Cyprus still need different spatial policies in the catch up process on the macro-level.
Against this background of a potential oriented typology, the following sub-sections of the policy analysis differentiates between four analytical groups of examination. The first two sub-sections provide updates of the respective sections of the second interim report. These findings are then supplemented by further assessments of the policies moving towards territorial impact assessment along two different lines of analysis, i.e. a quantitative and a qualitative. To sum up the policy analysis with respect to cohesion and competitiveness

84
objectives of the ESDP, this section finishes with an overall evaluation of the impact analysis, summarising the most important findings. This analysis is then complemented in the following section with regard to the objective of spatial integration. At this stage this latter objective is not yet integrated into the remaining impact assessment as the respective policies can be more easily connected with this last objective and as partly different methodological steps have been utilised for the respective examination.
8.1 Review of Pre-Accession Aid Programmes Pre-accession aid programmes have been extensively reviewed in the Second Interim Report of ESPON project 2.2.2 on basis of a meta-analysis. Following only selected up-dated information is given on the general character of pre-accession aid. Moreover hypotheses on spatial impacts of pre-accession aid developed in the Second Interim Report have been further elaborated and are presented here to form a coherent basis for the empirical analysis provided in the following in chapters.
Character of Pre-Accession Aid Programmes
Since 1998, at least 30% of the Phare National support has been channelled into institution building. According to the Phare Ex-post evaluation101, this objective was achieved in all of the countries, with some countries, e.g. the Czech Republic and Slovakia spending considerably more on this aspect. The remainder of the budgets is spent on investment projects that are categorized as either linked to: EU norms, structural actions and large-scale infrastructures. The breakdown of spending for 1998 is set out in the following table.
Table 8-1: Phare support according to the nature of the activity – 1998
Category
Large-scale infrastructures 24%
Investments in structural actions 16%
Institution building 33%
Investments in EU norms 27%
Source:http://europa.eu.int/comm/enlargement/phare_evaluation_pdf/consolidated_summary_uk_9_may_color.pdf
These supports are described as follows:
Investment in EU norms supported institutions in their acquis alignment process. Most often, this type of investment was the supply of equipment or minor capital investment in a mixed project: that is, a project involving also technical assistance or twinning.
Investment in structural actions mainly comprised pilot grant schemes in the domains of regional, social and agricultural development. Through a learning-by-doing process, the schemes started creating the capacity of candidate countries to manage future Structural Funds programmes. In some instances, there is evidence that this kind of support has been an incentive for the recipient authorities to introduce administrative reforms such as the creation of regional authorities. The clear rationale of the grant scheme investment (typically equipment and small infrastructure) was its contribution to the development of local and
101 European Commission (2003) Phare ex post evaluation of country support implemented from 1997–1998 to
2000–2001, carried out by a private consortium consisting of PLS RAMBØLL Management (Denmark) and Eureval-C3E (France). http://europa.eu.int/comm/enlargement/phare_evaluation_pdf/consolidated_summary_uk_9_may_color.pdf

85
regional administrative capacity, whereas evaluators have considered the socio-economic rationale for reducing structural imbalance to be unclear.
Investment in large-scale infrastructure consisted of capital investment in road, rail, rehabilitation, water, waste and anti–air pollution projects. The Phare support for large-scale infrastructure investment was often meant to facilitate access to loans from major international financial institutions through a leverage effect. This type of investment had a clear objective in terms of generating direct socio-economic impacts. The projects examined normally did not include institution-building activities supporting the preparation and implementation of the large-scale infrastructures.102
Under the most recent Phare programmes, the largest proportion of funding goes to the Phare National Programmes. Allocations to these programmes vary according to the population of the country and range from €411 million in Poland (2001) to €21.3 million in Slovenia. Funding covers a wide range of actions. In the 2001 programmes areas receiving the largest amount of funding were generally economic and social cohesion (Bulgaria, Poland, Romania, Slovenia) or improvement of administrative capacity (Slovenia, Czech Republic, Hungary).
Phare CBC programmes are consistent with support for investment in economic and social cohesion under National Phare programmes. The programmes generally focus on business-related infrastructure, productive sector investment and human resource development. Phare Multi-Beneficiary programmes have a broader and distinct focus, compared to the Phare National Programmes. A representative selection are set out in the following table.
Table 8-2: Selected PHARE Multi-Beneficiary programmes
Programme Fields of Activity
Access 2000 Environment, soco-economic
ACE (Action for Co-operation in the field of economics)
Exchange of knowledge of economics between academics and economists
Baltic Sea Region CBC Cooperation between regions cities and local authorities
Business Support Programme Support for Business representative organisations
Consensus III Social Protection refrom
CREDO East-East CBC
Drugs Programmes Drugs Policies and Measures to counter drug trafficking
Environment Programme Environment
Justice and Home Affairs Justice and Home Affairs
Nuclear Safety
SME Finance Programme
Source: http://europa.eu.int/comm/enlargement/pas/phare/programmes/multi-bene/
The ISPA programme’s focus on transport and the environment means that the majority of investments are linked to large-scale infrastructure developments. In transport, most of the investments are related to the transport corridors and the Tina Network (Transport Infrastructure Needs Assessment). This includes projects aimed at extending the Trans-
102 European Commission (2003) Phare ex post evaluation of country support implemented from 1997–1998 to 2000–2001, carried out by a private consortium consisting of PLS RAMBØLL Management (Denmark) and Eureval-C3E (France). http://europa.eu.int/comm/enlargement/phare_evaluation_pdf/consolidated_summary_uk_9_may_color.pdf pp. 12-13

86
European Transport Networks. Funding has been targeted at the development of railways, roads, waterways/ports and airport infrastructure. So far, road and rail infrastructure have dominated ISPA programmes. Assistance in the field of environment infrastructure will concentrate on the “investment heavy” directives, which concern: drinking water, treatment of wastewater, solid-waste management and air pollution. Up to now wastewater treatment was the main sub sector supported, followed by drinking water.
Under SAPARD projects relate to one or more of the 15 measures, theses range from investments in agricultural holdings, improving the processing and marketing of products, improving the structures for quality, veterinary and plant-health controls, agricultural production methods designed to protect the environment and development, diversification of economic activities and renovation and development of villages and the protection and conservation of the rural heritage.103 Under the SAPARD programme, allocations for 2001 varied between €175.1 million in Poland to € 6.6 million in Slovenia. Funding priorities vary between countries but it is possible to pick out some genera trends. In Poland, Czech Republic and Estonia, Slovakia, and Slovenia improvements to the agri-food business is the main priority. In Latvia, Lithuania Hungary and Bulgaria investment in agriculture holdings are allocated the largest amount of resources.
Formulating Hypotheses on Spatial Impact of Pre-Accession Aid
The primary aim of the pre-accession funds is to support the implementation of the acquis, but in working towards this aim, they are also capable of contributing to the general objectives of spatial cohesion, balanced spatial competition and spatial integration. Nevertheless, it is important to differentiate between a number of different dimensions of these policy instruments and their application in the candidate countries and the new Member States. A first important dimension relates to the various facets of the concept of territorial cohesion, notably the three main goals of:
• Promoting territorial equity by redistributing funds from richer to poorer places.
• Enhancing efficiency by allocating funds to those projects most likely to show the highest rates of economic return. Experience from the Cohesion Countries suggests that this may best be achieved by allocating funds to the more dynamic areas of countries seriously lagging behind the EU average. However, a complementary approach may be to reduce barriers to the flow of private investment to less dynamic regions in order to allow for spread effects.
• Improving socio-economic integration between different parts of the EU-27. This may not only include efficiency-oriented interventions (e.g. Trans-European Networks) but also various kinds of cross-border and interregional networks and linkages.
Clearly, the different pre-accession instruments and NDPs do, or will, contribute to varying extent to these three goals. For example, the core aim of ISPA is to invest in Trans-European Networks, and its contribution to socio-economic integration, as well as to economic efficiency, is therefore strong. In comparison, SAPARD’s contribution to these goals is likely to be more limited as its main focus is the redistribution of funds to rural areas and farmers. PHARE and the NDPs are likely to have broader effects, across the three goals of equity, efficiency and integration.
A second dimension of differentiation concerns the aims and mechanisms of the individual pre-accession instruments and the National Development Plans. Each of these instruments is targeted on specific kinds of intervention. Phare addresses a wide variety of development potentials and bottlenecks: developing human capital; supply of physical capital; integrated
103 The Enlargement Process and the three pre-accession instruments: Phare, ISPA, Sapard Proceedings of the conference organised by DG Enlargement and the Permanent Representations of Sweden and Austria to the European Union on 5 th March 2001. http://europa.eu.int/comm/enlargement/pas/phare/pdf/bro-phare-ispa-sapard-2.pdf

87
approaches to some local and regional problems; and institution building. Programming commitments and project requirements involved in recent programmes also act to encourage increased partnership within and between national and regional levels of governments, involvement of civil society groups and the establishment of new development organisation at national and regional levels. SAPARD focuses on rural development and support for agriculture, while ISPA invests in Trans-European Networks in the fields of transport and the environment. The National Development Plans cover a relatively wide range of interventions but are constrained by Structural Fund regulations to focus mainly on public infrastructure, human capital and support for enterprises.
In its current form, Phare has three components which can be seen to have varying links to territorial development themes
Phare National Programmes:
• Spatial cohesion - targeted through programmes of support to target groups and regions and also the overall objective of convergence with the EU-15.
• Balanced spatial competition - targeted through regional development programmes and infrastructure improvements funded by Phare
• Spatial integration – addressed in a number of ways, e.g. improved telecommunications networks and adoption of the relevant aspects of the acquis.
Phare Multi-Beneficiary Programmes
• A wide range of programmes has been funded over the period. Of particular relevance to territorial objectives are Access 2000 & 1999 (spatial cohesion), business support schemes (balanced spatial competition), cross-border co-operation programmes (Baltic Sea and CREDO) and the ECOS Overture programme promoting cooperation between regional & local authorities (spatial integration).
Phare CBC Programmes
• Support provided by current Phare CBC has to be consistent with support for investment in economic and social cohesion under the national Phare programme. Consequently, Phare CBC programmes share similar relations to territorial objectives as Phare National programmes. Phare CBC programmes also strongly relate to the objective of spatial integration through transnational institutional cooperation.
ISPA and SAPARD programmes also have varying links to territorial objectives. ISPA can be most strongly related to the objectives of balanced spatial competition, by addressing infrastructure bottlenecks, and spatial integration, by improving linkages between countries and regions. SAPARD, through funding rural development, measures can be interpreted as contributing to spatial cohesion and more balanced spatial competition.
Looking to the future, the National Development Plans can be expected to contribute strongly to territorial cohesion at the level of the EU as a whole. They should help to sustain the catching up process of the new Member States, not least by enhancing key transport linkages and thus improving market access, and by upgrading human capital. They also imply a transfer of funds to poorer Member States where public investment would be expected to show stronger economic returns. The NDPs should also have a positive effect on territorial cohesion within individual new Member States, although it is much too soon to assess their potential impact on specific regions and localities. In broad terms, the NDPs would also be expected to contribute to territorial cohesion within each new Member State, for example by improving the supply of appropriately skilled labour, by upgrading transport networks to all regions, and by generally enhancing conditions for business activity and investment. Specific interventions are also planned for rural areas. However, at present, it is difficult to make any specific statements about the possible effects of the NDPs on territorial cohesion within each new Member State because they are only just coming into operation.
A third dimension of differentiation concerns the different geographical levels of territorial cohesion, which can be conceived, for example, in terms of relations between:

88
• Member States within the EU-27 as a whole (macro-level);
• NUTS 1, NUTS 2 or NUTS 3 regions (which may be between countries or within countries); and (meso-level)
• areas within one NUTS 3 region (micro-level).
Some types of intervention may contribute more strongly to territorial cohesion at the level of the EU-27 (possibly ISPA), while others focus more strongly on cohesion between NUTS 3 regions (e.g. SAPARD). Clearly, this dimension is also affected by the geographical scale and location of a country, for example in the case of smaller countries (the three Baltic states, Slovenia, Cyprus and Malta), interactions between NUTS 2 regions imply international interactions. Geographical location can be important, for example in terms of potential to enhance integration with neighbouring countries, for example cooperation with Denmark, Finland and Sweden in the Nordic-Baltic region in the case of Estonia, Latvia, Lithuania and Poland; or with Germany, northern Italy and Austria in the Central European region in the case of the Czech Republic, Hungary, the Slovak Republic and Slovenia.
Interactions between different aspects of territorial cohesion (equity, efficiency and integration) and different levels of geographical impact (EU-27 through to NUTS 3 regions) are explored in the following table:
Table 8-3: Different aspects of territorial cohesion and different territorial levels
Equity Efficiency Integration
EU-27 PHARE
ISPA
SAPARD
NDP
ISPA
NDP
PHARE
ISPA – Transport
NDP
NUTS 1 regions ISPA
NDP
ISPA
NDP
PHARE
ISPA – Transport
NDP
NUTS 2 regions ISPA (esp. in smaller countries)
NDP (esp. in smaller countries)
SAPARD (esp. in Poland)
ISPA (esp. in smaller countries)
NDP
PHARE
ISPA – Transport
NDP
NUTS 3 regions PHARE
SAPARD
NDP? (depending on final agreements)
NDP? (depending on final agreements)
PHARE
NDP
A final dimension of the differentiated impact of various types of aid relates to differences between the Candidate Countries and new Member States. For example, the countries differ in terms of the degree of different needs for investment (e.g. extent and quality of existing transport infrastructure and environmental problems), and also the extent of internal regional disparities on the one hand and of the national gap versus EU15 levels of development on the other. For example, the contribution of ISPA to cohesion between countries may be argued to be more important in a country such as Slovakia, which still lacks an adequate transport infrastructure network, as compared to the Baltic countries, which already had relatively good transport networks running east-west. Similarly, SAPARD is likely to have a stronger potential

89
impact on territorial cohesion – and at the level of larger (NUTS 2) regions – in a country such as Poland, which is not only large but also has many relatively large areas dependent on agriculture (as opposed to the Czech Republic, Slovakia or Estonia, where significant steps towards restructuring agriculture have already been achieved).
Analysis of the polity and process involved in pre-accession funds reveals that practices and institutions involved in the development and delivery of the Structural funds - which favour the partnership principle, subsidiarity and evidence-based and shared policy-making - are in-line with the territorial objectives, by empowering local communities and facilitating networking, dialogue and cooperation within and across regions. These are particularly significant developments in the Central and East European Candidate Countries and new Member States where there is a tradition of strongly centralised policy development and implementation combined with weak regional administrations and civil society.
In general, the majority of the institutional arrangements for the NDPs will be organised at a central level in 2004-2006 – although some programmes and projects will be delivered by decentralised agencies, depending on the institutional framework of the new Member State. Many problems – such as inadequate infrastructure and a mismatch of labour supply and demand – tend to be shared by all regions, so that a centralised approach may be seen as appropriate. This pragmatic approach is also based on a recognition of the administrative difficulties of implementing complex Structural Funds’ programmes. Nevertheless, some relatively small-scale interventions will aim at capacity building at a regional or local level.
On basis of these considerations hypotheses can be drafted with regard to overall spatial impacts of pre-accession aid and significance of types of instruments, territorial scales and implementation and governance for spatial impacts.
Key Working Hypotheses:
1. The primary aim of the pre-accession funds is to support the implementation of the acquis, but in working towards this aim, they also to contribute to the objectives of spatial cohesion, balanced spatial competition and spatial integration.
2. Spatial cohesion: In terms of spatial cohesion, pre-accession support assists the new Member States and Candidate Countries to meet the criteria for EU enlargement, thus promoting equity objectives at an EU level. Support to lagging regions through the Phare programme, which promotes equity at both the national and EU levels.
3. Balanced spatial competition: Pre-accession support has played an important role in addressing regional development bottlenecks and barriers to development. It has also offered support to regions capable of acting as growth poles for the national and EU economies.
4. Spatial integration: Spatial integration between then recipient countries and the EU have been strengthened by pre-accession programmes, economic integration, infrastructure, cultural integration and political integration have all been developed.
5. The volume of resources, scale of development disparities and institutional capacities of the applicant countries mean the impact of pre-accession aids are not easily measurable in terms of standard indicators.
6. Related the impacts of the pre-accession aid on spatial development are not pronounced, given the relatively small amount of funding spread across a wide range and the scale of development disparities.
Pre Accession Instruments
1. The different instruments are likely to affect different aspects of territorial cohesion to varying degrees and in different ways. SAPARD is more likely to affect equity,

90
while ISPA is expected also to affect efficiency and integration. PHARE and the NDPs will affect all three aspects of territorial cohesion.
2. Spatial Cohesion: Phare programmes of support have targeting lagging regions, SAPARD specifically targets rural development.
3. Balanced Spatial Competition: Phare support is to enhance national and regional competitiveness. Transport infrastructure developments will support balanced spatial competition across an enlarged EU and within the New Member States
4. Spatial Integration: Phare CBC and infrastructure investments will support spatial integration
5. Country Groupings: Some countries and regions are in a better position to benefit from pre-accession aid than others. Romania and Bulgaria face greater economic development challenge and, related, the impact of pre-accession aid programmes are less likely to be immediately apparent. In contrast, more direct and measurable benefits from pre-accession aid with a more notable impact upon spatial development objectives can be identified elsewhere. For instance, favourably placed, western border regions and heavy industrial regions could build upon existing development potentials and advance their position
Territorial Scales 1. The impact of different instruments on territorial cohesion will vary at different
territorial levels.
2. Spatial Cohesion: Given the level of funding provided and the scale of disparities between the Candidate Countries, New Member States and EU-15, the pre-accession programmes have not made a dramatic impact upon spatial inequalities. However, at a regional/local level, pre-accession aid has targeted equity objectives and has contributed towards development in lagging regions. At a national level, cohesion objectives have been targeted though improvements in service provision and institutional capacity building.
3. Balanced Spatial Competition: Pre-accession measures have supported balanced spatial competition. Actions with the most significant impact are evident either at the local level (e.g. promotion of local business) or at the national level (e.g. through promotion of the competitiveness agenda).
4. Spatial Integration: The Phare programme has notable impacts upon spatial integration at the regional level, e.g. through Phare CBC. At the national and EU levels, the Phare programme and ISPA have had a key role in promoting spatial integration.
5. The impact of the different instruments on various aspects of cohesion will depend on specific aspects of each individual country, notably its geographical location, the size of its population and territory, the extent and quality of specific socio-economic and environmental problems, and the degree of inter-regional disparities as well as the size of the national gap towards EU15 levels of development. Countries can be grouped into the following categories:
• Island Economies: Cyprus and Malta
• Small states (new Member States): Slovenia, Baltic States
• New Member States: Czech Republic, Slovakia, Poland and Hungary
• Candidate Countries: Romania and Bulgaria
A similar argument can be made in relation to the impact of pre-accession aid on regions.
• Capital City Regions

91
• Western Border Regions
• Heavy Industrial Regions
• Eastern Border Regions
Implementation and Governance 1. Pre-accession funds can be considered as contributing to territorial objectives also
as regards their method of implementation and governance. In particular, the Phare programme has promoted the involvement of local and regional actors and institutions in development planning.
2. Institutional capacities and, related, absorption capacity still need to be further
developed in order to capitalise fully on the development opportunities offered.
8.2 Regionalisation of Pre-Accession Aid Spending Detailed analysis of pre-accession aid spending in terms of fields of action funded and regional distribution of funds can be provided on the basis of the policy database established by ESPON project 2.2.2. As far as available data on PHARE, PHARE CBC, ISPA and SAPARD spending has been collected for all Candidate Countries as well as data on pre-accession aid instruments in Malta and Cyprus. Information on programmes and projects recorded include the amount spent, year of financial allocation, field of action within pre-accession programme, regional level of allocation and short description of project’s contents. Furthermore each project/programme has been related to the regional potential most importantly addressed by implementation of the project/programme104. Although the database has been considerably improved since the last Interim Report of ESPON project 2.2.2 some problematic issues concerning data availability as well as data recording continue to exist as pointed out in the respective chapter in part I.
The following section provides an overview on pre-accession aid spending based on the improved ESPON project 2.2.2 database and thus gives an up-date of information given in the Second Interim Report of ESPON 2.2.2105. First pre-accession aid spending on national level will be reviewed, following spending on regional level. Data is provided for the period 1998-2002, since for these years data is mostly complete and comparable between countries. Since for the below impact analysis only the period 1998-2000 is taken into account due to methodological considerations, data review in this chapter is already separated into the periods 1998-2000 and 2001-2002. This moreover enables tentative analysis of development trends of pre-accession aid priorities over time. Data for Malta and Cyprus is provided for the period 2000-2002 which is however subsumed under the period 1998-2000 to enable comparability with the other countries in the quantitative analysis. With regard to SAPARD still considerable data gaps exist and country wise comparability of data is limited due to different allocation periods (see respective chapter in part I). Thus data on SAPARD spending is presented separately to ensure comparability of aggregated data for PHARE, PHARE CBC and ISPA.
104 See Kujath, H.J.; Kunkel, K.; Zillmer, S. et.al. (2003): Pre-accession Aid Impact Analysis. 2nd Interim Report to
ESPON Project 2.2.2., p. 131f. for detailed information on the chosen relations.
105 Kujath, H.J.; Kunkel, K.; Zillmer, S. et.al. (2003): Pre-accession Aid Impact Analysis. 2nd Interim Report to ESPON Project 2.2.2., chapter 7.2.

92
Pre-Accession Aid spending on national level
Pre-accession aid spending according to programmes
Pre-accession aid spending on national level according to programmes is shown in table 8-4 for the two periods 1998-2000 and 2001-2002. Total allocation for the ten Eastern European Candidate Countries in the period 2001-2002 amounted to 4 735 Mio. € and thus exceeded the allocation for the period 1998-2000 that amounted to 3 684 Mio. € for all twelve Candidate Countries. Considering annual allocations these figures result in considerably higher average annual allocations in the years 2000 and 2001 as compared to the earlier years. This can be mainly explained by the introduction of ISPA with allocations in most countries starting only in 2000. Accordingly ISPA allocations in the period 2001-2002 more than doubled in comparison to the period 1998-2000 (2 235 Mio.€ respectively 1 027 Mio. €). Total ISPA funds in the years 2001-2002 even slightly exceeded PHARE funds amounting to 2 1778 Mio. € in the same period (without PHARE CBC).
Allocation per country roughly mirrors the size of the countries in terms of population. Accordingly in the period 1998-2000 Poland has received by far the largest amount of pre-accession aid followed by Romania. The relative shares of pre-accession aid programmes in total allocations vary between countries, but in all countries PHARE was the dominant programme in the period 1998-2000. PHARE CBC allocation comprised a relatively large share of total allocation in Bulgaria and Slovenia while the programme had relatively low importance in the three Baltic States.
Total allocations in the period 2001-2002 exceeded allocations for the earlier period in all countries and nearly doubled in the Czech Republic and Estonia. In case of Estonia this increase results mainly from highly increased ISPA funds. In almost all countries ISPA became the most important programme in financial terms in the period 2001-2002 and ranked close behind PHARE in the remaining countries.
Table 8-4: Total pre-accession aid according to programmes, in MEUR
1998-2000 2001-2002
Country ISPA PHARE PHARE CBC Total ISPA PHARE PHARE
CBC Total
BG 116,0 169,3 120,0 405,4 199,4 156,2 56,1 411,7
CY - - - 31,7 - - - -
CZ 69,7 74,1 27,9 171,7 147,4 145,7 37,3 330,3
EE 29,1 67,6 8,7 105,5 92,2 97,6 6,0 195,8
HU 94,1 229,1 43,0 366,3 179,1 162,2 38,0 379,3
LT 52,3 137,5 12,3 202,2 111,6 105,4 6,0 223,1
LV 46,7 98,2 8,4 153,3 93,6 65,7 6,0 165,4
MT - - - 22,3 - - - -
PL 307,0 812,5 142,4 1261,9 784,6 776,8 110,0 1.671,5
RO 242,2 376,8 29,9 648,9 502,2 511,4 26,0 1.039,6
SI 19,4 47,3 24,4 91,2 32,7 56,2 13,6 102,5
SK 50,3 144,8 28,2 223,3 92,0 100,6 24,0 216,6
Total 1 027,0 2 157,4 445,1 3 683,5 2 234,8 2 177,8 323,1 4 735,7

93
Pre-accession aid spending according to potentials addressed
Priorities of pre-accession aid in terms of potentials addressed are given in Table 8-5 and Table 8-6 for the two reference periods. Three dominant priorities can be distinguished for the total spending representing at the same time the dominant priorities in most countries: measures addressing the geographical position, the environmental quality and the institutional capacity. In both periods these three priorities account for about 80% of total spending with measures addressing the geographic position being the most dominant. Due to introduction of ISPA share of environmental projects increased in the period 2001-2002 compared to 1998-2000 while institution building lost in relative importance. In the period 1998-2000 the share of institution building measures was considerably above average in Hungary, Romania and Slovenia while Poland directed a relatively low share to this priority. Also special instruments for Malta and Cyprus showed a clear focus on institution building and directed about 80% (Malta) and 70% (Cyprus) to interventions of this kind. In comparison to the average the improvement of the geographic position had less importance in the small countries Estonia, Slovenia and Slovakia but higher importance in the large countries Poland and Bulgaria.
“Soft” measures addressing the innovation capacity, the labour market or the urbanisation/localisation potential were of minor importance in terms of financial allocations in all countries. However, Poland as the country receiving the highest total amount of funding and thus having a large scope of action emphasised these “soft” fields of action as well above average.
Beside the already mentioned increased weight of environmental measures no significant changes of priorities can be observed in the period 2001-2002 in comparison to the earlier period.
Table 8-5: Percentage of total PHARE, PHARE CBC and ISPA spending 1998-2000 addressing different regional potentials/bottlenecks
Regional potential Country
Capital supply
Environ-ment
Geogra-phic
position
Inno-vation
Institut-ions
Labour market
Regional market
Urbani-sation/ Locali-sation
BG 4,3 14,3 46,4 0,4 30,0 3,0 1,2 0,3
CZ 7,6 29,6 24,2 1,1 21,9 3,4 12,2 0,0
CY 3,5 6,6 1,9 0,0 69,3 0,0 18,7 0,0
EE 0,0 37,9 16,9 0,9 30,4 12,7 0,3 0,9
HU 0,9 19,1 29,1 0,0 40,4 5,1 0,8 4,6
LT 2,5 23,2 27,8 0,0 30,3 3,9 12,3 0,0
LV 3,5 31,0 24,2 0,0 26,3 3,4 4,5 7,2
MT 0,0 0,0 4,5 0,0 80,7 14,8 0,0 0,0
PL 5,8 19,7 37,4 0,8 12,5 10,2 3,7 9,8
RO 1,9 20,4 30,4 0,0 38,6 3,3 0,0 5,4
SI 3,8 28,6 10,5 0,3 38,7 4,1 1,1 13,0
SK 12,7 23,5 20,8 0,0 31,9 3,9 5,4 1,9
Total 4,4 21,0 31,9 0,4 27,0 6,2 3,4 5,6
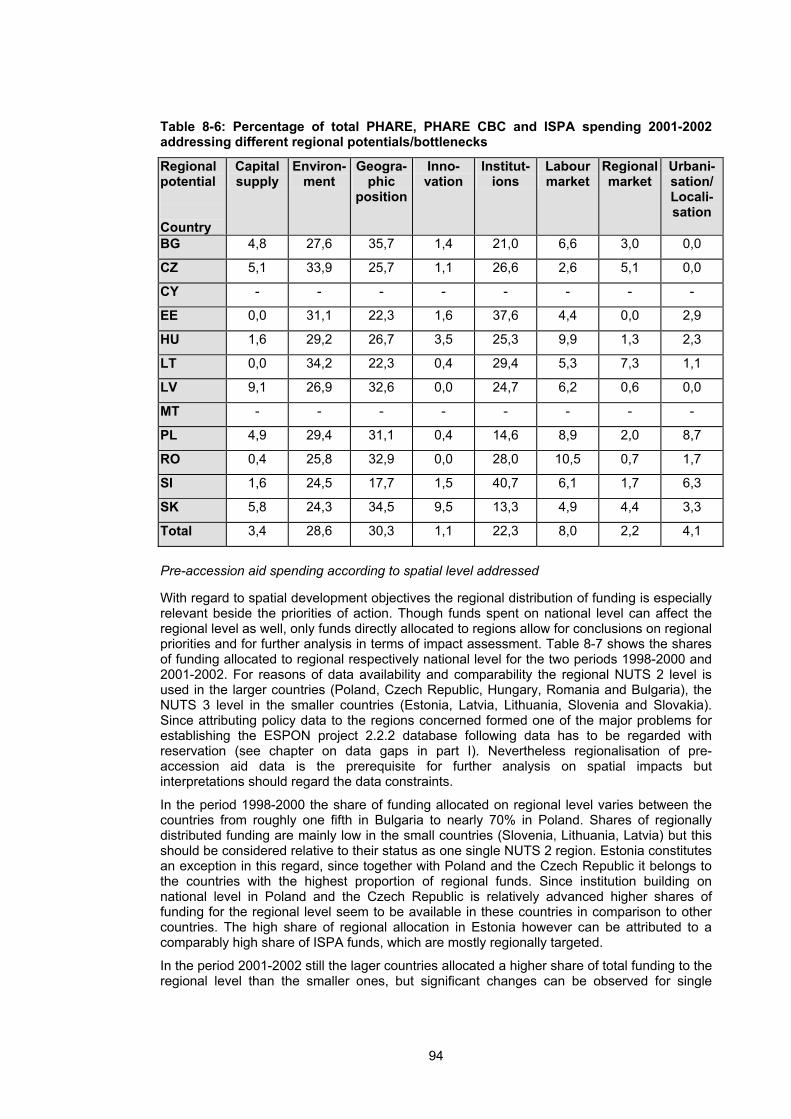
94
Table 8-6: Percentage of total PHARE, PHARE CBC and ISPA spending 2001-2002 addressing different regional potentials/bottlenecks
Regional potential Country
Capital supply
Environ-ment
Geogra-phic
position
Inno-vation
Institut-ions
Labour market
Regional market
Urbani-sation/ Locali-sation
BG 4,8 27,6 35,7 1,4 21,0 6,6 3,0 0,0
CZ 5,1 33,9 25,7 1,1 26,6 2,6 5,1 0,0
CY - - - - - - - -
EE 0,0 31,1 22,3 1,6 37,6 4,4 0,0 2,9
HU 1,6 29,2 26,7 3,5 25,3 9,9 1,3 2,3
LT 0,0 34,2 22,3 0,4 29,4 5,3 7,3 1,1
LV 9,1 26,9 32,6 0,0 24,7 6,2 0,6 0,0
MT - - - - - - - -
PL 4,9 29,4 31,1 0,4 14,6 8,9 2,0 8,7
RO 0,4 25,8 32,9 0,0 28,0 10,5 0,7 1,7
SI 1,6 24,5 17,7 1,5 40,7 6,1 1,7 6,3
SK 5,8 24,3 34,5 9,5 13,3 4,9 4,4 3,3
Total 3,4 28,6 30,3 1,1 22,3 8,0 2,2 4,1
Pre-accession aid spending according to spatial level addressed
With regard to spatial development objectives the regional distribution of funding is especially relevant beside the priorities of action. Though funds spent on national level can affect the regional level as well, only funds directly allocated to regions allow for conclusions on regional priorities and for further analysis in terms of impact assessment. Table 8-7 shows the shares of funding allocated to regional respectively national level for the two periods 1998-2000 and 2001-2002. For reasons of data availability and comparability the regional NUTS 2 level is used in the larger countries (Poland, Czech Republic, Hungary, Romania and Bulgaria), the NUTS 3 level in the smaller countries (Estonia, Latvia, Lithuania, Slovenia and Slovakia). Since attributing policy data to the regions concerned formed one of the major problems for establishing the ESPON project 2.2.2 database following data has to be regarded with reservation (see chapter on data gaps in part I). Nevertheless regionalisation of pre-accession aid data is the prerequisite for further analysis on spatial impacts but interpretations should regard the data constraints.
In the period 1998-2000 the share of funding allocated on regional level varies between the countries from roughly one fifth in Bulgaria to nearly 70% in Poland. Shares of regionally distributed funding are mainly low in the small countries (Slovenia, Lithuania, Latvia) but this should be considered relative to their status as one single NUTS 2 region. Estonia constitutes an exception in this regard, since together with Poland and the Czech Republic it belongs to the countries with the highest proportion of regional funds. Since institution building on national level in Poland and the Czech Republic is relatively advanced higher shares of funding for the regional level seem to be available in these countries in comparison to other countries. The high share of regional allocation in Estonia however can be attributed to a comparably high share of ISPA funds, which are mostly regionally targeted.
In the period 2001-2002 still the lager countries allocated a higher share of total funding to the regional level than the smaller ones, but significant changes can be observed for single

95
countries. For Bulgaria the share of regional funds increased from about 20% to nearly 60%, for Slovakia from about 40% to over 60%. Poland still shows a high share of regional funds in this period while the share of regionally allocated funds significantly decreased in the Czech Republic from 75% to slightly over 50%. The increased share of regional funds in Bulgaria and Slovakia might be explained with the catching-up of these countries with regard to institution building on national level setting free resources for the regional level as well as the increasing number of ISPA projects. The decrease of regional funds in the Czech Republic however mainly results from data problems, since another data source has been used for 2000-2002 which did not include regional information.
Table 8-7: Total PHARE, PHARE CBC and ISPA spending according to spatial level addressed
1998-2000 2001-2002
Country Total pre-accession
aid in MEUR
% of pre-accession
aid allocated on national
level
% of pre-accession
aid allocated on regional
level
Total pre-accession
aid in MEUR
%of pre-accession
aid allocated on national
level
% of pre-accession
aid allocated on regional
level BG 405,4 79,3 20,7 411,7 41,9 58,1
CY 31,7 100,0 0,0 - - -
CZ 171,7 25,0 75,0 330,3 48,3 51,7
EE 105,5 43,7 56,3 195,8 54,9 45,1
HU 366,3 57,1 42,9 379,3 61,4 38,6
LT 202,2 66,1 33,9 223,1 63,3 36,7
LV 153,3 65,6 34,4 165,4 63,4 36,6
MT 22,3 100,0 0,0 - - -
PL 1 261,9 31,9 68,1 1 671,5 36,2 63,8
RO 648,9 58,1 41,9 1 039,6 52,8 47,2
SI 91,2 61,3 38,7 102,5 55,4 44,6
SK 223,3 58,2 41,8 216,6 39,7 60,3
Priorities of SAPARD spending
SAPARD data on regional level so far has been provided for the Czech Republic, Estonia, Hungary, Lithuania, Poland, Slovenia and Slovakia (Table 8-8). However different time periods are covered and completeness of data differs significantly between countries what becomes apparent when comparing data gathered by ESPON project 2.2.2 with the SAPARD annual financing agreements for 2001 (Table 8-9). According to the financing agreements data for Estonia, Lithuania and Slovenia seems to be the most complete for the period covered while rather large data gaps can be assumed for the other countries. Due to these considerable data weaknesses SAPARD data will not be regarded in the following analysis of pre-accession aid on regional level.

96
Table 8-8: Total SAPARD spending Country Total SAPARD in
Mio. € Period
BG - - CY - - CZ 3,3 2001 EE 42,3 2001-2003 HU 52,3 2003 LT 117,5 2000-2003 LV - - MT - - PL 103,7 2003 RO - - SI 17,3 2000-2003 SK 33,3 2000-2003 Total 369,6
Table 8-9: SAPARD annual financing agreement, 2001 Country Mio. €
BG 54,1 CY - CZ 22,9 EE 12,6 HU 39,5 LT 31,0 LV 22,7 MT - PL 175,1 RO 156,3 SI 6,6 SK 19,0 Total 538,7
Source: CEC (2002): SAPARD Annual Report – Year 2001. Brussels.
Despite the mentioned data weaknesses aggregated data on national level can indicate the main priorities of ISPA with regard to the regional potentials addressed. As Table 8-10 shows SAPARD interventions are mainly oriented towards three regional potentials/bottlenecks: 1. the regional capital supply by e.g. providing support to investments in agricultural holdings, 2. the regional market potential by e.g. improving processing and marketing, thus enabling increasing incomes in the agricultural sector, and 3. though to a lesser degree the geographic position by improving rural transport infrastructure. Though improving capital supply and the regional market potential are dominant fields in all counties, priorities of the countries vary: while in the Czech Republic and Hungary the highest shares of SAPARD funding address the regional capital supply, the largest share of funds in Lithuania is spend on improving the regional market potential. Poland targets funds towards four potentials with relative homogenous priorities: capital supply, environmental quality, geographic position and institution building. From these tentative figures SAPARD can all in all be assessed as addressing main bottlenecks for development of rural regions resulting from the low population density and productivity (low regional market potential), low levels of capital intensive branches and peripherality in geographic terms.

97
Table 8-10: Percentage of total SAPARD spending addressing different regional potentials/bottlenecks Country Capital
supply Environ-
ment Geogra-
phic position
Inno-vation
Institut-ions
Labour market
Regional market
Urbani-sation/ Locali-sation
BG - - - - - - - - CY - - - - - - - - CZ 82,0 0,0 0,0 0,0 0,0 0,0 18,0 0,0 EE 56,7 0,0 0,7 0,0 0,0 0,0 42,6 0,0 HU 91,2 5,1 0,9 0,0 0,8 0,0 2,0 0,0 LT 23,3 0,0 6,4 0,0 0,0 0,7 63,3 6,3 LV - - - - - - - - MT - - - - - - - - PL 24,8 24,3 34,9 0,0 16,0 0,0 0,0 0,0 RO - - - - - - - - SI 43,0 0,0 16,5 0,0 0,0 0,0 40,5 0,0 SK 54,3 1,2 0,0 0,0 0,0 0,0 44,4 0,0 Total 41,4 7,7 12,8 0,0 4,6 0,2 31,3 2,0
Pre-Accession Aid spending on regional level
The following section gives an overview on pre-accession aid spending on regional level in terms of levels of spending and regional potentials addressed. As indicated above data on regional NUTS 2 level is used for Poland, the Czech Republic, Hungary, Romania and Bulgaria, data on NUTS 3 level for Estonia, Latvia, Lithuania, Slovenia and Slovakia, i.e. only the shares of total funds are included in the following analysis that have been assigned to the respective regional level (see Table 8-7). Again the two periods 1998-2000 and 2001-2002 are displayed.
Regional PHARE, PHARE CBC and ISPA spending as percentage of regional GDP
Average annual PHARE, PHARE CBC and ISPA spending as percentage of average annual GDP for the period 1998-2000 is shown in below Map 8-1. Overall spending levels per region are rather low with the majority of regions receiving up to 0,4% per year. Although, as mentioned in chapter 4.2, these figures might be below actual allocations - since not all projects could be assigned to the regional level – regional allocations stay far below the absorption capacity defined for the national level as 4%. In many countries, e.g. Poland, Hungary, Slvoenia, spending levels are relatively high in border regions what points out the importance of PHARE CBC programmes. This is especially significant in Poland, where the importance of cross-border programmes in the Lubuskie region is also emphasised by qualitative case study analysis106. High spending levels in the Baltic States, however, can not be ascribed to PHARE CBC programmes only, but rather result from large scale projects in several fields. In Estonia a few large scale infrastructure projects in the environmental and transport sector mainly contribute to the high spending levels, while in Latvia large scale environmental infrastructure projects have been funded, but also large economic and social cohesion programmes in Zemgale region (South Latvia) and Latgale region (East Latvia) make out for the high level of spending. In Lithuania one very large nuclear safety programme in Utenos region (North-East) as well as large PHARE regional development projects in the South-Western border regions account for high spending level.
106 Compare case study results under chapter 8.3

98
Beside the distinguishing of border regions further conclusions could be drawn by relating the level of spending to the regional typology in terms of urban characteristics (FUAs, MEGAs) developed by ESPON project 1.1.1. This relation is however limited, since often several transnational/national FUAs and regional/local FUAs are located within one NUTS 2 or NUTS 3 region and no data is available on concrete location of pre-accession aid projects. Thus, the picture only reveals reasonable results with regard to regions containing MEGAs, which are in most countries the capital regions. In this respect Bulgaria and Romania are the only countries achieving relative high spending levels in the capital city/MEGA regions. In both regions (Bucuresti and Sofia) this is mainly due to a few large scale transport infrastructure projects. In all other countries spending levels rank within the lowest spending category in the regions containing MEGAs/the capital city. However in Poland the picture is less clear, since regions containing MEGAs and at the same time being border regions received funding on a middle level. Considering spatial levels addressed, these results point all in all to a relative low priority for supporting macro-level developments, that would be achieved by supporting potential and weak MEGAs in Central and Eastern Europe and Malta. By targeting funds to regions containing national/regional or local FUAs the spatial objectives on national and regional level are clearly in the focus of funding.
Regional spending levels in the period 2001-2002 increased in comparison to the earlier period, due to increased total allocations per country and a higher share of funds allocated on regional level as already mentioned above. Average annual spending levels in the years 2001-2002 are presented in below Map 8-2.
Increase of spending levels is especially high in Bulgaria and Romania, what is mainly due to introduction of ISPA supporting a few large scale projects in the environmental and transport sector amounting up to 50 – 60 Mio. € to specific regions. High spending levels in the Baltic States result as in the former period from large scale environmental and transport infrastructure projects now mainly funded by ISPA with up to 10 – 13 Mio. €. Case study analysis on the ISPA environmental strand in Estonia revealed, however, that these indicative allocations are far above actually disbursed funds and so far only a few ISPA projects have been completed or even only partly completed. High levels of indicative allocations as shown in the below map should therefore not directly lead to conclusions on high spatial impacts.
Spending levels are also in this period 2001-2002 high in many border regions, e.g. in Poland, Hungary or Slovenia, what is again mainly due to PHARE CBC programmes. Also the pattern regarding differentiation of spending levels according to endowment with MEGAs remained similar in this period. As in the earlier period regions endowed with MEGAs ranked amongst the regions with the lowest spending levels, some border regions in Poland and the capital city regions of Bulgaria and Romania forming an exemption again.

99
Map 8-1: Regional PHARE, PHARE CBC and ISPA Spending as percentage of regional GDP, 1998-2000

100
Map 8-2: Regional PHARE, PHARE CBC and ISPA Spending as percentage of regional GDP, 2001-2002

101
Regional PHARE, PHARE CBC and ISPA spending according to potentials addressed
To give a rough overview on fields of actions supported on regional level, total allocations have been divided into three categories: measures addressing the environmental quality, measures addressing the geographic position and measures addressing human and business resources as subsumption of all other fields of action (addressing e.g. the labour market, the innovation capacity, institutional conditions etc.). Maps on shares of these three fields respectively per region are provided in the annex. More detailed analysis of fields of actions / potentials addressed by pre-accession aid spending is conducted in the following chapter on quantitative impact analysis.
In the period 1998-2000 the share of funds in total regional allocations addressing the geographic position (mainly investments in transport infrastructure) differed strongly between the regions. In many countries the priority of support for transport infrastructure was notably high in the capital regions (Warsaw, Bratislava, Budapest, Sofia, Bucharest, Prague region). In Poland high shares of funding for transport infrastructure can in addition be observed in all border regions, be they western or eastern border regions. In general the share of spending addressing the geographic position is relatively low in the Baltic State’s regions as well as in the island economies Malta and Cyprus. In many regions no funds were spent on improvements of the transport infrastructure at all, amongst these being western border regions (e.g. in the Czech Republic), regions endowed with MEGAs (e.g. Poznan and Lodz region in Poland) and rural eastern regions (e.g. in Bulgaria and Romania).
The share of funds addressing the environmental quality varies as well strongly between the regions. Shares of these kind are particularly high in the Baltic States, Slovakia and Romania. No clear relation can be observed between the share of funding and the type of region. Since measures addressing the environmental quality include mainly improvements of municipal infrastructure (waste / waste water treatment, sewerage systems) shares of funding tend all in all to be higher in rather rural regions than in regions endowed with large agglomerations. This can be assumed to be due to the poorer status of original endowment with such infrastructures resulting in a larger demand for catching-up in rural areas compared to urban areas. Old industrial regions supposed to be in high need for improvement of the environmental quality so far show no general priority in this field of action.
The share of funds addressing human and business resources is in general lower but more homogenous amongst the regions in comparison to the aforementioned infrastructure investments. Only in a few regions over 50% or even over 75% of the regional allocations were spent on these “soft” measures. Also only in a few regions there was no allocation at all addressing human and business resources. In particular many regions in the Baltic States showed no allocations in these fields, thus these regions directed all funding to infrastructure investments. Looking more into detail, the most diverse structure of interventions subsumed under this category of human and business resources can be observed in Poland, Slovenia and Hungary, where in many regions funds were spent on several fields of action. In contrast, in many regions, e.g. in the Baltic States, in Romania and Bulgaria only one field of action has been addressed (e.g. institutional capacity, labour market or urbanisation and localisation).
In the period 2001 to 2002 the general picture of high shares of funding in the environmental and transport field and lower shares in fields related to human and business recourses remained stable, although considerable shifts can be observed in some regions. In this period as well share of funds addressing the geographic position were relative high in regions endowed with major agglomerations. The share of funding for the transport sector on regional level was notably lower than in the earlier period in many regions in the Baltic States and Hungary. This is due to different reasons. While in the Baltic States many transport projects in this period (mainly funded by ISPA) addressed infrastructures of national importance and extent (TEN-investments), low share of spending related to regional transport infrastructure in Hungary is mainly due to data weaknesses concerning localisation of ISPA transport projects. Poland and the Czech Republic showed an extension of transport infrastructure related funds to nearly all regions in the period 2001 to 2002 in comparison to the previous period.
102
Share of funds addressing the environmental quality increased in the period 2001 to 2002 in comparison to the previous period in many regions, notably in the Baltic States, Romania, Bulgaria and Hungary. This mainly resulted from an increased number of ISPA environmental projects. Again in most countries share of funds related to environmental measures were higher in rather rural regions than in those containing major urban agglomerations.
Most regions showed less priority for supporting human and business resources than for funding infrastructure investments in the period 2001-2002 as well. Again Poland and Hungary had a relative diverse structure of interventions, when it comes to differentiate shares of different fields of action subsumed under the category “human and business resources”, while many regions in the other countries received funding in only one field of “soft” actions. Shares of funding in these fields were notably low in many regions of the Baltic States, what have to be ascribed to data weaknesses again, since for most PHARE projects in the period 2001-2002 no information on the precise location was available. As in the previous period no relation between shares of spending related to human and business resources and the type of regions can be observed. While e.g. in Hungary and Slovakia shares of these kind of measures were relative high in eastern, rural regions, in the Czech Republic these measures had a high priority in the region surrounding Prague.
To conclude, the above section on regional priorities of spending in the periods 1998-2000 and 2001-2002 revealed that infrastructure investments in many cases are dominant on regional level as well, while soft measures addressing human and business resources play a minor role in most regions. In total however priorities vary strongly between regions and no clear pattern can be observed in terms of priorities of different countries or different types of regions (border regions, old industrial regions). Comparison of the two periods showed that only limited continuity of priorities is given for most regions. While the tendency of higher priority for transport infrastructure in regions endowed with agglomerations and higher priority for environmental investments is visible in both periods, priorities shift considerably in selected regions. Change of priorities is even more pronounced with regard to spending addressing human and business resources. Moreover in some cases significant data weaknesses have been highlighted, what once more illustrates the need for sensitive interpretations of data to prevent distorted conclusions.

103
8.3 Quantitative Impact Analysis
As described in the methodology section, the quantitative impact analysis divides between different analytical steps, some of which providing preparatory steps for the impact analysis rather than a real impact assessment. However, as of the limitations due to data gaps (see Part 1) and other difficulties to be expected, these preparatory steps seemed to be necessary, first, to gather a sound overview on national and regional relations between pre-accession aid spending107 and regional potentials and characteristics as well as their development in order to bring together reliable knowledge for policy recommendation development, and second, to build drawbacks for insignificant outcomes of the core impact analysis. The expected problems do not altogether relate to different kinds of data gaps but above all to methodological problems.
First of all, an impact assessment should be related to general economic indicators which can describe the regional or national situation with respect to the objectives set. However, these indicators, e.g. GDP per capita or unemployment rate for the cohesion objective or productivity for the competitiveness objective108, do not response immediately after political interventions but often take time lags of a few years109. As of the short time span of Phare and pre-accession aid measures under consideration, global indicators can not be expected to have reacted on these measures yet, at least not for the years they are available on European level. On the other hand, reference to earlier Phare policies does not seem to be appropriate at all, since policy data from the periods before 1998 is more unreliable and the respective measures had a less regional allocation but were more strongly concentrated on national issues, such as national institution building. As of these time lags, it is quite important not only to look at global but potential indicators as well.
This leads to the second inherent problem: the level of regional allocation of Phare and pre-accession aid policies. They are no original territorial policies but primarily aimed at the New Member States' and Candidate Countries' preparation for EU membership. Even for the end of the 1990s, in some countries significant shares of total EU funds have been allocated to the national rather than regional level. This makes a territorial impact assessment of the respective policies the more difficult. This holds the more, as of the low level of intervention as compared to e.g. Structural Funds in Objective 1 regions within the EU 15.110
Together with the role of other influences, such as national policies, changes of national frameworks etc., this low intervention level represents another problem to the impact assessment. Impacts of Phare and pre-accession aid are likely to go unrecognised as of the existence of other effects upon global indicators, whether they affect them in the same or other direction. Thus, in the analysis under way, insignificant coefficients in regression analysis do not necessarily mean, that the policies under investigation are unnecessary or without intended influence at all.
Finally, quantitative impact assessment has a general methodological shortcoming, as it does not include side effects. However, Phare and pre-accession aid can be expected to have a
107 Throughout the whole analysis only for the smaller countries policy indicators are given for NUTS 3 regions, i.e.
for the Baltic countries, Slovenia and Slovakia. Policy indicators for the larger countries have been calculated only on NUTS 2 level, as of methodological problems. See methodology section 'Spaces and Spatial Levels under Consideration'.
108 For more information see the methodology section.
109 For the rationale of time lags, especially with regard to public spending see for instance Dornbusch, Fischer (1989: 437-444).
110 For a comparison of respective intervention levels see e.g. Kujath, Kunkel, Zillmer (2003: 63-64, 111-130) and Nordregio (2003: 82-83).

104
number of such side effects in both, institutional and financial terms. Consequently, these effects would have to be included for an impact assessment of the EU policies under consideration. Nonetheless, the necessary separation of these national and regional effects is not feasible for the whole space of the New Member States' and Candidate Countries' territory. That's why they have to be remembered for appropriate conclusions and the development of policy recommendations but cannot be distinctly included in the impact assessment.
The results of the most important steps of the quantitative impact analysis methodology described above will be discussed in the following sections on the basis of the above updated pre-accession aid111 spending overview on national and regional level. In the first step, pre-accession aid spending is related to the respective potentials at the beginning of the observation period, as far as respective data is available. A mathematical formulation of these relations is given by so-called double indicators, as described in the methodology section above. These are used for the next step in the below provided assessment, i.e. in terms of the change of the potential indicators, and thus, the double indicators. This allows to relate the policy input of a specific period to the respective potential indicators' changes over the same period, though not giving an analytical relationship. In further preparation of the impact assessment, the change of regional economic performance in relation to total pre-accession aid spending is depicted. This section then sums up with first results on correlation and regression analyses differentiating between different policy objectives as far as possible. However, as many necessary secondary data of the ESPON data base for the whole impact assessment has only become available in the course of the month before deliverance of this report, this part of the analysis could not be finished in time. Consequently, only first preliminary regression results will be included at this stage and further results, especially reviews and improvements are foreseen for the final report.
Within the following subsections, as far as different potentials are under consideration, special reference will be made to the labour market potential, as of two reasons. First, for the labour market potential two different quantitative indicators are available, which allows for a more comprehensive analysis with respect to this rather than the other potentials. And second, although most countries have spent comparatively low shares of their pre-accession aid funds on improvements of the labour market potential, this seems to be of importance for the developments under the Lisbon and Gothenburg strategies. Furthermore, the more detailed provision of the results for one potential also allows for better understanding of the remaining output shortly described for which the maps and charts are mostly provided in the Annex. Apart of the explanatory maps and charts only those, which are particularly distinctive will be included in the main part of the report.
Relation between Phare / Pre-accession Aid Spending and Potentials
As of the quite differing intervention levels between the countries under investigation, location quotients of policy intervention are mapped with the potentials rather than spending related to regional GDP or per inhabitant. These quotients point out, whether a region has received below, above or about average pre-accession aid spending for the respective potential as related to national average spending on the respective priority. Consequently, the corresponding maps point out, whether regions with one or another potential received the matching pre-accession aid or regions showing a respective bottleneck. Thus, these maps suggest whether pre-accession aid allocation is used for improvement and utilisation of existing potentials or aims at the reduction of existing bottlenecks.
In addition, these relations are also provided in charts giving the exact figures of the respective potential and policy indicator values. This different graphical presentation allows other and more detailed insights into the policy-potential relation. This way, it becomes e.g.
111 In the following, for simplification reasons often only pre-accession aid is mentioned, however, referring to both,
pre-accession aid and Phare.

105
more obvious in how far specific kinds of regions, such as Western border regions, receive similar support and how each country's allocation differentiates between different kinds of regions within the country's territory. Furthermore, the depiction of the regional share of pre-accession aid addressing one or another potential in percentage of total regional pre-accession aid also allows for an international comparison of regional priorities.
Labour Market Potential
In below map and charts, the labour market potential is depicted in terms of the Human Capital Index (HCI), as developed by Derenbach (2002) and in terms of the active population, each at the beginning of the observation period for the pre-accession aid allocation.112 As far as possible, the potential is depicted for the beginning of the observation period, in order to relate policy initiatives to the initial regional situation. The policy allocation is also measured by two slightly different indicators. The percentage allocation addressing labour market potential improvements as share of total regional allocation reveal the regional priorities in international comparison. In contrast, the respective location quotients show which regions within a country have received above or below average national allocation with respect to the labour market potential.
112 In case of the HCI data from 1999 instead of 1998 have been utilised, since the 1998 data have not been widely
available for the New Member States and Candidate Countries.

106
Map 8-3: Location Quotient of Pre-Accession Aid addressing the Labour Market between 1998 and 2000 and the Human Capital Index 1999

107
Chart 8-1: Human Capital Index 1999 related to (a) Location Quotient of Pre-Accession Aid addressing the Labour Market between 1998 and 2000 and (b) % of Pre-Accession Aid addressing the Labour Market as Share of Total Regional Pre-Accession Aid between 1998 and 2000
0
1
2
3
4
5
6
7
8
10 15 20 25 30HCI 1999
Loca
tion
Quo
tient
for P
AA
add
ress
ing
Labo
ur
Mar
ket
CZHUEELTLVPLROSISK
0,00
5,00
10,00
15,00
20,00
25,00
30,00
10 15 20 25 30
HCI 1999
% P
AA
add
ress
ing
Labo
ur M
arke
t of t
oal R
egio
nal
PAA
CZHUEELTLVPLROSISK
Source: IRS calculation, ESPON Database, Newcronos
108
The charts reveal a more differentiated indication of PAA and HCI values rather than the map, however, spatial location is more easily noticeable in the map. Therefore, both kinds of presentation have been selected. Map 8-3 as well as the related charts clearly show, that the majority of regions has not received any respective PAA for the period under consideration. In this respect PAA has mainly been allocated to regions with medium to relatively high – for these countries – HCI levels. However, this does not suggest an orientation towards the utilisation and support of existing human capital potentials. For most countries, the HCI varies only little if at all between regions113, while differences between countries are stronger114. Few regions have received a far above national average allocation for support of the labour market, among them in Slovenia especially some border regions to the EU 15 and in Slovakia the Eastern regions. This differentiation already indicates the varying spatial concentrations of the different countries.
With regard to the active population density Map 8-4 shows, that the regions with the highest density, usually the capital regions of the respective countries, have received little or none PAA addressing the labour market potential. However, among the remaining regions with lower active population density than in the capital regions, no distinction is possible.
Overall, these maps and charts also stress the significant differences in regional PAA labour market allocation variation between countries. For example in Poland a medium variation in PAA allocation coincides with relatively high variance of HCI levels and differences in population density. Highest labour market support through PAA has been allocated to the Eastern Polish border regions, which show relatively low HCI levels and are mostly among the Polish regions with the lowest active population. For instance in the Czech Republic PAA variation addressing the labour market has been much lower with hardly any potential differences concerning the HCI. But even within the smaller funds' variation, also in the Czech Republic it tended to be higher in the regions with the lowest active population density. In contrast for example in Latvia, only one region has received such funds, which is the capital region Riga. Though HCI differences could not be measured on NUTS 3 level, the labour market potential tends to be higher in this region than in the remaining territory of Latvia, as indicated by the active population density.
113 As the data with which the HCI has been calculated are only available on NUTS 2 level, no respective deviation
for Slovenia and the Baltic countries could be observed.
114 For the methodological difficulties of measurement of education levels between countries see Kujath, Kunkel, Zillmer et al. (2003: 145).

109
Map 8-4: Location Quotient of Pre-Accession Aid addressing the Labour Market between 1998 and 2000 and Active Population Density 1998
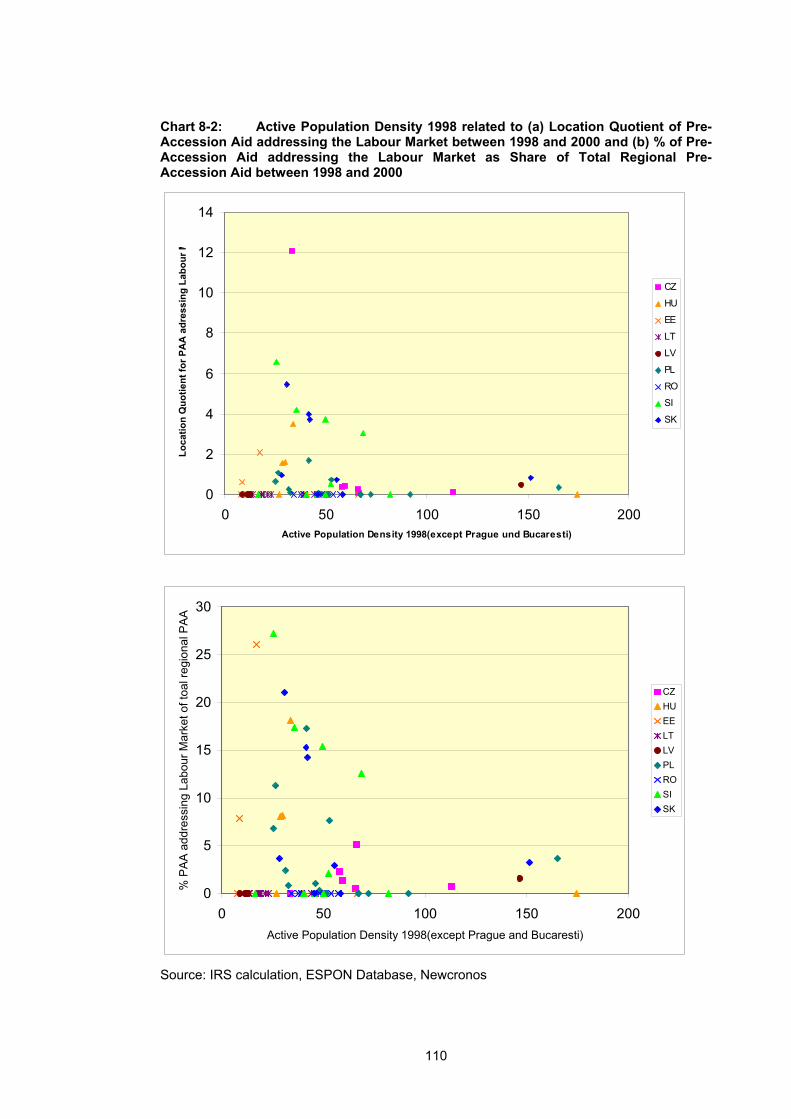
110
Chart 8-2: Active Population Density 1998 related to (a) Location Quotient of Pre-Accession Aid addressing the Labour Market between 1998 and 2000 and (b) % of Pre-Accession Aid addressing the Labour Market as Share of Total Regional Pre-Accession Aid between 1998 and 2000
Source: IRS calculation, ESPON Database, Newcronos
0
2
4
6
8
10
12
14
0 50 100 150 200Active Population Density 1998(except Prague und Bucaresti)
Loca
tion
Quo
tient
for P
AA
adr
essi
ng L
abou
r M
CZ
HU
EE
LT
LV
PL
RO
SI
SK
0
5
10
15
20
25
30
0 50 100 150 200Active Population Density 1998(except Prague and Bucaresti)
% P
AA
add
ress
ing
Labo
ur M
arke
t of t
oal r
egio
nal P
AA
CZHUEELTLVPLROSISK

111
These comparisons point out the varying concentration on either social or in other case more competitive oriented objectives between the countries. Furthermore, in most cases high levels of HCI coincides also with other potentials like high population density and relatively high accessibility. Therefore, in cases where policies addressing the labour market have focused on capital regions, like in Latvia – even though to a small extent – they tend to support the utilisation of overall potential provision. In contrast, where these measures have targeted regions with low HCI and/or low active population density, like in Eastern peripheral regions, these bottlenecks often coincide with other bottlenecks as well resulting in tendency in little if any economic effects as will be shown further below.
Capital Potential
As no better indicator for the regional capital potential is available, the regional GDP per capita has been utilised, to provide at least some insight into this potential, which is particularly important for business development. However, as the commercial banking systems still have been in their development process, it can be assumed, that regional capital availability, at least at the end of the 1990s, still, has been dominated by the region's own capital rather than interregional and international financial transfers. In particular, this holds for rural and peripheral regions, while for the capitals of the New Member States and Candidate Countries this can not be assumed to hold as of their stronger involvement in the international economy.115
The corresponding map and charts in Part III (Annex) again show different priorities between the countries. In this case, for instance Slovenia provided this support mainly in poorer regions, where the highest priority was given to a Western border region, which mostly have specific potentials as compared to other rural regions in the New Member States. Somewhat striking is the distribution of this priority's funds in Hungary. While overall very little percentage of regional pre-accession aid has been directed to the capital supply, in Hungary's Western border region, which has the second highest income level, relatively much more funds have been directed improvements in the regional capital supply. This is likely to support the specific situation for business development in this region, as it tends to have higher potentials as most other regions in Hungary with the exception of Budapest. At the same time, this concentration supports a polycentric development in the sense that potentials outside the capital regions tend to be utilised and encouraged. In a similar way, the spatial concentration of these regional measures in Poland also tend to support regions surrounding the Western urban agglomeration of Poznan, which represents kind of a counterweight to the capital Warsaw.
Regional Market Potential
Measures for the regional market potential, though not many regions at all have spent funds on this issue, do not seem to be related to the market potential in terms of population density at all (see respective map and charts in Annex). However, especially high shares concentrate on different kinds of peripheral regions. E.g. in the Czech Republic basically Western and Eastern border regions tackled this potential most strongly. Thus, this potential has been dealt with in regions which either have a specific potential in this respect from their spatial closeness to EU 15 markets or regions which are relatively densely populated due to their location in the old industrialised areas of the Eastern parts of the Czech Republic. Despite the structural problems, these regions, as of their old industries, offer other potentials which are significantly higher than in the more peripheral regions.116 Also in Bulgaria the more peripheral regions as related to both, the national centre of economic activity and the borders to the EU 15, have received more support for improvements of their regional market potential
115 For restrictions of capital supply in rural regions see e.g. Arndt (1998), p.146-152 and European Commission
(1991)
116 See also Kujath, Kunkel, Zillmer et al. (2003: 142-173).

112
than the more central regions of the South. Yet, these Bulgarian regions suffer of numerous other bottlenecks, questioning the sustainability of these measures, especially as in total only very few regional projects have been conducted in these regions during the period under consideration, leading to high shares for funds' allocation to the regional market potential. To sum up, in total, very little money has been spent in these particularly poor and sparsely populated regions. This raises the question, in how far these quite limited projects can actually reduce bottlenecks to such an extent, that growth impulses occur.
Urbanisation and Localisation Advantages
As in the second interim report of ESPON project 2.2.2, urbanisation potentials are indicated by sector employment shares (Kujath, Kunkel, Zillmer et al. (2003: 173-176)).117 Like the other priorities of pre-accession aid, also these measures show a high variation between the countries. This coincides with particularly high variations of sector employment in agriculture and to a lesser extent in the service sector, between countries but also within some countries between regions118. Particularly striking is this feature for the Romanian regions, which, apart of the capital region, are among the highest shares of agricultural employment in all countries, with only some few Polish regions of nearly as high agriculture shares (see respective maps and charts in Annex). At the same time, Romania has not spent any regional funds on this potential at all. From the point of view, that these regions not tend to show many potentials and the availability to transform respective funds into sound development, this allocation is not inefficient. Yet, these regions tend to fall further behind without support for their sectoral restructuring.
Also Poland is a country largely still dominated by agricultural employment in the late 1990s. In most regions with particular high agricultural employment shares, some priority was given to this potential with respective pre-accession aid allocation. Yet, these regions all concentrate in the Eastern peripheral parts of Poland, where little other employment opportunities outside agriculture and simple services have developed. As of the low population and active population density, combined with other bottlenecks, these measures are not likely to have a severe effect on structural employment in these regions. An important exception to this pattern is the respective allocation in Silesia. Here, it is not agricultural but industrial restructuring, which these initiatives aim at. Due to the different economic structure and the potentials available in Silesia as compared to the Eastern peripheral regions, these measures, if implemented appropriately, can lay the basis for long-term restructuring and development in the region.119 This the more, as Silesia is located closely to one of the development axis of the triangle identified in the second interim report of ESPON project 2.2.2. Similar relations can be expected from the respective pre-accession aid spending in Bratislava and, to a lesser extent, in the North-Eastern Hungarian region Észak-Magyarország.
Geographical Position
Apart of most capital regions in the New Member States and Candidate Countries, Slovenia and large parts of the Czech Republic show the highest potential of geographic position measured as multimodal accessibility (ESPON project 2.1.1). However, this accessibility indicator not only relates to the respective countries transport infrastructure but is strongly influenced by the spatial location in relation to the economic centre of the EU 15 (Pentagon). Thus, no region in the New Member States or Candidate Countries could achieve very high accessibility. At the same time Slovenia and the Western parts of the Czech Republic are
117 As of the very limited number of comparable variables, other indicators also used in the second interim report for
more than one potential, here are only related to potentials other than urbanisation and localisation advantages.
118 Interregional differences within one country can only be recognised for those countries, which are analysed only on NUTS 2 level, since these employment data are not available for the NUTS 3 level.
119 See also the analysis of respective case study in below section 8.4

113
those regions of the countries which are located most closely to the Pentagon as compared to the other regions of the New Member States and Candidate Countries.
The respective charts and map (Annex) show a concentration of regional projects improving the geographic position especially through transport infrastructure projects. Interestingly, especially regions with a comparatively high accessibility, like the region surrounding the Czech capital, the region encompassing Budapest and also Mazowieckie Voivodship in which Warsaw is located, have put extremely high emphasis on this potential, spending nearly all or total regional funds on improvements of regional transport infrastructure. These investments obviously aim at improvements of the capitals' connection with their surroundings. This way, utilisation of potentials available in this type of region can be improved, further enhancing growth and restructuring not only in the capitals but in their neighbourhood as well.
While for the peripheral regions (medium accessibility in the respective map in the Annex) respective pre-accession aid varies between zero and one hundred percent of regional allocation, thus showing very different regional priority, the most peripheral regions (low accessibility) have spent predominantly lower shares, and in relation to national priorities mostly below average funds (see respective chart in Annex on the location quotient) for improvements of the geographic position. In addition, many of these measures in the most peripheral regions certainly represent small improvements for local living standards but are not likely to contribute to regional development in terms of enhancing economic activity. In contrast to these infrastructure projects close to urban centres, in the peripheral regions they are more dominated by local rather than regional infrastructure projects.
To sum up across all priorities presented in relation to different potentials, but also in the frame of overall potential analysis, pre-accession aid allocation for the reference period shows an extremely wide variation not only in terms of total or relative amounts spent in the regions but also with regard to the different priority setting. At the same time these allocations correspond to different respective and overall potential provision. While there are regions, in which potentials seem to have been supported in a way that development impulses could be expected, there are also many cases in which these measures are more likely to represent social transfers which can not be expected to provide for development stimulus, especially as of the particularly low development level of many of these regions together with the quite low level of intervention in money terms.
Change of the Relation between Phare / Pre-accession Aid Spending and Potential Indicators
A changing relation between the policy input and the potential indicators can only be calculated for those cases, in which potential indicators are available for at least two appropriate years on a comparable basis. In order to avoid simplification, these changing relations are depicted in charts and provided as exact figures in double indicators in tables rather than only in groupings of maps. Again, these different kinds of results provision on the basis of differently related pre-accession aid allocation allow for varying insights also with regard to the different spatial levels.
Nevertheless, these results do not give an impact assessment in a way that changes in potential values can be attributed to the respective pre-accession aid allocation. Instead, this presentation aims at showing the dynamics of those potential developments for which corresponding time series data has been available.
Labour Market Potential
The charts and map of the changing HCI in relation to pre-accession aid addressing the labour market potential do not show any relation whatsoever (see respective map and charts in Annex). There have been regions with no or only little corresponding pre-accession aid allocation where the HCI has increased, while in other regions decreases occurred in spite of funds allocation to human resource development. In some cases the former coincide with

114
central urban agglomerations but also more peripheral regions can be found in this group. The latter again contains different types of regions. These findings can be due to several influences. First, measures addressing human resources not necessarily translate into higher education levels as measured by the HCI within the period of time for which data is available, either because human resources are addressed in other ways not affecting the number of the population with secondary and/or tertiary education or because, as for instance in the case of university education, the observation period is too short. Second, migration flows can influence the HCI negatively despite achievements in improvements of education facilities, which could e.g. be the case for Prague and its surrounding region, where the latter has suffered decreasing HCI and in the former it has slightly increased. Finally, the natural change of the composition of the work force also attributes to HCI changes.
Somewhat different seems the picture for the change of the active population density during the observation period. Very few regions which have spent above national average pre-accession aid funds on the labour market potential have experienced decreasing active population densities (see Chart 8-3 and Map 8-5). And if it actually decreased than to small amounts only, actually mostly in Slovenia. Especially in the respective Slovakian regions the active population density has increased, also in the Eastern peripheral regions. However, for instance in Hungary, active population density has mostly increased in the capital region with the highest potentials in general, without pre-accession aid spending on human resources.

115
Map 8-5: Location Quotient of Pre-Accession Aid addressing the Labour Market between 1998 and 2000 and the Change of the Active Population Density between 1998 and 2001

116
Chart 8-3: Change of the Active Population Density between 1998 and 2001 related to (a) Location Quotient of Pre-Accession Aid addressing the Labour Market between 1998 and 2000 and (b) % of Pre-Accession Aid addressing the Labour Market as Share of Total Regional Pre-Accession Aid between 1998 and 2000
Source: IRS calculation, ESPON Database, Newcronos
0
2
4
6
8
10
12
14
-30 -20 -10 0 10 20Change Active Population Density 1998-01
Loca
tion
Quo
tient
for P
AA
adr
essi
ng L
abou
r Mar
ket
CZHUEELTLVPLROSISK
0
5
10
15
20
25
30
-30 -20 -10 0 10 20Change of Active Population Density between 1998 and 2001
% P
AA
adr
essi
ng L
abou
r Mar
ket o
f tot
al R
egio
n
CZ
HU
EE
LT
LV
PL
RO
SI
SK
117
Correspondingly does the calculation of the double indicator changes, as provided in the respective table in the Annex, provide negative signs for the Slovakian regions while the picture is quite mixed in Poland, where regions with this kind of pre-accession aid allocation have increased their active population density in different parts of the country representing different types of regions, while other regions have suffered decreases in active population density, though with one exception to smaller extents as related to their pre-accession aid spending. Interestingly, in the Czech Republic only the double indicators for the two Western border regions indicate slight increases in their active population density, while all other Czech regions including the capital and the surrounding regions experienced at least slight losses in this respect. This could indicate first moves towards the utilisation of special potentials of Western border regions.
Capital Potential
Again the charts and map depicting the change of per capita GDP between 1999 and 2001120 in relation to the pre-accession aid spending addressing the regional capital supply do not indicate a positive or negative relation (see Annex), neither when illustrating relative nor absolute per capita GDP changes. Nearly all regions in the New Member States and Candidate Countries have experienced growth of per capita GDP over the observation period. Percentage growth has been highest mostly in the regions and countries which have started at relatively lower income levels than the other countries under examination, i.e. many Romanian and Bulgarian regions.121 Nevertheless, these countries spent smaller shares of their regional pre-accession aid on improvements of the capital supply, while regions with smaller percentage GDP growth often have spent higher share of their regional pre-accession aid on this potential. This might indicate, that in the poorer regions of these countries, there are primarily other bottlenecks hampering regional development rather than just capital supply.
Yet, also within the countries who have directed parts of their regional pre-accession aid toward improvements of the capital supply, for instance Poland, Slovakia and Slovenia no observable relation occurs. Thus, also in these countries, limitations to economic growth tend to be determined by other factors than the capital supply, though this certainly represents a bottleneck to many regional activities. But depending on the various structures in these different regions and countries other characteristics hamper growth and thus cohesion. In many rural regions, also in these countries, one such bottleneck is the employment structure, there often still dominated by agriculture.
Regional Market Potential
For the regional market potential quite varying developments as compared to the corresponding pre-accession aid spending can be observed. For instance the Western border regions of the Czech Republic have put quite some emphasis on this potential. However, despite these interventions and other positive developments they have not been able to avoid some loss in their population density and, thus, in an important indicator for the regional market potential. Nevertheless, at least in the short run, this might not hamper these regions' development potential, as due to their spatial closeness to the EU 15 territory, their regional market potential is also connected with the bordering regions in Germany. Yet much stronger decreases in the population density have occurred in the Czech capital, mostly at the benefit of the surrounding region. At least partially, this can be attributed to increasing prices in Prague, hence showing typical signs of sub-urbanisation as typical for Western metropolitan areas. Also in Slovenia, though without respective interventions of pre-accession aid, the capital region had highest losses of population density during the observation period.
120 By purpose the GDP values have been taken for one year following the observation period, to take at least as
much account of time lags as possible.
121 Anyhow, in absolute figures, most of these regions with high percentage growth are outnumbered by wealthier regions in the New Member States, whose percentage growth is only lower as of the higher reference values.

118
Finally, investigating these figures for Slovakia, it turns out, that the regions with the highest priority for regional market interventions also had the highest increases in regional population density. However, these regions are located in the East at the external EU 25 border, which hint at the existence of other achievements in these regions. Actually, in these regions reductions in agricultural and old industry employment have been set off by service employment development. Also increasing an HCI, significant increases in the active population density suggest not only for declining employment opportunities in agriculture and industry but for new employment opportunities in the tertiary sector. Depending on the kinds of dominant services and their developments this could found a basis for additional economic activity on the basis of existing potentials, though they certainly still could be enhanced, for instance with regard to the geographical position.
Urbanisation and Localisation Advantages
While there has been a general tendency for increasing shares of tertiary employment and corresponding decreases in industrial employment in most regions of the New Member States and Candidate Countries, the development of agricultural employment shares is more diverse (see respective maps and charts in Annex). Especially in Romania the primary sector's employment has gained further weight in nearly all regions, albeit the already particular dominance of this sector in the mid 1990s. This yields anything but improving potentials with regard to urbanisation. Furthermore, such developments are likely to also affect other potentials negatively as of the quantitatively and qualitatively limited employment opportunities in the respective regions, West Romania (Siebenburgen) being an exception in Romania.
Yet, also in Poland similar increases in agricultural employment shares could be observed for the observation period, though only for a few regions. Here, these developments have occurred despite partially considerable priority setting on corresponding pre-accession aid interventions and they can be based basically upon two argumentations. First, some old industrialised regions have suffered from such developments, which can basically be attributed to the breakdown and severe restructuring of the old industries, by far not completed in the late 1990s. And second, the Eastern peripheral and largely rural Polish voivodships, along the new external EU 25 border, also experienced growing importance of agriculture for employment at the loss of both, industrial and tertiary employment, and despite policy interventions in this field. In these regions many bottlenecks rather than potentials have to be recognised implying a lack of employment alternatives.
Nevertheless, also in countries where generally decreasing agricultural employment as share of total employment could be observed, the development seems to be independent from respective intervention levels, as can be seen from the data for the Hungarian regions in the corresponding charts.
Summing up, for none of the potentials which could be included in the dynamic view of the analysis, straight forward results occurred. Instead, these views make even clearer how the different potentials and characteristics of a region, whether quantitative or qualitative, together form the regional performance. This way it becomes also even more obvious that pre-accession funding has been too small to identify a general territorial impact assessment, especially when differentiating between NUTS 3 regions. Nevertheless, the following sub-section provides an overview of the relation between regional pre-accession aid spending and the changing economic performance. This way, the mostly quite small regional potential oriented interventions are aggregated to somewhat more influential amounts.
Total Phare / Pre-accession Aid Spending Related to Change of Economic Performance
Total pre-accession aid spending can be related to the change of economic performance in different ways. A country by country relation of regional pre-accession aid spending on per capita basis as compared to GDP per capita levels of different years allows to stress how

119
much pre-accession aid has been spent in a given period in which region and simultaneously indicating whether regions with relatively high support levels have gained more or less GDP per capita growth than regions with lower EU funds' allocation. Furthermore, a corresponding typology relating the policy spending to the change of economic performance can provide summarising results for these developments.
However, this sub-section starts with an overview on the initial situation between regional pre-accession aid spending and GDP per capita levels to make clear how the regions have been related to each other. On this basis the regions' developments can be investigated as described above for both, income and unemployment changes. Generally, policy interventions of the EU aim at social and economic cohesion and are based on the theoretical assumption, that the allocation of public funds can influence economic growth implying, ceteris paribus, higher growth in terms of income and employment the higher the public fund allocation.122 Thus, theoretically, growth should be higher in regions with relatively high pre-accession aid allocation and unemployment should be either decreasing more or at least increasing less than in regions without or with little pre-accession aid.
Mostly, the regional share of pre-accession aid of national allocation tends to increase with regional income level as indicated in Chart 8-4. With the exception of the Czech Republic – whose graph is dominated by the low intervention level in Prague – and to a lesser extent Slovenia and Estonia, all other countries seem to have allocated higher funds to the wealthier regions as can be indicated by potential and exponential curves of this relation, though differences are not significant in most cases.
Chart 8-4: Percentage of Regional Pre-accession Aid Spending between 1998 and 2000 as Share of National Pre-accession Aid in Relation to Regional GDP per capita in 1998
0
5000
10000
15000
20000
25000
30000
0 5 10 15 20 25 30
% PAA in region of national PAA
GD
P/ca
pita
PPS
199
8
BGCZHUEELTLVPLROSISK
Source: IRS calculation, ESPON Database
But this does not answer the question yet, whether regional performance has increased in the regions with comparatively high levels of pre-accession aid intervention or the other way round. To shed some light on this question, the following charts provide insights for the development of regional per capita GDP and unemployment rates as related to regional pre-accession aid. For comparability reasons, the reference period for the pre-accession aid allocation is once again 1998 to 2000. As for the time lags to be expected in their effects on
122 See for instance Dornbusch, Fischer (1989: 92-90) or more generally on models for public expenditure Brown,
Jackson (1990: pp.118)

120
GDP per capita and unemployment rates, the latest available secondary data has been utilised for the presentation, i.e. 2001 for the GDP per capita data and 2002 for unemployment rates123. To exclude country specific influences on the development of these general economic indicators, e.g. due to different extents of spatial focus, institutional framework or changes in purchasing powers, these developments are provided on a country by country basis rather than a cross-country comparison.
The three examples provided in Chart 8-5 illustrate quite different relations of regional per capita GDP development in relation to total regional pre-accession aid allocation124. At first sight, in Bulgaria theoretical grounds for public funds' allocation seem to be confirmed by the empirical data – at least for the GDP per capita125 – as the region with the highest intervention level has experienced by far the highest growth rate, while the only NUTS 2 region without regional pre-accession aid funding is the only Bulgarian region with income decrease. This is complemented by the corresponding charts for the development in the Czech Republic and Poland. In the former there occurs a negative relation with growth being lower in the regions with higher pre-accession aid allocation, thus contradicting the theoretical reasoning, and in the latter there does not seem to be any relation at all, as in the Polish chart the difference between the potential curves for the two different years neither growths nor shrinks with increasing regional pre-accession aid spending.
Chart 8-5: Change of GDP per Capita (PPS) between 1998 and 2001 related to the Regional Pre-accession Aid Share of National Pre-accession Aid in Percentage for (a) Bulgaria, (b) the Czech Republic and (c) Poland
Bulgaria
0
1000
2000
3000
4000
5000
6000
7000
8000
9000
0 2 4 6 8 10 12 14
% regional PAA of national PAA
GD
P /c
apita
PP
S
1998
2001
Exponentiell(1998)Exponentiell(2001)
123 The initial values of GDP per capita and employment rates should correspond to the beginning of the reference
period, however, unemployment data – comparable with the 2002 data – has not been available for 1998 but 1999 only. That is why the 1999 data is used here for reference.
124 No matter, whether the regional shares of pre-accession aid as percentage of national pre-accession aid, total regional pre-accession aid funds or pre-accession aid in percentage of regional GDP per capita etc. is taken as reference, the general outcome of the analyses is not affected.
125 Unfortunately, for Bulgaria no comparable unemployment data is available as the data for the reference year is lacking.
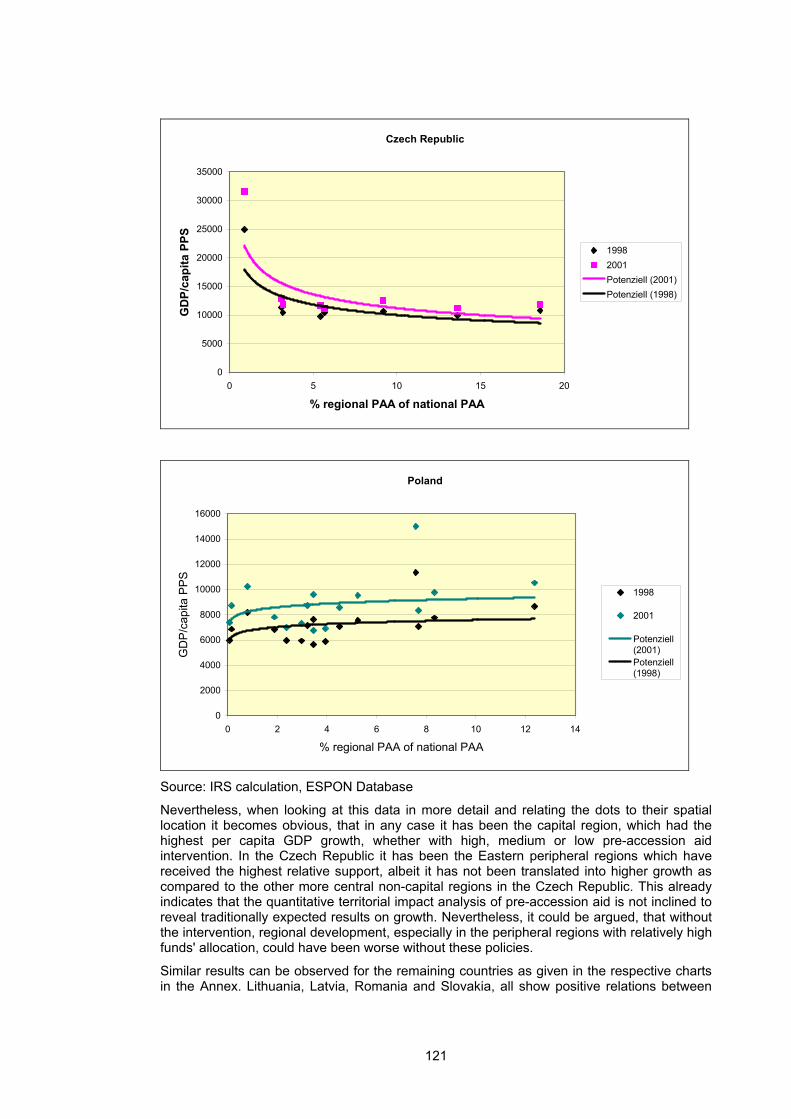
121
Czech Republic
0
5000
10000
15000
20000
25000
30000
35000
0 5 10 15 20
% regional PAA of national PAA
GD
P/ca
pita
PPS
19982001Potenziell (2001)Potenziell (1998)
Poland
0
2000
4000
6000
8000
10000
12000
14000
16000
0 2 4 6 8 10 12 14
% regional PAA of national PAA
GD
P/c
apita
PP
S
1998
2001
Potenziell(2001)Potenziell(1998)
Source: IRS calculation, ESPON Database
Nevertheless, when looking at this data in more detail and relating the dots to their spatial location it becomes obvious, that in any case it has been the capital region, which had the highest per capita GDP growth, whether with high, medium or low pre-accession aid intervention. In the Czech Republic it has been the Eastern peripheral regions which have received the highest relative support, albeit it has not been translated into higher growth as compared to the other more central non-capital regions in the Czech Republic. This already indicates that the quantitative territorial impact analysis of pre-accession aid is not inclined to reveal traditionally expected results on growth. Nevertheless, it could be argued, that without the intervention, regional development, especially in the peripheral regions with relatively high funds' allocation, could have been worse without these policies.
Similar results can be observed for the remaining countries as given in the respective charts in the Annex. Lithuania, Latvia, Romania and Slovakia, all show positive relations between
122
pre-accession aid spending and GDP per capita growth, though only to slight extents. Yet, in all these countries the capital region has received the – more or less – highest share of regional pre-accession aid. In addition, especially the Slovakian chart points out the dominance of the capital regions in these countries in terms of regional growth, as even the immediate neighbouring NUTS 3 region to Bratislava with similar high intervention level of pre-accession aid has experienced hardly any growth during this period, while on the other end with very little regional shares of pre-accession aid allocation the region most centrally located had the best growth performance among this group. Finally, Estonia, Hungary and Slovenia again are examples for negative or non-existing relations in this context. And once again, these results are dominated by the growth of the respective capital regions126, which have received less regional funds in terms of their national allocation than in the other countries mentioned before.
All these results strongly indicate for the necessity of combined provision of a number of potentials, which only in their grouping can stimulate sustainable growth. Thus, to achieve growth in the New Member States and Candidate Countries, first one or several regional bottlenecks need to be transformed into potentials before they do not further hamper regional development. Unless this is achieved, public investments occur as mere transfers in these regions rather than productive support. However, such stipulation would need immense amounts of respective funding, neither available on regional, national nor EU level. Therefore, continuous expansion from existing agglomerations through slow but sustainable spatial spreading out of public investments tend to achieve the best results for macro-level cohesion and, in this case also for competitiveness. On meso-level this tends not to decrease spatial disparities for the time being, however, differently allocated spatial interventions tend to affect social transfer volume rather than productive interventions, as explained above.
Furthermore, these results are complemented by a policy oriented typology, which relates pre-accession aid spending for the same reference period as above to the change in economic performance. The latter is, however, measured in relative terms with the EU 15 index representing the reference point rather than in absolute terms of GDP per capita growth. This implies for some countries, that growth in non-capital regions appears to be higher than in their capital regions, though in absolute terms this does not hold as above analyses showed, hence leading to increasing rather than decreasing divergences between the regions of one or another country. Nevertheless, on the macro-level Map 8-6127 also points out, that for instance in Poland, Hungary, Latvia and Slovenia above EU 15 average relative growth has occurred in the capital regions and in some cases their neighbouring regions, despite their low levels of regional pre-accession aid intervention. Few other regions in the New Member States, mostly Western border regions, and none in Bulgaria and Romania could achieve similar income growth rates, despite their countries' relatively low income levels as compared to EU average, with the possible exemptions of Cyprus and the Czech Republic. Yet, the results suggest even in relative terms only average to below average EU 15 income growth in the remaining regions, independently of the intervention levels of pre-accession aid and hence implying simultaneously increasing divergence on the macro-level.
126 Though for Slovenia it is not the capital but the neighbouring region of Osrednjeslovenska.
127 This typology has been developed on comparative basis to the respective typology of ESPON project 2.2.1 on the Structural Fund spending in relation to the change of economic performance in the EU 15. That is, why EU 15 index has been chosen as reference (see also footnote 128).
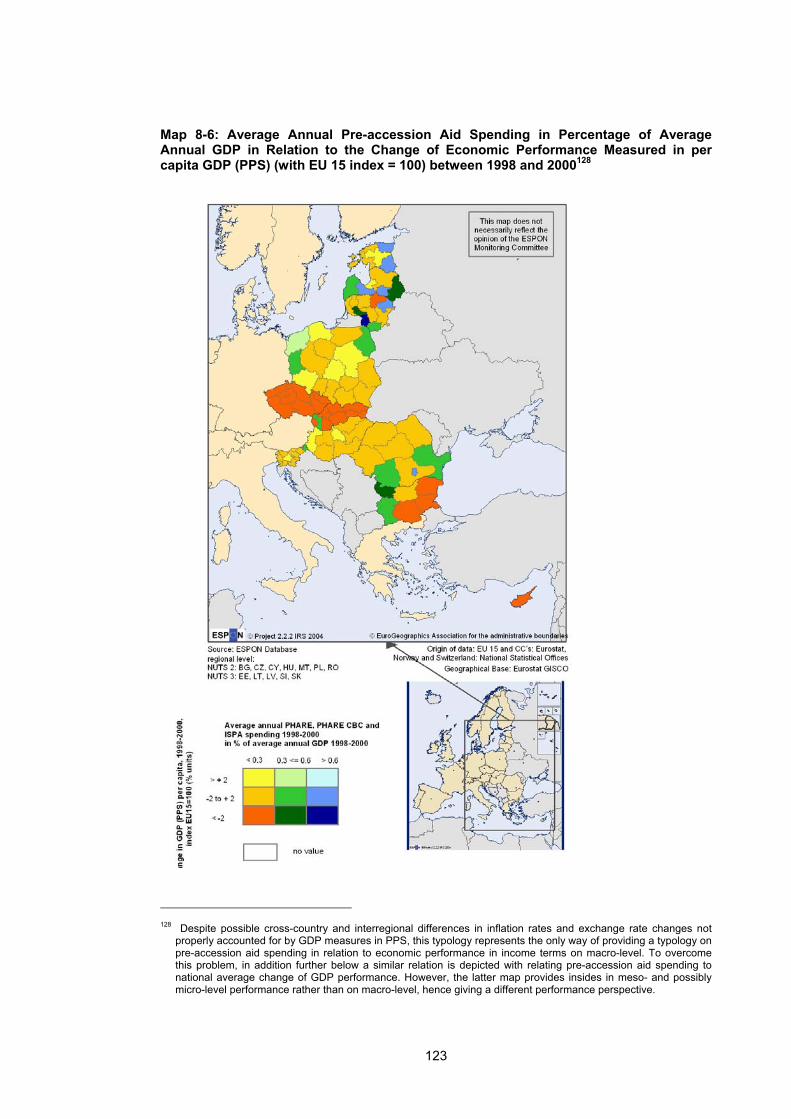
123
Map 8-6: Average Annual Pre-accession Aid Spending in Percentage of Average Annual GDP in Relation to the Change of Economic Performance Measured in per capita GDP (PPS) (with EU 15 index = 100) between 1998 and 2000128
128 Despite possible cross-country and interregional differences in inflation rates and exchange rate changes not
properly accounted for by GDP measures in PPS, this typology represents the only way of providing a typology on pre-accession aid spending in relation to economic performance in income terms on macro-level. To overcome this problem, in addition further below a similar relation is depicted with relating pre-accession aid spending to national average change of GDP performance. However, the latter map provides insides in meso- and possibly micro-level performance rather than on macro-level, hence giving a different performance perspective.

124
Naturally, the regions within the New Member States and Candidate Countries, which have had an above average growth performance in terms of average EU performance between 1998 and 2000 also show an above average performance in terms of national GDP growth, as can be seen from a comparison of Map 8-6 with Map 8-7. In addition, this illustration allows for more inner-country differences, showing for all countries regions with both, above and below national average growth. It turns out, that additionally to the Lithuanian region, which showed also on macro-level a below average performance combined with relatively high pre-accession intervention level, also Bucharest and the Southern Latvian region neighbouring its capital region show similar relations on meso-level. However, there are also regions in Estonia and Lithuania, in which relatively high intervention levels of EU funds coincide with above national average growth. Thus, neither on macro-level nor on meso-level, does the intervention level show a clear relation between pre-accession spending level and economic performance. Altogether in the Baltic countries, on meso-level analysis all possible kinds of relations between pre-accession aid allocation and growth performance can be found.
In contrast to the poorest relative performance, in addition to the regions with the best performance on macro-level in terms of the relation between growth and pre-accession aid allocation Map 8-7 identifies for instance Prague and its surrounding region as well as a number of Slovakian regions with above average performance on meso-level. Thus, these regions, albeit their lagging growth as compared to EU average, they could either catch up on national levels contributing to meso-level cohesion despite relatively low regional pre-accession aid allocation, or they strengthened their dominating position (Prague) within the country.
Together, all these findings indicate not only the limitations of pre-accession impacts in quantitative terms as of the quite restricted amount of funds but also the likely role of other aspects affecting the performance as related to EU and national averages.

125
Map 8-7: Average Annual Pre-accession Aid Spending in Percentage of Average Annual GDP in Relation to the Change of Average National Performance Measured in Percentage Growth of per capita GDP (PPS) between 1998 and 2000

126
Before finally turning to the impact analysis in the context of correlation and regression analyses, these results shall be further investigated with regard to the development of regional unemployment rates also as related to regional pre-accession aid spending, since also below impact assessment relays not only on GDP per capita but unemployment rate development as endogenous variables.
Corresponding to the cross-country observations for the initial situation of the relation between pre-accession aid spending and GDP per capita, most countries tended to spend increasing shares of national pre-accession aid the lower regional unemployment in 1999(see respective chart in Annex). Exemptions from this rule are only the Czech Republic and to a much lesser extent Latvia. In these countries regional shares of pre-accession aid allocation have been higher the higher the respective regions' unemployment rates in the reference year. Generally speaking, as according to the Law of Okun high GDP growth occurs together with decreasing unemployment rates (Dornbusch, Fischer 1989: 11-13), one could possibly expect unemployment rates tending to be higher in regions with low income rather than in regions with high income as in the latter it must have grown more strongly after the breakdown of socialism. In Estonia this seems to hold only to a limited extend. As of the exceptional relation for Estonia with respect to GDP per capita distribution, this reveals a somewhat not expected relation between income and unemployment rates.
While GDP has been increasing in basically all regions of the New Member States and Candidate Countries, though to different extents, unemployment rates have increased in the regions of some countries while decreasing in others. However, in the regions within one country, with very few exceptions, development has been in either of the directions. This indicates the role of national influences on labour market developments other than through EU policies or regional potentials. Nevertheless, also the depiction of unemployment rate development with pre-accession aid allocation shows differing relations between the countries as is pointed out in Chart 8-6 for selected countries.
The case of Latvia reveals an expected relation, though to a slight extent only. In Latvia, unemployment has been decreasing generally and to a much smaller extent in the region with hardly any regional pre-accession aid allocation than in the other regions. For the Estonian example no relation between the pre-accession aid allocation and unemployment rate development can be observed at all. Interestingly, while changes in most parts of the country have been rather small between 1999 and 2002, in two regions unemployment has decreased quite significantly, i.e. in Kirde-Eesti with the highest pre-accession aid allocation, and in Kesk-Eesti a region with one of the by far lowest such allocations. This case in point can be enlightened largely by the regional domination of pre-accession aid through one or few environmental projects, which for instance in Kirde-Eesti implied high pre-accession aid shares which are not really related to economic development but environmental improvements.
Contrasting these observations, Romania has faced increasing unemployment throughout the period under examination. Additionally, it has increased the more the higher regional pre-accession aid has been spent in the region, with the highest increase in the capital region of Bucharest. Keeping in mind, that unemployment rates in Romania have been below average of the New Member States and Candidate Countries in 1999, this development certainly is accounted for by the lagging restructuring process. Furthermore, the still dominating and, during this period, increasing role of agricultural employment in most regions makes clear, why unemployment in peripheral regions does not seem to have been increasing. In contrast to these regions, in Bucharest such a shift to, often subsistence, agriculture has not been feasible for considerable parts of the labour force now unemployed, leading to increasing unemployment rates. Therefore, these occurrences in Romania cannot be attributed to pre-accession aid allocation at all. Nevertheless, the Western region of Romania, largely composed by Siebenburgen, is worth of special interest, as there unemployment has increased much less than in nearly all other regions of this country while, at the same time, the changing composition of the labour forces' sector employment does not indicate a shift back to agriculture but small but noticeable increases in the other sectors, especially in industrial settlement.

127
Chart 8-6: Change Unemployment Rates between 1999 and 2002 related to the Regional Pre-accession Aid Share of National Pre-accession Aid in Percentage for (a) Latvia, (b) Romania and (c) Estonia
Latvia
0
2
4
6
8
10
12
14
16
18
20
0 2 4 6 8 10 12 14
% regional PAA of national PAA
Une
mpl
oym
entra
te
1999
2002
Potenziell(2002)Potenziell(1999)
Romania
0
2
4
6
8
10
12
0 5 10 15 20
% regional PAA of national PAA
Une
mpl
oym
entra
te
1999
2002
Exponentiell(2002)Exponentiell(1999)
Estonia
0
2
4
6
8
10
12
14
0 5 10 15 20 25 30
% regional PAA of national PAA
Une
mpl
oym
entra
te
1999
2002
Potenziell(2002)Potenziell(1999)
Source: IRS calculation, ESPON Database, Newcronos

128
For the remaining countries the corresponding charts in the Annex point out the diversity of trends with regard to the unemployment rate even more. For instance in Poland this development has been quite various, though rates have been consistently rising in all regions. Different unemployment growth does not show a relation to pre-accession aid allocation nor to the type of region, as both old industrial and Eastern peripheral regions are among those regions with lower increases as compared for instance to the prospering capital of Warsaw, the Western border regions or even the, in other respects relatively fortunate and well endowed, region Wielkopolskie around Poznan. In contrast to the Romanian reasoning for shifts back into agriculture, this is only supported to a very limited extent by the observations for the respective Eastern peripheral regions of Poland and for instance in Slovakia, where unemployment has increased in the little funds receiving Eastern regions, observations of other indicators and potentials do not strengthen such a shift to agriculture at all.
All these differences, in this case, with regard to the Eastern peripheral and largely rural regions make clear, that despite their quite limited provision with potentials, still, they have severe structural differences, which also need to take into account and, at least partially, can be attributed to national influences and specifics. Furthermore, the comparison of relations between these two cohesion indicators also stress their differences, i.e. a region prospering in terms of income, thus contributing in the case of the New Member States to macro-level cohesion – while tending to increase divergence on meso- and micro-scale – can be anything but a model in terms of unemployment development. In other words, while one cohesion indicator might indicate cohesion on one or another spatial level the other indicator can indicate a quite different development with regard to the same spatial aim. Consequently, policy recommendations need to take account not only of the different spatial levels but also the differences between these indicators.
Territorial Impact Assessment of Pre-accession Aid Spending with regard to Spatial Objectives – Correlation and Regression Analyses
Both groups of analyses are based on in total 87 regions in the New Member States and Candidate Countries. For consistency and as of data limitations, these analyses have been conducted on NUTS 2 level for Bulgaria, the Czech Republic, Cyprus, Hungary, Malta, Poland and Romania, leaving the Baltic countries, Slovenia and Slovakia for NUTS 3 level analyses. Thus, this spatial differentiation is consistent with the graphical presentations above in charts and maps.
Correlation Analyses
Correlation analyses can be differentiated basically according to two data sets and are correspondingly provided in the respective tables in the Annex. The first correlation set gives an overview over relations between total and potential oriented pre-accession aid spending and different potential indicators as well as their changes throughout the period under consideration. The latter supplements this overview with the respective correlations of potential indicators with economic performance change measured in terms of unemployment change and GDP per capita (PPS) change over the same period. The corresponding definitions of variables including their scaling are given in the corresponding table in the Annex.
Regional pre-accession aid allocation shows highly significant relations with the initial situations of the global economic indicators, i.e. unemployment rate and GDP per capita levels in PPS. The signs indicate increasing funds' allocation the higher the unemployment rate and the lower the GDP in the respective regions. With regard to potential provision, the results show only highly significant coefficients for the qualitative labour market indicator HCI and the multi-modal accessibility potential, which is utilised as indicator for the geographic position. Here, the signs of the coefficients indicate opposite directions of relations. While pre-accession aid seems to concentrate somewhat in regions with relatively high HCI it also tends to concentrate in the more peripheral regions. Hence, these results suggest a regional pre-

129
accession aid allocation during the period from 1998 to 2000, which is more cohesion oriented in terms that allocation has favoured less fortunate regions, often characterised by bottlenecks rather than potentials. Furthermore, these findings for most countries do not indicate strong priorities for the linkages between the major agglomerations and their hinterland with regard to overall pre-accession aid spending, though the result is somewhat different when looking at individual potentials as is shown below. The only likely exception of this general observation represents Slovakia, where pre-accession aid focussed most strongly on Trnavský Kraj, surrounding the capital Bratislava. Nevertheless, as of the low level of EU funds allocated to the more peripheral regions, it can be questioned in how far the respective projects can actually eliminate or at least substantially reduce bottlenecks and thus support regional development. However, it has to be remembered, that these figures apply for the 1998 to 2000 period and that priorities could be changed for the following years, in one or another country, though data so far available does not indicate such shifts129.
The more detailed look at correlation analyses with regard to the different potentials addressed by the various measures, only very few significant correlations with the regional potential provision can be observed. Only the pre-accession aid allocated for improvements of the labour market potential and the geographic position tend to show significant correlations with their respective potential indicator. The latter has a significant correlation with the multi-modal accessibility potential, hinting at the role of macro-level infrastructure projects within this group of measures, which favours the connections between agglomerations, though often neglecting regional (meso- and micro-level) connectivity. Nevertheless, especially as of the limited availability of funds, these findings stress the possibly contradictory effects of fund spending for different spatial levels, i.e. measures contributing to cohesion on macro-level might sustain further deepening of disparities on meso- and micro-levels. Thus, to avoid inefficient allocation of EU funds, priorities of objectives with regard to spatial levels need to be clarified. If, however, focus shall be equally shared between the different spatial levels, comprehensive strategies consisting of matching projects should be favoured rather than individual and independent projects.
Significant coefficients of correlations with respect to pre-accession aid allocation aiming at labour market improvements are somewhat more complex. The coefficient for the qualitative labour market indicator HCI is not significant but significant relations occur with regard to more quantitative indicators, i.e. the unemployment rate and to a lower extent the change of active population density. Especially regions with high initial unemployment rates have received and spent pre-accession aid funds for improvements of their human resources. Additionally, active population density tends to have increased in many of the respective regions, though this most likely cannot be attributed to the pre-accession aid spending. Especially, in order to overcome high unemployment, such measures for human resource upgrading seem to be quite justified, especially as the coefficient for the HCI, though not significant, suggests this spending to concentrate somewhat in regions with relatively lower educated labour force.
Quite interesting is also the significance of correlations of the pre-accession aid spending aiming at improvements of the capital supply, albeit not related to the respective potential indicator. The analysis intimates positive significant relations of this kind of pre-accession aid with the initial employment in industry and unemployment rates, i.e. suggesting higher such spending the higher unemployment and industrial employment as share of total employment in all sectors. Mostly, also in modern industries, it is the industrial sector in which capital demand is particularly high, thus, such a priority seems to be quite justified, at least as far as old industries shall be modernised rather than closed down, in the latter case implying a shift towards other economic sectors as could be observed for some regions in above analyses of this section.
Coming to the correlation analyses with special reference to the change of per capita GDP and unemployment rates, it turns out, that significance of relations to different potentials
129 See the comparison of pre-accession aid spending in section 8.2 (respective maps provided in the annex).

130
varies somewhat between these two global cohesion indicators. Income growth tends to be significantly related with the indicators for urbanisation potential, capital supply, the geographic position in terms of accessibility and the initial regional situation at the beginning of the observation period in terms of both, income and unemployment levels.130 This leaves the indicators for the labour market and regional market potential with insignificant correlations. Income growth seems to have especially concentrated on regions with important service rather than agricultural or industrial sectors, for which the significant coefficients indicate a negative relation. This result supports earlier findings of growth concentration in the major agglomerations of the New Member States and Candidate Countries, as also service sector employment is by far higher in these rather than the other types of regions. Furthermore, this result also hints at the still limited growth potential of the industrial sector in these countries, as of the yet not completed industrial restructuring process. The significant coefficient depicting the accessibility potential also points out that it has been the more centrally located regions, often identical with major agglomerations in these countries, which have experienced higher income growth than other regions.
Summarising, these findings point out, indecisive of pre-accession aid allocation, that regions with comparatively high income levels, low unemployment and strong service sectors tend to have the highest income growth potential. In the New Member States and Candidate Countries these are mostly capital regions and few other major agglomerations. Thus, it is these regions, which can contribute to macro-level cohesion in income terms, though simultaneously tending to increase meso- and micro-level disparities. As of the negative significant relation with total pre-accession aid spending, which in most countries has concentrated outside the major growth poles, growth seems to depend on the aforementioned influences rather than on – the quite low levels of – pre-accession aid spending in general, which will have to be further elaborated in below regression analyses.
Similarly, to GDP per capita growth, also the change of unemployment rates reveals significant correlations with the urbanisation and localisation potential and the starting value of unemployment rates, though of course with opposite signs. However, neither the accessibility potential nor the initial income level are significantly related to changing unemployment. This indicates, that also more peripheral regions have been able to decrease unemployment or have allowed for lower increases than the more centrally located regions. Such a result, including the insignificant coefficient, can largely be attributed to the national specifics of unemployment development as for instance stressed in above Chart 8-6. Although unemployment rate development, whether in percentage or absolute terms, does not show a significant relation to the starting GDP per capita values, it tends to be negatively related with GDP per capita growth. This reveals, that regions, indecisive of their pre-accession aid allocation, which had a poor economic performance on macro- and/or meso-levels also tend to have experienced rising unemployment.
Such an example is the Polish region of Wielkopolskie, whose centre Poznan – including the former voivodship Poznan – had particularly low unemployment rates until 1998. In this case, the propensity of increasing unemployment in all Polish regions coincided with the administrative reform, which additionally increased this voivodship's unemployment rate as compared to the former region.131 Furthermore, municipality level data for this region reveal the very limited spatial effects of this agglomeration, characterised as weak MEGA by ESPON project 1.1.1, on its surroundings with regard to both, socio-economic and structural data (Zillmer 2003). From these findings, it can be concluded, that micro-level achievements aiming at territorial cohesion will only be achieved, if the necessary comprehensive linkages between the weak MEGAs in the New Member States and Candidate Countries and their hinterland are developed. Such comprehensive linkages do not only need to relate the
130 Some differences occur depending on the definition of the income growth variable, whether in percentage or
absolute figures.
131 For the respective change of unemployment in Wielkopolskie voivodship as compared to the Polish average see e.g. Zillmer (2002: 56).

131
agglomeration with its surroundings in terms of infrastructure but also need to reduce the other bottlenecks identified for rural and possibly peripheral regions to make actually use of the potentials available in the agglomeration and then allow for their spreading. Then, at the same time, these micro-level achievements can also contribute to macro-level cohesion, as economic performance of the then more integrated regions can improve. This is the more important, as in these countries most MEGAs are characterised as weak MEGAs with only few additional potential MEGAs and no strong MEGAs, not to speak of European Engines (ESPON 1.1.1).
Regression Analyses
Results of regression analyses, at this stage, are of preliminary character. As of the late data availability regarding the updates of selected EUROSTAT and ESPON data base data (July 2004) and the following completion of the foregone working steps, regression analyses could not be finalised by the time of the deadline of the 3rd interim report of ESPON project 2.2.2. Furthermore, due to individual data gaps, regressions had to be carried out on the basis of exclusion in pairs rather than in data sets, which can possibly affect the results. Nevertheless, this methodology for excluding missing data has been chosen to avoid the reduction of 87 regions to less than 60 regions in the regressions.
However, these preliminary results should allow for some further conclusions concerning the relation between the pre-accession aid policies, their related potentials and economic performance of the regions in the New Member States and Candidate Countries. At this stage, economic performance has been measured, correspondingly to above correlation analyses, in terms of per capita GDP change and unemployment rate change. For both indicators different models have been tested, differentiating between total and percentage change of the indicators, as attached in the respective tables in the Annex.
Without stressing the differences between the individual regression models, it can be stated, that for the change of per capita income, as suggested by above correlation analyses, the starting values of economic performance show significant influences. Furthermore, the potential indicator for urbanisation and localisation advantages, i.e. the sectoral employment structure, reflects results similarly to those in correlation analyses, implying a significant influence on regional per capita GDP growth. This underlines the importance of this potential for regional growth, and indicates possibilities for influencing regional growth. It is high agricultural employment which hampers income growth. Service employment tends to support growth, though actual effects depend on the kind of services supplied, i.e. consumer or lower business or higher business services. The not significant and even unclear effect of industrial employment largely can be put down to the varying effects of old and modernised industries and indicates the still largely needed improvements in the sectoral restructuring process. However, especially in the rural regions, in which in some countries, agricultural employment still dominates the labour market (see e.g. charts of sector structures in Annex). To overcome this bottleneck, not only restructuring measures within this sector and between the sectors are needed but upgrading and updating of human resources, which together with adequate conditions of the framework could enhance regional growth. Thus, to overcome the structural bottleneck in many regions of the New Member States and Candidate Countries, strategies combining measures on the respective major bottlenecks are needed rather than selective measures or projects at different times and places.
Interestingly, though the accessibility potential has revealed significant correlation coefficients with GDP per capita growth, it does not represent a significant influence on income growth in the preliminary regression models. This result suggests, that while GDP growth tends to concentrate in central rather than peripheral regions, other influences than accessibility – at least as measured in the ESPON data base – are more influential on GDP per capita growth. Thus, despite the importance of infrastructure projects on different spatial levels, they are not inclined to produce economic growth by itself but only through their connection with other characteristics concentrating in growing regions, i.e. mostly agglomerations in the New Member States and Candidate Countries. Such characteristics are closely connected with the

132
labour market and regional market potentials but also with capital supply and especially urbanisation and localisation advantages. Consequently, improvements in infrastructure provision can only expected to significantly contribute to territorial cohesion if they are accompanied by, for instance, measures improving the regional employment structure. Nevertheless, the unavailability of adequate transport and other connecting infrastructure, can certainly hamper economic activity and thus economic growth.
The negative and significant influence of the population density as measure for the regional market potential can basically be put down to two statistical effects controversial to the expected result. The first effect refers to the extreme value of Prague, which has by far the largest population density in the New Member States and Candidate Countries, at least on the basis of the chosen NUTS levels and has been faced with relatively low income growth at the end of the 1990s. And the second effect can be related to the inclusion of sometimes large areas surrounding the more strongly growing agglomerations on NUTS 2 level, such as Warsaw in Mazowieckie voivodship. As of this inclusion, population density is quite below that level that would usually be assumed for capital regions or other major agglomerations.
As expected from correlation analyses and the low level of intervention as for example compared to Structural Fund intervention in Objective 1 regions of the EU 15, pre-accession aid spending does not reveal a strong influence on GDP per capita growth. However, the negative sign, should not be overstated, due to the relative concentration of such spending in less favourable regions, as stated above. Yet, as other analyses elements illustrate, pre-accession aid measures often have other, more indirect effects on regional development in these countries, such as the mobilisation of regional and national funds, knowledge improvements about EU policies and legislation, opening and integration of these regions and countries etc. Thus, investigating territorial cohesion, also needs to refer to these qualitative effects, though they cannot be pointed out by quantitative analyses.
Furthermore, it has also been tested, in how far other influences than the potentials and pre-accession aid spending affect regional per capita GDP growth. The respective table in the Annex refers to country dummies as possible source of influence and the characterisation of regions as Western border regions, neighbouring regions of the EU 15, and capital regions. No country specific influences on GDP per capita growth could be identified, yet the capital region dummy shows a strong significant and positive influence. This can largely be attributed to the comprehensive provision of different potentials available in these regions and also other major agglomerations.
In contrast, the insignificant result for the Western border region dummy, can be interpreted in terms of missing links with the neighbouring EU 15 regions and often limited potentials within the border region. Once, the spatial closeness to the EU 15 can be utilised, this variable could possibly show a significant influence – at least as long as other peripheral regions do not catch up through other processes. Yet, also differences in economic performance and development levels of these EU 15 border regions contribute to this insignificant result. For instance the comparison of Bulgarian border regions neighbouring Greece with Slovenian or Czech regions bordering Austria or Bavaria stresses these differences in development levels and performance, not only on the side of the New Member States and Candidate Countries but on the EU 15 side as well.
Summing up, these preliminary results, especially with regard to the employment structure and initial GDP per capita values are also supported by analyses undertaken by Herz and Vogel (2003: 14), who have conducted comparable regressions for the NUTS 2 regions of Poland, the Czech Republic and Hungary, though to different extents over the period between 1991 and 2002. Furthermore, as of their regressions' relation not only to gross value added per inhabitant but also per worker, similar results could be retrieved for the productivity indicator. This indicates, that also for improvements in the territorially balanced competition, similar factors are of significant influence. Herz and Vogel (2003: 10) find, that "Differences in the structural characteristics of regions, like the sector structure of production and the endowment with resources, physical and human capital, lead to differences in the aggregate productivity and thus imply differences in income levels and growth rates". Thus, these results

133
even further emphasize the role of the economic structure for economic growth and thus territorial cohesion on different spatial levels.
In contrast to the preliminary regressions undertaken in ESPON project 2.2.2, the analyses by Herz and Vogel (2003) also stress the role of education. Herz and Vogel gained significant results for the share of the working age population with medium and high employment for their three sample countries, thus a quite comparable indicator to the HCI used in our analyses. However, the ESPON sample could not concentrate on just three but all accession countries plus Bulgaria and Romania, which yields additional country specific variation in education systems contributing to insignificant coefficients. To overcome this problem, further investigations are needed in ESPON project 2.2.2 in preparation of the final report.
The regression results for the influences on unemployment change rates even more strongly point out the role of different potential indicators and thus of the regions' economic structure. Worth noting is the significant coefficient for the accessibility measure. Unemployment tended to grow more or decrease less the lower the region's accessibility potential. This finding can be explained with the efforts for commuting. Especially in remote regions the number of jobs outside agriculture is particularly limited, thus the populace needs to commute to the next centre, which is often outside their own NUTS 3 region. The more remote and the less accessible the region from a meso- and micro-level perspective, the higher commuting costs and thus the lower the willingness of the labour force to commute.132 Then, if the labour force does not turn back to agriculture – mostly in small family farms – regional unemployment tends to rise as hidden unemployment decreases.133
This regression analysis also hints at the role of country specific influences for unemployment development as was already assumed on the basis of the descriptive analysis of unemployment development in relation to pre-accession aid spending in above corresponding sub-section. This reveals the role of additional influences such as the national framework and national policies, which could not be incorporated in this analysis but are taken care off in the qualitative components of the project's research, relevant for macro-level territorial cohesion.
Finally, also the significant constants in both regression approaches hint at further influences on the development of income growth and unemployment rates, which due to data gaps could not be included in the analyses. Apart of the country specific influences just mentioned, Herz and Vogel (2003: 10) suggest for instance, that also a lack of sector specific technology diffusion within countries keeps peripheral regions from catching up with agglomerations. Assuming such a lack of diffusion, also implies that human resources are differently utilised across regions of one country and that there is an inherent difference between the regions concerning their development level, which hampers the catch up process especially of the Eastern peripheral and mostly agriculturally dominated regions.
132 See for instance Zillmer (2003) for this relation even in relatively centrally located Polish regions.
133 See e.g. above development of sector employment in Romania.
134
8.4 Qualitative Impact Analysis To deepen the insights derived from quantitative analysis case studies were conducted on spatial impacts of Pre-Accession Aid within selected regions. The objective of the case study approach was twofold: on the one hand they should support the assessment, interpretation and verification of results from the quantitative impact analysis by providing specific regional impact studies and deeper insights on the mechanisms affecting territorial development. On the other hand case studies should deal with fields of interventions which are not covered by the quantitative analysis due to lack of data, e.g. institutional or environmental conditions. Case study analysis followed a common methodological approach which is highlighted in chapter 5.
Main findings of the comparative analysis are presented in the following section beginning with an overview on case study results in Table 8-11. Mainly for graphical reasons two case studies are presented at a time. However groups of similar regions has been chosen: the two polish case study regions Slaskie Voivodship and Mazowieckie voivodship belong to the core region of the candidate country, ESPON 2.2.2 named “Central and Eastern European triangle”; the two Hungarian regions Borsod-Abaúj-Zemplén and Szabolcs-Szatmár-Bereg represent peripheral mainly rural regions; Estonia and Malta are both small countries in the European periphery.

Comparative Analysis of Spatial Impact Assessment Case Studies
Table 8-11: Overview on Case Study Findings
Region Slaskie Voivodship (PL) Mazowieckie voivodship - Warsaw Metropolitan Region (PL)
Type of region Old industrial region (NUTS 2) Capital city region (NUTS 2)
Spatial identity Śląskie voivodship in its today’s shape was created in 1998, combining the territories of the former Katowickie, Bielskie and Częstochowskie voivodships. As a result, this relatively small but highly populated and urbanized region is currently an area of sharp contrasts in terms of socio-economic situation.
Mazowieckie voivodship is the biggest and the most populated region in Poland, with over 5 mln inhabitants (13,1% of total country population). The capital city is Warsaw (1,6 mln inhabitants), which in the regional context can be regarded as the indisputable centre. Considering spatial structure of the voivodship there are few other cities of sub-regional importance: Radom (230.000), Płock (130.000), Siedlce (77.000), Ostrołęka (56.000) and Ciechanów (48.000) and remote areas, which are predominantly rural. The urbanisation level is moderate 64,3%. A significant characteristic of demographic situation of Mazowieckie voivodship is the change of age structure of inhabitants. The number of people in school age is decreasing rapidly (22%), however there is an increase in inhabitants in working age (61,4%). Also the number of people in post-working age are increasing significantly (16,6%), second highest share in the country. The migration balance of the voivodship is positive (+ 0,2 %) mainly due to attractiveness of Warsaw Metropolitan Area (Warsaw and its surrounding municipalities). However, there can be observed outflow of population from peripherally located rural municipalities situated in the northern and eastern part of the metropolitan region, and to a lesser extent in the southern region, most probably targeted at the centre of metropolitan region.
Main potentials & bottlenecks
Main potentials are: large regional market, strategic location at the crossing of international transport routes, dense network of universities and R&D units, high labour ethos, polycentric settlement network, relatively well developed network of local and regional institutions, favourable conditions for tourism.
Main bottlenecks are: concentration of old industrial structures, environmental degradation, low quality of infrastructure, incompatibility of education system and labour market
Main potentials are: large inflow of FDI, highly developed market service sector in Warsaw, national educational and R&D centre, high level of education, good international accessibility due to international airport.
Main bottlenecks are: large internal disparities with weak economical structures outside the Warsaw Metropolitan area, ageing of population and overpopulation of rural areas, low level of education in rural areas, poor condition of transport infrastructure.

requirements, poor cooperation between industry and innovation centres, low mobility of workforce (profession, location), weak metropolitan functions, deepening exclusion of whole social groups.
Characterisation of project/programme analysed
Of all the programmes implemented in Silesia the Phare INITIATIVE programme is the only one addressing restructuring problems in Silesian region directly. The Phare programme PL9903.01 "Alleviation of social costs from coal and steel restructuring and regional development in Silesia" (INITIATIVE II) was implemented in the years 2000-2003. The whole programme is the continuation of the INITIATIVE I, with a total budget of 80 MEURO, 30 MEUR of which were PHARE funds. The programme consisted of the following components for coal and steel sectors: 1.) retraining in the coal and steel sector, 2.) co-financing of social benefits, 3.) alternative job creation, 4.) regional development - Local Grant Fund.
In particular, the programme’s component – Local Grant Fund has been analysed (PHARE funds of 9.3 MEUR). The Local Grant Fund encompassed the provision of support towards small scale infrastructure projects in priority areas identified in the regional Operational Programme, notably for coal and steel dependent gminas. Within Local Grant Fund four main types of investments were funded: road infrastructure, sanitary infrastructure, business oriented infrastructure and educational institutions infrastructure. 31 projects were implemented within Silesia region, all of them were completed until End of September 2002.
Two transport projects funded by ISPA have been analysed:
1.) One project consists in the strengthening of the surface of the national road No. 50, from Sochaczew to Mińsk Mazowiecki. Road No 50 belongs to the future Pan-European Transport Network as part of the II Pan-European transport corridor (Berlin - Warsaw - Minsk - Moscow). The road No 50 carries the whole transit traffic from Western to Central and Eastern Europe as by-pass of Warsaw. This solution will last until the section of A2 motorway (from junction Konotopa to junction Konik) is constructed. The purpose of the investment project is to improve road safety and traffic flow efficiency on the road No 50, which is not adapted to the increasingly heavy traffic.
2.) The second project analysed aims at a comprehensive renewal of the 52 km long double-track and electrified line between Mińsk Mazowiecki and Siedlce. The Mińsk Mazowiecki - Siedlce line is also part of the Pan-European corridor II, linking Berlin and Moskwa, via Warszawa and Mińsk. Its rehabilitation and upgrading to international standards will facilitate the exchange of persons and goods between European Union and Poland, on one hand, and Byelorussia and Russia, on the other. Rehabilitation and upgrading will concern all the components of the line: superstructure, substructure, engineering structures, signaling, level crossings, catenaries, sub-stations, passenger buildings and platforms, with special attention to environmental aspects. One target is to meet the requirements of AGC and AGTC and to allow the speed of 160 km/h for passenger trains and 120 km/h for freight trains (instead of 120 and 60 km/h at present). Other targets consist in increasing the line capacity and traffic safety, with the aid of automatic block and suppression of unmanned level crossings. Reduction of maintenance and operating costs is also an important target of the investment.
Assessment of policy with regard
Most of LGF instruments were designed to reduce the existing bottlenecks for the regional development, potentials were only to a
Both projects are mainly important on national or European scale thus, they address only to a limited extend the regional bottlenecks and
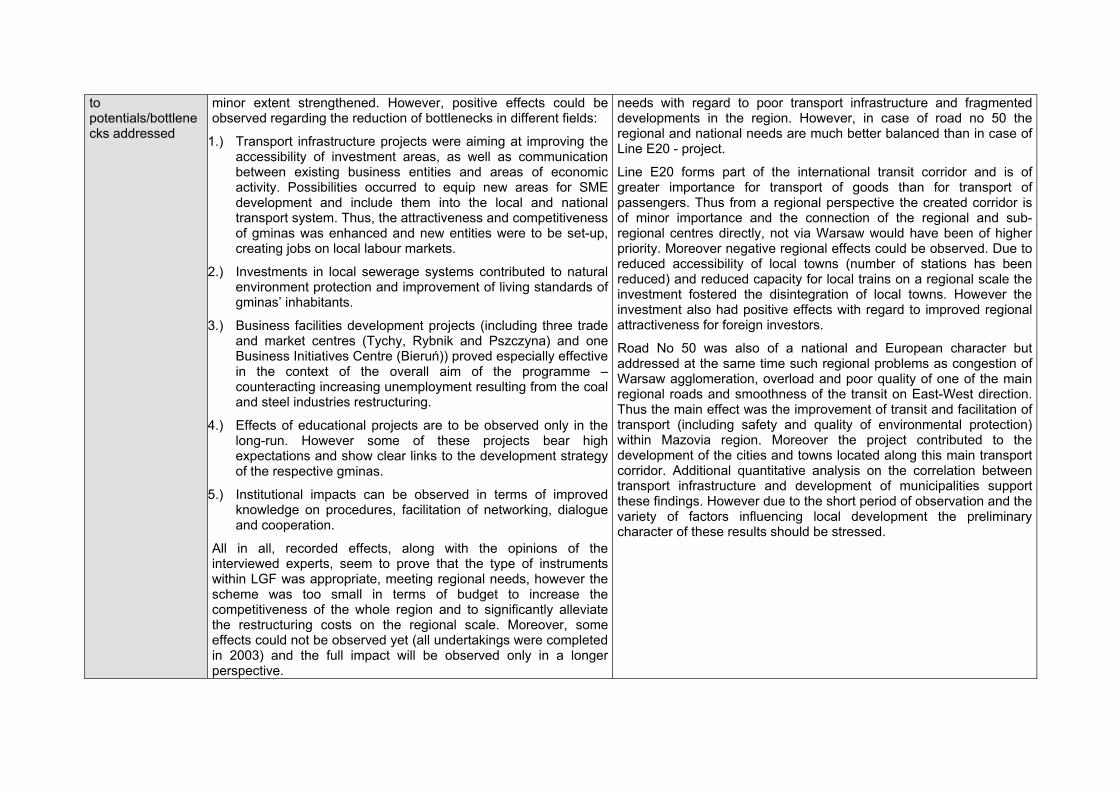
to potentials/bottlenecks addressed
minor extent strengthened. However, positive effects could be observed regarding the reduction of bottlenecks in different fields:
1.) Transport infrastructure projects were aiming at improving the accessibility of investment areas, as well as communication between existing business entities and areas of economic activity. Possibilities occurred to equip new areas for SME development and include them into the local and national transport system. Thus, the attractiveness and competitiveness of gminas was enhanced and new entities were to be set-up, creating jobs on local labour markets.
2.) Investments in local sewerage systems contributed to natural environment protection and improvement of living standards of gminas’ inhabitants.
3.) Business facilities development projects (including three trade and market centres (Tychy, Rybnik and Pszczyna) and one Business Initiatives Centre (Bieruń)) proved especially effective in the context of the overall aim of the programme – counteracting increasing unemployment resulting from the coal and steel industries restructuring.
4.) Effects of educational projects are to be observed only in the long-run. However some of these projects bear high expectations and show clear links to the development strategy of the respective gminas.
5.) Institutional impacts can be observed in terms of improved knowledge on procedures, facilitation of networking, dialogue and cooperation.
All in all, recorded effects, along with the opinions of the interviewed experts, seem to prove that the type of instruments within LGF was appropriate, meeting regional needs, however the scheme was too small in terms of budget to increase the competitiveness of the whole region and to significantly alleviate the restructuring costs on the regional scale. Moreover, some effects could not be observed yet (all undertakings were completed in 2003) and the full impact will be observed only in a longer perspective.
needs with regard to poor transport infrastructure and fragmented developments in the region. However, in case of road no 50 the regional and national needs are much better balanced than in case of Line E20 - project.
Line E20 forms part of the international transit corridor and is of greater importance for transport of goods than for transport of passengers. Thus from a regional perspective the created corridor is of minor importance and the connection of the regional and sub-regional centres directly, not via Warsaw would have been of higher priority. Moreover negative regional effects could be observed. Due to reduced accessibility of local towns (number of stations has been reduced) and reduced capacity for local trains on a regional scale the investment fostered the disintegration of local towns. However the investment also had positive effects with regard to improved regional attractiveness for foreign investors.
Road No 50 was also of a national and European character but addressed at the same time such regional problems as congestion of Warsaw agglomeration, overload and poor quality of one of the main regional roads and smoothness of the transit on East-West direction. Thus the main effect was the improvement of transit and facilitation of transport (including safety and quality of environmental protection) within Mazovia region. Moreover the project contributed to the development of the cities and towns located along this main transport corridor. Additional quantitative analysis on the correlation between transport infrastructure and development of municipalities support these findings. However due to the short period of observation and the variety of factors influencing local development the preliminary character of these results should be stressed.

Assessment of policy with regard to territorial objectives
All in all it can be said, that direct contributions of LGF to territorial development objectives are difficult to analyse let alone to measure. An impact can however be expected on selected aims of territorial policy, like dynamisation and restructuring of the region in spatial terms or strengthening the function of settlement networks centres and further impacts probably will occur in the long-run.
Spatial cohesion aims were addressed through the realisation of LGF own objectives. As a support to the target group – coal and steel dependent gminas – it promoted cohesion within the region (micro-level), and on a meso-level – of Śląskie voivodship in relation to other Polish regions. It is too soon, however, to accurately assess the extent of the contribution to territorial cohesion at the level of localities, the region and the country as a whole.
Balanced spatial competition, in turn, was targeted mainly through the very type of assistance offered within the LGF. Funds for business schemes or infrastructure development increased the competitiveness of the localities in a number of fields. It is doubtful however, that, with the budget the programme offered, this would contribute significantly to the competitiveness growth of the whole region.
With regard to the fields of actions, it seems that the very type of projects have determined to a considerable extent, the scale of impact on territorial development. Interventions in the area of transport and sewage system infrastructure bring about effects that are easier to observe in the short-run, however, since most of these projects rather met current needs of localities, only few contributed directly to the achievement of regional strategy and spatial development plan’s goals. Investment in business environment and educational facilities, in turn, shows impact on desirable spatial patterns only in the longer perspective, but the trends are more likely to be sustainable. Summing up, as far as the facilitation of restructuring processes was concerned, LGF projects contributed to the achievement of the goal mostly on a local level, in a micro-scale. Full realisation of the programme’s purpose on a regional level was not possible due to the scale of the budget in the context of the complexity of the region’s restructuring problems.
Analysis of these two infrastructure projects highlighted the latent conflict between territorial objectives on different spatial levels. While the projects supported spatial integration on a national or even European scale, trends of disintegration resulted on intra-regional level. With regard to spatial cohesion and balanced spatial competition impacts of the investments are hard to assess due to the long-term character of impacts and the range of influences on regional development. Although there are indications that improved accessibility enables development of spread effects from Warsaw Metropolitan region to the less developed hinterland and thus spatial cohesion, these effects will likely be limited to areas directly connected to transport corridors.

Preliminary spatial policy recommendations
1.) Ensuring enhanced reference of all projects to development of strategic goals at the local and regional level could better facilitate the restructuring processes and address spatial objectives more directly. Applications should therefore be encouraged to stronger take into account a more strategic approach.
2.) Stronger reference to spatial development objectives is also needed on programme level. Selection of projects did not clearly reflect the rules of territorial solidarity and territorial efficiency.
3.) The programmes for Silesia should be more targeted, both in terms location and fields of activity.
a) To ensure better results, also with regard to spatial patterns in Silesia, the interventions should on the one side concentrate on support for diversified development of growth poles outside the old-industrial core of Śląskie voivodship (e.g. Bielsko-Biała, Częstochowa, Rybnik, Tychy, Pszczyna). Examples of few such projects within LGF clearly stand out, showing that the absorption capacity in the localities is very high and positive side-effects can be observed more frequently. On the other hand, the centre of the region should receive more assistance in the fight with the legacy of heavy industry concentration. E.g. few programmes today address the redevelopment of contaminated land directly and with a systematic approach.
b) Some of the existing priorities should be continued on a wider scale, especially business development schemes that promote alternative activities, needed in declining areas, as well as human resources development projects necessary to increase the mobility of workforce, both between professions, sectors and in spatial dimension. Infrastructure development however, e.g. regarding transport infrastructure, calls for larger and more integrated investments. Projects in the transport field proofed to be too fragmented and the scale of changes - rather insignificant in the context of competitiveness of the whole region.
1.) European, national and regional needs and impacts should be equally taken into account while selecting and implementing infrastructure investment projects
2.) Integration of regional actors and independent experts into the project selection process could improve the effectiveness of implemented projects and could prevent negative regional side effects.
3.) Especially in the field of transport infrastructure a coherent, long term strategy of investment is needed, since fragmented improvement of the transport infrastructure might only shift problems related to increasingly heavy traffic flows. To meet regional bottlenecks a functioning transport system is required that supports national as well as regional integration.

Region Borsod-Abaúj-Zemplén (HU) Szabolcs-Szatmár-Bereg (HU)
Type of region Declining industrial region (NUTS 3) Peripheral eastern and rural region (NUTS 3)
Spatial identity Borsod-Abaúj-Zemplén-county is situated in north-east Hungary. The number of population in the county is 744,500, approximately 1.6% less than it was in 1990. The decline of the population was faster here than the national average. A dominant element in the decrease of population is the large-scale outmigration, especially of the younger and more educated groups, what resulted in intellectual erosion and ageing in the county. The urban network is underdeveloped, there are large areas without an urban centre. Of the total population, 45.1% live in villages and 54.9 % in towns. Forty-one per cent of the settlements are tiny villages with less than 500 population.
The county can be divided into three areas with distinct development problems: the middle and western part is the most suffering from industrial crisis and related environmental problems; the eastern part is characterised by agricultural structures and underdeveloped infrastructure; mixed industrial and agricultural structures prevented the southern parts from restructuring problems as severe as in the other parts of the county.
Szabolcs-Szatmár-Bereg county is situated in Northeast Hungary, along a triple border with Hungary, the Ukraine and Romania. The settlement structure of the county consists of one city with county rank (the county seat, Nyíregyháza), 19 other towns and a total of 208 villages. The population has always been greatly affected by outmigration, permanent or temporary but due to high rates of natural population growth, the population in total increased during the last decade. As a result, this county has one of the youngest population structures in Hungary.
Main potentials & bottlenecks
Main potentials are: spatially concentrated, developed industrial infrastructure, attractive tourism sites, good geographical transit location, up-to-date chemical industry.
Main bottlenecks are: declining outdated manufacturing industry, small size and lack of capital of enterprises, poor business services and infrastructure, underdeveloped physical infrastructure, underdeveloped institutions promoting co-operation, declining and ageing population with outdated education.
Main potentials are: strategic location for crossborder logistics, young population structure.
Main bottlenecks are: declining and out-dated agricultural sector, poor transport infrastructure, low level of education, low level of capital investments.
Characterisation of project/programme analysed
The integrated crisis management programme was a pilot programme in 1994-1995, PHARE and Hungarian financed, managed by the Borsod-Abaúj-Zemplén county development council, which was itself established by an earlier PHARE initiative. The objective was to develop a county restructuring programme for the period till 1999 under participation from EU, national, regional and local level. Therefore 13 professional committees were set up
As in Borsod-Abaúj-Zemplén a pilot action of developing an integrated crisis management programme was started in Szabolcs-Szatmár-Bereg county in the early years of PHARE. The overwhelming part of the regional support in the framework of this pilot action and PHARE in general has been used for infrastructure development purposes especially for the development of telephone, and first of all, natural gas pipeline networks. In the following years the programme was

and several programmes, each involving sub-programmes, were defined (financial development, economic development, infrastructure development, human resources development etc.). The main achievement of the programme was to develope the institutional structures necessary for the programme implementation. A large share of the programme was meant to be financed by the EU with the condition that Hungarian ministries and local governments transfer the corresponding co-financing share to the newly established Programme Management Unit of the programme in order to ensure integrated and harmonised utilisation.
continued in a restructured way, fitted more to the needs and problems of the county.
Assessment of policy with regard to potentials/bottlenecks addressed
The integrated programme was not realised due to problems with the integrated financial fund. Officials of sectoral ministries and local governments were not willing to transfer their national budgetary resources to the management unit of the programme. This conflict delayed the approval and implementation of the programme for a long period. PHARE officers, seeing that Hungarian authorities are reluctant to transfer their money, made also a “withdrawal". Although the programme would have given the chance to address regional potentials and bottlenecks in an integrated manner, the institutional conditions proofed to be the main bottleneck, which was not met in a successful way.
The output expected from the integrated crisis programme with regard to improved economic development has not been fulfilled. Although Szabolcs, the poorest county in Hungary, is now amongst the best developed counties with regard to telecommunication and gas networks, these onesided investments were not sufficient to attract further economic activities. Moreover large parts of the constructed infrastructure networks are unused because they are not adapted to the populations needs and capabilities. However important improvements were achieved with regard to the institutional capacity. The main result of the former programme was perhaps that local governments and entrepreneurs have learned how to apply for support, how to prepare applications and how to implement them. Institutions and networks have been established to support the application process. This laid the foundation for an improved position in the competition for public finances, which could in the future contribute to overcoming development bottlenecks and fostering development potentials.
Assessment of policy with regard to territorial objectives
Although the programme was in line with the objective of spatial cohesion due to the concentration of support on the least developed regions within Hungary, no territorial impacts can be observed so far.
Although the case study sheds light on one of the early PHARE projects which directly aimed at achieving spatial cohesion by supporting the poorest regions, up to now no immediate territorial impacts can be observed. The lesson learned is that onesided investments without a comprehensive strategy are supposed to fall back behind the expected results. Moreover strong regional institutional structures are needed to enable an efficient and adequate use of external financial support. Institution building however takes long and does not display territorial impacts immediately.

Preliminary spatial policy recommendations
1.) To enable absorption of regional development funds strong regional institutional structures have to be build in the first place.
2.) To secure effective and complementary implementation of national and EU policies, procedures of application for funding should be streamlined to reduce bureaucratic barriers for possible applicants.
3.) Programme management structures should reflect national and EU interests in participating in decisions on funding to prevent a situation of competition between both levels.
1.) Comprehensive development strategies including a mixture of fields of action are required to meet complex regional development problems.
2.) The scale and type of projects should be oriented on the regions situation to prevent inefficient investment.
3.) 3.) Institution building processes should precede investment projects to secure high absorption capacity.
Region Malta Estonia
Type of region Peripheral island region (NUTS 2) Peripheral small country containing one major urban agglomeration (Tallinn) (NUTS 2)
Spatial identity The Maltese Islands comprise three main islands: Malta (246 km2) with the capital city Valetta, Gozo (67 km2) and Comino (2.7 km2). The total population (2001) is 394 641, of which 92% live on Malta, and 8% (30 842) on the island of Gozo (incl. Comino).
The population density of 1250/km2 is among the highest in the world and the highest in Europe, followed by The Netherlands with 385/km2. Big economic disparities exist between the islands of Gozo and Malta – Gozo’s GDP per capita (2000) was only about 72% of Malta’s national average (i.e. 32% of EU 15). Besides the structural disparities between Gozo and Malta, differences in economic structures, needs and potentials also exist between the Northern and Southern parts of the is-land of Malta, with the Northern part containing government functions and well developed tourism sites and the Southern part being characterised by a large manufacturing sector.
Estonia is located on the eastern cost of the Baltic Sea. With an area of 45,200 km² and a population of 1.36 million Estonia is one of the smallest countries in Europe. The population density of Estonia is very low, the average density being 30 inhabitants/km² and as low as 10 inhabitants/km² in some rural areas. Since the beginning of the 1990s the population started to decline due to negative natural growth and emigration (- 6% from 1991 to 2002).
During the transition period regional disparities that formerly existed mainly in different living standards increased in terms of income and unemployment levels. About 40% of Estonian population is concentrated in the capital region Harju County, where about 60% of GDP are gained and 80% of foreign investments are located. In 2000 GDP in PPS per capita in Harju County was 62% of the EU average, while the indicator in other NUTS 3 regions stayed between 24-30%. The most successful counties beside the capital region are Tartu and Pärnu counties with their strong town centres. The situation is the most unfavourable in the counties located on the eastern border (with the exception of Tartu County).

Estonia faces some serious environmental problems regarding air and water pollution, which is concentrated in the Tallinn region and the North-Eastern part of the country. They are mainly caused by the oil-shale burning power plants, chemical plants and cement factories as well as by municipal sewage pollution and agricultural runoff.
Main potentials & bottlenecks
Main potentials are: strategic location in the Mediterranean region, established tourist destination due to natural and cultural heritage attractiveness.
Main bottlenecks are: insularity resulting in low accessibility, high pressure on land-usage and environment due to high density of population, shortage of critical mass for economic activity (in terms of regional market, economic diversity), weak institutional structures for regional policy in the past.
Main potentials are: close integration with the Baltic Sea region, competitive structure of the economy, high formal education level of population, well developed transport and communication infrastructure.
Main bottlenecks are: low private sector spending on innovation related activities, non-conformity of labour demand and supply in terms of qualification, peripherality of rural (eastern) regions, environmental problems especially in the North-Western regions.
Characterisation of project/programme analysed
The "Capacity building" project was implemented through Twinning assistance. The Pre-Accession Advisor (PAA) worked closely with and advised the Regional Policy Directorate under the Office of the Prime Minister (today called Planning and Priority Coordination Directorate - PPCD) and other line ministries on issues pertaining to the strengthening of administrative capacity. The PAA assistance comprised of five components: 1. To enhance the knowledge of the Maltese authorities and socio-economic partners on the management and utilisation of the structural and pre-accession instruments, 2. To finalise the National Development Plan (NDP), 3. To elaborate a Single Programme Document (SPD) under Objective 1 for Malta, 4. To formulate a Programme Complement to the SPD, 5. To present the SPD.
Two Pre-Accession programmes have been analysed:
ISPA environmental strand focuses on measures which will enable Estonia to comply with the priorities indicated in the National Programme for the Adoption of the Aquis and in particular ISPA focuses on substantive approximation with the most costly directives on urban waste water, drinking water, large combustion plants, air quality framework, landfills and several other directives related to solid waste management and recycling. Until February 2004 ISPA funds amounting to 98 Mio. € were committed to 12 environmental projects investing either in communal waste, wastewater or water management.
PHARE ESC programme was introduced in 2000 and three types of programmes have been funded since: 1. projects for selected problem regions containing several components like business development, tourism development or employment and training, (e.g. Economic and Human Resource Development in South-Estonia (2000), Economic and Human Resource Development in Ida-Virumaa (2000)), 2. specific investments for one beneficiary (e.g. Development of the Tartu Science Park (2003), Development of Tallinn Technology Park (2003)), 3. grant schemes, where several beneficiaries can apply (e.g. Industrial Infrastructure Grant Scheme (2003), Tourism Grant scheme (2003)). Since 2000 9 projects have been funded with a total budget of 17,5 MEUR.

Assessment of policy with regard to potentials/bottlenecks addressed
The project addressed one essential bottleneck for regional development in Malta, namely the weak institutional structures for carrying out regional policies. The concrete objectives of the project were met and the following results achieved:
1.improved capacity for administering structural funds by training several ministries and organisations,
2. identification of relevant social partners for implementation of regional policies by integrating them into the SPD elaboration process,
3. exchange of experiences and inspiration for future EU projects,
4. elaboration of the SPD under assistance of external experts.
Beside these immediate effects in terms of institution building further territorial effects can be expected from implementation of the SPD. By taking into account the the four priorities of 1. infrastructure and business investments, 2. human resource development, 3. rural development and fisheries and 4. special needs of Gozo, the SPD addresses the main bottlenecks of development in Malta.
Both programmes address important regional potentials and bottlenecks, however an impact assessment proofed impossible due to the early stage of programme implementation, the general problem of isolation of specific influences amongst a range of influence factors and the limited research resources.
Concerning the PHARE ESC programme it is expected to effect the socio-economic development in an indirect way by improving the living and business environment in the areas supported. Direct effects will be less relevant, since PHARE is directed towards local authorities, who are not in the position to directly create employment or give revenues. PHARE ESC funding is linked to national regional development objectives and projects have to be in line with regional development plans to get support. Thus the programme in the first place provides the beneficiaries with additional funding and gives incentives to mobilise own sources (for co-financing) for already envisaged investments.
Concerning ISPA expected environmental impacts are clearly defined and will be assessed under light of the requirements of the EU directives one year after completion of projects or even later. Regarding wider territorial impacts of ISPA projects in terms of socio-economic development those are hard to assess. Obviously projects contribute also to fulfil basic needs of the population by establishing basic technical infrastructure in the municipalities concerned. Moreover as a side effect local workers are employed and local materials are used for the implementation of projects, but since projects are often implemented (partly) by foreign companies these effects are limited as well. Impacts with regard to improved attractiveness of regions due to improved environmental quality will probably be of an indirect character and are thus not measurable.
Assessment of policy with regard to territorial objectives
As already mentioned before the accession process in the field of regional policy and especially the project for capacity building for the implementation of regional policy had a great influence on the perception of regional development issues in Malta. As a consequence the institutional foundations were laid to address further potentials and bottlenecks in a regional perspective in the future. With regard to the SPD it seems apparent that the elaborated strategy will affect the future territorial and regional
In a small country as Estonia spatial development issues seem to be equally relevant on national meso as well as on European macro-level but less relevant on regional micro-level. This became apparent in the PHARE ESC programme which aimed likewise at cohesion on national level by supporting underdeveloped regions within Estonia and at spatial integration and cohesion on European level by supporting national growth poles. The ISPA environmental strand on the other side aims at achieving European standards in terms of

development positively and will contribute to resolving identified territorial and regional problems.
environmental infrastructure and quality for the whole country whereas spatial development objectives on a regional micro level are not relevant.
Analysis showed that territorial development objectives are not equally relevant for all fields of action addressed by Pre-Accession Aid. This concerns ISPA environmental projects which support the nationwide implementation of EU environmental directives. Although environmental quality constitutes an important regional development potential and common sense thus would expect these kind of projects to affect regional developments, spatial development issues are not considered for the programme implementation and wider impacts on socio-economic development are hardly to assess.
Preliminary spatial policy recommendations
1.) Continuation of "Twinning" as effective instrument for institution building,
2.) Continuation of integrated approaches with regard to involvement of a variety of regional actors to design regional development strategies and funding priorities.
1.) Coherent strategies and institutional structures of Pre-Accession Aid programmes and national policies proofed to be effective to ensure smooth implementation of and high absorption capacity for programmes. Due to alignment of priorities of action and institutions responsible for implementation the analysed Pre-Accession Aid programmes were easily accessible for the beneficiaries.
2.) Programme regulations need to be flexible enough to adapt them to the specific regional situation and needs. This was highlighted by analysis of ISPA environmental strand, where effectiveness and impacts possibly could be increased by enabling more flexible solutions especially for the size of projects. Flexibility regarding fields of action seemed as well to be advantageous for PHARE ESC programme to enable a balancing between different spatial objectives (national growth – intra-national cohesion).

146
Comparability of case studies
Case study research covered a variety of research areas which differ with regard to the territorial level - from NUTS 3 regions, NUTS 2 regions to nations on NUTS 2 level - and with regard to the spatial and economic structure – capital city regions, old industrial regions, rural regions and countries with diverse intra-national structures. Also the analysed pre-accession aid measures varied with regard to the level – project or programme level -, the type of intervention – institution building, infrastructure investment, educational projects, integrated regional programmes – and the date and stage of implementation – early PHARE projects, programmes and projects still in progress. Due to these differences between cases direct comparative analysis is limited and generalisation of findings have to remain tentative. On the other hand the variety of case studies enables to draw conclusions from several perspectives and on several topics. In total some important findings can be highlighted though, which together with the quantitative analysis allows for further conclusions on pre-accession aid impacts.
Limitation of impact assessment
Case study research approved the already mentioned limitations existing for an effective policy impact assessment. Beside the limitations applying for quantitative analysis several difficulties occurred for qualitative in-depth analysis as well.
The general problem of separation of influences amongst the variety of factors influencing spatial development proofed to be relevant for the case studies as well. Regarding infrastructure investments or human capital measures effects might be directly visible and their effect on regional potentials/bottlenecks directly concerned can also be discussed – though in qualitative terms only - but the impact on broader regional development trends is hardly to assess. This applies to institution building measures as well, where direct effects in terms of increased institutional capacity can be observed but if and how this contributes to regional development in socio-economic terms remains vague. Moreover also on case by case basis the level of spending proved to be too low to reveal significant, isolatable effects.
In several cases the stage of project implementation hampers the evaluation of impacts, since projects are either still in progress or have just recently been completed (Polish case studies, Estonia, Malta). Evaluation of projects however in most cases is carried out not until one or two years after project completion and wider impacts can be expected to develop even later in a long-term perspective. On the other hand projects from the early years of pre-accession aid are faced with problems of lost data and documentation, fluctuation of responsible persons or incompleteness of projects due to difficulties of implementation in the early PHARE years (Hungarian case studies).
Another problem that occurred concerns data availability on regional level. Due to changing administrative boundaries time series for socio-economic indicators are not completely available respectively comparable (especially in the Polish cases). Moreover projects often do not fit to administrative boundaries but cover several uneven parts of different regions. Even if a project is restricted to a defined region impacts might develop outside the regional boundaries as well.
Assessment of case studies with regard to potentials and bottlenecks
Analysed pre-accession aid interventions addressed regional potentials and bottlenecks in different ways and to different extents. Some of the interventions focused on one specific regional bottleneck or potential, e.g. the infrastructure investments in the Mazovia region, the ISPA environmental projects in Estonia or the institution building project in Malta. The other projects aimed at influencing several regional potentials or bottlenecks simultaneously, like in the case of the Local Grant Fund in Silesia region, the PHARE ESC programme in Estonia or the integrated restructuring programmes in the Hungarian regions.

147
Case studies included good and bad practice examples with regard to the extent regional potentials and bottlenecks were addressed. The Silesian LGF and the Estonian PAHRE ESC programme are examples for interventions supporting development by a mixture of measures aiming at reduction of several bottlenecks on the one hand (e.g. poor infrastructure) and strengthening of potentials on the other hand (e.g. development of human resources or strengthening innovation capacity). This approach seems to be adequate to face the complex structure and development problems of these regions. Thus these interventions have been rather positively assessed and are expected to reveal positive impacts on territorial development. The integrated restructuring programmes in the two Hungarian regions followed a similar approach, but failed in implementing a balanced mixture of measures. Although the elaborated development programmes seemed to tackle the regional situation in an appropriate way and with wide support of regional actors, their proper implementation was constrained by institutional conflicts and at the end only one-sided investments in regional infrastructure have been realised. Since these investments were not accompanied by further measures within in an integrated concept the improved infrastructure remained widely unused due to continuing bottlenecks in other fields.
The two cases focusing on one field of action, namely transport infrastructure and environmental infrastructure, showed less emphasise on the regional situation in terms of potentials and bottlenecks than the other cases but due to different reasons. Both interventions are part of Europe wide activities – Pan-European Transport corridors in one case and environmental directives in the other case. Thus their scale and focus is predefined and overall objectives prevail over regional development objectives. In case of transport infrastructure in the Mazovia region the priority of developing Pan-European transport corridors resulted in regional infrastructure bottlenecks being subordinate. Nevertheless interventions partly had positive impacts on the regional situation as well. In case of ISPA environmental projects they are intended to implement environmental directives country-wide and therefore regional socio-economic situations are regarded only to a limited extent. Nevertheless in the frame of the set objectives these two interventions revealed positive effects on the potentials/bottlenecks addressed.
In all cases institutional conditions proved to be crucial for the effectiveness of project/programme implementation. In the Hungarian case studies conflicts or missing coordination between institutions on different levels (regional, national, European) constituted the main bottleneck for sound programme implementation. In most other cases implementation within given institutional structures turned out to be advantageous. However it should be noted, that mostly institutions on national not regional level were the overall responsible authorities.
Assessment with regard to territorial development objectives
Analysed pre-accession aid interventions took territorial development objectives only partly explicitly into account. The orientation towards territorial objectives depended largely on the field of action and the overall framework determining the intervention. Programmes supporting regional restructuring like the Silesian LGF and the Hungarian regional restructuring programmes or the PHARE ESC programme in Estonia had an explicit orientation towards territorial development issues. While the LGF and the Hungarian restructuring programmes aimed at spatial cohesion on national level by supporting lagging regions the PHARE ESC programme in Estonia recently emphasised the competitiveness objective beside the cohesion objective on national level. An explicit focus on territorial development objectives can also be observed in case of transport infrastructure investments in Mazovia region. By forming part of the broader Pan-European transport corridor the investment aims at contributing to spatial integration on European level. ISPA environmental projects however are not explicitly oriented towards territorial development objectives although by fostering European-wide implementation of environmental directives they contribute to territorial cohesion in terms of equalisation of environmental standards.
Case study analysis showed the relevance of the three level approach when discussing policy impacts with regard to territorial objectives. From case study analysis several issues can be

148
highlighted. Firstly, case study on Mazovia region showed that objectives and impacts might be conflicting between different spatial levels. While the infrastructure interventions addressed objectives on macro and meso-level and also effects on these levels dominated, the regional micro-level was not taken into account when formulating objectives and was also only partly positively affected. Although the intervention thus contributed to spatial integration on macro and meso level, trends of disintegration on micro level were not positively affected respectively even further fostered. Secondly, reaching of impacts obviously depends on the scale of projects. In case of Silesian LGF regional restructuring has been addressed with the objective of cohesion on national level, effects however mainly occurred on local level, due to the limited budget of projects. Thus mainly cohesion on intra-regional level could be achieved. Thirdly the size of the country determines the relevance of spatial levels. In both small countries analysed – Malta and Estonia – the territorial developments on intra-national regional level seemed not to be of high priority. In both cases European interventions pushed national policies towards putting more emphasise on regional policies and thus on regarding territorial development objectives on meso and micro level. As in the case of Estonia could be observed the focus nevertheless remains on overall national development and European integration also in spatial terms what could simply be explained by the small size of their national economy.
Policy recommendations
From the above analysis tentative policy recommendations can be developed mainly with regard to the overall structure, objectives and implementation procedures of interventions.
1. First of all, for all interventions it should be decided whether territorial development objectives are relevant or even should be explicitly addressed. Furthermore relevant objectives should be precisely defined and criteria should be developed to enable assessment of impacts with regard to spatial objectives. Even if the spatial dimension is not explicitly addressed the awareness of spatial consequences of interventions should be developed.
2. Precise definition of objectives and assessment criteria also requests to regard all three spatial levels – regional, national and European. Conflicting objectives and impacts between spatial levels should be met in due time. Integration of actors from all three levels into the decision and implementation process could help to prevent negative side effects on one or the other spatial level.
3. Long-term integrated strategies are needed which address the main regional potentials and bottlenecks simultaneously to prevent shifting of problems either to other localities (e.g. in the field of transport infrastructure) or to other bottlenecks. One-sided investments seemed in most cases not to be effective, since the extent to which an enhanced potential can be utilised for fostering development depends on the state of several other potential factors. This seems to be especially relevant for infrastructure investments.
4. Functioning institutional structures are a prerequisite for successful implementation of programmes and projects. Capable institutional structures on all three spatial levels have to be developed and sound coordination mechanisms between all levels have to be set up. The institutional capacity is the most important factor for providing high regional absorption capacity.
5. Programmes and projects should be flexible in their scope as well as scale. There are no one-size-fits-all solutions, but to be effective and efficient interventions need to be adapted to the specific regional and national situation in terms of fields of action and in scale of project (especially if the field of action is predefined as in case of ISPA).

149
8.5 Overall Evaluation of Impact Analysis The following section aims to draw common conclusions on quantitative and qualitative impact analysis. Although both types of analysis faced severe problems limiting scope for significant results, comparison of both analysis contributes to enhanced interpretations of results and might lead to mutually supporting assessments.
Quantitative as well as qualitative analysis highlight that detailed assessment and measurement of territorial impacts of pre-accession aid are hardly to be achieved, due to first, methodological problems (e.g. separation of influences, low intervention level), second, data constraints (e.g. related to regionalised policy data) and third, the character of impacts itself (e.g. mainly indirect, long-term nature). These limitations have been discussed in detail in the respective sections.
As was to be expected against this methodological background, quantitative analysis did not reveal any direct relation between pre-accession aid spending and regional development in terms of GDP and employment dynamics. Although for some countries a positive relation between pre-accession aid spending levels and GDP growth per region could be observed no causality between these observations can be assumed. More promising, therefore, is the consideration of single regional development potentials on the one hand with respect to their contribution to overall regional development and on the other hand with respect to impacts of specific pre-accession aid interventions on the potentials addressed.
Correlation analysis showed a significant relation between the regional endowment with selected potentials and the regional performance in terms of GDP and employment dynamics. While the geographic position (level of accessibility), urbanisation and localisation advantages (sector structure) and the level of capital supply are potentials, which are related to levels of GDP change, changes of regional unemployment rates are related to the labour market potential (Human Capital Index) and urbanisation and localisation advantages (sector structure). Besides, preliminary regression analyses indicated for causal relations between the regional potential provision and socio-economic impact indictors, though impacts do not seem to be equally imminent on income growth and unemployment development.
Drawing these relations suggests, that pre-accession aid might affect overall regional developments as far as interventions support the improvement of selected regional potentials respectively the reduction of the analogous bottlenecks. However, this relation again could not be traced in quantitative terms, since correlation analysis indicated hardly significant relations between the change of endowment with single potentials and the level of pre-accession aid spending addressing the respective potential. Yet, these influences will only be measurable if the interventions tackle the respective potential in such way, that available indicators are affected, i.e. for instance labour market interventions might improve the qualification level of the labour force without showing reflections in the HCI, which is based on formal qualification grades only. Thus, this part of the territorial impact assessment could especially highlight relations between potentials and socio-economic development, indicating for those potentials which provide effective starting points for intervention.
These results point to the importance of overall regional framework conditions in terms of balanced endowment with all relevant development potentials. Regional development has to be considered as complex process driven by a system of interdependent potentials and influences from several spatial levels. Accordingly, balanced interventions addressing the complex structure of regional potentials are needed to increase impacts of policy interventions. This became obvious in the case study analysis as well, since one-sided interventions limited to infrastructure investments in the Hungarian region Szabolcs-Szatmár-Bereg failed to affect regional development trends, while diverse interventions within the Silesian Local Grant Fund have been assessed as meeting regional needs and revealing positive effects on simultaneous reduction of interdependent – though selected – bottlenecks. However, as the overview on regional pre-accession aid spending showed, a balanced mixture of priorities can be observed only in few regions, while in many regions spending concentrated on one field of action, thus neither being widespread nor tackling major problem

150
areas simultaneously. In particular, this applies to measures addressing human and business resources (subsuming measures addressing the labour market, innovation capacities, institutional conditions, urbanisation and localisation advantages, capital supply, regional market potential), of which often only one or two different priorities were funded in most regions. It can be, however, assumed that especially effects of these “soft” measures are mutually interdependent, since e.g. labour market interventions can only reveal impacts regional developments if the sector structure offers employment opportunities or sufficient capital supply allows to transfer high labour market potentials in qualitative terms into innovative activities.
Qualitative analysis of case studies, moreover, emphasised the importance of selected potentials not included in the quantitative analysis. In nearly all case studies, especially the influence of regional institutional conditions was highlighted. First, as the case study of Malta illustrated, interventions addressing the institutional conditions themselves can be expected to reveal indirect effects on spatial developments in the long-term as well. Second, the case studies showed that poor institutional conditions might considerably hamper the extent to which pre-accession aid interventions can be implemented successfully, as was highlighted in the Borsod-Abaúj-Zemplén case. Third, the other way round, successful implementation of pre-accession aid projects can affect regional institutional conditions positively by strengthening institutional structures and capabilities, as was pointed out in the Silesian case study.
In addition, the qualitative analysis provides insights into the mechanisms of how interventions affect regional potentials or even spatial developments. Especially the complexity of effects with regard to different spatial levels can not be grasped and distinguished in the quantitative analysis, thus qualitative analysis provides important support for comprehensive interpretations. E.g. quantitative analysis showed that the priority of transport infrastructure investments has been comparatively high in regions already showing relatively high levels of accessibility, these often being regions endowed with major urban agglomerations. One might argue, that these investments are nevertheless justifiable, since accessibility indicators do not fully take into account different qualitative levels of infrastructure. In the light of increasing traffic loads however, poor quality of transport infrastructure, in many of the main urban agglomerations in the New Member States and Candidate Countries, increasingly represents considerable bottlenecks for regional developments. As the case study of the Warsaw metropolitan region highlighted, these investments can nevertheless not be positively related to regional development impacts in any respect. Often transport infrastructure investments in regions of main agglomerations are related to transport corridors of national or European importance, thus affecting several spatial levels. Although these investments might be assessed as affecting positively the geographic position from a meso level perspective from a intra-regional micro level perspective they might be evaluated as not being of high relevance for improvement of intra-regional accessibility and socio-economic developments.
It has been stressed in several respects that the type of region has to be taken into account to facilitate expected territorial impacts of policy interventions. First, this applies to the overall regional targeting of funds. Quantitative analysis neither showed a clear targeting of funds towards regions with low GDP levels in national average, and thus towards the spatial cohesion objective nor towards regions with above national average GDP levels and dynamics, thus towards the competitiveness objective. Second, the regional characteristic in terms of potential endowment has to be taken into account to select the appropriate fields of actions. Also in this respect no clear variation of priorities/fields of action according to the typology of regions established by ESPON project 2.2.2 (old industrial, western border etc.) could be observed. It has to be noted however, that SAPARD funds, particularly relevant for rural regions, could not be included in the quantitative analysis. Case study analysis provided further evidence for the need of specific development strategies adapted to regional characteristics. While in Malta institution building measures on regional level proofed to be a prerequisite for further interventions, combined measures supporting economic restructuring showed positive effects in Silesia and investment in high-tech energy and telecommunication infrastructure in Szabolcs-Szatmár-Bereg did not meet the needs of rural Eastern region.

151
Quantitative as well as qualitative analysis underlined the importance of country specific differences in several respects. First, policy strategies differ significantly between countries. This has been highlighted in the quantitative analysis by relating regional pre-accession aid spending levels to regional GDP levels. In some countries high spending levels are related to low GDP levels, in some countries the other way round and in other countries no relation can be observed. This hints to different policy priorities in terms of spatial objectives addressed (cohesion – competitiveness). These findings were supported by case study analyses. While Hungary followed an approach of high support for the most lagging regions (although this approach has been adjusted recently), Estonia emphasised support for already competitive and dynamic regions beside support for lagging regions. Accordingly national strategies clearly affect impacts of pre-accession aid interventions on regional level. Second, different national institutional frameworks notably influence the extent to which pre-accession aid projects were implemented successfully and thus, to which extent they can be supposed to affect spatial developments. For instance, this became obvious in the Hungarian case studies. Third, quantitative analysis revealed that national macroeconomic frameworks and conditions are most important for regional developments, e.g. with regard to levels of unemployment. This gives further argument and significance to the already mentioned problem of separation of influences on developments on regional level on the one hand and of assessing regional impacts of interventions on national level on the other hand.
The comparison of regional spending levels and priorities in two successive periods which could, due to lacking data of potential indicators, not be included into the quantitative impact analysis but has only been provided as overview, indicates further findings. Since spending priorities shift notably within regions between the two periods, limited levels of continuity of pre-accession aid interventions can be assumed. Certain degrees of continuity of interventions are however requested for impacts to develop, especially in human and business related fields. Moreover, changes in regional spending levels and priorities might result in changing results of quantitative impact analysis for different periods. While funds related to environmental and transport infrastructure showed a relative stable picture in terms of types of regions mainly targeted, deviations could be expected for those measures related to human and business resources.

152
9 Regional and Spatial Impacts of Trans-national and Cross-border Co-operation
9.1 Introduction
Spatial impacts do not only derive from interventions within single regions, but level and forms of regional co-operations plays a crucial role for regional development as well. Relationships and links between regions are especially relevant in relation to the ESDP objectives of spatial integration. Therefore this chapter focuses on spatial impacts of EU interventions supporting trans-national and cross-border co-operation. EUs main financial instruments in this context are INTERREG programmes, PHARE CBC and TACIS CBC. Following these programmes are assessed with regard to their impact on the objective of spatial integration. Analysis is based on review of existing documents as well as case study findings. The methodological approach followed for case study analysis is described in the above chapter 5 on methodologies. The chapter is divided into three part: first a short overview on development of the mentioned programmes is provided, followed by results of the analysis on cross-border co-operation and results of analysis on trans-national co-operation.
EU interventions for supporting regional co-operation
The European Union granted support for cross-border pilot projects for the first time in 1989, when 14 groups of pilot projects were allocated a sum of € 21 million (under Article 10 of ERDF). These projects were designed to tackle the structural development difficulties of border areas in two respects: on the one hand, the institutional separation of border communities and the resulting economic and social separation; on the other hand, the actual peripheral location of cross-border regions in relation to their respective national economic centers. These pilot projects were the basis on which, in 1990, the Commission created the INTERREG I Community Initiative which developed 31 operational programmes involving an amount of € 1.085 million; most of the budget was available for Objective 1 areas. INTERREG I, aimed in particular at the economic development and restructuring of border areas. Launched the same year as a supplement to the INTERREG programme, the REGEN Initiative for its part aimed to complete some missing links in the trans-European network for transport and energy distribution in the Objective 1 regions.
In June 1994, the European Union adopted the INTERREG II guidelines (published on 1 July 1994) for the period 1994-1999. Approximately € 2.6 billion had been allocated to regional cooperation. This was the largest of all the Community Initiatives as far as the amount of subsidy is concerned. Its new regulations were wider than the Interreg I (1990- 1993) initiative as the former paid more attention to education, health services, information society, language training, planning development for the frontier areas and some complement programmes for the European networks density. Interreg II combined the functions of Interreg I and Regen.
It had three distinct strands with a total budget allocation of ECU 3,519 million in 1996 prices or € 2.6 million (of which ECU 2,613 are restricted to Objective 1 and 6 regions):
• INTERREG II A (1994-1999): cross-border co-operation • INTERREG II B (1994-1999): completion of energy networks
• INTERREG II C (1997-1999): co-operation in the area of regional planning, in particular management of water resources (flood mitigation & drought prevention)

153
Following the preceding INTERREG programmes (I and II) INTERREG III was launched to cover the period 2000-2006. INTERREG III has a total budget of € 4,875 million, jointly financed by the Member States and the Community (in the scope of ERDF). From this total budget, the Commission adopts allocations for each Member State.
The main objectives of INTERREG III are:
• Economic and social cohesion
• Balanced and sustainable development of the European territory
• Territorial integration with candidates and other neighbouring countries
By promoting cross-border, transnational and interregional cooperation negative effects of borders should be reduced and European integration should be strengthened.
In preparation for enlargement, Interreg III gives special attention to the Community's external borders. Cooperation involving the outermost regions of the Community, the Balkans and island regions is strongly encouraged. Interreg III will be implemented in three strands:
• Strand A - cross-border cooperation: promoting integrated regional development between neighbouring border regions, including external borders and certain maritime borders;
• Strand B - transnational cooperation: contributing to harmonious territorial integration across the Community;
• Strand C - inter-regional cooperation: improving regional development and cohesion policies and techniques through transnational/interregional cooperation.
Cooperation under Interreg III is based on the following principles:
• Programming: regions and territories wishing to cooperate must present the Commission with a Community Initiative Programme (CIP) defining their joint development strategy and demonstrating the cross-border value added by the operations planned. Programming must take account of the Structural Funds and Community policies: job creation, improving competitiveness, sustainable development, environment, equal opportunities, compliance with Community competition rules;
• Partnership: national, regional and local authorities and the economic and social partners are encouraged to participate in a bottom-up approach to development. Transparent publicity also should allow the widest possible degree of participation by public and private stakeholders;
• Implementation of Interreg III must be consistent and synchronized with the other financial instruments concerned. The ERDF is responsible for all operations undertaken on the Community's territory, while other of the Community's external-policy financial instruments, like Tacis & Meda can be applied to external territories.
On the basis of indicative financial allocations per Member State established by the Commission, the Member States make a breakdown of funding by strand, border or region.
The authorities responsible for programming are:
• Strand A: the regional or local authorities in partnership with the national authorities;
• Strand B: the national authorities (or other authorities designated by the Member States) in close cooperation with the regional or local authorities located in the geographical area where transnational cooperation is to take place, on the basis of a single programme for each area of cooperation;

154
• Strand C: the regional authorities (or other bodies designated by the Member States) or recognised intermediary bodies, on the basis of a single programme for each area of inter-regional cooperation.
The monitoring, implementation, financial control and evaluation of operations must comply with the general Regulation on the Structural Funds:
• The monitoring committee is made up of representatives of the regional, local, and even, possibly, national authorities, the economic and social partners and associations of the Member States and non-Community countries concerned. The committee sets the criteria for selecting operations, amends the programmes and is responsible for monitoring and evaluating the programme overall;
• The operations are selected and their implementation is monitored by a single steering committee for the entire programme or by as many steering committees as there are sub-programmes. The monitoring committee may in some cases act as the steering committee;
• in the case of operations involving partners in different Member States, the final beneficiary of the ERDF contribution will be the partner in charge of the operation (lead partner), which also bears financial and legal responsibility to the managing authority. The lead partner allocates responsibilities to the other partners, possibly in the form of an agreement.
Since INTERREG funds are only available for member states, additional instruments had to be found to enable third countries to take part in regional co-operations. Participation in cross-border co-operations was enabled for candidate countries with introduction of the PHARE Crocc-border Co-operation programme (PHARE CBC) and for third countries with introduction of TACIS CBC. National PHARE, ISPA and SAPARD funds can be used in the candidate countries to participate in INTERREG IIIB macro-regions programmes. The following table provided an overview of the mentioned programmes.
Table 9-1: Overview on INTERREG, PHARE CBC and TACIS CBC
Programme Participating Countries Main priorities INTERREG II (1994-1999)
Strand A (cross-border)
All NUTS III areas of the Community situated on internal and external borders
- Assist the community’s internal and external border areas in overcoming specific development problems
- Encourage of cooperation networks
- Promote adaptation of the external border areas
- New opportunities for cooperation with third countries
Strand B (interregional) Cooperation among selected regions in Greece, Portugal, Italy and Spain
Completion of energy networks (gas and electricity) – continuation of REGEN initiative
Strand C (transnational) - General transnational cooperation: Western Mediterranean and Latin Alps, South-Western Europe, ATLANTIC area, North Western Metropolitan area, North SEA Area, BSR, ARCHIMED
- to promote harmonious and balanced development in EU
- to foster transnational co-operation in the field of spatial planning by the Member States, regions and other authorities and participants;

155
- Flood mitigation: Flooding Rhein Maas (F, B, L, D, NL & Switzerland), France and Italy
- Drought Prevention: Portugal, Spain, Italy
participants;
- to improve the impact of Community policies on spatial development
Pilot actions under Art. 10- ERDF
- Northern Periphery (UK, FIN, S)
- Eastern Alps (A, I & D)
- Central and Eastern Mediterranean Space
- Archimed” (GR, Malta & Cyprus)
Same as INTERREG IIC
INTERREG III (2000-2006)
Strand A (cross border) Member states (NUTS III level territorial unit)
Promoting integrated regional development between neighbouring border regions, including external borders and certain maritime borders
Strand B (transnational) Macroregions: • Archimed • Baltic Sea Region • Alpine Space • CADSES • Atlantic Area • Northern Periphery • North Sea Region • South West Europe • North West Europe • Western Mediterranean
Contributing to harmonious territorial integration across the Community (spatial development/ transportation/ information society/ environment/ natural and cultural resources)
Strand C (interregional) Entire territory of the Community
(regions lagging behind and those undergoing conversion)
Improving regional development and cohesion policies and techniques through transnational/ interregional cooperation
PHARE CBC Borders between the ten Central and East European Candidate Countries and with the EU
Economic development/ training/ education/ environment/ labour market/ culture/media/ health/ social services.
TACIS CBC
Borders between partners in Eastern Europe and Central Asia (Armenia, Azerbaijan, Georgia, Kazakhstan, Kyrgykistan, Moldova, Russia, Tjikistan, Turkmenistan & Uzbekistan) and the EU or Candidate Countries
- assist border regions to overcome their developmental problems - encourage the linking of networks on both sides - accelerate the transformation process in the partner states - reduce transboundary environmental risks and pollution - technical assistance programme

156
9.2 Impacts of Cross-Border Cooperation
Border situations often imply significant disadvantages in terms of socio-economic development for the bordering regions which area characterised by a peripheral status within their country, cut off market and commuting areas. While border regions within the EU 15 have basically lost their peripheral status and partially even have become core zones of economic development, border regions along and between the New Member States of the EU are often still disadvantaged regions. Although trade barriers have been reduced between these countries and regions as well, there are other barriers, such as incompatible infrastructures, institutional procedures, disparities in legal systems and mental models still remain. These barriers are even more significant on the (new) external borders between New Member States and third countries.
Objectives, Structures and Effects of INTERREG II/IIIA, PHARE CBC and TACIS CBC
The EU takes the special development problems border regions are facing into account by implementing special programmes supporting cross-border cooperation. The main programmes developed for this purpose in the last decade were INTERREG IIA and IIIA as well as PHARE CBC and TACIS CBC. In the following these programmes are described with regard to objectives, implementation structures and existing evaluations.
INTERREG II A (1994-1999): cross-border co-operation
The overall objective of Interreg IIA was to help develop cross-border co-operation between frontier regions. This part of the initiative concerns direct co-operation between local/regional authorities and social partners on common planning and implementation of cross-border programmes and projects.
Areas eligible for Interreg II A were all NUTS III areas in the Community situated on internal and external borders. In certain cases and in the context of cross-border cooperation programmes, Community assistance could also be granted for measures undertaken in NUTS III areas adjacent to those listed:
• Provided they involve a high level of cross-border cooperation;
• They do not as a general rule concern more than 20% of total expenditure under the programmes concerned
In total 59 programmes were supported - 35 concerned internal borders, 24 external borders of the Community – which focused on the following issues:
• Development plans treating border areas as an integrated geographical unit
• Development of and support for SMEs, principally through the establishment of cross-border networks of commercial contacts between such firms
• Tourism & farm-based tourism
• Telecommunications and development of renewable energy resources
• Pollution prevention
• Rural development
• Improvement of agricultural productivity and support for cross-border trade
• Infrastructures (transportation & media)
• Cooperation at higher education level, between research centers and universities
• Cooperation on health

157
• Preparations for cross-border planning measures
• Prevention of illicit trade across external frontiers
In assessing the programmes submitted by the Member States, the Commission paid particular attention to:
• the existence of coherent strategy for the border areas concerned with an appropriate combination of structural measures for human resources
• in the case of internal borders, the likely impact of the measures proposed on development on both sides of the border
• in the case of external borders, the contribution that the proposed measures will make to promoting trans-national cooperation in as many areas as possible
• the complementary nature of financial assistance from the Community and of national and regional contributions
• the likely effectiveness of the provisions for implementation, monitoring and assessment and the degree of involvement of regional and local authorities in implementing these programmes (in the case of internal borders, joint provisions should be envisaged)
In the period 1994-1999, strand A was funded with ECU 2 400 million in 1994 prices, of which ECU 1 800 million were allocated to the Objective 1 & 6 regions. Only a limited amount was available for allocation to areas not eligible under Objectives 1, 2, 5(b) & 6. Loans could be granted by the European Investment Bank (EIB) and the European Coal and Steel Community (ECSC). Countries which were not members of the Union may not receive grants from the Structural Funds, but cross-border activities in areas of countries in central and Eastern Europe adjacent to the Union’s external frontiers could be financed under the PHARE programme.
INTERREG II A initiative is assessed to have added values in the European region and shortcomings, too. Added values can be seen in contributing to:
• The construction of Europe and the integration of regions belonging to the institutional structures of various Member States,
• Cohesion and economic and social cooperation between regions which are particularly disadvantaged due to the presence of borders,
• Opening up labour markets and harmonizing professional qualifications, thus promoting labour market unification at the European level,
• Implementing the principles of subsidiarity and partnership on the basis of direct participation by the local and regional actors and the socio-economic partners,
• Preparing the accession of new members in particular through cooperation and the transfer of know-how between Community regions and those in the candidate countries.
Added institutional value (acquaintance with and cooperation between territorial authorities and bodies as well as social partners) and the socio-cultural added value (exchanges of information and know-how in the regions) were additional achievements. In many cases, it is acceptable that a sound cross-border environment can be created for the economy, commerce and services only through socio-cultural cooperation.
The socio-economic added value is obvious in the following fields- even though regional disparities persist:
• Job creation in direct relationship with improvement of transport and communication structures

158
• Creation of jobs in the fields of tourism, training, research and cooperation between SMEs
• Improvement of transport services, first at national level and then at cross-border level
• Development of tourism (joint marketing, joint projects)
• Mobilization of endogenous potential through strengthening regional and local levels as partners in cross-border cooperation
• Involvement of social and economic actors (for example the Chambers of Commerce and Industry in Greece/ Bulgaria and in Nord-Pas-de-Calais /Wallonia /Kent and the trade unions/ workforce in the German-Dutch and German- Austria border regions.
On the other hand, INTERREG II has shown the following shortcomings134:
• In Southern Europe border regions often lacked experience with cooperation. The obvious result is that local and regional actors and special partners were only to limited extent involved.
• It is the border regions on the EU’s external borders which have to overcome the greatest obstacles during the implementation of INTERREG; this is due to their peripheral location, long isolation and separation from neighbouring countries.
In many cases the actual cross-border nature of INTERREG did not emerge very clearly, especially as regards the major INTERREG programmes which are directed mainly to infrastructure and endogenous development in the various border regions.
INTERREG III A: Cross-border Cooperation
Support for cross-border cooperation implemented under INTERREG IIA was continued with INTERREG IIIA which intended to develop cross-border economic and social centers through joint strategies for sustainable territorial development. The Member States spend at least 50% of their total allocation for Interreg III on this strand.
The zones eligible for Interreg IIIA are defined as the following NUTS 3 regions:
• All regions along the Community's internal and external land borders as well as certain maritime areas;
• Areas bordering on or surrounded by these eligible areas (up to 20% of the budget of the CIP concerned). These areas are, in particular, the city of Belfast and four Belgian districts.
Under INTERREG III A, priority is given to the following types of operation:
• promotion of urban, rural and coastal development: analysis of cross-border areas, planning and protection of cross-border areas (natural parks, industrial estates, forestry resources, coastal areas), cross-border tourism, joint creation and management of resources and infrastructure to prevent natural disasters;
• development of entrepreneurial spirit and small and medium-sized enterprises (SMEs), tourism, local development and employment initiatives: assistance for cross-border networks of economic relations between SMEs, for investment in businesses, creating an overall supply of cross-border tourism (promotion, market studies, joint reservation systems), setting up neighbourhood services for employment;
• creating an integrated labour market and promoting social inclusion: Promoting equal opportunities for men and women, developing cross-border partnerships between the
134 Community Initiative INTERREG II 1994-1999: An initial evaluation, January 2000. Information Paper issued by
the European Commission.

159
European employment services and information for workers, cooperation on vocational training, mutual recognition of diplomas, arrangements for transferring pension rights;
• cooperation on research, technological development, education, culture, communications, health and civil protection: Creating and using joint resources in these fields to improve the competitiveness of cross-border regions, organizing cultural events (exhibitions, festivals) with lasting effects in terms of cooperation and employment;
• environmental protection, energy efficiency and renewable energies: Preventing, controlling and rehabilitating environmental deterioration, encouraging the rational use of energy, recycling and waste elimination, creating and/or jointly using water treatment resources and infrastructure, using alternative energy sources, etc.
• basic infrastructure of cross-border importance: Removing obstacles to public transport, providing access to European transport networks, providing cross-border facilities in telecommunications and water and energy systems;
• cooperation in the legal and administrative fields: Reducing the problems posed by the existence of different legal and administrative systems (social security, tax, illicit trafficking, immigration and asylum, civil protection), improving security at external borders;
• cooperation between citizens and institutions: Language training, creating Funds with limited resources (micro project facility) to implement small projects for the citizens and to organise one-off events;
• Technical assistance: Studies on preparing cross-border strategies and assistance in setting up joint management structures.
According to the ex-ante evaluation135, the priorities and measures of an INTERREG III A programme must be contributing in a transparent way to the general aims of INTERREG, through:
• The choice of relevant types of action from a wide range of eligible types of action specified in the Guidelines of the Commission
• The manner in which these actions are implemented through cross-border cooperation (jointly developed and implemented projects, with partners from two sides of the border)
Also, it is really important to understand the dimensions of integration and to link them closely together. Also, understanding the extent to which the border is a factor’s development problem which could be overcome through cooperation and greater integration, and by exploiting common potential, is a precondition for a successful intervention through INTERREG. Internal consistency must be maintained within the programme, including the programming complement, covering all its aspects including objectives, priorities and measures, as well as method of implementation. Greater consistency is likely to be achieved by:
• Avoiding dispersion of actions and by ensuring that the intervention is focused on a small number of carefully chosen and defined priorities with appropriate and effective measures
• Having a clear understanding of how each “string” of objectives/ activities/ implementation methods ultimately leads to outputs/ results/ impacts.
135 Ex-ante evaluation and indicators for INTERREG (strand A&B), the new programming period 2000-2006, October
2000, European Commission.

160
In accordance with the general aim of strand A - promoting integrated regional development between neighbouring border regions, including external borders and certain maritime borders - the programmes will be expected to have an impact in terms of both dimensions, namely greater transborder integration and regional development. In terms of level of development, border regions are in situations corresponding to those recognised by the Structural Funds; but unclassified regions could also be included. External border regions represent an important category due to the special problems which they face. This presents the challenge of achieving an adequate “measurement” of the expected impact on social and economic cohesion. That is, it is required a more complex and subtle set of “measurement” rather than simple terms such as, jobs and GDP to reflect the impact achieved by the programme, including intermediate impacts and qualitative elements. The notion of integration is complex, covering socio-economic, physical and institutional aspects. Socio-economic aspects cover a particularly wide spectrum ranging from the extent to which local businesses operate on the opposite side of the border to educational/ cultural links. Institutional aspects can range in intensity: contacts/ forums/ working committees between counterpart bodies to the establishment of permanent cross-border structures. Finally, the absence of physical links can represent a basic shortcoming in cross-border integration, e.g. missing links between transport, energy and other infrastructure networks. The existing degree of integration may be “high”, “intermediate” or “low”:
• Low: if the two border regions operate as separate socio-economic units
• Intermediate: if various forms of cooperation between public institutions, private business and other interests from either side of the border exist and partly integrated or closely coordinated management of the INTERREG programmes are in place
• High: if the two sides of the border effectively function as a single socio-economic unit (cross-border region) with its own cross-border institutions.
INTERREG programmes are implemented in most regions in parallel to other structural interventions. Therefore, the complementarity and proportionality of the INTERREG intervention are major additional factors in deciding how to estimate the impact of the intervention. In the case of relatively small INTERREG programmes, which are clearly focused on achieving greater cross-border cooperation and integration, it will therefore be more appropriate to ask for impacts in terms of changes in development conditions rather than development itself. Conversely, if programmes were to be accepted under INTERREG IIIA with a limited degree of cross-border cooperation and integration, greater emphasis should need to be placed on other criteria, similar to those used for mainstream regional development programmes. In the majority of the internal land borders and some maritime borders in Northern Europe, there are already fully integrated management structures and processes in place for INTERREG IIIA programmes.
Phare – CBC
To mirror INTERREG IIA and subsequently IIIA in the candidate countries PHARE cross-border cooperation was introduced in 1994 within the PHARE programme. PHARE CBC in the beginning covered border regions between PHARE beneficiary countries and the EU Member states, in 1998 it was extended to cover border regions between candidate countries, which is important for contributing to economic development in the border regions of these countries and for preparing candidates as effectively as possible for participation in the INTERREG programme. With progress of the programme coordination with INTERREG IIIA improved step by step and since 2000 Joint Operational Programmes for all border regions between candidate countries and EU-15 countries as well as between candidate countries have been developed.
The main fields of cross-border action are: economic development, tourism, environment, training/ education/ labour market, culture/media, health/ social services (major importance). Transport and some other objectives represent a major field of action in the case of less

161
developed EU regions and most border regions covered by Phare CBC. Minimum size of projects is 2 MEUR but on all borders Small Project Funds (SPF) operate to involve local and regional authorities in smaller cross-border cooperation projects.
In the year of 2000 the total budget of Phare CBC was € 163 million, in 1999 it was € 180 million (same as it was in 1998). Of the € 180 million, 118 million was allocated to borders between the candidate countries and the EU, 34 million to borders between the candidate countries, 21 million to borders between non-candidate countries and the EU, and 7 million to the candidate countries bordering the Baltic Sea Region.
In the period 2000-2003 PHARE has provided 645.3 MEUR to support cross-border cooperation. Dominant field of action has been improvement of transport infrastructure and the environment (62% of total spending). With 15,5% of total funding Joint Small Project Funds also accounted for a significant part. Economic and social development was another important field of action with 12% of total funding.136
Only a minority of projects (about 10%) have explicitly identified a “mirror” project on the other side of the border, due to a large share of projects having either a primary focus on regional and local development, where the cross-border element is at the level of impact, rather than programming and implementation or providing de facto complementary activities funded outside of PHARE/INTERREG. PHARE CBC rules with separate tendering, assessment, contracting and financing present significant deterrents to applicants undertaking mirror or joint projects.137
Evaluation of PHARE CBC were in general quiet positive in the last years. Weaknesses of the first period from 1994-1998 have been addressed in the new PAHRE CBC regulation for the period 2000-2006. Beside the development of joint programming documents and the extension to borders between Candidate Countries, the integration of PHARE CBC to national regional policies and the establishment of joint bodies for programming and monitoring were the most important improvements138. These improvements also brought PHARE CBC closer to INTERREG IIIA procedures.
Mid-term evaluation for the period 1999-2002139 also stated positive effects of the PHARE CBC programme especially with regard to support for regional development and capacity building for INTERREG. Although in general PHARE CBC funded projects meet local needs and have immediate effects on economic and environmental conditions, impacts especially with regard to spatial integration are limited due to some shortcomings of the programme. The focus on transport and environmental infrastructure projects, while meeting local needs, does not directly contribute to the development of cross-border cooperation. Moreover the total amount of funding is comparatively small and the 2 MEUR guideline has limited the total number of projects. Moreover resulted the 2 MEUR guideline in the focus on infrastructure projects and a limited focus on “soft” actions. However SPFs demonstrated the potential to mobilize local level interest in cross border activities in areas other than infrastructure and environment.
PAHRE CBC has had a very strong positive impact with regard to capacity building for Structural Funds, since it provided local and regional authorities with experiences in developing and managing significant projects under EU regulations and working structures for programming and implementation have been put in place. In this regard especially Joint Small
136 EU Commission (2004): From Pre-Accession to Accession. Thematic Evaluation of PHARE Support Allocated in
1999-2002 and Implemented until November 2003 - Cross-border Cooperation.
137 EU Commission (2004): From Pre-Accession to Accession. Thematic Evaluation of PHARE Support Allocated in 1999-2002 and Implemented until November 2003 - Cross-border Cooperation.
138 EU Commission (2001): The PHARE Programme. Annual Report 2000.
139 EU Commission (2004): From Pre-Accession to Accession. Thematic Evaluation of PHARE Support Allocated in 1999-2002 and Implemented until November 2003 - Cross-border Cooperation.

162
Project Funds and Grant Schemes proofed to be of high importance since those are the closest approximation to Structural Funds-type measures.
TACIS CBC140
To support cross-border cooperation at borders between candidate countries and countries belonging to the Commonwealth of Independent States TACIC funds can be used. In 1992, the financing mechanism T.A.C.I.S. [Technical Assistance to the Commonwealth of Independent States] was created and served to provide economic support to countries of the Commonwealth of Independent States [CIS], i.e., to the States that developed as a result of the dissolution of the Soviet Union, with the exception of the Baltic countries. TACIS has been established by the European Union in order to promote the transition to a market economy, to reinforce democracy and the rule of law in the partner states in Eastern Europe and Central Asia (Armenia, Azerbaijan, Belarus, Georgia, Kazakhstan, Kyrgyzistan, Moldova, Mongolia, Russia, Tajikistan, Turkmenistan, Ukraine & Uzbekistan) and to link the EU to these thirteen partner countries in Eastern Europe and Central Asia. In addition, the programme aims to promote inter-state, inter-regional and cross-border cooperation between the partner states themselves, between partner states and the European Union and between partner states and the countries of Central and Eastern Europe. This cross-border cooperation serves primarily to:
• assist border regions in overcoming their specific developmental problems;
• encourage the linking of networks on both sides of the border;
• accelerate the transformation process in the partner states through their cooperation with border regions in the European Union and Central and Eastern Europe;
• reduce trans-boundary environmental risks and pollution.
• as a technical assistance programme, Tacis mainly supports the following measures: transfer of knowledge, expertise and know-how: organizing training, for example; industrial cooperation and partnerships between public and private bodies, with possible secondment of European specialists; technical assistance to accompany investment and investment financing, particularly in the areas of cross-border cooperation, promotion of SMEs, environmental infrastructure and networks; purchases of supplies required in the implementation of technical assistance.
The amount envisaged for the implementation of the total Tacis programme over the 2000-2006 period is € 3.138 billion. Since 1991 TACIS has committed € 2.3 billion, which permitted the realization of over 1500 projects.
When Tacis was initiated, technical assistance was a stand-alone activity, whereas the programme is now part of a complex and evolving relationship with each of the 13 countries concerned. Politicians and officials from the partner countries and the EU meet now on a regular basis. With the implementation of PCAs as well as the EU enlargement process, Tacis also becomes a more strategic instrument in the co-operation process between EU and partner countries. The new TACIS Regulation covers the years 2000-2006 [Council Regulation (EC, Euratom) No 99/2000 of 29 December 1999].
The new regulation is based on an understanding that co-operation is a reciprocal process, encouraging a move from ‘demand-driven’ to ‘dialogue-driven’ programming. More flexibility in the way that Tacis is structured will allow potential technical assistance to be mobilized and implemented according to the capacity of each partner country.
140 See 1st reference and Tacis Interim Evaluation, Synthesis report, July 1997,
europa.eu.int/comm./external_relations/ceeca/tacis/index.htm
163
In close cooperation with its partner countries, Tacis determines how the funds should be spent. This allows Tacis to effect financing in accordance with the policy of reforms and priority tasks of each country. TACIS functions similarly to the EU financing mechanisms that apply to other areas of the world. In other words, it is based upon proposals submitted for projects that are founded upon the general principles determined by the EU. An essential function of the program is the element of conditionality. That is, assistance is provided under specific terms primarily concerning the receiving States' approach to the democratic model and the market-oriented economy. On a national level, TACIS operates on the basis of an Indicative Program, which is agreed upon by both the Commission and the State involved, and which extends across a two-year period. The Indicative Programme reflects the general priorities set down in the text of the Regulations. The areas where TACIS funding is used are designed to complement each other, and each national or multi-country programme focuses on no more than three of the mentioned fields (institutional and legal reform, private sector and economic development, infrastructure networks, environmental protection, rural economy, nuclear safety), so that each can be most effective.
TACIS fundamental priorities over the course of the seven-year period between 2000 and 2006, and within the framework of assuming national initiatives, include the increase of trade activities, network development, the increasing of investment flow, regional cooperation regarding environmental issues, cross-border cooperation, and collaboration regarding Justice and Home Affairs issues.
TACIS regional actions aim to create a cooperative atmosphere between the CIS States, which will essentially assist in removing any problems in existence that concern relations between them, and broader infrastructures that vital to the development of relations between the EU and these countries. Nevertheless, the promotion of regional cooperation among the countries in Eastern Europe and Central Asia is not just the most appropriate way to deal with global challenges and issues of a trans-boundary nature faced by these countries, but also crucial for ensuring peace, stability and security as well as promoting sustainable economic and social development in a Pan-European context.
Case Study Analysis on Cross-border Cooperation
To deepen above analysis based on review of existing documents three case studies have been conducted. The following table presents main findings of case study analysis. Further information on case studies is provided in the Annex.

Table 9-2: Overview on Cross-border Case Study Findings
Region Polish-German Border Region (Viadrina) Hungarian-Slovakian Border Region Hungarian-Ukrainian Border Region
Spatial identity Euroregion Viadrina is situated within the East-West trade and traffic corridor Berlin-Warsaw-Moscow. The area of Polish part is 1/4 larger than the German one (10.000m2 for both in total), but at the same time the number of inhabitants is 1/8 lower. The total population is approximately 850.000, presenting a very low population density in both parts of the border region. There is only one big city in the region -Gorzow Wielkopolski and it might be regarded as a regional urban and economic center. The total number of border checkpoints within Euroregion is 6: 4 roads and 2 railways. About 50 percentage of the entire commodity transfer between Germany and Poland is funneled through the Frankfurt-Oder – Swiecko border checkpoint.
The unemployment rate is very high in the Euroregion (between 20% and 25%) due to significant increases since 1998. The balances of migration both inner and foreign are negative, but are countered by positive birth rates. The employment structure on Polish side shows a lower share of agriculture than national average, but considerably higher share than the German side (22,5% against 4%). The region’s economic structure shows a variety of sectors with small and medium enterprises. Most of them employ less then 5 people. Economic
The regions along the 679 km long border were typically peripheral regions in Hungary. The border region can be divided into two parts: a) Danubian region: traditional transportation and industrialised zone, which is characterized by gradual stability and slow rearrangement from old industrial structures to new competitive industries and services. b) Eastern Slovakian border zone: peripheral region with mainly agricultural character, but a few large-scale heavy industries, which are in a crisis now. The border region is characterised by significant and lasting employment tensions. The transformation of the economic structure is extremely slow, the endowments of agricultural production are unfavourable, the service sector has not really appeared yet, the demographic erosion (ageing, increasing proportion of the Gypsy population) is advancing.
The Hungarian–Ukrainian border has always been one of the most closed borders since it was designated in 1920. Also in the future the Hungarian–Ukrainian border will remain an external and strictly defended border of the European Union, which will restrict the everyday cross-border relations. Both regions have always been a periphery between Hungary and Transylvania. The population has been decreasing and outmigration has characterised both border regions.
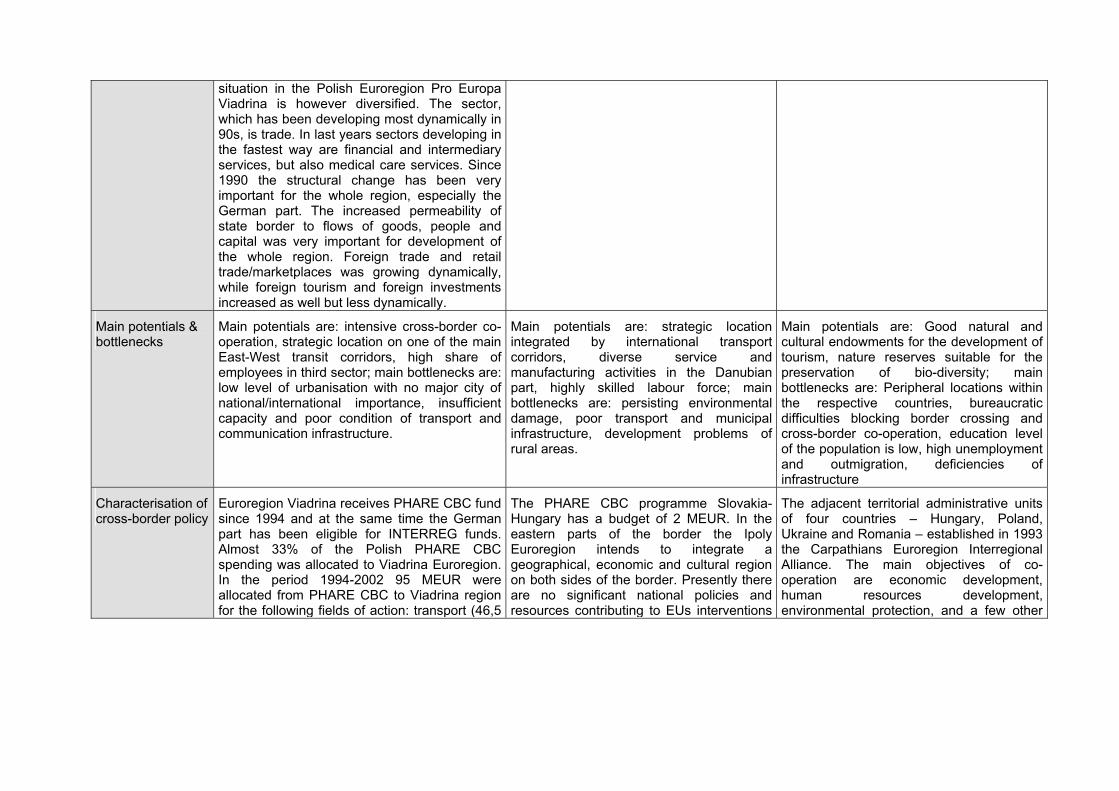
situation in the Polish Euroregion Pro Europa Viadrina is however diversified. The sector, which has been developing most dynamically in 90s, is trade. In last years sectors developing in the fastest way are financial and intermediary services, but also medical care services. Since 1990 the structural change has been very important for the whole region, especially the German part. The increased permeability of state border to flows of goods, people and capital was very important for development of the whole region. Foreign trade and retail trade/marketplaces was growing dynamically, while foreign tourism and foreign investments increased as well but less dynamically.
Main potentials & bottlenecks
Main potentials are: intensive cross-border co-operation, strategic location on one of the main East-West transit corridors, high share of employees in third sector; main bottlenecks are: low level of urbanisation with no major city of national/international importance, insufficient capacity and poor condition of transport and communication infrastructure.
Main potentials are: strategic location integrated by international transport corridors, diverse service and manufacturing activities in the Danubian part, highly skilled labour force; main bottlenecks are: persisting environmental damage, poor transport and municipal infrastructure, development problems of rural areas.
Main potentials are: Good natural and cultural endowments for the development of tourism, nature reserves suitable for the preservation of bio-diversity; main bottlenecks are: Peripheral locations within the respective countries, bureaucratic difficulties blocking border crossing and cross-border co-operation, education level of the population is low, high unemployment and outmigration, deficiencies of infrastructure
Characterisation of cross-border policy
Euroregion Viadrina receives PHARE CBC fund since 1994 and at the same time the German part has been eligible for INTERREG funds. Almost 33% of the Polish PHARE CBC spending was allocated to Viadrina Euroregion. In the period 1994-2002 95 MEUR were allocated from PHARE CBC to Viadrina region for the following fields of action: transport (46,5
The PHARE CBC programme Slovakia-Hungary has a budget of 2 MEUR. In the eastern parts of the border the Ipoly Euroregion intends to integrate a geographical, economic and cultural region on both sides of the border. Presently there are no significant national policies and resources contributing to EUs interventions
The adjacent territorial administrative units of four countries – Hungary, Poland, Ukraine and Romania – established in 1993 the Carpathians Euroregion Interregional Alliance. The main objectives of co-operation are economic development, human resources development, environmental protection, and a few other

MEUR), environment (25,2 MEUR), economic development (1,5 MEUR), human resources (16,5 MEUR), Small Project Fund (5,4 MEUR). In addition projects funded from PHARE, ISPA and SAPARD have been implemented in the territory of Euroregion Viadrina.
The biggest investments are the following:
• Modernisation and upgrade of National Road No 22 (Kostrzyn-Gorzów Wielkopolski) (30,9 MEUR),
• Modernisation of railway line and border crossing point Rzepin – Kunowice (23,3 MEUR),
• Construction of Collegium Polonicum (16 MEUR).
• Modernization of the waste treatment plant in Gorzów Wielkopolski (15,2MEUR),
• Solid waste management facilities in Słubice (6 MEUR)
Case study will focus in particular on impacts of the modernisation and upgrade of National Road No 22 as well as of the Small Project Fund (SPF).
Modernisation of National Road 22 on the segment between Gorzów Wielkopolski and Kostryn (border-crossing point) was with 30,9 MEUR the largest investment of whole PHARE CBC programme and claimed 25% of total EU funds allocated to the Polish side of Viadrina Euroregion.
for the support of cross-border co-operations.
concrete projects (border crossing stations, logistic park in Záhony etc.). The co-operation has been stimulated by only recently available EU resources. 500 000 Euro was available for projects last year, from projects with a minimum of 10 000 and a maximum of 50 000 Euro budget. From this 20 projects were supported and the Szabolcs-Szatmár-Bereg development agency was assigned to establish a cross-border cooperation office. However, due to the different administrative levels and competencies and the basically different problems of the adjacent countries, neither the central nor the regional tiers can devote sufficient attention and more importantly resources to the co-operation.

In 1995 SPF was introduced in the Euroregion aiming at supporting socio-cultural activities undertaken by local entities from the Euroregion. Main field of activities are: cultural exchange, exchange of youths, supporting local democracy, development of human resources, economic development, tourism and common spatial development plans and studies. In the years 1995-2001 3.3 MEUR were spend for the SPF on the Polish side of Viadrina Euroregion for implementation of 484 projects. 70% of projects were connected to cultural activities and youth exchange, 19% to economic development and tourism, 7% to human resource development.
Assessment of policy with regard to potentials/ bottlenecks addressed
Regarding the total PHARE CBC intervention in the Euroregion Viadrina they seem to be oriented towards the main bottlenecks:
- insufficient capacity and poor condition of transport infrastructure PHARE CBC 1994-2002, ISPA 2000
- insufficient environmental protection infrastructure, (special sewage systems and waste water treatment plants) PHARE CBC 1994-2002,
- low level of high educated people and “brain drain” process PHARE CBC 1994-1999
Detailed assessment can be provided for the National road 22 project and SPF.
Analysis on National Road 22 project showed that it was only to a limited extent oriented
The allocated sums were low and concentrated on a few areas (development of transport connections). However, physical barriers are a main bottleneck in the border region which needs to be addressed with priority. Interventions contributed to the gradual building out of the social frameworks of co-operations (CREDO programme). A main obstacle to co-operation are political tensions and institutional barriers due to incompatible institutional structures on both sides of the border.
The strong existing bottlenecks at the Hungarian-Ukrainian border in the fields of institutional conditions, physical links, economic disintegration and cultural differences have not been addressed sufficiently in the past. Interventions seemed to be too fragmented and in total too small.

towards main regional bottlenecks and needs due to the following effects:
- border crossing point in Kostryn has rather a local than a regional character
- modernised road 22 was uncompetitive in comparison to the alternative road 132 in terms of traffic volumes
- no significant local development process along the new road could be observed, while such a process might take place along alternative road owing to establishment of new industrial park in Witnica, co-financed by Phare CBC programme
- spatial connections of companies situated in special economic zone in Kostrzyn are not oriented toward road 22
- Road no 22 is not part of strategic plans regarding development of transport infrastructure in Euroregion Viadrina, which includes construction of a new border crossing suitable for heavy lorries in Kostrzyn together with a city by-pass and multi-stage modernisation of voivodship road no 132.
Small Projects Fund is assessed to have significant impact on social integration in the border region. Some effects on integration are to be highlighted:
- Mass events, concerts and other fests supported the process of social interaction between people living on both sides of the border. One of the most perceptible events are those connected with exchange of

youth from Polish schools with youths from German schools. Openness to the world problems and world-events, improvement of language skills are the most important effects of such events.
- Local governments and the Euroregion are main beneficiaries of SPF. They learned very efficient and fast how to use the SPF resources.
- The largest share of projects were implemented by the largest municipalities (Gorzow Wielkopolski 1/3 of all projects, Słubice 10% of projects) or municipalities close to the border. Projects, which were implemented in the larger cities like Gorzow Wielkopolski have regional and even larger area of influence, whereas the projects in small cities are mainly on a local scale.
- The improving quality of projects affected more and more spectators from outside of the Pro-Europa Viadrina Euroregion. The projects enabled strengthening of the co-operation between different institutions from the region, both municipal governments and business entitles.
Assessment of policy with regard to territorial objectives
Impacts of the analysed projects on spatial integration is hardly to evaluate in quantitative terms.
In case of modernisation of road No. 22 this is due to the short time period since completion of the investments. Though in general efficient transport connections between Polish and German side of Pro-Europa Viadrina
Due to the mentioned problems the impact on spatial integration in the border region seems to be low.
So far policies primarily focusing on the Euroregion seemed not to contribute to spatial integration to a large extent. This is due to the low level of interventions on the one hand and strong barriers existing on national level defined by the situation as now external EU-border on the other hand.

Euroregion is a necessary precondition for spatial and socio-economic integration of the entire region, impacts of this project might be limited due to the mentioned facts.
Unambiguously, the effects of small euroregional projects are positive and they have a significant influence on the process of social integration in Pro-Europa Viadrina Euroregion. However, because of the “soft nature” of such projects, it is hard to estimate quantitatively the scale of these effects.
Preliminary spatial policy recommendations
• Continuation of Small Project Fund, what may bring noticeable social effects at relatively small costs.
• Choice of transport infrastructure projects on basis of regional transport strategies to ensure high relevance of the investments for regional transport flows and the regional economy.
• Support of institutional cooperation on regional level in order to provide the basis for cooperation in further fields of action.
• Concentration on cooperation projects in socio-cultural fields of action, since these seems to be the most promising fields of fostering integration under conditions of relatively impermeable borders and low budgets for cross-border programmes.

171
Comparability of case studies
The three analysed border regions differ significantly in their socio-economic development potentials and the degree to which the border affects the regional situation. While the Polish-German border can be assessed as being rather permeable and situated on an important axes between the agglomerations Berlin and Warsaw, the Hungarian-Slovakian border region has a far more peripheral character and the border seems to be less permeable. The two factors of peripheral status and impermeable border is even stronger in case of the Hungarian-Ukrainian border. Accordingly the Polish-German border seems to be the one with the highest degree of integration amongst the three cases so far. Moreover although the border region shows significant development problems, e.g. in terms of high unemployment rates, selected economic sectors like trade, retail, foreign tourism and FDI developed dynamically in the last years. Development problems in the two border regions between Hungary and Slovakia as well as Hungary and Ukraine seem to be more severe and the border situation did not provide advantages even for selected economic activities.
All three border regions established Euroregions in the Mid-1990s. However Pro-Europa Viadrina Euroregion on the Polish-German border seems to be far more active than the other two. Also with regard to EU funding the Polish-German border region is clearly favoured in comparison to the two other regions. While the Pro-Europa Viadrina Region received 95 Mio. € PAHRE CBC funds in the period 1994-2002, the Hungarian-Slovakian border region received only 2 Mio. € annually in the last years and the Hungarian-Ukrainian even less with annual 500.000 €.
The three case studies differed significantly in their research approach, what provides the main limitation towards comparative analysis. While in case of the German-Polish Viadrina Euroregion detailed analysis has been conducted for selected projects the other two case studies remained on a rather cursory level reviewing the border situation in general.
Limitation of impact assessment
Assessing levels of integration on regional scale faces large difficulties due to lack of data even for simple indicators like import/export on regional level. Moreover the general problem of impact assessment, e.g. regarding separation of influences applies to development of border regions and spatial integration trends as well.
In case of projects analysed in the Polish-German border region detailed data was available for the project’s effects on Polish side. These data derived from existing studies and by far exceeded the possibilities provided within ESPON 2.2.2. for empirical work. Although these data provided important basis for impact assessment its significance is restricted by the limitation to the Polish side of the border region. Beside these data problems general problems of impact assessment already mentioned applied as well to this case study.
Complete lack of data and detailed information in the other two cases clearly limited the scope for impact assessment.
Assessment of policy with regard to potentials / bottlenecks
All in all cross-border cooperation programmes addressed the main regional bottlenecks resulting from the border situation, namely missing infrastructure links, weak economic structures due to limited market and commuting areas as well as institutional and mental barriers. However the extent to which the different fields of action affect spatial integration of border regions vary.
Improvements of transport infrastructure can be assessed as important measures in order to overcome the physical barriers of borders. To show impacts in terms of supporting cross-border integrations on the one hand and strengthening regional development in the regions on both sides of the border on the other hand infrastructure projects have to be well chosen. To support spatial integration infrastructure investments should address the main transport

172
bottlenecks for cross-border transport. In this respect one has to differentiate between cross-border transport that is of national importance, e.g. transit transport from Warsaw to Berlin at the German-Polish border and cross-border transport that is of regional importance, e.g. commuting traffic from Slubice to Frankfurt/Oder at the German-Polish border. Since cross-border cooperation programmes should address the border regions in the first place transport infrastructure investments with high regional importance should have priority. These investments need to be embedded into regional transport strategies to reveal the largest possible impacts also in terms of fostering regional development on both sides of the border. As the case study on the Viadrina Euroregion at the Polish-German border showed investments funded by the EU’s cross-border programmes do not always fulfil these criteria.
Small Project Funds turned out to be an efficient instrument to foster socio-cultural integration. By addressing and integrating local authorities and the border region’s population cultural and mental barriers could be reduced. In the long-run especially cooperation in the field of education including language exchanges will have positive effects on integration of the border regions. Beside the Small Project Funds “soft” measures supporting cooperation in the fields of education, business or culture seem to be of less priority within cross-border cooperation. From the point of view of spatial integration on regional level these measures would however be of great importance.
Cross-border cooperation programmes in the candidate countries had significant impact on institutional capacity building. Small Project Funds prepared local and regional authorities for project application and implementation under future INTERREG programmes which will include similarly structured “Microprojects”. And also the other fields of action under PHARE CBC contributed to capacity building of respective institutions by getting acquainted with project application and implementation regulations.
In case of relatively impermeable borders like the Hungarian-Ukrainian one cross-border cooperation measures seemed to be too restricted in terms of fields of action as well as budget. Since in these cases border relations are dominated by political decisions on national or EU level, e.g. with regard to trade barriers, or national political tensions reflecting at the border regions, regional cooperation can only play a minor part in supporting integrated development of the border regions. Since the regions bordering third countries are moreover often the most underdeveloped within the new member states or candidate countries the budget of cross-border cooperation programmes is far too low to address the regional bottlenecks for socio-economic development and spatial integration.
Assessment of policy with regard to spatial development objectives
Spatial impacts of cross-border cooperation programmes are twofold: on the one hand they contribute to spatial integration and on the other hand to regional development within the border regions. All in all impacts on regional development within the border regions and thus on spatial cohesion seem to prevail over impacts on spatial integration. Only a minority of projects support cooperative actions in the field of education, culture or business and often projects lack “mirror” projects on the other side of the border. “Single” projects only implemented on one side of the border as well as infrastructure projects, e.g. environmental infrastructure investments often have rather a regional development character than contributing directly to spatial integration. Although prosperous development on both sides of the border might as well support border regional integration in the long run, CBC programmes seem to be often used as additional financial source for development projects, which could be financed from other sources as well (e.g. ISPA, PHARE) instead of concentrating on cooperative and integrative projects.
Most fields of action clearly address and affect the regional micro level, but three level approach has to be taken into account again for transport infrastructure investments. Improvement of infrastructure might either be targeted at local and regional transport or transnational transport thus supporting spatial integration on a meso or macro level but not necessarily on regional micro level.

173
Impact on spatial integration of cross-border cooperation programmes on the external borders between candidate countries and third countries is limited, since these borders’ situations are largely determined by national politics. Fostering institutional cooperation and integration on regional level, as far as administrative regional levels exist in the neighbouring countries, thus is a prerequisite for further cooperation measures in other fields of action.
All in all the already existing level of spatial integration in the border region obviously defines the scope of cross-border cooperation programmes. While relatively integrated border regions provide several possible fields of cooperation, institutional, political and mental barriers on the external borders hamper cooperation in socio-economic fields.
Policy recommendations
Case study findings supported by the general analysis on cross-border cooperation programmes allow for the following tentative policy recommendations:
• Cooperative character of programmes should be increased, e.g. by increasing the share of “mirror” projects or by increasing the share of “soft” measures with cooperative character in order to address spatial integration trends beside separated regional development trends.
• Small Project Funds and other measures targeting at the socio-cultural or business cooperation field should be continued and strengthened since projects of these type promise noticeable social effects at relatively small costs.
• Especially infrastructure investments should be chosen on basis of existing regional development strategies to ensure high relevance of the investments for regional potentials and bottlenecks. Selection of projects should take into account and differentiate possible impacts on different spatial levels.
• Fields of action have to be varied according to the type of border. In case of relatively impermeable border regions with only minor experience of cooperation support for institutional cooperation on regional level plays an important role. Reducing institutional bottlenecks only lays the basis for cooperation in further fields of action. In addition cooperation projects in socio-cultural fields of action seem to be the most promising fields for fostering integration under conditions of relatively impermeable borders and low budgets for cross-border programmes.
9.3 Impacts of Trans-national Integration Measures
During the 1990s EU Member States recognised the need to get involved in a more operational way in co-operation on regional & spatial planning on trans-national level. This was the result of the increasing economic integration and interdependence between Member States and regions (with the internal market) and of new common challenges resulting namely from major economic trends, such as the globalization of the economy.
Trans-national co-operation in the early 1990s had been developing in two parallel and complementary ways:
• With the joint reflection carried out with the development of an integrated long term strategy for the development of the territory of the Community resulting later in the development and adoption of the ESDP. Discussions and preparations for the ESDP already set the framework for action to be taken under INTERREG II C.
• At the operational level, with transnational co-operation programmes to develop concrete projects in the field of regional and spatial planning.

174
Under this framework a specific strand was introduced within the INTERREG programme for supporting trans-national co-operation - initially under INTERREG IIC, later continued as INTERREG IIIB.
Objectives, Structures and Effects of INTERREG IIC /IIIB
INTERREG IIC
In 1997 INTERREG IIC (total budget 412.84 MECU) was launched for supporting co-operation in the area of regional planning, in particular management of water resources (flood mitigation & drought prevention). It clearly differed from INTERREG II A because it concerned transnational (and not simply cross-border) co-operation over broader areas and in terms of its objective, involving the territory more deeply and specifically on questions of regional and spatial planning. The aim of INTERREG IIC was to:
• Promote harmonious and balanced development of the territory of the European Union;
• Foster transnational co-operation within a common framework in the field of spatial planning by the Member States, regions and other authorities and participants;
• Contribute to improving the impact of Community policies on spatial development and
• Help Member States and their regions to co-operate on a pro-active approach to common problems, including those linked to water resource management caused by floods and drought.
Trans-national cooperation between national, regional and local authorities thus aims to promote a higher degree of territorial integration across large groupings of European regions, with a view to achieving sustainable, harmonious and balanced development in the Community and better territorial integration with candidate and other neighbouring countries. The entire territory of the Community was eligible for the purposes of trans-national cooperation within the framework of macro-regions. The following macro-regions have been established: Western Mediterranean, Alpine space, Atlantic area, South-west Europe, North-west Europe, North Sea area, Baltic Sea area, Cadses, Northern periphery, Archimed, Caribbean area, Azores-Madeira-Canaries area, Indian Ocean area.
Cooperation within macro-regions was one of three major fields of actions, for which Member States are co-operating on joint Operational Programmes:
• General transnational cooperation within defined macro-regions (total budget ECU 120.69 million)
• Flood mitigation (ECU 148.15 million)- Flooding Rhein-Maas (F, B, L, D, NL & Switzerland), France & Italy
• Drought prevention (ECU 114 million)- Portugal, Spain, Italy
In parallel to the Interreg IIC programmes, and following the same objectives and type of cooperation, four pilot actions under ERDF Article 10 were adopted, receiving €20 million:
• Northern Periphery (UK, FIN, S)
• Eastern Alps (A, I & D)
• Central and Eastern Mediterranean Space “Archimed” (GR, I, Malta & Cyprus)
• Mediterranean Gateway (Spain, Portugal & Morocco)

175
INTERREG IIC - CADSES
The Central, Adriatic, Danubian and South-Eastern European Space (CADSES) was established in 1997 covering a wide geographical area including regions, belonging to four Member States: Austria, Germany, Greece and Italy as well as to fourteen Non Member States: Albania, Bosnia Herzegovina, Bulgaria, Croatia, Czech Republic, Federal Republic of Serbia and Montenegro, Former Yugoslav Republic of Macedonia, Hungary, Poland, Republic of Moldova, Romania, Slovak Republic, Slovenia, Ukraine. The macro-region faces significant challenges for a stabilised, integrated development due to strong economic and social imbalances, the ongoing process of integration into the EU, the ongoing process of economic transition and the experiences of recent conflicts. The joint strategy developed under INTERREG IIC programme was meant to meet these challenges. The programme supported the following measures:
Measure A: Initiatives for the launching of a co-operative spatial planning process.
Measure B: Promoting co-operation for the establishing of more balanced and polycentric urban systems and settlement patterns.
Measure C: Development of multimodality in transport systems and parity of access to infrastructures.
Measure D: Co-operation for the improving of access to knowledge and information.
Measure E: Prudent management and development of natural and cultural heritages.
Measure F: Technical assistance.
The Community contribution amounted to € 21.5 million, with a total projected investment of € 38.3 million, the remainder being provided by national authorities. In addition PHARE programme may also contribute up to € 10 million depending on the participation of the third countries and the quality of the supported projects. In total 330 projects were supported.
Evolution of the programme in the years 1997-1999 has been assessed in the interim and final evaluation. The assessment of the interim evaluation was positive although it had remarked weaknesses and threats. In particular, high participation of CEEC at project level and high capacity of utilisation were remarked as strengths of the programme implementation. On the other hand, weaknesses have been recognised: strong anchorage in the official administration, partly weak spatial development references, difficulties in finding transnational co-operation partners, dominance of transport projects, strong differences between Member States regarding the number and the dimension of projects.
The final evaluation report stated with regard to programme management: “In spite of the difficult starting conditions of INTERREG II C CADSES, the programme management has been successful. It must be kept in mind that CADSES includes EU Member States, accession countries, as well as non-accession countries. Furthermore, the Balkan conflict is at the centre of the area. Taking these factors into consideration, it must be said that the programme management has demonstrated considerable efficiency and flexibility in dealing with them. From the very beginning CADSES has been characterised as a learning programme.”
Nevertheless some general weaknesses of CADSES implementation were identified in the final evaluation as well:
- difficult co-ordination of INTERREG and PHARE programmes
- need to increase information to potential project applicants about the financial control system and the payment procedures
- need for stronger links and networks with key persons at the regional level
- need to improve transnational publicity activities for marketing the programme and its outcomes

176
- need to support synergies between projects and between various funding programmes. These aspects have been considered as “lessons from the past experience” during the preparation of new CADSES II programming period (2000-2006).
INTERREG III B: Trans-national Cooperation
The objective of general trans-national cooperation of INTERREG IIC was continued under INTERREG IIIB for the period 2000-2006. The macro-regions established under INTERREG IIC have been maintained. Cooperation on the Community's external borders, between island and maritime regions and regions with common handicaps such as the harsh conditions in mountain zones, is particularly encouraged. In the case of the outermost regions (the French overseas departments, the Canary Islands, the Azores and Madeira), the aim is to improve economic integration among themselves, with the Member States and with their neighbouring non-Community countries. The Member States allocate at least 14% of their overall allocation for INTERREG III to Strand B. Taking account of Community policy priorities and the recommendations of the European spatial development perspective (ESDP), cooperation focuses on the following:
• spatial development strategies, including cooperation among cities and between rural and urban areas with a view to promoting polycentric and sustainable development: strategic studies, networking among metropolitan areas and medium-sized cities, networking of spatial planning and research institutions;
• development of efficient and sustainable transport systems and improved access to information society: connecting secondary networks to (trans)national networks, not including the construction of motorways and main roads, promoting the use of information and communication technologies in the business sector, transferring know-how and technology among local authorities;
• promotion of the environment, sound management of cultural heritage and natural resources, in particular water resources: development of the European ecological network (Natura 2000), joint strategies for risk management in areas prone to natural disasters (flood and drought prevention), concerted management of coastal waters;
• Technical assistance for the establishment of transnational partnerships: creation of joint structures for implementing the transnational cooperation programme.
Thus trans-national cooperation aims to promote economic and territorial integration in different areas of cooperation and to contribute to balanced and harmonious development across the EU. The main characteristics of this cooperation important to be taken into consideration, are:
• The identification of common problems and challenges across the large groupings of neighbouring regions
• The global impact sought from the intervention which should benefit the entire zone of cooperation
• The nature of the interventions which comprise an integrated territorial strategy to respond to the stated problems, complementing the actions undertaken under development (objective 1) or conversion (objective 2) programmes.
The financial resources for the transnational strand will in principle be less than those allocated to cross-border cooperation (INTERREG IIIA) but the allocations are much higher than those available in the previous period under INTERREG IIC; they will thus permit financing of investment projects and not simply studies or the exchange of experience. As regards infrastructure, however, the Commission clarifies in its Communication that only infrastructure on a small scale can be considered because of the limited financial resources; motorways, the construction of primary routes and other similar infrastructure is excluded. In addition, the degree of cooperation existing between the regions concerned can vary, but the

177
logic of the objective of the policy of cohesion and of this strand of INTERREG in particular is that the regions concerned should evolve towards a higher level of cooperation and integration in their actions.
Transnational co-operation in Interreg IIIB is organised by the following Administrative structures:
• Programme Implementing Authorities: Managing Authority; Paying Authority; Joint Technical Secretariat; National Contact Points.
• Bodies supporting the selection and implementation of projects: Monitoring Committee; Steering Committee; Conference of Regions; National Committees; Transnational working groups.
From the point of view of economic and territorial integration the added value of interventions in the area of cooperation should be appraised according to the types of actions and cooperation recommended:
• contribution of the projects and their groups of projects with regard to trans-European transport networks,
• extent to which the studies throw light on the common opportunities and challenges identified on the scale of the area of cooperation and on useful solutions,
• extent to which the networks strengthen the cooperation (enterprises, public transport, protected areas, universities etc, responsible for the promotion of equality between men and women, administrations, metropolitan areas, etc),
• quality of common structures of cooperation.
So, the evaluation of INTERREG III B implies a need to verify the extent to which the priorities of ESDP, Community Policies and INTERREG IIC achievements are taken into account when the programme is developed. Also, the degree of cooperation existing between the regions concerned can vary, but the logic of the objective of the policy of cohesion and of this strand in particular is that the regions concerned should evolve towards a higher level of cooperation and integration in their actions. Concluding, all operations co-financed by the Structural Funds must be in conformity with other community policies, including the rules on competition, the award of public contracts, the environment and equality of opportunity.
INTERREG IIIB – Baltic Sea Region
The Baltic Sea Region (BSR) was established under INTERREG IIC and under INTERREG IIIB for the period 2000-2006 a new joint programme was developed. The macro-region is composed of Denmark, Sweden, Finland, Germany, Estonia, Latvia, Lithuania, Poland, Russia, Norway and Belarus. The INTERREG IIIB programme for the Baltic Sea Region aims at “strengthening economic, social and spatial cohesion by focusing on disparities between different territories in order to reach an increased level of BSR integration and to form a sustainable part of Europe”141.
According to this overall objective the following priorities are supported:
1. Promotion of spatial development approaches and actions for specific territories and sectors
2. Promotion of territorial structures supporting sustainable BSR development
3. Transnational promotion of institution building strengthening the capacity for spatial development activities
4. Special support for regions bordering candidate countries
141 Baltic Sea Region INTERREG IIIB presentation. www.spatial.baltic.net/programme.html.

178
5. Cross-border co-operation priority Latvia-Lithuania-Russia 6. Technical assistance.
Until June 2004 68 projects have been approved and funds amounting to 70 MEUR have been committed. 27 projects belong to priority two, 18 to priority one and 6 to priority three and 7 to priority four.
Mid-term evaluation of INTERREG IIIB BSR142 came to positive results in general and stated that chosen projects are well in line with the objectives of the programme. Mainly local and regional authorities are involved as project partners, project partnerships are working satisfactory and with a substantial involvement of different partners. Especially in the candidate countries the programme had high impact on institution building in terms of preparation for INTERREG participation after accession.
Despite these positive effect weaknesses limiting spatial integration effects were pointed out:
- impacts of projects is limited due to short durability of projects (external funding necessary for continuation of projects) and often too low budget,
- level of participation varies between countries: Sweden(EU), Norway and Poland (Non-EU) are most frequent partner countries,
- imbalances exist between countries with regard to financial resources. Problems of coordinating activities with PAHRE or TACIS funds limited participation of candidate and third countries.
- selection of projects mainly focused on quality of projects but did not take into account balancing between fields of action. As result in the first two rounds most projects aimed at tourism development. Priority was given to popular, easy to understand measures, while more complex fields like institution building or polycentric development were disregarded,
- especially in the beginning decision-making was more influenced by national rather than trans-national motives; this tendency has meanwhile decreased and steady development towards stronger trans-national emphasise can be observed.
Case Study Analysis on Trans-national Cooperation
In addition to above analysis based on review of existing documents two case studies on INTERREG macro-regions have been conducted. The following table presents main findings of case study analysis. Further information on case studies is provided in the Annex.
142 PLS/RAMBOLL Management A/S (2003): Mid-term evaluation of Baltic Sea Region INTERREG IIIB Programme.
Final report.

Table 9-3: Overview on Macro-regions Case Study Findings
Region Archimed Alpine Space
Participating regions
NUTS 0: Cyprus, Malta, Greece, NUTS 2: South Italy, non ESPON space level: 8 third countries
NUTS 0: Switzerland, Liechtenstein, Slovenia, Austria, NUTS 2: 4 German, 4 French regions and 7 Italian regions.
Spatial identity • Heterogeneous space with spatial handicaps, lots of islands with a double peripheral role,
• transport accessibility with TINA through: Corridor 9 and Adriatic corridor,
• cross-border discontinuities among the neighbouring countries
• Discontinuities as far as the population is concerned,
• discontinuities among the geographical area (the third countries are more deserted than the members), Cyprus, Malta & Sicily are coasty with cliffs and mountains in the central area whether in Greece & Italy there are more mountainous areas,
• the member states have developed infrastructures while the neighbours' ones are at an infant level, Malta & Piraeus are the largest harbours, both rural & urban relationships,
• common historical and cultural past, which creates strong bonds between the countries
• Interlinkages with the European core areas with an intermediate role in the area,
• Sustainable modes of transport and communications due to the sensitive environment,
• Cross-border discontinuities due to Switzerland & Lichtenstein as non-EU members
• Population density varies: Slovenia has the lowest population density while Switzerland is the most densely populated area, population density is highest along German Swiss border as well as in central parts of Northern Italy,
• A mixture of MEGAs, transnational/ national as well as regional/local FUAs can mainly found around the core of the Alpine Space. Zurich, Milan and Munich regions are very central on a multimodal level. On NUTS 3 level some regions in Austria, Italy and Slovenia appear to be peripheral.
• Slovenia has the highest population being involved in agriculture closely followed by the two Eastern regions in Austria. Contradictory, Slovenia has the lowest share of tertiary activity. The share is highest in the Southern France regions.
• The Alpine Space is characterised by mountains and hills. It has a variety of ecosystems and unspoiled nature as well as attractive landscapes. Also cultural heritage appears to be rather diverse due to different cultural identities in the region (9 different languages spoken in the Alpine Space).

Main potentials & bottlenecks
Main potentials are: valuable natural and cultural heritage, location at two European corridors (Adriatic corridor and corridor 9), rich natural resource;
Main bottlenecks are: spatial fragmentation, vulnerable environment, insufficient coordination of transport, ageing population in Greece and Italy, in sharp contrast to the demographic explosion in southeast Mediterranean.
Main potentials are: attractive natural environment, well developed urban system in the outer parts of the region, highly qualified labour force, well developed infrastructure in urban areas;
Main bottlenecks are: spatial fragmentation due to mountainous character, weak connections between urban and rural areas, depopulation in rural areas, poor development of infrastructure in rural areas.
Characterisation of trans-national programme
Since its establishment in 1997 Archimed macroregion got support under several programmes: Archimed Pilot Action under Art. 10 ERDF, INTERREG IIC, Archimed action and INTEREG IIIB. Under INTERREG IIIB € 118 million are allocated to the region of which € 78.7 million comes from the pre-accession aid instruments in the present period of Interreg III initiative.
Different fields of intervention were in the focus of the different initiatives:
• INTERREG II: spatial integration, cooperation networks, adapts external borders, cooperation with third countries.
• ARCHIMED pilot action: spatial development & infrastructures, natural, cultural & environmental resources, sustainable tourism development.
• INTERREG III: job opportunities, strengthen partnership among national-regional-local authorities, correct implementation of the programme.
• ARCHIMED action: spatial urban development, transportations-telecommunications-information society, natural& cultural heritage, hazards, tourism &SMEs protection.
Following analysis focuses on the pilot action Archimed under Article 10 ERDF, since this programme implemented in the years 1997-1999 already has been completed and its impacts thus can be better assessed than in case of still ongoing programmes.
The Macro-region Alpine Space was established under INTERREG IIIB succeeding and integrating the macro-regions "Eastern Alps" and "Western Mediterranean and Latin Alps" funded by Pilot Action under Article 10 ERDF in the years 1997-1999. Transnational co-operation has a very long tradition within the Alpine Space (e.g. ARGE ALP – founded 1972, first cross-border regional organisation of 11 regions in the Eastern Alps). Different institutions and co-operation networks were founded in the last decades and are still very active. Those networks are either involved in the INTERREG IIIB programme or gave important reference for the programming.
Macro-region Alpine Space under INTERREG IIIB is financed with 124 MEUR, 60 MEUR of which are ERDF contribution, 60 MEUR national contributions and 4 MEUR Swiss national contributions. Moreover co-financing from national sources or pre-accession funds is possible in case of Slovenia.
Apart of the technical assistance to Interreg IIIB (programme administration, information and evaluation) the Alpine Space programme distinguishes between 3 priorities:
• Promotion of the Alpine Space as a competitive and attractive living and economic area in the framework of polycentric spatial development of the EU (26% of total budget allocation)
• Development of sustainable transport systems with particular consideration of efficiency, intermodality and better accessibility (32% of total budget allocation)
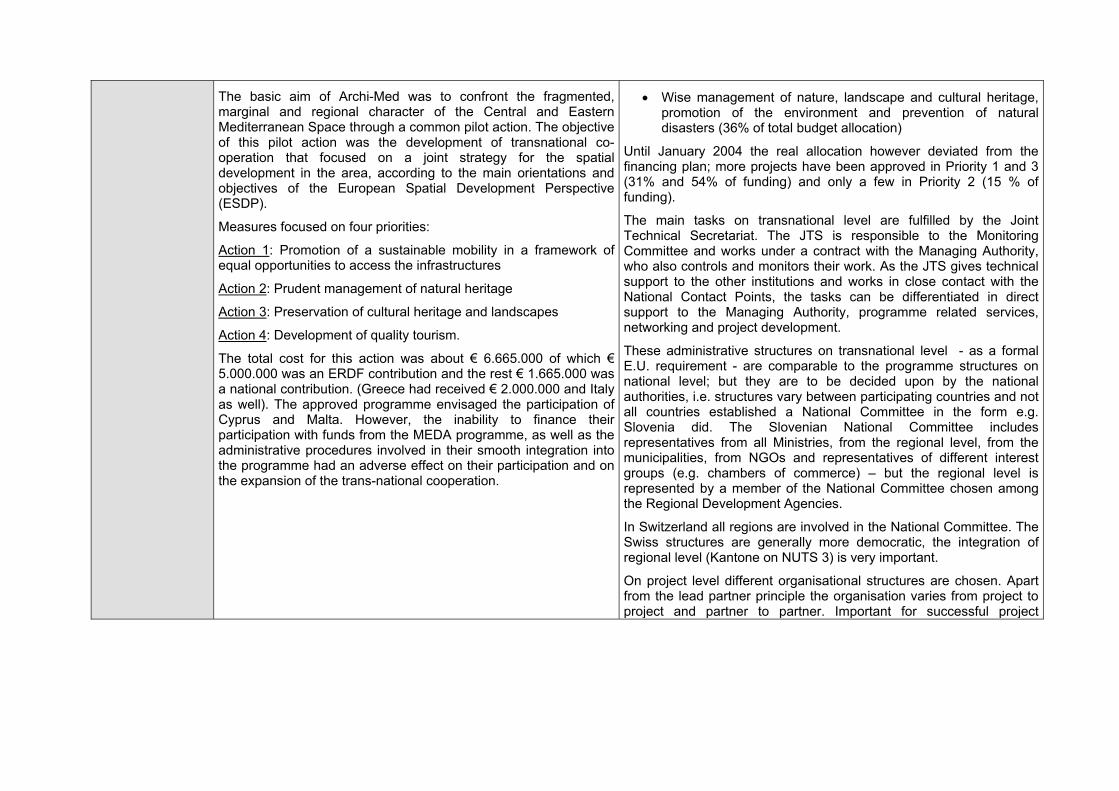
The basic aim of Archi-Med was to confront the fragmented, marginal and regional character of the Central and Eastern Mediterranean Space through a common pilot action. The objective of this pilot action was the development of transnational co-operation that focused on a joint strategy for the spatial development in the area, according to the main orientations and objectives of the European Spatial Development Perspective (ESDP).
Measures focused on four priorities:
Action 1: Promotion of a sustainable mobility in a framework of equal opportunities to access the infrastructures
Action 2: Prudent management of natural heritage
Action 3: Preservation of cultural heritage and landscapes
Action 4: Development of quality tourism.
The total cost for this action was about € 6.665.000 of which € 5.000.000 was an ERDF contribution and the rest € 1.665.000 was a national contribution. (Greece had received € 2.000.000 and Italy as well). The approved programme envisaged the participation of Cyprus and Malta. However, the inability to finance their participation with funds from the MEDA programme, as well as the administrative procedures involved in their smooth integration into the programme had an adverse effect on their participation and on the expansion of the trans-national cooperation.
• Wise management of nature, landscape and cultural heritage, promotion of the environment and prevention of natural disasters (36% of total budget allocation)
Until January 2004 the real allocation however deviated from the financing plan; more projects have been approved in Priority 1 and 3 (31% and 54% of funding) and only a few in Priority 2 (15 % of funding).
The main tasks on transnational level are fulfilled by the Joint Technical Secretariat. The JTS is responsible to the Monitoring Committee and works under a contract with the Managing Authority, who also controls and monitors their work. As the JTS gives technical support to the other institutions and works in close contact with the National Contact Points, the tasks can be differentiated in direct support to the Managing Authority, programme related services, networking and project development.
These administrative structures on transnational level - as a formal E.U. requirement - are comparable to the programme structures on national level; but they are to be decided upon by the national authorities, i.e. structures vary between participating countries and not all countries established a National Committee in the form e.g. Slovenia did. The Slovenian National Committee includes representatives from all Ministries, from the regional level, from the municipalities, from NGOs and representatives of different interest groups (e.g. chambers of commerce) – but the regional level is represented by a member of the National Committee chosen among the Regional Development Agencies.
In Switzerland all regions are involved in the National Committee. The Swiss structures are generally more democratic, the integration of regional level (Kantone on NUTS 3) is very important.
On project level different organisational structures are chosen. Apart from the lead partner principle the organisation varies from project to project and partner to partner. Important for successful project

development is a certain degree of institutionalisation and a professional project management.
Assessment of policy with regard to potentials/bottlenecks addressed
In general funds for the Archi-Med macroregion has provided large resources for supporting cohesion of the area.
With regard to the pilot Action Archimed (Art 10 ERDF) following results can be highlighted:
• The pilot action Archi-Med priorities present an important degree of specialization to the environmental and cultural aspects. Hence, in a group of 7 projects, there are 3 projects (2.1, 2.2, και 3.1) which refer directly to the environmental and cultural aspect (35, 5% of the total budget). Setting of this priority takes into account the main potentials and bottlenecks identified in the SWOT analysis.
• Effects of the programme mainly evolved with regard to establishment of common methods, normative frameworks and procedure, establishment or consolidation of collaborations, sensitisation of public authorities.
• No quantitative assessment of spatial impacts is available. The programme outputs however were mainly of a study character with no direct impact upon spatial development, but it contributed to cross – border cooperation for spatial planning and spatial indicators between the partners, promoting the cultural and natural dimension as a common feature of the geographical zone.
• Main impacts therefore occurred on institutional level in terms of common data mainly for natural and cultural environment, awareness of similarities and joint aims, net–working contacts, cooperation experience among national and regional authorities and spatial planning common experience.
• As for the final evaluation of the programme, the international co-operation was judged as “mid- typical to
Especially the first two priorities of the programme are strongly related to identified potentials and bottlenecks and the operational programme addressed spatial development objectives in a sound way.
Although transnational co-operation has a strong institutional impact in exchange of knowledge and experiences, the improvement and coordination of spatial planning and related sectoral policies at regional and national level seems to be less significant. There are more soft tools such as transnational development visions and informal framework settings, then common formal instruments.
Impacts on regional potentials and bottlenecks are hardly to assess at this early stage of the programme. However it can be expected that strategic projects for the whole Alpine Space region in the future will reveal impacts. Programme level recently pushes the development of trans-national thinking and strategies in the main fields of action addressed by INTERREG IIIB.
The Institutional impact of transnational co-operation through INTERREG IIIB is tremendously – especially in Switzerland, where direct co-operation with the neighbour states is relatively new, but also very important because of the central location. New institutions were established, existing institutional settings adapted the new requests. There is an obvious learning process and effect for local authorities and the involved persons with an added value. This added value lies in the exchange of know how and experiences, learning of a "common language", the broadening of perspectives and the networking. For the institutions the co-operation is connected with administrative innovations like subsidy contract or partnership agreement.
The main added value for the Slovenian Programme level is the possibility to involve all actors dealing with spatial development issues on national, regional and local level to transnational discussions and structures. Alpine Space programme gives the possibility to formalize co-operation on the horizontal level within Slovenia. Vertical co-

international co-operation was judged as “mid- typical to excellent”.
Implementation process however faced several delays due to difficulties as: different rates of progression of participants, problems with communication language, lack of previous experience/ cooperation and institutional roles. Most of these difficulties were overcome with satisfactory results.
operation already exists in different fields and activities, but in a quiet formal and binding way (e.g. spatial law), where all participants try to define and implement their interest. With Interreg IIIB it is possible to widen the horizon and strengthen the capabilities of the different actors for a more comprehensive co-operation within Slovenia and on the transnational level.
Assessment of policy with regard to territorial objectives
Interventions under Pilot Action ARCHIMED can be assessed to contribute only to a limited extent to the objective of spatial integration. Impacts mainly affected the institutional dimension what might however have laid foundation for common actions supporting integration in socio-economic terms in the future. Impacts moreover were limited due to the limited number of participating regions.
Some of these deficiencies were met in the following ARCHIMED initiatives and in general the following points seam to be relevant:
• Still spatial impacts are limited due to restriction of funds to member states and candidate countries. Strong difficulties in third countries to gain financial resources from other sources, left the third neighbouring countries without financial assistance and as a result it was impossible for them to establish conditions for future participation on the one hand and to address their socio-economic and political instabilities on the other.
• Nevertheless the financial assistance towards the state members (S Italy and Sicily and 13 regions of Greece – whole territory) reflected the major bottlenecks of those countries (cultural heritage, environment, transport, utility and energy networks, information society, etc.) and can be evaluated that it improved the spatial integration of this area increasing the spatial coherence inside the area, as well as
INTERREG IIIB programme for the Alpine Space clearly had an impact on spatial integration in terms of trans-national institutional integration due to direct effects of transnational co-operation on institutional issues, new institutions were established, existing institutional settings adapt the new requests, direct effects of transnational co-operation on cultural issues and individual competences, indirect impact upon spatial planning by transnational thinking and common development strategies.
Spatial impacts in terms of socio-economic integration so far were limited due to the following issues:
• lack of understanding of ESDP objectives on project level
• diffuse concept of spatial development objectives on programme level as well, no common indicators for territorial impact assessment
• no strict course of action by steering committee (e.g. regarding selection of projects according to priorities)
• programme in an too early stage for assessment of impacts
• national differences regarding administrative culture and approval of (national) funding
• unequal resources of member states, Switzerland as non-EU member and Slovenia as candidate country
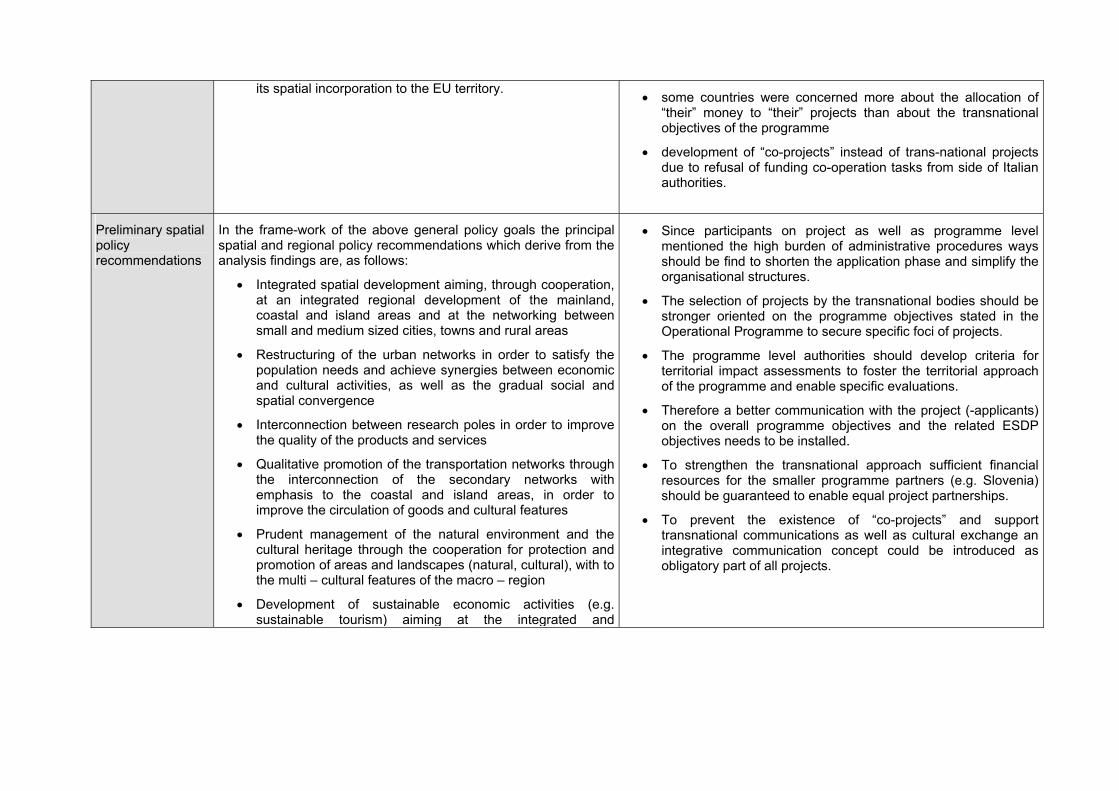
its spatial incorporation to the EU territory. • some countries were concerned more about the allocation of
“their” money to “their” projects than about the transnational objectives of the programme
• development of “co-projects” instead of trans-national projects due to refusal of funding co-operation tasks from side of Italian authorities.
Preliminary spatial policy recommendations
In the frame-work of the above general policy goals the principal spatial and regional policy recommendations which derive from the analysis findings are, as follows:
• Integrated spatial development aiming, through cooperation, at an integrated regional development of the mainland, coastal and island areas and at the networking between small and medium sized cities, towns and rural areas
• Restructuring of the urban networks in order to satisfy the population needs and achieve synergies between economic and cultural activities, as well as the gradual social and spatial convergence
• Interconnection between research poles in order to improve the quality of the products and services
• Qualitative promotion of the transportation networks through the interconnection of the secondary networks with emphasis to the coastal and island areas, in order to improve the circulation of goods and cultural features
• Prudent management of the natural environment and the cultural heritage through the cooperation for protection and promotion of areas and landscapes (natural, cultural), with to the multi – cultural features of the macro – region
• Development of sustainable economic activities (e.g. sustainable tourism) aiming at the integrated and
• Since participants on project as well as programme level mentioned the high burden of administrative procedures ways should be find to shorten the application phase and simplify the organisational structures.
• The selection of projects by the transnational bodies should be stronger oriented on the programme objectives stated in the Operational Programme to secure specific foci of projects.
• The programme level authorities should develop criteria for territorial impact assessments to foster the territorial approach of the programme and enable specific evaluations.
• Therefore a better communication with the project (-applicants) on the overall programme objectives and the related ESDP objectives needs to be installed.
• To strengthen the transnational approach sufficient financial resources for the smaller programme partners (e.g. Slovenia) should be guaranteed to enable equal project partnerships.
• To prevent the existence of “co-projects” and support transnational communications as well as cultural exchange an integrative communication concept could be introduced as obligatory part of all projects.

sustainable development of every area separately and the macro – region as a whole
• Common networking procedures that should be reinforced mainly through the universities, research institutes and chambers with qualifications on spatial and urban planning,
• Improvement of the institutional structures in order to facilitate the common private sector investments,
• Decentralisation of the participating countries towards the regional level within each country’s territory and the establishment of spatial and regional planning in the countries were the distribution of public resources (European or national) is based on central – sectoral programming procedures,
• Direct participation of the neighbouring countries that should be strengthened through specific economic resources within the INTERREG budget after 2.006 (e.g. with a 10% percentage), and
• Establishment of a Spatial Planning Observatory for the Archi – Med macro-region through cooperation between universities and researching institutes, as well the regional authorities of the countries

186
Comparability of case studies
Both case studies focused on macro-regions that are characterised by high levels of spatial fragmentation due to natural barriers as the Mediterranean Sea in case of ARCHIMED and the Alps in case of Alpine Space. Also in terms of institutional conditions both regions are characterised by strong differences between EU member states, candidate countries and non-member states of the EU. Regarding socio-economic conditions the Alpine Space macro-region can be regarded as rather homogenous with Austria, Germany, Italy and Switzerland having high levels of development relative to EU-15 averages and Slovenia as one of the most advanced candidate countries. ARCHIMED in contrary is characterised by stronger discontinuities in terms of socio-economic development levels as well as institutional/political settings. These discontinuities are further strengthened by existence of strict borders between EU member and non-member states.
Both macro-regions have a strong common historical and cultural past, which strengthens bonds between the countries and provides a good basis for further cooperation. Moreover at least parts of the regions have long established cooperation structures in case of Alpine Space reaching back to the 1970s and in case of ARCHIMED at least starting with the Pilot Action under Article 10 ERDF.
Concerning the programme focused on the two case studies differ in so far as the early and already completed Pilot Action Article 10 ERDF has been in the centre of the ARCHIMED case study while the still ongoing INTERREG IIIB has been concentrated on in case of Alpine Space. Nevertheless some common issues can be highlighted and common lessons learned can be pointed out. The following conclusions are supported by findings of the general analysis including additional findings on the two macro-regions Baltic Sea Region and CADSES.
Limitation of impact assessment
As for the other case studies, the scope of impact assessment was restricted by several factors for trans-national case studies as well. With regard to socio-economic impacts short duration of projects hampers visibility of effects so far. This especially applies to Alpine Space case study while in case of ARCHIMED only few projects directly affecting the socio-economic situation have been implemented but focus lay on studies and institutional projects. Moreover, lack of data especially for measuring levels of socio-economic integration, e.g. data on trade flows, foreign direct investment flows, commuting patterns, does not allow for quantitative assessment of integration trends.
Since significant parts of both programmes focus on institutional measures the general problem of how assessing institutional impacts and how relating institutional impacts to spatial socio-economic impacts occurs. Although it can be expected that institutional integration contributes to socio-economic integration in the long-run, this relationship is hardly measurable. Special difficulties result form assessment of programme levels. On programme level impacts emerge on the one hand as aggregated impact of single projects, on the other hand the mere setting up of programme structures might bear impacts on institutional conditions on trans-national level.
Assessment of policy with regard to potentials / bottlenecks
Common foci of both programmes lie in the field of transport infrastructure improvement, preservation of natural and cultural heritage/environmental protection and tourism development. These priorities address main bottlenecks and potentials of the macro-regions. Improving transport infrastructure links within the macro-region is one important factor for achieving higher levels of spatial integration especially with regard to urban-rural integration in case of Alpine Space or integration of peripheral (island) areas in case of ARCHIMED. However budget within INTERREG IIC/IIIB seems to be too low to reveal significant impacts on trans-national level and not only on smaller regional level. Spatial integration in economic terms has only been addressed within the Alpine Space programme but has not been included in the ARCHIMED programme. Measures in this field, e.g. business co-operations, co-operation in research or education seem however not to be of high priority. From this

187
observation one might conclude that selection of common fields of action also depend on the already existing level of integration. In case of low levels of trans-national integration less critical fields like cultural heritage and environmental preservation might be more suitable to provide the basis for trans-national integration. Moreover one has to bear in mind, that additional programmes targeting similar fields of action are implemented in these regions as well, e.g. infrastructure improvement and business/human resource co-operation within cross-border programmes.
Beside these defined fields of action one major focus of both programmes lay on improving institutional conditions. By establishing common institutional structures basis for improved trans-national communication and development of common approaches has been provided. Exchange of know how and experiences, awareness of similarities and common objectives, development of common perspectives, networking and sensitisation of public and private actors have been important effects on project as well as on programme level. Integration of trans-national thinking and approaches on different institutional levels thus can be seen as one major achievement of the programmes.
Assessment of policy with regard to spatial development objectives
Improved institutional integration is the most important impact of analysed programmes on the way to increased spatial integration. Although so far this affected only to a limited extent integration in other fields and in socio-economic terms, trans-national institutional and communication structures can be assessed as important prerequisite for further impacts of trans-national co-operation in the future. To develop wider impacts on socio-economic integration however the budget of the programmes seems to be too low. Especially to increase integration in terms of accessibility, i.e. improvement of transport infrastructure links would require large investments.
Effects on spatial integration were in both cases limited by unequal opportunities of participating countries. Coordination with PHARE or TACIS funds proofed to be not sufficient for securing equal partnership of candidate or third countries. Moreover national interests prevail when it comes to allocation of funds to specific projects, i.e. the funds are not seen as real trans-national funds but rather as national contributions national beneficiaries should profit from. Also concerning priority fields and approaches of implementation national differences hampered the programme implementation, e.g. by refusal of Italian authorities to fund co-operation activities on projects level in the Alpine Space.
Assessment of policy impacts with regard to the objective of spatial integration has to take three-level approach into account as well. Obviously the objective of trans-national co-operation addresses in the first places spatial integration issues on macro-level. However many projects are rather of regional character thus affecting the meso or micro level. The overall programme objective often is not perceived at project level but local and regional actors follow their own objectives and rationales. To secure the trans-national character of the programme and of impacts strong programming structures are needed. First of all this affects trans-national institutional impacts as can already be observed. But also for developing trans-national impacts on project level and in different fields of action projects have to be selected with regard to their contribution on spatial integration on macro-regional level. In this regard the approach followed in the Alpine Space to establish strategic trans-national projects by the programming authorities seems to be promising. Objectives and scope of these projects will be clearly defined by the trans-national committees and suitable project implementation structures will be chosen.
Policy recommendations
Following tentative policy recommendations on supporting trans-national co-operations can be drawn from the above analysis:
A strategic approach focusing on trans-national impacts should be strengthened on programme level, e.g. with regard to sound selection of projects or establishment of strategic projects by programming authorities.

188
Evaluation and monitoring on programme level should take the spatial dimension into account. Methods of operationalising spatial objectives and criteria for territorial assessment should be developed.
Fields of action addressing human and business resources should be stronger included in the programmes to foster participation of private sector actors in trans-national activities and to contribute to socio-economic integration.
Financing mechanism should enable equal participation of EU-member states and non-member states. By strengthening trans-national attitudes on programme level differences with regard to availability of national resources should be overcome.
Improved communication of overall programme objectives towards project level could strengthen trans-national approach of projects. Moreover obligatory requirement of co-operation components or common communication strategies could prevent “co-projects” and strengthen trans-national character of projects.

189
10 Ex-Ante Analysis of the Influence of Structural Pre-Accession Aid and The Structural Funds on Balanced Territorial Development in the EU Territory
The following chapter presents the conclusions of Work Package 6 of ESPON 2.2.2. The work provides an ‘ex-ante analysis of the influence of the Structural Pre-Accession Aid and Structural Funds on balanced territorial development in the EU territory’. The chapter begins with an overview of structural support in the enlarged EU. It then focuses on how experiences of Pre-Accession Aid programmes and Structural Funds are likely to address and impact upon balanced territorial development in the enlarged EU. A key component of this element of the work involves a meta-analysis of ex-ante evaluations of the National Development Plans of the new Member States. The chapter concludes with contributions to on-going Structural Funds reform debates.
10.1 Structural Funds and Pre-Accession Aid 2004-2006 EU Commissioner Jacques Barrot states that the new Structural Funds programmes are a concrete reflection of the principle of territorial cohesion. They help to finance investment and the creation of new job opportunities and, “in that way, they will help to bridge the significant gaps in the enlarged European Union and contribute to integration and to territorial cohesion.”143 Similarly, Commissioner Balázs explains:
“Structural Funds represent a major potential for fostering growth and cohesion. The Third Cohesion Report has already demonstrated that this policy has been very successful in the EU until now. Its continuation, coupled with the significantly higher growth potential of the new Member States should therefore become a major engine for development in an enlarged EU”.144
In the lead-up to EU enlargement, a financial allocation of €24.5 billion for Structural and Cohesion Funds in the period 2004-2006 was agreed for the new Member States. The amount allocated for Structural Funds is €16 billion. Out of 41 NUTS II regions in the new Member States, 38 qualify for Objective 1 support; only the regions of Prague and Bratislava and the southern part of the Island of Cyprus have Objective 2 status, see figure one. All the new Member States will also receive funding from the Cohesion Fund and Interreg programme, see Table 1.
Romania and Bulgaria have not yet gained EU membership and will continue to benefit from Pre-Accession Aid. The Commission has considerably increased financial assistance to both countries from the date of the first round of accessions. For instance, EU assistance to Romania will increase by 20 percent (over 2003 levels) in 2004, 30 percent in 2005 and 40 percent in 2006. “This increase is intended to support Bulgaria and Romania in taking the remaining steps necessary to meet the criteria for membership.”145Accession Partnerships will continue to be the basis for programming pre-accession assistance, but priorities for assistance will also be drawn from the road maps, Regular Reports and revised National
143 CEC (2004) Commission signs off economic and social development programmes for the new Member States
Brussels, 23 June 2004
http://europa.eu.int/rapid/pressReleasesAction.do?reference=IP/04/778&format=HTML&aged=0&language=EN&guiLanguage=fr
144 CEC (2004) Commission signs off economic and social development programmes for the new Member States Brussels, 23 June 2004
http://europa.eu.int/rapid/pressReleasesAction.do?reference=IP/04/778&format=HTML&aged=0&language=EN&guiLanguage=fr
145 CEC (2002) Communication from the Commission to the Council and the European Parliament Road Maps for Bulgaria and Romania, CEC Brussels, http://europa.eu.int/comm/enlargement/docs/pdf/roadmap-br-ro-2002_en.pdf

190
Development Plans to be prepared by each country in line with Structural Funds requirements.
The link between Pre-Accession Aid Programmes and the Structural Funds is strong. Pre-Accession Aid programmes have the explicit aim of supporting preparations for Structural Fund programmes through institutional support and capacity building. Phare, ISPA and SAPARD were designed to mirror the ERDF, ESF and EAGGF. Structural Funds also target support to similar areas. Consequently, it is reasonable to assume that EU Structural Funds and Pre-Accession Aid will share common links to the territorial development goals of social cohesion, spatial integration and balanced territorial competition. However, there are also important distinctions between Structural Funds and Pre-Accession Aid. First, and most crucially, substantially more funding is available. Second, Structural Funds involve new administrative structures and programmes of support.
Figure 10-1: Objective 1 Regions
Source: http://europa.eu.int/comm/regional_policy/objective1/map_en.htm
Regions eligible under Objective 1
Transitional support under Objective 1
Special programme to assist coastal areas of Sweden

191
Table 10-1: EU Funds for the New Member States 2004-2006
Country Objective1
Objective 2
Objective 3
Interreg Equal Cohesion Fund
Total
Cyprus 0.00 28.02 21.95 4.30 1.81 53.94 113.44
Czech Republic
1454.27 71.30 58.79 68.68 32.10 936.05 2621.19
Estonia 371.36 0.00 0.00 10.60 4.07 309.03 695.06
Hungary 1995.72 0.00 0.00 68.68 30.29 1112.67 3207.36
Latvia 625.57 0.00 0.00 15.26 8.03 515.43 1164.29
Lithuania 895.17 0.00 0.00 22.49 11.87 608.17 1537.70
Malta 63.19 0.00 0.00 2.37 1.24 21.94 88.74
Poland 8275.81 0.00 0.00 221.36 133.93 4178.60 12809.70
Slovakia 1041.04 37.17 44.94 41.47 22.27 570.50 1757.39
Slovenia 237.51 0.00 0.00 23.65 6.44 188.71 456.31
Total 14959.64 136.49 125.68 478.86 252.05 8495.04 24451.18
Source: CEC (2003) http://europa.eu.int/comm/regional_policy/index_en.htm
10.2 Meta-Evaluation The 10 new Member States have drafted National Development Plans (NDPs) which form the basis of EU co-financed Structural Funds programmes in 2004-2006. The process of producing the NDPs has involved extensive consultation with actors within each country, as well as input from the European Commission and external evaluators. The NDPs were formally presented to the Commission at the end of 2002 or in early 2003, and formal negotiations took place between each new Member State and the Commission throughout the remainder of 2003 in order to transform the NDPs into final programming documents. The situation of Bulgaria and Romania differs from those of the other 10 countries. Although they have produced National Development Plans, the status of these documents is clearly different because Bulgaria and Romania are not yet EU Members. Their Plans, therefore, aim to provide a coherent framework for domestic sources of investment as well as the Pre-Accession Programmes, and are not subject to the various demands and constraints of Structural Funds’ programming.146
Structural Fund regulations require an independent ex-ante evaluation of programmes. These analyses are meant to provide a forward-looking assessment of the likely future effects of new policies of proposals with the aim of improving and strengthening the final quality of the Plan or Programme.147 In the context of Structural policies, the ex-ante evaluation process has a number of objectives.
• An assessment of whether the overall Plan or Programme is an appropriate means for addressing the issues confronting the region or sector.
• An assessment of whether the Plan or Programme has well-defined strategic axes, priorities and objectives and if it reflects an informed opinion as to whether these are relevant and can actually be achieved.
146 Kujath, J. et al. (2003) ESPON 2.2.2 Pre-Accession Aid Impact Analysis: Second Interim Report http://www.espon.lu/online/documentation/projects/policy_impact/1088/2-ir.2.2.2.pdf 147 CEC The New Programming period 2000-2006: methodological working papers CEC Brussels http://europa.eu.int/comm/regional_policy/sources/docoffic/working/doc/exante_en.pdf

192
• A contribution to the quantification of objectives and the establishment of a basis for both monitoring and future evaluation work.
• An analysis of the adequacy of the implementation and monitoring arrangements and help with the design of project selection procedures and criteria.
Box 1 sets out the six main elements of an ex-ante evaluation.
Box 1: Ex-ante Evaluation
1. Evaluation of existing programmes – taking account of previous experience
2. Evaluation of the adequacy of socio-economic context of the programmes - integrity and accuracy of analysis, description and explanation of main problems, whether the objectives and priorities stipulated by programmes correspond to this analysis.
3. Evaluation of strategic choices and the action priorities selected and their internal and external consistency – assessment of the justification of selection of priorities, content of strategic objectives, internal and external consistency of the NDP
4. The quantification of objectives
5. Evaluation of anticipated socio-economic impacts and the allocation of funds.
6. Evaluation of the implementation system of the programme.148
Using a structure based upon the ex-ante evaluation structures set out in European Commission documentation, this section of the report presents an assessment of the influence of the Structural Funds in the 10 new Member States and Pre-Accession Aid to Bulgaria and Romania. The assessment builds upon previous work packages (1-5) and the findings of a meta-analysis of NDP ex-ante evaluation documents.
Evaluation of existing programmes
As previous work packages have already demonstrated, existing EU programmes have had important qualitative and quantitative impacts. Key lessons to be taken from ESPON 2.2.2’s analysis of the territorial impact of Pre-Accession Aid include the following.
• The primary aim of the Pre-Accession Aid is to support the implementation of the acquis, but in working towards this aim, they also contribute to the objectives of spatial cohesion, balanced spatial competition and spatial integration.
• In terms of spatial cohesion, pre-accession support assists the new Member States and Candidate Countries to meet the criteria for EU enlargement, thus promoting equity objectives at an EU level. Support to lagging regions through the Phare programme, promotes equity at both the national and EU levels.
148 Blažek J and Vozab, J. (2003) Ex-Ante Evaluation of the National Development Plan - Instrument
for Identification and Elimination of Problems in Preparations for EU Cohesion Policy, in V. Benč Readiness of the Candidate Countries for the EU Regional Policy Conference Almanac, 3-5 November 2003, Bratislava, p.p. 163-170
http://europa.eu.int/comm/regional_policy/sources/docoffic/working/doc/exante_en.pdf

193
• Pre-accession support has played an important role in addressing regional development bottlenecks and barriers to development. It has also offered support to regions capable of acting as growth poles for the national and EU economies.
• Spatial integration between the recipient countries and the EU have been strengthened by Pre-accession Aid Programmes; economic integration, infrastructure, cultural integration and political integration have all been developed.
• The volume of resources, scale of development disparities and institutional capacities of the applicant countries mean that the impacts of Pre-Accession Aids are not easily measurable through standard indicators.
• Related, the impacts of the Pre-Accession Aid on spatial development is not pronounced, given the relatively small amount of funding spread across a wide range of priorities and the scale of development disparities.149
This experience has offered an important base to build upon for future Structural Funds and Pre-Accession Aid Programmes in the future. Experience of Pre-Accession Aid has also highlighted key areas of weakness within the programmes themselves and country responses to them.
• Achievements in some areas were below expectations, although objectives stated in the project preparation documents (project fiches) were often excessively ambitious.
• Considering different policy domains, a higher level of impact with more sustainable characteristics was achieved in some areas than others. For instance, the Phare programme was found to have more sustainable, concrete impacts in the fields of transport, environment and justice & home affairs. In contrast, impacts are considered to have been lower and less sustainable in the domains of social policy and education, agriculture and regional policy, where Phare projects helped to create new structures and modified systems of administration, which entailed difficulties such as unclear strategy, lack of institutional readiness and lack of sustainable resources in the institutions supported.
• Frequent reforms of the pre-accession aids confused and over-burdened the systems and institutional structures involved.
• The impacts on the economy, society and environment have so far been marginal and below the expectations stated in project objectives, although it is anticipated that more socio-economic impacts can be expected in the longer term from the effects of changed legislation and strengthened administration to which Phare made some contribution. However, these impacts will be indirect and difficult to trace.
• Projects related to structural actions and to support for SMEs had less socio-economic impact. In these areas, Phare projects included the implementation of grant schemes, which proved to be good for ‘learning by doing’, but which often had unclear socio-economic objectives.
• In the design of country strategies and projects, the excessive imbalance between partners (national governments and the Commission) in the design phase reduced the partner country ownership of, and immediate commitment, to the Phare projects during the implementation phase. In this case, reform came too late and was insufficient to remedy the lack of country influence and stakeholder involvement.
• Some projects lacked clear objectives and even commitment from responsible institutions in the early stages of their implementation.
• The impact of investment in large-scale infrastructure was high at the project level, but additionality was low, indicating lower importance of the Phare support than anticipated at the design stage. Further, the leverage effect has not been clearly demonstrated,
149 Kujath, J. et al. (2003) ESPON 2.2.2 Pre-Accession Aid Impact Analysis: Second Interim Report
http://www.espon.lu/online/documentation/projects/policy_impact/1088/2-ir.2.2.2.pdf

194
although there was clear evidence of co-financing with international financial institutions.
• Programmes have had limited impacts in terms of co-ordination between institutions or between levels of administration. Targeted institutions had to be strengthened before they could engage in building inter-institutional capacity.150
Evaluation of adequacy of socio-economic analysis of programmes
The starting point for a development plan is to analyse the socio-economic situation in the region and explain the obstacles to, and the challenges, for economic development.151 The analyses of development needs in each country form a key element of programming documents and should provide a solid basis for the selection of development priorities and measures. It should aim to identify the development bottlenecks which are preventing the new Member States from ‘catching up’. Therefore, the quality of the background analyses has an important influence on the focus of the overall programme. Each programming document should include the following components:
• an analysis of the socio-economic situation at the national and usually also at regional levels;
• an analysis of horizontal aspects set out in the Structural Funds Regulation152 (particularly relating to sustainable development, and to gender disparities and discrimination); and
• a SWOT analysis identifying the core developmental issues to be addressed by the development strategy in terms of the current and prospective situation, and both negative and positive aspects.
The programmes succeed in highlighting a range of development potentials and bottlenecks. Some of the most frequently mentioned issues are set out in the following table.
Table 10-2: Development Potential and Bottlenecks
Potentials Bottlenecks Strategic location Stable political and economic
environment Telecommunications infrastructure Cultural heritage Natural heritage Well-educated work force Established manufacturing base
Poor infrastructure provision Low employment Mismatch between labour supply and
demand Low productivity Social exclusion Poor waste management Rural/urban and regional
development disparities Poor ICT infrastructure/technology
gap. Limited R&D
According to recent evaluation reports, a common problem with the programme analyses was their scale and lack of focus. For instance, initial drafts of the analysis sections of the Latvian NDP were described as large, unfocused displays of all available data provided by inter
150 PLS RAMBØLL Management and Eureval-C3E (2003) Phare Ex-Post Evaluation, DG Enlargement. 151 Bachtler, J. (1995) Regional Development Planning in Objective 1 Regions European Urban and Regional Studies 2: 4 339-371. 152 Council Regulation (EC) No. 1260/1999 of 21 June 1999 laying down general provisions on the Structural Funds (Official Journal L161/1, 26.06.1999).

195
ministerial services.153 Data availability has also been a significant problem in a number of countries, e.g. Cyprus and Malta. Regional statistics have proved to be particularly problematic, as has access to data on the core horizontal themes. Poor integration and analysis of horizontal themes is a frequent shortcoming in the programming documents. In particular, detailed analyses of the information society have proved difficult, in part due to lack of appropriate indicators (e.g. Estonia, Czech Republic and Lithuania). A surprising feature of a number of the programmes is also their lack of strategic international focus, e.g. the existing cross-border links in the case of the Baltic States.
These deficiencies hamper the identification and prioritisation of development potentials and bottlenecks and, therefore, could impact on the effectiveness of EU Funding. Consequently, significant improvements had to be made in order to set out a precise definition of the framework and subject of analysis, the major problems faced and a hierarchy of problems. Significant improvements are noted in the general analysis and SWOT analyses for Lithuania and Latvia. Improved availability of data has contributed to a strengthened analysis of development needs in Romania.
Evaluation of reasons for selection of both alternative of programme and priorities and their arrangement, internal and external consistency of the programme
The approach to strategic planning commonly proceeds though a hierarchy of strategic elements, beginning with an overall statement of intent, which is then progressively disaggregated or refined into strategic objectives, development and specific measures.154 As the goal of Structural Funds programming is economic and social cohesion, all NDPs set out relatively similar global objectives in terms of improving living standards, raising the level of GDP per capita, and creating employment. Most NDPs state the dual goals of catching up with EU levels of GDP per capita, and reducing interregional disparities within the country. The balance between these two goals depends to some degree on the extent of regional disparities within the country, compared to the gap towards the EU level of development. Both goals are generally seen as complementary rather than potentially conflicting, even though the national growth process tends to be driven by those regions where economic activities are most dynamic – which are by definition to be the regions with relatively high levels of GDP per capita. Most strategic aims could be applied to almost any programme and any country with relatively bland but universally relevant statements. In part, this is due to the fact the majority of the new Member States face similar key challenges. The aims are also strongly influenced by the eligibility criteria of the Structural Funds.
Greater differentiation between countries is apparent when financial allocations and programme priorities and measures are taken into account, as Table Three and Table Four demonstrate. For example, Cyprus has allocated a larger proportion of its funding to rural development than the other new Member States. Estonia, Latvia, Lithuania, the Czech Republic, Hungary, Slovenia and Slovakia have all allocated over 20 percent of their funding to priorities or programmes supporting Human Resource Development. The Czech Republic and Poland have allocated the largest proportion of their funding to integrated regional operational programmes. Another area of funding where considerable resources are concentrated is infrastructure development, 37 percent in Estonia, 40.6 percent in Slovakia.155 A categorisation of the types of development priorities for Structural Funds programmes in the new Member States is set out in Box 2.
153 Final Report of the Ex-Ante Evaluation of the Draft SPD of Latvia 2004-2006, Phare project LE00.12.01 154 Bachtler, J, Taylor, S. and Kearney, C. (1996) Extended Synthesis of Agreed Single Programming Documents on Objective Two Areas. Report to the European Commission (DGXVI). 155 CEC (2004) http://europa.eu.int/comm/regional_policy/index_en.htm and country programming documents

196
Box 2: Priorities for Structural Funds Programme in the new Member States
Infrastructure provision • Modernisation and development of transport infrastructure (Cyprus, Estonia,
Latvia, Lithuania, Malta, Poland, Slovakia, Slovenia) • Investment in environmental infrastructure (Estonia, Hungary, Latvia, Lithuania,
Malta, Slovakia) • Development of local infrastructure (Slovakia) • Investment in ICT network (Estonia, Latvia)
Agriculture and Rural Development • Increased efficiency of agricultural production (Czech Republic, Hungary, Latvia,
Malta, Poland, Slovakia) • Improved quality of life of rural population (Cyprus, Slovakia, Slovenia) • Renovation and Development of Villages (Estonia)
Human Resources • Increased employability and labour market flexibility (Estonia, Latvia, Lithuania,
Malta, Slovakia, Slovenia) • Development of inclusive labour market and equal opportunities (Czech Republic,
Hungary, Latvia, Lithuania, Malta, Slovakia, Slovenia ) • Improved qualification and training (Estonia, Latvia, Slovakia, Slovenia)
Industry/Enterprise • Development of Industrial Production/Direct Business Support (Cyprus, Lithuania,
Malta Slovakia) • Investment in Business Infrastructure/Environment (Czech Republic, Cyprus
Estonia, Lithuania, Slovakia, Slovenia) • Promotion of R&D and Innovation (Czech Republic, Estonia, Latvia, Lithuania,
Poland, Slovakia, Slovenia) • Tourism Development (Estonia, Latvia, Lithuania) • Support for SMEs (Latvia, Malta)
Regional Development (Czech Republic, Hungary, Estonia, Slovenia, Malta, Poland)
Forestry (Estonia, Latvia, Lithuania)
Fisheries (Estonia, Latvia, Lithuania, Malta, Poland)
Health care and Social Infrastructure (Estonia, Latvia, Lithuania)
Urban Development (Cyprus)

197
Table 10-3: SPD Priorities
Cyprus SPD
Viable rural development 67.5
Regeneration of urban areas in decline 30.0
Technical Assistance 2.5
Estonia SPD
Human resources development 20.5
Competitiveness of enterprises 19.7
Rural development and agriculture 18.7
Infrastructure and local development 37.2
Technical assistance 3.9
Latvia SPD
Promotion of territorial cohesion 32.6
Promotion of enterprise and innovation 25.0
Development of human resources and promotion of employment
21.2
Promotion of development in agriculture and rural areas 14.6
Promotion of sustainable fisheries development 3.9
Technical Assistance 2.7
Lithuania SPD
Social and economic development of the economy 39.4
Human resource development 18.3
Development of the productive sector 25.3
Rural and fisheries development 15.3
Technical Assistance 1.7
Malta SPD
Strategic investments and strengthening competitiveness 60.0
Developing people 17.0
Rural Development and Fisheries 11.0
Regional Distinctiveness of Gozo 10.0
Technical Assistance 2.0
Slovenia SPD
Promoting the productive sectors and competitiveness 57.5
Knowledge, human resources development and employment
31.9
Restructuring of agriculture, forestry and fisheries 9.9
Technical Assistance 0.8
Source: CEC (2004) http://europa.eu.int/comm/regional_policy/index_en.htm and country programming documents

198
Table 10-4: CSF Operational Programmes
Poland CSF
OP Improved Competitiveness 15.1
OP Human Resources Development 17.8
OP Rural Development and Modernisation of Food Sector 14.4
OP Fisheries and Food Processing 2.4
OP Transport 14.1
Integrated Regional OP 35.9
OP Technical Assistance 0.3
Czech Republic CSF
OP Human Resources Development 21.9
OP Industry and Enterprise 17.9
OP Rural Development and Multifunctional Agriculture 12.0
OP Infrastructure 16.9
Joint Regional Operational Programme 31.2
SPD Objective 2 and Objective 3 Prague
Slovakia CSF
OP Industry and Services 14.5
OP Human Resource Development 27.3
OP Agriculture, Rural Development and Fisheries 17.6
OP Basic Infrastructure 40.6
SPD Objective 2 and Objective 3 Bratislava
Hungary CSF
OP Human Resources Development 28.2
OP Economic Competitiveness 21.5
OP Agriculture and Rural Development 15.9
OP Environment and Infrastructure 16.4
OP Regional Development 18.0
Source: CEC (2004) http://europa.eu.int/comm/regional_policy/index_en.htm and country programming documents
At the priority and measure level, more area-specific issues are raised, and there are greater variations in structure, substance and terminology and degree of geographical and sectoral orientation. However, a number of evaluation reports also point out that the aims, priorities and measures are too general, leading to problems with insufficient selectivity, lack of detail and strategic focus, and potential overlap – particularly, as the programming period is short and the countries needs are extensive. Another weakness identified is a lack of consistency across the programmes, i.e. programme aims do not reflect development needs highlighted in the programme analysis. Key examples are outlined below.
• Cyprus - The ex-ante evaluation of the SPD suggests there is a potential for overlap between SPD priorities and the country’s rural development plan.

199
• Czech Republic - The involvement of a large number of partners appears to have led to pressure for an extension rather than a reduction of the strategic aims and objectives of the programming documents, which could risk dispersion of limited support among too numerous priorities and measures.
• In Estonia, the emphasis of measures is on achieving short-term objectives and maintaining the status quo, and not on developments with a long-term perspective. More attention is paid to physical infrastructure and agriculture than human resource development. There is an excessive number of measures - some with very small financial coverage and interrelated with one another. The large number of measures disperses scare financial resources and makes administration costly.
• Lithuania – Concerns were raised that the NDP lists too many measures and that there was a need for 'greater prioritisation'. Too many measures can result in over fragmentation, increased management difficulties and a lack of focus. It was also recommended that allocations to human resources development should be strengthened.
• Poland - In order to ensure better coherence, it was suggested to restrict the number of development axes from five to three, relating to economic growth, employment, social and spatial integration.
• Slovakia – The measures duplicate one another. The agriculture and rural development measures are too complex. The high level of funding for agriculture is not in line with there strategy (especially as Slovakia has a strongly industrialised economy).
• Hungary - Regional development elements of the NDP are described as having a “residual” character. It is recommended that regional development should be treated not as “residue”, but as a policy domain in its own right.
As these examples suggest, the large number of priorities set out could lead to resources being spread thinly overall, or to some priorities and measures having insufficient resources. For instance, evaluations suggest that resources for human resource development are limited in Lithuania. In Romania, parts of the strategy for information society lack credibility because of the low financial allocations.
Evaluation of anticipated socio-economic impacts
Structural Funds are anticipated to bring substantial gains to the new Member States. Some evaluations of the overall economic impact anticipate an increase in GDP of over five percent by 2007. Substantial increases in employment are also anticipated. For instance, the Lithuanian SPD sets a target of between 46,000-52,000 jobs created. The anticipated impact of Structural Funds in Estonia is 15,000 extra jobs in manufacturing by 2010 and 32,000 in market services by 2007.
Targets also reflect the objectives of support for SMEs and competitiveness. In Lithuania it is hoped that 16,000–22,000 new business start-ups and existing SMEs will be assisted, and 30,000 people are likely to benefit from training. However, ex-ante evaluation documents stress that it is important to take into account possible constraints that could limit capacity to meet these targets and shortcomings in the accounts e.g.
• A wide range of macro-economic factors could constrain growth.
• Some targets assume extremely high growth rates and could be over optimistic.
• Anticipated increases in labour productivity are extremely dependent upon progress on other areas, e.g. rolling out ICT.
• The economic models applied in some documents do not take into account the possible problems with absorption capacity.
• The potential for job losses as a result of restructuring of heavy industry and agriculture is not necessarily taken into account.
• High failure rates of SMEs and new start-up companies could be a problem.

200
• Numbers of jobs created will be part-time of temporary, especially linked to large-scale construction projects.
At this stage, it is also important to take into account the extent to which programmes have an implicit or explicit impact on territorial development. Territorial themes are integrated to a variable extent across the programmes. In the case of some countries, there is an explicit focus on tackling development disparities between regions. For example, the Czech Republic, Poland and Hungary have dedicated regional development programmes. In other cases, there is an implicit objective to address broad territorial development goals running through the programmes. In the Czech Republic, while provision is made for a Joint Regional Operational Programme, regional disparities are also linked into wider actions such as the promotion of competitiveness, through the implementation of the Operational Programme for Human Resource Development. In other cases, the regional and territorial dimension of programming documents has tended to be weak. For instance, the Latvian NDP had a weak regional dimension to programming due to under-developed regional policy. Similarly, in Lithuania the regional dimension of the programme has tended to be neglected. In Romania, the regions were invited to prepare a Regional Development Plan, but their input varied in content and quality.
Complementarity
Another important factor influencing the overall impact of structural interventions is the level of complementarity between Structural Funds interventions and other EU support programme and priorities. Key areas where there are links between Structural Funds and other EU programme and priorities are: Competitiveness/ICT/Information Society; Cohesion Fund and Trans European Networks; Agriculture and Rural Development and other Community Initiatives.
Competitiveness/ICT/Information Society
Programming documents and associated actions have considerable relevance for the development of more competitive and innovative economies at the local, regional national and EU levels. It is important to recognise that in many of the new Member States there is very uneven development of ICT infrastructure and the use of information and communication technologies in households and business is low. Programming documents have been developed in line with Commission guidelines on the establishment of an Information Society and the recommendations of the ‘e-Europe’ initiative’ and the Lisbon Agenda. For instance, the NDP for Hungary prioritises training and the spread of new IT services. It also notes the need to address the specific problem if ICT deficits in remote areas. In Latvia, the main objective for the current programming period is to focus on both the provision of skills necessary for use of ICT and the provision of necessary infrastructure. As an isolated island community, Malta places particular emphasis on the development of highly developed telecommunications networks.
However, according to the ex-ante evaluation documents there are cases where plans are not coherent with the country’s needs and there are weaknesses in the linkages and support for these actions. In Latvia, financial constraints on ICT and information society expenditure and the decline of budget revenue for R&D spend have weakened the contribution of Structural Funds programme to the competitiveness agenda. In the case of Estonia, concerns are expressed over the extent to which the there is scope for the programme to support the labour market dimension of the information society. In the Czech NDP, it was found that an initial, detailed analysis of the condition of information society in education, commerce, and R&D was difficult due to lack of proper indicators.
Sustainable Development and Environmental Protection
All main programming documents make commitments to the horizontal objective of sustainable development. The NDP for Latvia states that commitments made to this objective will improve environmental management, decrease pollution and support sustainable use of natural resources. In Malta, Structural Funds, and the Cohesion Fund, will assist compliance with environmental standards established in relevant community directives, in particular with

201
regard to waste management and water. The ex-ante evaluation for Malta raises the salient point that environmental issues must not only be taken into account at the programming stage, but implementation structures must also be suitably prepared. The report notes that consideration of the environment as a cross-cutting priority may not have been adequately addressed by all of the organisations involved. The report recommends that supporting guidelines should be drawn up by the Ministry of the Environment and that the environment should be given greater consideration in under actions in education, and in the development of the productive sector.
Cohesion Fund and Trans-European Networks
In the new Member States, support for the development of the Trans-European Networks forms a key part of future plans for the Cohesion Fund. It is recognised that the development of transport infrastructure is crucial for regional and national competitiveness. The scale and complexity of these developments mean that it is important to maintain co-ordination between the actions of various support programmes. The National Development Plans aim to ensure appropriate co-ordination across transport measures. In Latvia, Structural Funds support will be used to support projects that will ensure connections with the larger TEN-T network, which will promote economic growth and the accessibility of regions. It is noted in a number of evaluation reports that potential synergies and linkages could be developed to a much greater extent in the programmes.
Agriculture/Rural Development
Programme evaluations highlight the potential for Rural Development Plans and Structural Funds Programmes to be broadly complementary (e.g. Cyprus). However, the importance of coordination of Rural Development and Structural Funds programmes is vital as there is considerable scope for overlap between areas of action set out in the SPD and the RDP. The ex-ante evaluations for Cyprus and Slovakia note that there is a possibility of overlap between the Rural Development Plan and SPD priorities. The agriculture and rural development objectives set out in the Polish National Development Plan aim to complement the objectives of CAP. Similarly, the country’s Rural Areas Development Plan has developed with reference to Structural Funds programmes.
Other Community Initiatives
Interreg, Objective 3 and Equal Initiatives also have the potential for useful synergies with Structural Funds. For instance in the SPD for Latvia, the complementarity with Interreg programmes in both programming and implementation have been taken into account. For instance, the North Zone Interreg IIIC programme will provide support for enhancing inter-regional co-operation in the fields of activity supported under the Objective 1 SPD for Latvia. It is also noted that trans-national projects supported under the Interreg programme can lead to more concrete and financially bigger follow-up projects which could be financed through Objective 1 or the Cohesion Fund. The aim in programming has been to avoid overlaps in the content of the programme. In specific cases, it is noted that there is potential overlap between actions such as the case of Interreg Greece-Cyprus and the Cypriot SPD in the area of the promotion of competitiveness and environment and culture.
Evaluation of the outlined implementation system
Implementation is a key factor that will impact upon the effectiveness and efficiency of Structural Funds programmes and, related, their influence on territorial development.
Analysis of the polity and process involved in pre-accession funds reveals that practices and institutions involved in the development and delivery of the funds, which favour the partnership principle, subsidiarity and evidence-based and shared policy-making, are in line with the territorial objectives, by empowering local communities and facilitating networking, dialogue and co-operation within and across regions. These are particularly significant developments in the Central and East European Candidate Countries and new Member States, where there is a tradition of strongly centralised policy development and implementation combined with weak regional administrations and civil society.

202
However, experience of implementation of Pre-Accession Aid also highlighted the persistence of long-term weaknesses in the capacity of countries to absorb and deliver EU funds. Structural Fund programmes for the new Member States make special provision for measures to support institutional capacity building, which should build on and carry forward advances made under the Phare programme. However on-going concerns include:
• Lack of identification of final beneficiaries and concerns over the creation, support and organisation of project ideas and identification of final beneficiaries with sufficient capacity for implementation and management of projects.
• Lack of capacity of local administrations to implement project (Cyprus, Czech Republic, Estonia, Lithuania), especially as local governments could have problems with co-financing as many are small and have limited financial resources.
• A need to clarify the role and position of intermediary bodies and implementation mechanisms for measures (Hungary). For instance it is suggested that in Lithuania, further thought could be given to whether it would be possible and appropriate to delegate responsibility for the project selection process to regional/local institutions - such an approach would help to fast track applications and speed up the approval process.
• Need for measures to ensure co-operation between bodies involved, (Czech, Slovakia, Romania, Lithuania).
Summary and Conclusion
This analysis began by noting the high expectations associated with Structural Funds in the enlarged EU. It is hoped that Structural Funds will help to bridge gaps in levels of national and regional development and promote spatial integration. For the new Member States, Structural Funds imply a substantial increase in funding levels for a wide range of policy actions, with links to various territorial development goals. However, the impact of the Funds will depend not only on the amount of money available but the development of a sound economic framework, a judicious choice of strategic priorities, the rate of financial absorption, which depends on administrative and institutional capacity and the quality of projects, and effective project selection and implementation systems.156 Experience of Pre-Accession Aid programmes and the above ex-ante analysis also suggests that a wide range of factors could constrain the contribution made by Structural Funds and Pre-Accession Aid to balanced territorial development.
First, evaluations of existing programmes suggest that the achievements of Pre-Accession Aid were sometimes below expectations, due to overly ambitious goals, problems in implementing specific types of programmes, frequent changes, which confused and complicated support programmes, lack of co-ordination and difficulty in measuring and identifying the impacts of the programmes.
Second, problems with the quality of background analyses and the strategic objectives of future programmes could limit the impact of Structural Funds, by affecting the identification and prioritisation of development potentials and bottlenecks. Ex-ante evaluations of national programming documents commonly found that the background analyses were too large and not sufficiently focused. These deficiencies were then linked to problems with the identification and prioritisation of suitable Structural Fund priorities and measures.
Finally, an effective implementation structure for the Structural Funds is crucial. In the new Member States, substantial efforts were made to prepare suitable systems for the delivery and development of the programmes. However, weaknesses remain that could limit the effectiveness of the Funds. For instance, lack of identification of final beneficiaries and problems with establishing a project ‘pipeline’ have led to concerns over the absorption capacity in some recipient regions and countries.
156 CEC (2004) Third Cohesion Report: A New Partnership for Cohesion CEC: Brussels , p.138.

203
10.3 Structural Funds and Balanced Territorial Development Post-2006 As the Third Cohesion Report notes, it is difficult to identify the specific impact of Structural Funds policy. In fact, it is stated that, “most of the effects of cohesion policy cannot be readily expressed in quantitative terms…its added value arises from other aspects, like the contribution made to regional development, by factors such as strategic planning, integrated development policies, partnership, evaluation and the exchange of experience, know-how and good practice between regions”.157 The fact that Structural Funds operate alongside a wide range of other EU policies, notably EU Agricultural, Environmental, R&D, Transport, Competition and Internal Market policies, further complicates identification of their territorial impact. Related, an integrated assessment of the combined impact of all EU policies on balanced territorial development is extremely challenging, particularly given range of policies involved, their technical complexity and the range of impacts they could have. However, by developing analyses undertaken as part of work package two and the above ex-ante analysis, it is possible to highlight broad ways in which Structural Funds, in combination with other EU policies, could contribute to balanced territorial development in an enlarged EU.
EU Policy and Territorial Development
Figure 2 summarises some of the key ways in which EU Structural Funding could complement the territorial development objectives: spatial integration, spatial cohesion and balanced spatial competition. For instance, Structural Fund support for transport infrastructures could promote spatial integration of a target region and promote balanced competition, by linking regional networks with Trans-European transport networks. Cross-border co-operation schemes, funded by Pre-Accession Aid programmes and Structural Funds, have promoted spatial integration between neighbouring regions and countries. Regional support programmes targeting lagging regions have aimed to promote spatial cohesion.
However, it is important to qualify these conclusions. First, development disparities in the enlarged EU are substantial and are shaped by a range of economic, political, social and cultural conditions. Consequently, EU Structural Funds, which are limited in terms of spatial coverage and available resources, will not necessary have a pronounced impact on embedded territorial development patterns in the short to medium term. Second, Structural Funds do not operate in isolation. By complementing Structural Fund actions, other EU policies could enhance the overall impact of policy on territorial development. Equally, there is scope for policy duplication, overlap, lack of co-ordination, missed opportunities and conflict, as noted in Section above section on complementarity, which could limit the contribution of EU policies. Figures 3, 4, and 5 outline ways in which an array of EU policies could support the contribution of Structural Funds, e.g. by funding related, or complementary, projects. For instance, as Figure 3 illustrates, a wide range of EU policies operate in areas that could complement Structural Funds and promote spatial integration, e.g. by improving infrastructure between peripheral and core regions or promoting trans-national or trans-regional networking.
Figure 4 considers the potential for EU policies to support Structural Fund actions in areas related to the objective of balanced spatial competition. The Structural Funds and Pre-Accession Aid have the scope to promote balanced competition in a range of ways, e.g. through promoting endogenous development, the promotion of R&D and ICT capacity and regional competitiveness. At the same time, EU policies, such as R&D policy and urban development policies, operate in related or complementary fields. For instance, education and training initiatives, or programmes supported through the Framework Initiative, could complement Structural Funds’ support for R&D measures.
Finally, Figure 5 considers the relationship between the objective of spatial cohesion, Structural Funds and EU policies. In this case, the focus is on policy elements which could address inequalities between social groups and regions, e.g. through targeted regional support measures. A number of EU policies could contribute to cohesion and complement Structural Fund actions, particularly by complementing support offered to lagging regions. For
157CEC (2004) Third Cohesion Report: A New Partnership for Cohesion CEC: Brussels, p. 138.

204
instance, EU competition policy allows for regional state aid schemes, which can operate alongside Structural Funds in some regions. Programme evaluations highlight the potential for Rural Development Plans and Structural Funds Programmes to be broadly complementary. However, the evaluations also note the importance of coordination between Rural Development measures and Structural Funds and the potential for damaging overlaps. The importance of policy coordination is crucial across of all EU policies. Without appropriate coordination and an awareness of potentially variable territorial impact of policies, the potential for beneficial relationships and linkages between EU policies could be lost, which would have a related, negative impact on territorial development.

Figure 10-2: Linkages between Structural Funds & Pre-Accession Aid and Territorial Development
Spatial Integration
Balanced Territorial Development
Balanced Competition (efficiency)
Spatial Cohesion (equity)
Cross-Border Initiatives: Phare CBC, Interrreg
Heightened profile of EU in Assisted Areas
Transport and Infrastructure Investment
Twinning & Exchange of Best Practice
Promotion of endogenous development
Support for lagging regions
Support for RTDIand ICT
Commitment to EU economic
and social
Competitiveness Objective
Infrastructure development
Endogenous development
Support for lagging,
geographically disadvantaged
Education and Training

Figure 10-3: Spatial Integration and EU Policies
Spatial Integration
Twinning & Exchange of Best Practice
Heightened profile of EU in Assisted Areas
Internal market - demand for
infrastructure
CAP: Support forrural
development
Environmental Policy
Sectoral Twinning
Programmes and
Environment policy,
environmental infrastructure
Environment Policy
Transport and Infrastructure Investment
Trans national networking e.g.
through Phare CBC, Interrreg
Transport Policy, Ten-
Transport Policy, Ten-
Environment policy, e.g.
NATURA and environmental
International exchange
through R&D, education and
International exchange
through R&D, education and
Innovation Policy

Figure 10-4: Balances Spatial Competition and EU Policies
Balanced Spatial Competition
Lisbon Agenda Innovation and
R&D Policy
Transport and Infrastructure Investment
Support for RTDIand ICT
Competitiveness Objective
Endogenous development
Infrastructure development
Internal Market
Environment policy:
environmental infrastructure
Internal Market
Lisbon Agenda Lisbon Agenda
Rural Development
Environment andTransport
Investment
Innovation and R&D Policy
Innovation and R&D Policy
Education and Training
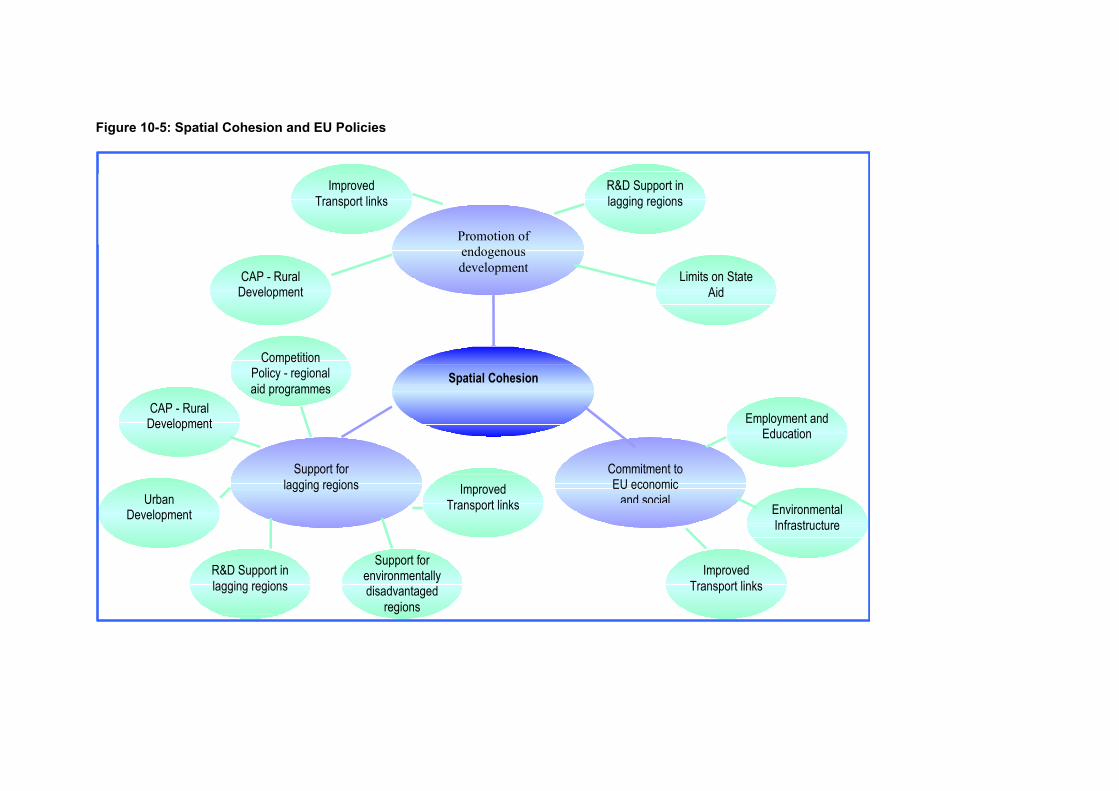
Figure 10-5: Spatial Cohesion and EU Policies
Spatial Cohesion
Promotion of endogenous development
Support for lagging regions
Commitment to EU economic
and social
CAP - Rural Development
Urban Development
R&D Support in lagging regions
Support for environmentally disadvantaged
regions
Improved Transport links
Competition Policy - regional aid programmes
CAP - Rural Development
Improved Transport links
R&D Support in lagging regions
Employment andEducation
Environmental Infrastructure
Limits on State Aid
Improved Transport links

209
Structural Fund Reform Debate
From a ‘spatial development’ perspective, it is important that Structural Funds continue to build on their positive links to territorial development and with other sectoral policies. This argument is particularly relevant in the context of on-going Structural Funds reform debates. The Third Cohesion Report, published by the European Commission on 18 February 2004, has established a new framework for the Structural Fund reform debate. The report sets out the Commission’s proposals for the future of EU Cohesion policy after 2006, which are structured around three key priorities: convergence, competitiveness and co-operation.
• Convergence: The aim of the convergence priority would be supporting growth and job creation in the least developed Member States and regions. Particular reference is made to regions with a per capita GDP of less than 75 percent of the Community average. Principal areas of support would be the modernisation and diversification of basic infrastructure, environmental protection, more efficient administration, better quality labour market institutions, education and training systems and optimal use of labour market institutions.
• Competitiveness: Through regional programmes, Cohesion policy would help regions and regional authorities to anticipate and promote economic change in industrial, urban and rural areas by strengthening their competitiveness and attractiveness, taking into account existing economic, social and territorial disparities. Through national programmes, Cohesion policy will help individuals prepare for and adapt to economic change by supporting policies aimed at full employment, a better quality and more productive labour force, and social inclusion.
• Co-operation: The aim of the co-operation priority is ensuring a harmonious and balanced development throughout the Union though the continuation of policy to promote harmonious and balanced development by supporting cross-border and transnational co-operation. The key task is to seek common solutions to common problems through co-operation between the competent authorities, in fields such as the development of urban, rural and coastal areas, strengthened economic relations and the networking of small and medium sized enterprises.158
158 Inforegio news (2004) A New Partnership for Cohesion: Convergence, Competitiveness and Co-operation, News letter, March 2004, No. 120.

Table 10-5: Proposed Reform of Structural Funds: Third Cohesion Report.
Convergence Competitiveness Co-operation
Eligibility Least-developed regions with a GDP per head less than 75 percent of the EU average.
Statistical effect regions, which would qualify for Objective status in an EU15 but, because of the ‘statistical effect’ of enlargement, would not qualify in an EU25/
Support under the Cohesion Fund: countries with GNP below 90 percent of the EU25 average.
‘Phase-in regions’ - current Objective 1 regions which would become ineligible for Objective 1 status even in an EU15 because of their economic growth.
All other regions not otherwise designated under the convergence priority or as phase-in regions.
Cross-border co-operation along external and internal borders, including both land and sea borders, to promote joint solutions to common economic problems. A New Neighbourhood Instrument will be created to facilitate more effective actions on the external borders.
Transnational co-operation, operating in zones to be agreed between the EC and Member States, to support strategic priorities with a transnational character such as R&D, information society and the environment.
Support Supporting growth and job creation in the Member States and least developed regions.
Principal areas of support will be the modernisation and diversification of basic infrastructure, environmental protection, more efficient administration, better quality labour market institutions, education and training systems and optimal use of labour market institutions.
Regional programmes funded by ERDF to help regions anticipate and promote economic change in industrial, urban and rural areas.
National programmes funded by ESF to reinforce the introduction and implementation of structural reforms in the labour market and strengthen social inclusion in line with the objectives and guidelines of the European Employment Strategy.
Promote joint solutions to common economic problems.
To support strategic priorities with a transnational character such as R&D, information society and the environment.
Regions Lagging regions: Most of the new Member States (except some capital cities) and significant parts of Greece, Portugal, Spain, Italy and eastern Germany.
Statistical Effect: Applies mainly to regions in Germany, the UK and Spain, and is regarded as transitional support to enable them to adapt to the loss of full Objective 1 eligibility.
Cohesion Fund: includes all of the new Member States as well as Portugal and Greece. There is no recognition of a statistical effect to compensate for loss of Cohesion Fund status (Spain).
EC will allocate ‘financial envelopes’ to Member States potentially on the basis of criteria such as GDP, unemployment and population density. The Member States would then have the responsibility for allocating resources within countries. However, The EC suggests that future regional programmes may need to be based on larger regions to enable the development of a coherent strategy.
External and internal border regions, including land and sea borders.
Nation states
Source: Inforegio news (2004) A New Partnership for Cohesion: Convergence, Competitiveness and Co-operation, Newsletter, March 2004, No. 120. Bachtler, J. (2004) Reflections on The Third Cohesion Report EPRC Research Seminar Series, Friday 27 Feb 2004, http://www.eprc.strath.ac.uk/seminars/downloads/Reflections_on_the_Third_Cohesion_Report.ppt and CEC (2004) Third Cohesion Report: A New Partnership for Cohesion CEC: Brussels .

211
These themes represent a broader rational for EU Cohesion Policy. Greater stress is placed upon links to the Lisbon Agenda, by arguing that promoting regional competitiveness will boost the growth potential of the EU economy as a whole. Intervention in support of economic and social cohesion is also linked with action to promote balanced development of the EU territory.159 The implication is that the remit of EU Cohesion policy reaches beyond imbalances in income and employment to address issues such as the polycentric development of urban areas, infrastructure endowment in educational, health and social services, and the specific problems of areas with geographical handicaps (e.g. islands, mountain areas). The EC’s proposal would lead to EU Cohesion policy becoming a permanent, horizontal policy pursuing the goal of balanced territorial development, with all regions eligible for some form of future EU support.
In terms of policy delivery, the new system would retain the key principles underlying the Structural Funds – multi-annual planning, integrated development strategies, partnership, co-financing and concentration. However, it is acknowledged that it is necessary to simplify and decentralise the process. For instance, the procedures for financial management, financial control and additionality would be rationalised and decentralised. However, partnership would be enhanced by requirements to involve social partners and civil society representatives to a greater degree. Tripartite agreements between Member States, regions and local authorities are also proposed.
The future contribution of Structural Funds also has to be seen in the context of funding for other EU policies, e.g. possible increases in funding for ‘competitiveness’ to implement the Lisbon agenda and increased resources for been EU internal policies (citizenship, freedom, security and justices) and external relations (EU as a global partner). It is proposed that the EU would commit an average of €146 billion per year to Cohesion policy over the 2007-2013 period. This compares with a figure of €121 bn for the final year of the current period and represents an increase of 31 percent in planned EU spending. The proposed allocation of the cohesion policy budget to the three main policy priorities is set out in Table 10-6.
Table 10-6: Proposed Financial Allocation to Priorities
Priority Financial instruments Budget
(%) (€ bn)
Convergence ERDF, ESF, Cohesion Fund 78 262
Regional competitiveness & employment • Regional competitiveness programmes • National employment programmes
ERDF
ESF
18 60.5
European territorial co-operation ERDF 4 13.5 Source; CEC (2004) The Third Cohesion Report; A new Partnership for Cohesion: Convergence, Competitiveness and Co-operation CED Brussels and Bachtler, J. (2004) Reflections on The Third Cohesion Report EPRC Research Seminar Series, Friday 27 Feb 2004, http://www.eprc.strath.ac.uk/seminars/downloads/Reflections_on_the_Third_Cohesion_Report.ppt
159 The draft EU Constitution proposes that the promotion of territorial cohesion should become one of the Union’s objectives (Article 3) and should be addressed as an area of competence shared between the EU and Member States (Article 13).

212
Amongst the EU Member States, the budget has been one of the most contentious elements of the on-going Structural Funds reform debates. In December 2003, six Member States (Germany, the Netherlands, UK, France, Sweden, Austria) requested that future EU spending should not exceed 1.0 percent of GNI. Other Member States, notably the current Cohesion countries – Portugal, Spain and Greece – and many accession states, support the Commission’s proposals for an increase in EU spending in the next period.160 Another issue concerns the resources allocated to EU Cohesion policy. At one end of the spectrum, Spain, Portugal and Greece, as well as many new Member States, have explicitly called for an increase in EU Cohesion policy spending at or beyond the current 0.45 percent of EU GDP, although without specifying what level of expenditure would be required. Italy and Finland believe that the current ceiling should be maintained, but not exceeded, a view shared by the European Commission. By contrast, the net contributor countries – Austria, Germany, the Netherlands, Sweden, UK – argue in favour of a level of spending considerably below the current 0.45 percent ceiling.
There are also differing opinions on how the goals of EU Cohesion policy should be pursued. The EC, other European institutions and many Member States and subnational interests support the current model of policymaking whereby the task of addressing economic and social cohesion is shared among European, national and subnational levels. A fundamentally different approach to EU cohesion policy has been advocated by countries such as the Netherlands, Sweden and the United Kingdom, which consider that the current approach is no longer sustainable outside Objective 1. Whereas the EC is proposing that all regions should be eligible for funding, the UK and Dutch governments would prefer to see a rationalisation of EU intervention, with spending limited to the poorest countries. The German (federal) government also supports a reduction in EU spending on cohesion policy, focusing resources almost entirely on the poorest regions. Further, under the UK’s proposal, broad policy objectives would be established at European level (based on the Lisbon agenda) but with the implementation of these objectives being undertaken by the Member States and regions without the transfer of EU resources. This would imply EU cohesion policy in the richer countries being governed by the ‘open method of co-ordination’.
The requirement to achieve unanimity among 25 Member States means that compromises will have to be made. This will doubtless involve trade-offs in the size, objectives and allocation of the EU budget as well as taking account of negotiations in other areas of European integration, notably the EU constitution.161
10.4 Conclusions and Policy Recommendations The preceding sections highlight the key role of Structural Funds in an enlarged EU, e.g. by contributing financial resources, supporting a broad range of development priorities and policy instruments, promoting integrated policy programming and by interacting with other EU policies. It is argued that EU Structural Policy has the capacity to contribute to the promotion of spatial cohesion, balanced competition and spatial integration. However, the Funds also have limitations and problems, which could constrain their beneficial impacts. With this in mind, the following conclusions and policy recommendations can be drawn.
Clarify the link between Structural Funds and Territorial Development
• Balanced Territorial Development is not an explicit goal of either the Structural Funds or Pre-Accession Aid. For territorial development objectives to be more clearly addressed, Structural Funds regulations (and/or guidelines) should stipulate how programmes are expected to address territorial development goals. For instance, the
160 Bachtler, J. (2003) Reforming EU Cohesion Policy: An Assessment of the Debate, Intereconomics, November/December 2003, pp. 302-305. 161 Bachtler, J. (2003) op. cit

213
objective of territorial cohesion could become a mainstreamed element of Structural Fund programmes.
• If greater emphasis is placed on territorial development objectives, adequate systems should be in place to monitor and evaluate progress, e.g. relevant statistics and monitoring data should be made available at NUTS II and III levels.
• Agreement must be reached on the meaning of ‘balanced territorial development’ and associated terms. Related, agreement should be reached on the required impact of Structural Funds on balanced territorial development. So far, programming documents make very vague references to aspects of balanced territorial development. Definitions vary and even conflict. One element of balanced territorial development can be stressed at the expense of others, e.g. balanced competition over spatial cohesion, or convergence at the EU level versus internal regional convergence. The case for balanced territorial development should be thoroughly debated and should be clearly set out in programming documents.
Build on the Strengths of Structural Funds and Pre-Accession Aid
• Support for lagging regions and countries should remain a priority of the Structural Funds. Within an enlarged EU, there are substantial development disparities at all territorial levels. For instance, eastern border regions and rural regions in the new Member States face particular development challenges. A central dilemma for policy-makers in the new Member States will be how far structural assistance should be concentrated in the main growth centres, where returns for investment are likely to be the most immediate, and how far it should be dispersed across regions according to need. Strengthening regions that are already the most competitive might give the best chance of achieving high growth in the short-term, whilst allocating support according to need maybe more likely to improve internal cohesion and secure balanced development in the long run. Exacerbating this dilemma, the reorientation of Structural Funds and the eligibility of all regions could imply resource allocations to countries/regions that are already comparatively successful. In order to promote balanced development across all levels, it is important that Structural Fund support continues to address the needs of lagging regions, especially those in the new Member States.
• A particular strength of the Structural Funds and Pre-Accession Aid is their capacity to draw together a wide range of policy actors and actions – this strength should be retained. The National Development Programmes of the new Member States illustrate the broad range of development challenges that they face, e.g. ranging from the provision of basic infrastructure to enhancing R&D capacity. A narrowly defined ‘Competitiveness priority’ could limit the relevance of Structural Fund support in some regions. For instance, R&D support could be difficult to absorb in some regions, due to a lack of appropriate facilities. It is anticipated that, in the next programming round, a number regions in the new Member States could be eligible for funding under the proposed ‘Competitiveness’ strand. However, their development needs are likely to remain more in line with those of ‘Convergence’ regions, inadequate communication links, imbalanced development (relatively low density of population in many regions and absence of cities to act as growth poles) and lack of investment in environmental protection. The Competitiveness priority should allow for these issues to be addressed.
Improve Structural Fund Implementation Systems
• In order for Structural Funds and Pre-Accession Aid to make the maximum contribution to territorial development, they must be used effectively and efficiently. In large part, responsibility for the effective implementation of Funds lies with the Member States, e.g. through developing well-defined programming documents, maintaining a suitable

214
project pipeline and efficient implementation of programmes. However, it is also important that Structural Fund and Pre-Accession Aid regulations enable effective and efficient management of programmes and are not overly cumbersome. In their current form, Structural Funds and Pre-Accession Aid are frequently criticised for being overly complicated. Simplification and streamlining regulations could free up time and resources. It should also be recognised that weaker regions may have problems with absorbing funds and support measures should take this into account.
• Partnership working has proved to be a good way to target and identify development potentials and bottlenecks. Partnership working in the new Member States has increased substantially. However, future Structural Funds should continue to build upon and consolidate the progress made to date, particularly as regional participation in the development and implementation of Structural Funds programmes remains patchy.
• The distinct development challenges faced by islands, mountain regions, old industrial regions, border regions and urban areas are identified in many programming documents. Policy should be flexible enough to take the specific needs of various types of regions into account. However, the development of separate support programmes for each regional type could unduly complicate EU assistance programmes. For instance, area designation processes could lead to micro-zoning.
Build on links between Structural Funds and other EU Policies
• Analysis of the Structural Funds alongside other EU programmes reveals a wide range of links between them. While there is considerable scope for policies to be complementary, there is also potential for overlaps and clashes. Experience of the Pre-Accession Aid instruments illustrates the potential for diversity in policy approaches, conflicting time scales and budgets. National Development Plan evaluations have also highlighted areas of potential overlap between, for example, Structural Fund interventions and rural development actions. Improved mechanisms for exchange and coordination between policies are necessary.
• Pre-Accession Aid to Romania and Bulgaria remains vital in order to help them meet their target enlargement in 2007. In particular, the provision of funding for structural investment must be combined with on-going support for improving administration on the ground, for training personnel and for managing, coordinating monitoring and evaluating programmes, especially at the regional level. It should also be noted that in the Candidate Countries and new Member States, a particular weakness in Structural Fund and Pre-Accession Aid implementation systems is the retention of adequately trained staff.

215
11 Indicative Policy Recommendations While this section provides for policy recommendations on overall analyses in ESPON project 2.2.2, further and in many cases more detailed – for instance for the case study regions also spatially quite specified – policy recommendations are provided in the respective analyses section. For the development of policy recommendations and their application a couple of general guidelines should be kept in mind:
(1) As of the considerable variation of regional structures not only in an EU 25 or EU 27 but also within the New Member States and Candidate Countries, comprehensive policy strategies tackling the most important potentials respectively bottlenecks, though not general funds allocation to all kinds of priorities set in the Structural Funds, need to take account of the regions' specifics. What Munoz (2001: 4) points out for innovation related policies in less favoured regions of the EU 15, that "… there is no 'one-size-fits-all' policy portfolio. The regional differences in innovation capabilities are driving to the necessary blend of policy instruments" can also be translated into adequate regional policy packages for the New Member States and Candidate Countries aiming more generally at their development and thus supporting spatial cohesion on different levels. However, this should not be misunderstood as a rationale for widespread funds allocation to any priority but as a rationale for specific and strategic policy intervention.
(2) The European Commission is not responsible for all kinds of regional progress to be achieved through political intervention. The European Commission should only intervene if inter-regional or possibly international effects through intervention can be expected and if the country or region cannot realise the intervention by own means (ARL 2003: 6). For contributions affecting only regional or national, i.e. micro- or meso-level, developments, it is the respective administrative level on regional or national level which is responsible rather than the European Commission. Hence, for the application of policy recommendations on the three different spatial levels, it is asked for increasing cross-sectoral cooperation and collaboration.
(3) Differences in development levels tend to be more pronounced between the group of the New Member States and Candidate Countries and also within some of these countries than in most other parts of the former EU 15. Consequently, to achieve spatial cohesion in an enlarged EU, policy interventions have to take into account these differences in development levels as of the unlike needs in the differently developed regions. This also shows the 'importance of diversity' in the shaping of Europe (Munoz 2001: 26).
(4) As of the vast space under consideration with intervention needs while funds for policy intervention are limited, also cohesion strategies need to propose priorities not only in sectoral but also spatial terms. Most likely, financial limitations will restrict the ability to foster growth and development in and within all concerned regions. While spatial concentration of policy intervention on regional centres which may serve as growth engines can be claimed, at least in some cases of very peripheral and rural regions near the new external border of the EU, interventions are likely to represent transfers rather than productive investments in the short to medium term. Nevertheless, for political and strategic reasons they will be necessary.
Some of these issues are also mentioned and in one or another way explained in more detail referring to adequate examples. Yet, these guidelines and general findings apply to all spatial levels and to different types of regions.
Nonetheless, when discussing territorially oriented policy recommendations or pre-accession aid and future Structural Funds interventions in the New Member States and Candidate Countries, the link between these interventions and territorial objectives respectively development also needs to be discussed.

216
In the past, balanced territorial development has only to a limited extent been an explicit objective of pre-accession aid programmes. Although impacts on territorial development are widely expected, the links between pre-accession aid interventions and territorial impacts are rather unclear. For territorial development objectives to be more clearly addressed, pre-accession aid and Structural Funds regulations should define how programmes are expected to address territorial developments. Therefore, the territorial dimension and expected territorial impacts of different fields of action should be discussed and in particular, the spatial levels addressed need to be defined. Since interventions often affect different spatial levels in different ways and to different extends, priorities of objectives according to spatial levels have to be agreed upon. Not only can one element of balanced spatial development be stressed at the expense of others, but also one spatial level can be emphasised at the expense of another, e.g. spatial cohesion on meso-level over balanced spatial competition on macro-level. Thus, the case for territorial development objectives should be thoroughly debated and priorities should be clearly set out in programming documents on all spatial levels.
Before turning to the discussion of policy recommendations according to the three spatial levels, hypotheses on spatial impacts to be expected from pre-accession aid intervention, as developed in the 2nd Interim Report and further elaborated in chapter 8.1 of this report, should be reviewed. Overall analysis suggests that the hypotheses actually indicated the main direction of spatial impacts of pre-accession aid interventions. Pre-accession aid funds will likely contribute to the territorial objectives set, but due to the volume of resources, the scale of development disparities and institutional capacities, these impacts will not be very pronounced and hardly measurable in quantitative terms. Case study analysis further confirmed different modes of action of the different pre-accession instruments and accordingly also different spatial effects which derive from the variety of priority funded (limited in case of ISPA and SAPARD, vast in case of PHARE) and the scale of projects (large single projects in case of ISPA, smaller and often groups of projects in case of PHARE and SAPARD). Moreover, the analysis confirmed that the impact of different instruments varies at different territorial scales and depends on the type of region affected. The role of institutional conditions assumed to be of high importance with regard to, on the one side, considerable impacts of pre-accession aid interventions and, on the other side, as an important prerequisite for efficient and effective interventions has been asserted especially by the case study analyses.
11.1 Macro level
Apart from general provision of policy recommendations and differentiation between different types of regions – as far as possible – this sub-section generally divides between the different spatial objectives under consideration in ESPON project 2.2.2.
Spatial Cohesion Territorially Balanced Spatial Competition on European Level
Although spatial cohesion in social and economic terms is generally aimed at by the European Commission, due to the development differentials observed between and within the New Member States and Candidate Countries this objective might only be achieved in the long run. The objective for the EU to become the most dynamic, most competitive and sustainable knowledge based economy with full employment until 2010 (Martin and Schmeitz 2002: 1) does not seem to be realistic at all. Even if the growth of each country arises in specific growth regions and can be transferred to these regions' hinterland and then to the whole country as profits from investments in the growth regions (Martin and Schmeitz 2002: 2), it can be questioned whether such a concentration of funds on sometimes very few growth engines can gain political acceptance and how long such a process would take. Thus, the conception of European funds' allocation to regions where the funds are needed most and where they can contribute to a high value added (Martin and Schmeitz 2002: 8), seems to be
217
contradicting for the New Member States and Candidate Countries. While value added of productive investments tends to be highest in only some types of regions, such as possibly Western border regions, old industrialised regions and especially the major agglomerations, needs in terms of cohesion tend to be highest in the Eastern peripheral and rural regions.
Yet, following the concept of growth through a snowball system, cohesion in the long run is only feasible, for most parts of the EU territory if not for all, if productive investments utilised by the regional economy rather than investments without utilisation represent the major policy intervention. In the latter case, regional income levels are permanently supported by funds rather than retrieved from growth in regional economic activity. In the former case, cohesion policy can create regional growth which expands over time across regional borders into the agglomerations' hinterland and the remainder of the country. This way, cohesion policy also contributes to improving balanced spatial competition, as growth is generated from productive forces. Taking this snowball system together with the potential oriented approach which is the basis for this analysis, then growth is most likely to be achieved in regions which are relatively well endowed with potentials as compared to their neighbouring regions. A regular and even spatial expansion of economic development from the growth engines is less likely than the pointed development across the better endowed regions.
In such a framework, also on macro-level, policy recommendations need to differentiate between types of regions. Most important for macro-level cohesion is the utilisation of the Eastern European agglomerations' growth dynamic. However, so far, none of the capital regions and few other major agglomerations in the New Member States and Candidate Countries has been classified as strong MEGA by ESPON project 1.1.1. Most of them represent weak MEGAs and few potential MEGAs. Thus, they need to be strengthened for European competition in terms of their innovation capacity and the development of human resources. Without such preference, not only these MEGAs but basically all regions in New Member States and Candidate Countries will fall back in view of the Lisbon strategy. However, to compete in international innovation, macro-level accessibility, in terms of transport but also telecommunication infrastructure, for these agglomerations needs to be enhanced as envisaged in the frame of Trans European Networks. Yet, if snowball systems shall work, transferring growth to the hinterland, then the respective local links should not be neglected also in reference to macro-level cohesion.162
Another crucial role for macro-level cohesion and thus balanced spatial competition on European scale play the old industrialised regions. This the more, since they are enclosed by a triangle of weak and potential MEGAs, possibly forming a future Eastern European counterpart to the Western European Pentagon.163 Especially as a possible counterpart to the domination of the Pentagon, these regions, together with the MEGAs surrounding them, could contribute to macro-level cohesion and also policentricity on European level. Thus, spill-over growth from the major agglomerations should be directed to these old industrialised regions. Nonetheless, policy packages encompassing improvements in human resources – adjusted to modern employment needs – and enhancement of the restructuring process are needed for the reduction of the still existing bottlenecks in these regions. Especially the importance of sector employment composition has been stressed in above analyses including the quantitative impact assessment.164 Thus, sustainable growth in the old industrialised regions relies on sound restructuring, possibly even differentiating between different types of old industrialised regions, depending on the respective specialisations.
While Western border regions as well as the two island economies are likely to partake in the European cohesion process through regional cohesion and also indirect ways, Eastern peripheral and strongly agricultural dominated regions are particularly short of potentials
162 See also below policy recommendations for the micro-level.
163 See potential oriented typology in 2nd Interim Report of ESPON project 2.2.2.
164 For the complexity of the old structure of old industrialised regions at the example of Upper Silesia and Ostrava Region see also Eckart et al. (2003: 377-380).

218
clearly limiting their growth perspective in the short and medium term. For these regions, especially on national but also regional scale, i.e. meso- and micro-level, it is important not to fall further behind, loosing possibly the last of their potentials. Thus, incentives which can enhance the set up of SMEs with a local market in regional cities are most likely to support these regions' development. Hence, due to sustainable and resistant income differentials, these regions need particular consideration on meso- and micro-levels rather than on macro-level.
To sum up, rather than the differentiation between different priorities of the Structural Funds, policy interventions need to differentiate according to varying spatial needs between countries and regions, thus being more potential rather than priority oriented.
Spatial Integration on Trans-national Scale
While the spatial integration objective is of importance for both, trans-national regions and border regions, here it is only referred to trans-national regions. Policy recommendations with regard to the integration of border regions are discussed further below in the context of cross-border regionalisation and micro-level integration.
Apart from its own perspective, spatial integration on macro-level also aims at the achievement of territorial cohesion across countries and can thus also be regarded as a special instrument in achieving the overall objective. Yet, trans-national integration has a number of different dimensions. The effects of the reduction of trade barriers and other barriers limiting international movements is reflected in the change of trade, capital flow and migration figures. However, these effects do not necessarily provide insights into the level of integration but are a measure of the countries' openness and can also reflect the exploitation of economic differences. These effects have not been investigated in ESPON project 2.2.2. Instead, integration has been understood and analysed with regard to cooperation and collaboration across countries and borders. Consequently, the respective policy recommendations only refer to this aspect and especially to means of improvement for trans-national cooperation and networking. Furthermore, in the following they are provided on a more general level applicable for different macro-regions rather than for selected regions. The latter is provided in more detail in Table 9-3 for the Alpine Space and ARCHIMED macro-regions.
Similarly to the analyses with regard to other policy objectives, measures aiming at trans-national networking in the frame of the macro-regions (INTERREG IIIB) occur to miss a strategic approach on programme level. Objective specific achievements are likely to be largest if a strategic approach on the respective regions' programme level takes account of areas or sectors in need of action throughout the whole macroregion area and if this is also reflected in the selection of projects.
Despite general natural and socio-economic problems, such as limited infrastructure and accessibility or dangers to the environment, spatial integration cannot be achieved without the people in the macro-region. Only if the labour force – or more generally the population – is aware of the benefits of international networking and integration it will actively partake. Thus, fields of action addressing human and business resources should be stronger included in the programmes to foster participation of private sector actors in trans-national activities and to contribute to socio-economic integration.
Closely connected with the promotion of human resource development is a recommendation aiming at the improvement of communication between the different levels involved in trans-national cooperation. The research undertaken has made clear, that in many cases, especially at project level, the understanding of the ESDP objectives is poor or not existent at all. Yet, this understanding could also support adequate project proposal development and realisation directed at the attainment of ESDP objectives. Therefore, among others, an obligatory requirement of cooperation components or common communication strategies could prevent “co-projects” and strengthen the trans-national character of projects

219
Another proposal for improvements of trans-national networking refers to financing mechanisms. Analyses have shown, that at least to some extent, participation in trans-national projects depends on the availability of resources. Especially if EU 15 member states and New Member States belong to one such region, the latter are often disadvantaged in their chances to co-finance projects to similar extents as the other countries. To ensure comparable even if not equal partnership across these different countries, e.g. varying rates of co-financing taking account of particularly low public funds in low income countries and regions could help to overcome this problem.
Finally, evaluation and monitoring on programme level should take the spatial dimension into account, thus also enhancing territorial objective attainment. Yet, to realise this recommendation methods of operationalising spatial objectives and criteria for territorial assessment need to be developed. This has to be achieved in a way well understood by the actors involved but also by the interested population as this can further enhance public support for trans-national networking.
11.2 Meso level
Utilise institutional effects of pre-accession aid and Structural Funds interventions
The importance of institutional conditions for territorial impacts of pre-accession aid to develop has been highlighted from various perspectives throughout the report. Strengthening of institutional capacities on meso and micro level alike can be assessed as one major effect of pre-accession aid, be it as result of institution building measures or as side-effect of interventions in other fields of action. A particular strength of pre-accession aid, in this respect, is their capacity to draw together a wide range of policy actors and actions on all spatial levels. This strength should be retained.
Nevertheless, institutional bottlenecks limited full optimal utilisation of pre-accession aid programmes and thus potential impacts on territorial developments. Accordingly, institution building should remain a focus for Structural Funds in the New Member States and especially for pre-accession aid in the Candidate Countries. Although EU policies considerably strengthened institutional structures on the national level, there should be a continued emphasis on building up coordination and partnership in the New Member States and Candidate Countries. This as well applies to the micro level, since there is a particular need to improve programming capacity at the regional level, ensuring that specific regional development concepts and strategies are compatible with and reflected in national and European development plans. Further progress in capacity building will also help to increase absorption capacity of the new Member States and their regions.
Moreover, clear guidelines should be provided for the division of responsibilities among the national and regional levels of the spatial development institutions, with special regard to the establishment of the procedural rules and decision-making powers in programming regional development and utilising decentralised budgetary and international resources. In some countries (e.g. Czech Republic, Hungary) the relationship between the political (NUTS III) level and the administrative (NUTS II) level needs to be further clarified in order to ensure smooth implementation of regional/spatial policy. Furthermore, in some of these countries NUTS levels have been implemented in the course of EU membership preparation not necessarily taking account of historical regional developments or regional identities. This results in regions basically only referred to in statistical yearbooks rather than filled with regional activity. This might be overcome by thorough adjustments of NUTS region assignment.
Complexity of implementation procedures of pre-accession aid programmes themselves proofed to hamper effective and efficient implementation of programmes and projects. Application, implementation and control procedures are frequently regarded as putting
220
unnecessary cost and time pressure on responsible institutions on national level and on regional level as well. Simplification of structures could therefore contribute to enhanced results of implemented programmes and accordingly to stronger territorial impacts. This holds the more if procedures are speeded up in the course of simplification, as then project selection and implementation can be more easily react on latest territorial developments.
Take country specific characteristics into account
Analysis emphasised the importance of country specific characteristics with regard to, on the one side, setting of territorial development priorities and, on the other side, impacts to be expected from pre-accession aid and Structural Funds interventions.
Relevance and priority of different territorial development objectives vary according to the initial socio-economic situation and their potential provision of countries but also with regard to other country specific features, e.g. with regard to the size or natural conditions of a country. Moreover, the national political, social and cultural context has to be regarded when deciding on territorial development priorities. While, for instance, the emphasis of spatial competition objectives at the expense of spatial cohesion objectives might fit into the national context in some countries it might arouse conflicts in other countries on meso-level.
The distinctive situation of the Central and Eastern European Countries in terms of economic transition should be taken into account with regard to territorial development objectives and selection of interventions. Due to different paces and characteristics of the transition process, still, national differences remain in comparison to development levels of EU-15. The level of institutional and macro-economic developments, however, is crucial for the positioning of these countries within the EU’s Lisbon Strategy. At the same time, transition processes resulted in increasing intra-national and intra-regional disparities in the New member States and Candidate Countries. Thus, equity and efficiency debates and the goals of the Lisbon and Gothenburg strategies pose particular challenges for these countries, which face the multiple challenges of underdeveloped national economies, growing regional disparities and limited financial resources, in both public and private sectors. Discussions on territorial development objectives and policies should not loose sight of these particular contexts differing distinctively from conditions in EU-15 countries.
Take specific characteristics of types of regions into account
The most important challenge for achieving territorial development objectives in the New Member States and Candidate Countries is to take varying regional characteristics in terms of potentials and bottlenecks into account and to orientate spatial policy interventions towards the complex regional development situations. Analysis showed that one-sided interventions or interventions not adapted to the regional situation hardly reveal impacts on territorial developments. Therefore, interventions should be combined and coordinated to simultaneously address the main regional bottlenecks.165 For each region a coordinated strategy of interventions should be developed. Since the types of regions are defined by certain similarities of development problems, overall policy options with regard to relevant fields of action can be developed for each type of region. And, furthermore, in the next step they should even be more differentiated within types of regions, as even within one type of region different development levels can be found. Since specific development strategies tend to be related to the regional level, these policy options will be discussed under the micro level perspective in more detail.
Also on meso level implications of the EU’s Lisbon and Gothenburg strategies need to be discussed for different types of regions. While urban agglomerations, classified as MEGAs –
165 Development of “package solutions” of selected measures have also been requested by the German ARL in order
to avoid arbitrary lists of measures established for safeguarding of funding only. Compare ARL (2003).

221
in most New Member States and Candidate Countries these are only the capital cities – have been emphasised as most important regions under the light of the Lisbon Strategy on macro level, from meso level perspective second tier agglomerations have to be regarded as well. To foster balanced spatial competition on meso level and to prevent agglomeration disadvantages to develop in the MEGAs, national counterbalances need to be strengthened. The function of urban agglomerations as engines of competitiveness and innovation has to be fostered in agglomerations of national rather than international importance as well. Therefore, in many cases, existing strong potentials have to be utilised by reducing the most severe bottlenecks in these regions. Moreover, linkages between the respective national MEGAs and the second tier agglomerations and trans-national linkages between agglomerations of similar positions have to be established and strengthened to encourage development of competitive patterns of specialisation adapted to national contexts and regional initial potentials. Form this perspective, agglomerations situated within the Western border regions or within old industrial regions provide high potentials for contributing to balanced spatial competition and spatial integration on meso level alike, since the former are in a favourable situation for integration into urban networks with the neighbouring EU-15 Member States, while the latter can build upon strong national positions in the past and remaining strong potentials.
Coordinate sector policies with territorial approaches
As analysis of territorial impacts of the adoption of the acquis indicated, several sector policies reveal a strong territorial dimension. To foster complementarity of sector and spatial policies and to prevent negative effects of mutually conflicting interventions both types of policy need to be coordinated with regard to their territorial impacts166. For the New Member States and Candidate Countries the adoption of the acquis provided insights into the relevance of specific sector policies for specific types of regions. E.g. the Common Agricultural Policy is of particular importance for rural and often lagging regions, environmental policies are highly relevant for old industrial regions facing severe environmental problems, and many other sectors of the acquis, however, mostly provide development opportunities for the major urban agglomerations, e.g. transport policies in form of TEN investments, R&D policies or policies related to the Internal Market. These regionally varying territorial effects of sector policies have to be taken into account and shall be further investigated for the preparation of the final report.
11.3 Micro level From a micro level perspective the specific challenge of developing comprehensive regional strategies which utilise existing potentials and reduce main bottlenecks come into focus. Nonetheless, depending on the actual kind of intervention, they might only affect the micro level but could also affect meso and macro levels. For instance, this can be illustrated by different kinds of infrastructure investments: The pavement of a local mud road between two remote villages certainly affects only the micro level while the upgrading of transport or telecommunication infrastructure connecting a MEGA with its hinterland affects firstly also the micro level but can also contribute to the achievement of territorial objectives on meso and macro levels if this upgraded infrastructure is utilised adequately and can stimulate additional economic activity in the hinterland, leading to spatially extended growth.
Provide an analytical base for interventions adapted to specific regional situation
First of all, to be able to draw such integrated strategies on a region by region level adequate systems of analysing initial regional situations and evaluating potentials and bottlenecks need
166 This is also emphasised bythe German Beirat für Raumordnung (2004).

222
to be in place. So far, only a few countries established extensive SWOT analysis on NUTS 3 level167 in order to lay a sound foundation for the implementation of pre-accession aid or Structural Funds. Relevant socio-economic statistics and data on policy monitoring (spending levels, fields of action) should be made available on regional level for all countries. Only if comprehensive comparisons across regions within and between countries can be undertaken, it is possible to conduct an appropriate SWOT focussing not only on the specifics of the region but also relating the regional situation adequately in the national and international context. However, to achieve this, akin and extensive statistics providing information on the different kinds of potentials need to be available.
Increase institutional capacity on regional level
Bottlenecks related to weaknesses of regional institutional structures provided a frequent constraint for sound definition and implementation of pre-accession aid programmes on regional level. Institutional capacities, therefore, need to be further strengthened in order to provide the basis, on the one side, for development of intervention strategies adapted to the specific regional situation and, on the other side, for effective implementation of measures. Besides, such improved institution building can also enhance absorption capacity at the regional level for different potential oriented interventions, thus contributing to higher effectiveness of possible measures. Yet, capacity building should focus on those interventions and regions, which are in the focus of the next programming period in order to avoid unutilised and thus in the short run wasted institutional measures.
Define priority actions for each type of region
As already mentioned in the preceding section, broad territorial development strategies can be developed with regard to a selected combination of the most important fields of action for each regional type identified by ESPON project 2.2.2. in the New Member States and Candidate Countries. Although these types of regions are broadly comparable, country specific influence and situations might lead to different regional characteristics and potentials and should not be disregarded. Moreover, different development levels of regions belonging to one regional type define the scope for action and effectiveness of interventions. Following, broad strategies for each type of region are indicated below, which can be described as policy packages. With more specific differentiation of sub-types revealing differences in the development levels, these packages can be even more specified leaving no more than two to three priorities each region should focus on. Nevertheless, such further differentiation may also reveal again slightly different foci for one or another region than for most parts of the region type.
For the present differentiation of types of regions Map 11-1 gives an abstracting and summarising overview relating the policy strategies to the types of regions. Furthermore, this overview also stresses that, while different types of regions need to focus, to some extent, on similar potentials their actual priorities within these potentials differ noticeably.
167 See for instance the Slovenian White Paper on Regional Development Strategy (NARD 1999).

223
Map 11-1: Summary of Tentative Policy Packages* for Different Types of Regions
* For the description and contents of the policy packages see below box.

224
Policy Package 1 for major agglomerations:
- infrastructure linkages on different levels (geographic position)
- innovation
- sector and business structure (urbanisation and localisation)
Policy Package 2 for western border regions:
- human resources (labour market)
- innovation
- cross-border integration
Policy Package 3 for old industrialised regions:
- business restructering (urbanisation and localisation)
- human resources (labour market)
- infrastructure modernisation (geographic position)
- environment
Policy Package 4 for eastern peripheral and rural regions:
- economic diversification on basis of local SME´s (urbanisation and localisation)
- institution building
- human resources (labour market)
--------------------------------------------
- cross-border co-operation
Policy Package 5 for island economies:
- environmental protection
- trans-national integration measures
- economic diversification (urbanisation and localisation)
Capital cities / major urban agglomerations
These regions demonstrate the most favourable economic indicators, benefiting from, for example, high investment, skilled labour forces and training facilities, more developed infrastructure, business services and access to decision makers. Some capitals (e.g. Budapest, Prague, Bratislava and Tallinn) are highly dominant in the national economic structure. To maintain growth dynamic of these agglomerations of high importance for the integration of the New Member States and Candidate Countries into the Lisbon process the reduction of bottlenecks need to be supported. By improving national and international transport infrastructure linkage these regions could increasingly profit from European integration dynamics. In addition, the strengthening of linkages between agglomeration and hinterland are of special importance to prevent negative agglomeration effects and negative impacts resulting from sharp disparities within one agglomeration region. Linkages in terms of transport infrastructure but also in terms of sector and business structure should be fostered to enable positive spread effects of urbanisation and localisation advantages.

225
Western border regions
Western border regions benefit from proximity to the EU-15, encouraging investment, trade, tourism and cross-border retail and educational/technological initiatives. To fully utilise these advantages for increasing competitiveness existing strong potentials should be strengthened in particular with regard to labour market potentials and innovation capacity. Adjustments of labour market and economic structure towards the Western neighbouring regions would provide the basis for economic cooperation on a qualitatively high level. In addition, barriers to spatial integration and cooperation have to be reduced especially in terms of improved transport infrastructure linkages, but also with regard to institutional and socio-cultural barriers. Cross-border cooperation programmes accordingly form integral part of development strategies for these regions and should concentrate on socio-cultural cooperation, e.g. in the framework of Small Project Funds and establishment of functional economic linkages. The cooperation and integration character of cross-border projects should be strengthened by request for equal involvement of actors from both sides of the border.
Old industrial regions
These regions were the drivers of economic activity under socialism and have been particularly affected by privatisation, enterprise restructuring/closures, subsidy loss and market re-orientation. Problems include unemployment, lack of entrepreneurship and environmental decline. A full process of restructuring still has to be undertaken in some old, mono-structural areas. Spatial policies therefore, have to be directed towards supporting restructuring processes. Most important fields of action are related to the adjustment of the human capital stock towards requirements of knowledge-based economies, the adjustment of sector and business structures towards competitive industries and services, the modernisation of infrastructures and the reduction of environmental damages.
Peripheral eastern and rural regions
These regions are among the most economically disadvantaged in CEE. Geographical location, poor infrastructure, low investment, declining agriculture and rural out-migration are all contributory factors. Spatial policies in these regions can not be expected to improve the productive basis to a considerable extent, due to the dimension of bottlenecks for development and the low levels of funding available. Thus, spatial policies in these regions rather take the form of social transfers aiming to prevent further degradation of regional situations. Interventions should be concentrated on stabilising the situation of regional and local centres by e.g. supporting economic diversification on the basis of locally active SMEs or improvement of labour market potentials. As the analysis showed institutional bottlenecks in these regions constrain effective and efficient implementation of EU-programmes or projects, thus one focus has to remain on further institution building measures on regional level. Moreover, cross-border cooperation in the most peripheral eastern border regions should be fostered in the fields of socio-cultural and institutional co-operations in order to prepare for long-term reduction of development barriers resulting from relatively closed borders and political tensions.
Island economies
Island economies face the challenges of peripherality, internal development disparities and a high dependence on employment in the tourism sector and agriculture. At the same time, endowment with rich natural and cultural heritage sites form an important part of the economic base especially in the tourism sector. Natural and cultural environments particularly vulnerable due to high densities of population and activities on the island’s small territories should be protected in particular. To foster integration of the island economies into the mainland developments and to provide opportunities for economic diversification economic and institutional linkages to the neighbouring countries should be strengthened.

ESPON.2.2.2
Pre-accession Aid Impact Analysis
Third Interim Report
PART III: Annexes

II
12 List of Indicators Developed and Datasets Provided to the ESPON Database
Table 12-1: Indicators developed by ESPON project 2.2.2.
Indicator NUTS level Countries Years1 Number of indicators
Policy Indicators
Total PHARE, PHARE CBC and ISPA allocation by region
NUTS 2 / NUTS 3
All Central and Eastern European Candidate Countries
1998-2000,
2001-2002
2
Total SAPARD spending by region
NUTS 2 / NUTS 3
Complete: CZ, EE, HU, LT, PL, SI, SK ;
Incomplete: BG, LV, RO
2000-2003
(varying per country)
1
Total pre-accession aid spending by region
NUTS 2 Malta, Cyprus 2000-2002 1
Pre-accession aid allocation by region according to programmes
NUTS 2 / NUTS 3
All Candidate Countries 1998-2000,
2001-2002
2
Total PHARE, PHARE CBC and ISPA spending as % of regional GDP
NUTS 2/ NUTS 3
All Central and Eastern European Candidate Countries
1998-2000,
2001-2002
2
Total SAPARD spending as % of regional GDP by region
NUTS 2 / NUTS 3
Complete: CZ, EE, HU, LT, PL, SI, SK ;
Incomplete: BG, LV, RO
2000-2003
(varying per country)
1
Total pre-accession aid spending as % of regional GDP by region
NUTS 2 Malta, Cyprus 2000-2002 1
Total PHARE, PHARE CBC and ISPA spending per capita
NUTS 2/ NUTS 3
All Central and Eastern European Candidate Countries
1998-2000,
2001-2002
2
Total SAPARD spending per capita
NUTS 2 / NUTS 3
Complete: CZ, EE, HU, LT, PL, SI, SK ;
Incomplete: BG, LV, RO
2000-2003
(varying per country)
1
Total pre-accession aid spending per capita
NUTS 2 Malta, Cyprus 2000-2002 1
Total PHARE, PHARE CBC and ISPA spending according to potentials addressed as % of total
NUTS 2/ NUTS 3
All Central and Eastern European Candidate Countries
1998-2000,
2001-2002
16
1 Data is provided as average annual figures for the total period indicated, not for single years.

III
spending by region
Total SAPARD spending according to potentials addressed as % of total spending by region
NUTS 2 / NUTS 3
Complete: CZ, EE, HU, LT, PL, SI, SK ;
Incomplete: BG, LV, RO
2000-2003
(varying per country)
8
Total pre-accession aid spending according to potentials addressed as % of total spending by region
NUTS 2 Malta, Cyprus 2000-2002 8
Location quotients for pre-accession aid spending according to potentials addressed by region2
NUTS 2 / NUTS 3
All Candidate Countries 1998-2000 8
Combined policy – potential indicators
Location quotients for pre-accession aid addressing the labour market combined with human capital index
NUTS 2 / NUTS 3
All Candidate Countries 1998-2000 1
Location quotients for pre-accession aid addressing the labour market combined with active population density
NUTS 2 / NUTS 3
All Candidate Countries 1998-2000 1
Location quotients for pre-accession aid addressing the capital supply combined with GDP per capita
NUTS 2 / NUTS 3
All Candidate Countries 1998-2000 1
Location quotients for pre-accession aid addressing urbanisation and localisation advantages combined with share of employment in agriculture/ industry/ services
NUTS 2 / NUTS 3
All Candidate Countries 1998-2000 3
Location quotients for pre-accession aid addressing the regional market potential combined with population density
NUTS 2 / NUTS 3
All Candidate Countries 1998-2000 1
2 Data for location quotients includes PHARE, PHARE CBC and ISPA spending 1998-2000 as well as pre-accession
aid spending for Malta and Cyprus 2000-2002.

IV
Location quotients for pre-accession aid addressing the geographic position combined typology multimodal accessibility
NUTS 2 / NUTS 3
All Candidate Countries 1998-2000 1

V
13 List of Maps, Tables and Figures
13.1 Maps, Tables and Figures included in Part II
Maps
Map 8-1: Regional PHARE, PHARE CBC and ISPA Spending as percentage of regional GDP, 1998-2000 .............................................................................................................. 99
Map 8-2: Regional PHARE, PHARE CBC and ISPA Spending as percentage of regional GDP, 2001-2002 ............................................................................................................ 100
Map 8-3: Location Quotient of Pre-Accession Aid addressing the Labour Market between 1998 and 2000 and the Human Capital Index 1999 ...................................................... 106
Map 8-4: Location Quotient of Pre-Accession Aid addressing the Labour Market between 1998 and 2000 and Active Population Density 1998 ..................................................... 109
Map 8-5: Location Quotient of Pre-Accession Aid addressing the Labour Market between 1998 and 2000 and the Change of the Active Population Density between 1998 and 2001................................................................................................................................ 115
Map 8-6: Average Annual Pre-accession Aid Spending in Percentage of Average Annual GDP in Relation to the Change of Economic Performance Measured in per capita GDP (PPS) (with EU 15 index = 100) between 1998 and 2000 ............................................. 123
Map 8-7: Average Annual Pre-accession Aid Spending in Percentage of Average Annual GDP in Relation to the Change of Average National Performance Measured in Percentage Growth of per capita GDP (PPS) between 1998 and 2000 ........................ 125
Map 11-1: Summary of Tentative Policy Packages* for Different Types of Regions ............ 223
Tables
Table 5-1: Spatial Level of Regionalised Policy Indicators according to Country ……………...2
Table 5-2: Integration of 3-level Approach in ESPON Project 2.2.2……………………………..2 Table 5-3: Responsibilities for case studies in WP 5 and regional case study specification
10 Table 5-4: Responsibilities for case studies in WP 7 and regional case study specification .. 12 Table 6-1: Chapters of the Acquis........................................................................................... 16 Table 6-2: Country Analyses: Summary Table........................................................................ 19 Table 6-3: Acquis Chapters and Territorial Development Themes ......................................... 20 Table 6-4: Relation of the Acquis to Territorial Development.................................................. 22 Table 6-5: Agriculture and Territorial Goals ............................................................................ 23 Table 6-6: Environment and Territorial Goals ......................................................................... 26 Table 6-7: Transport, TENs and Territorial Development ....................................................... 28 Table 6-8: Regional Policy, Structural Funds and Territorial Development ............................ 30 Table 6-9: Competition Policy and Territorial Development.................................................... 32 Table 6-10: R&D Policy and Territorial Development ............................................................. 34

VI
Table 6-11: Internal Market and Territorial Development........................................................ 35 Table 6-12: The Acquis/Community Policies and Territorial Goals......................................... 38 Table 7-1: Typology of key policies with territorial impacts ..................................................... 46 Table 7-2: Regional Policy Objectives and Territorial Development Goals ............................ 51 Table 7-3: Summary Regional Policy Objectives .................................................................... 54 Table 7-4: Policy Instruments and Territorial Goals ................................................................ 57 Table 7-5: Summary Indicative Regional Policy Instruments.................................................. 61 Table 7-6: Spatial Targeting .................................................................................................... 64 Table 7-7: Summary Spatial Targeting.................................................................................... 67 Table 7-8: Institutional Arrangements ..................................................................................... 72 Table 7-9: Summary Institutional Arrangements..................................................................... 73 Table 7-10: EU Cohesion Policy and National Regional Policy Compared (excludes
Switzerland and Norway) ................................................................................................. 77 Table 8-1: Phare support according to the nature of the activity – 1998 ................................ 84 Table 8-2: Selected PHARE Multi-Beneficiary programmes................................................... 85 Table 8-3: Different aspects of territorial cohesion and different territorial levels ................... 88 Table 8-4: Total pre-accession aid according to programmes, in MEUR ............................... 92 Table 8-5: Percentage of total PHARE, PHARE CBC and ISPA spending 1998-2000
addressing different regional potentials/bottlenecks ........................................................ 93 Table 8-6: Percentage of total PHARE, PHARE CBC and ISPA spending 2001-2002
addressing different regional potentials/bottlenecks ........................................................ 94 Table 8-7: Total PHARE, PHARE CBC and ISPA spending according to spatial level
addressed......................................................................................................................... 95 Table 8-8: Total SAPARD spending........................................................................................ 96 Table 8-9: SAPARD annual financing agreement, 2001......................................................... 96 Table 8-10: Percentage of total SAPARD spending addressing different regional
potentials/bottlenecks....................................................................................................... 97 Table 8-11: Overview on Case Study Findings ..................................................................... 135 Table 9-1: Overview on INTERREG, PHARE CBC and TACIS CBC ................................... 154 Table 9-2: Overview on Cross-border Case Study Findings................................................. 164 Table 9-3: Overview on Macro-regions Case Study Findings............................................... 179 Table 10-1: EU Funds for the New Member States 2004-2006............................................ 191 Table 10-2: Development Potential and Bottlenecks ............................................................ 194 Table 10-3: SPD Priorities ..................................................................................................... 197 Table 10-4: CSF Operational Programmes........................................................................... 198 Table 10-5: Proposed Reform of Structural Funds: Third Cohesion Report. ........................ 210 Table 10-6: Proposed Financial Allocation to Priorities......................................................... 211

VII
Figures
Figure 5-1: Indication of descriptive relation between potentials and pre-accession aid allocation…………………………………………………………………………………………..6
Figure 6-1: Employment Structures in the New Member States ............................................. 24 Figure 6-2: State Aid Map – Czech Republic .......................................................................... 32 Figure 6-3: European Research Area: Key policies and Instruments ..................................... 33 Figure 7-1: Slovenia Development Aid Areas ......................................................................... 65 Figure 7-2: Area Designation Map for the Czech Republic..................................................... 65 Figure 7-3 : Czech Regions with Concentrated Support......................................................... 66 Figure 10-1: Objective 1 Regions.......................................................................................... 190 Figure 10-2: Linkages between Structural Funds & Pre-Accession Aid and Territorial
Development .................................................................................................................. 205 Figure 10-3: Spatial Integration and EU Policies................................................................... 206 Figure 10-4: Balances Spatial Competition and EU Policies ................................................ 207 Figure 10-5: Spatial Cohesion and EU Policies .................................................................... 208

VIII
13.2 Maps, Charts and Tables included in the Annex
Maps
Map 18-1: Share of Pre-Accession Aid Addressing the Geographic Position, 1998-2000 .. XVII Map 18-2: Share of Pre-Accession Aid Addressing the Environmental Quality, 1998-2000
...................................................................................................................................... XVIII Map 18-3: Share of Pre-Accession Aid Addressing Human and Business Resources, 1998-
2000................................................................................................................................ XIX Map 18-4: Share of Pre-Accession Aid Addressing the Geographic Position, 2001-2002 .... XX Map 18-5: Share of Pre-Accession Aid Addressing the Environmental Quality, 2001-2002 XXI Map 18-6: Share of Pre-Accession Aid Addressing Human and Business Resources, 2001-
2002............................................................................................................................... XXII Map 18-7: Location Quotient of Pre-Accession Aid addressing the Capital Supply between
1998 and 2000 and GDP per Capita 1999................................................................... XXIII Map 18-8: Location Quotient of Pre-Accession Aid addressing the Regional Market Potential
between 1998 and 2000 and Population Density 1998 ...............................................XXIV Map 18-9: Location Quotient of Pre-Accession Aid addressing Urbanisation and Localisation
Advantages between 1998 and 2000 and Share of Employment in Agriculture 1998 .XXV Map 18-10: Location Quotient of Pre-Accession Aid addressing Urbanisation and Localisation
Advantages between 1998 and 2000 and Share of Employment in Industry 1998.....XXVI Map 18-11: Location Quotient of Pre-Accession Aid addressing Urbanisation and Localisation
Advantages between 1998 and 2000 and Share of Employment in Services 1998...XXVII Map 18-12: Location Quotient of Pre-Accession Aid addressing the Geographic Position
between 1998 and 2000 and Multimodal Accessibility ..............................................XXVIII Map 18-13: Location Quotient of Pre-Accession Aid addressing the Labour Market between
1998 and 2000 and the Change of the Human Capital Index between 1999 and 2001......................................................................................................................................XXIX
Map 18-14: Location Quotient of Pre-Accession Aid addressing the Capital Supply between 1998 and 2000 and the Change of the per capita GDP between 1999 and 2001........XXX
Map 18-15: Location Quotient of Pre-Accession Aid addressing the Regional Market Potential between 1998 and 2000 and the Change of the Population Density between 1998 and 2001..............................................................................................................................XXXI
Map 18-16: Location Quotient of Pre-Accession Aid addressing Urbanisation and Localisation Advantages between 1998 and 2000 and the Change of the Agricultural Sector Employment Share between 1998 and 2001..............................................................XXXII
Map 18-17: Location Quotient of Pre-Accession Aid addressing Urbanisation and Localisation Advantages between 1998 and 2000 and the Change of the Industrial Sector Employment Share between 1998 and 2001.............................................................XXXIII
Map 18-18: Location Quotient of Pre-Accession Aid addressing Urbanisation and Localisation Advantages between 1998 and 2000 and the Change of the Service Sector Employment Share between 1998 and 2001 ..................................................................................XXXIV

IX
Charts
Chart 18-1: GDP per Capita 1999 related to (a) Location Quotient of Pre-Accession Aid addressing the Capital Supply between 1998 and 2000 and (b) % of Pre-Accession Aid addressing the Capital Supply as Share of Total Regional Pre-Accession Aid between 1998 and 2000 ............................................................................................................XXXV
Chart 18-2: Population Density 1998 related to (a) Location Quotient of Pre-Accession Aid addressing the Regional Market Potential between 1998 and 2000 and (b) % of Pre-Accession Aid addressing the Regional Market Potential as Share of Total Regional Pre-Accession Aid between 1998 and 2000.....................................................................XXXVI
Chart 18-3: Share of Employment in Agriculture 1998 related to (a) Location Quotient of Pre-Accession Aid addressing Urbanisation and Localisation Advantages between 1998 and 2000 and (b) % of Pre-Accession Aid addressing Urbanisation and Localisation Advantages as Share of Total Regional Pre-Accession Aid between 1998 and 2000...................................................................................................................................XXXVII
Chart 18-4: Share of Employment in Industry 1998 related to (a) Location Quotient of Pre-Accession Aid addressing Urbanisation and Localisation Advantages between 1998 and 2000 and (b) % of Pre-Accession Aid addressing Urbanisation and Localisation Advantages as Share of Total Regional Pre-Accession Aid between 1998 and 2000..................................................................................................................................XXXVIII
Chart 18-5: Share of Employment in Services 1998 related to (a) Location Quotient of Pre-Accession Aid addressing Urbanisation and Localisation Advantages between 1998 and 2000 and (b) % of Pre-Accession Aid addressing Urbanisation and Localisation Advantages as Share of Total Regional Pre-Accession Aid between 1998 and 2000....................................................................................................................................XXXIX
Chart 18-6: Multimodal Accessiblity related to (a) Location Quotient of Pre-Accession Aid addressing the Geographic Position between 1998 and 2000 and (b) % of Pre-Accession Aid addressing the Geographic Position as Share of Total Regional Pre-Accession Aid between 1998 and 2000...................................................................................................XL
Chart 18-7: Change of the Human Capital Index between 1999 and 2001 related to (a) Location Quotient of Pre-Accession Aid addressing the Labour Market between 1998 and 2000 and (b) % of Pre-Accession Aid addressing the Labour Market as Share of Total Regional Pre-Accession Aid between 1998 and 2000....................................................XLI
Chart 18-8: Change of the per capita GDP between 1999 and 2001 related to (a) Location Quotient of Pre-Accession Aid addressing the Capital Supply between 1998 and 2000 and (b) % of Pre-Accession Aid addressing the Capital Supply as Share of Total Regional Pre-Accession Aid between 1998 and 2000...................................................XLII
Chart 18-9: Change of the Population Density between 1998 and 2001 related to (a) Location Quotient of Pre-Accession Aid addressing the Regional Market Potential between 1998 and 2000 and (b) % of Pre-Accession Aid addressing the Regional Market Potential as Share of Total Regional Pre-Accession Aid between 1998 and 2000 ..........................XLIII
Chart 18-10: Change of the Agricultural Sector Employment Share between 1998 and 2001 related to (a) Location Quotient of Pre-Accession Aid addressing Urbanisation and Localisation Advantages between 1998 and 2000 and (b) % of Pre-Accession Aid addressing Urbanisation and Localisation Advantages as Share of Total Regional Pre-Accession Aid between 1998 and 2000....................................................................... XLIV
Chart 18-11: Change of the Industrial Sector Employment Share between 1998 and 2001 related to (a) Location Quotient of Pre-Accession Aid addressing Urbanisation and Localisation Advantages between 1998 and 2000 and (b) % of Pre-Accession Aid addressing Urbanisation and Localisation Advantages as Share of Total Regional Pre-Accession Aid between 1998 and 2000........................................................................ XLV

X
Chart 18-12: Change of the Service Sector Employment Share between 1998 and 2001 related to (a) Location Quotient of Pre-Accession Aid addressing Urbanisation and Localisation Advantages between 1998 and 2000 and (b) % of Pre-Accession Aid addressing Urbanisation and Localisation Advantages as Share of Total Regional Pre-Accession Aid between 1998 and 2000....................................................................... XLVI
Chart 18-13: Change of GDP per Capita (PPS) between 1998 and 2001 related to the Regional Pre-accession Aid Share of National Pre-accession Aid in Percentage for Estonia......................................................................................................................... XLVII
Chart 18-14: Change of GDP per Capita (PPS) between 1998 and 2001 related to the Regional Pre-accession Aid Share of National Pre-accession Aid in Percentage for Hungary....................................................................................................................... XLVII
Chart 18-15: Change of GDP per Capita (PPS) between 1998 and 2001 related to the Regional Pre-accession Aid Share of National Pre-accession Aid in Percentage for Lithuania..................................................................................................................... XLVIII
Chart 18-16: Change of GDP per Capita (PPS) between 1998 and 2001 related to the Regional Pre-accession Aid Share of National Pre-accession Aid in Percentage for Latvia.................................................................................................................................... XLVIII
Chart 18-17: Change of GDP per Capita (PPS) between 1998 and 2001 related to the Regional Pre-accession Aid Share of National Pre-accession Aid in Percentage for Romania ....................................................................................................................... XLIX
Chart 18-18: Change of GDP per Capita (PPS) between 1998 and 2001 related to the Regional Pre-accession Aid Share of National Pre-accession Aid in Percentage for Slovenia........................................................................................................................ XLIX
Chart 18-19: Change of GDP per Capita (PPS) between 1998 and 2001 related to the Regional Pre-accession Aid Share of National Pre-accession Aid in Percentage for Slovakia.............................................................................................................................. L
Chart 18-20: Percentage of Regional Pre-accession Aid Spending between 1998 and 2000 as Share of National Pre-accession Aid in Relation to Regional Unemployment Rate in 1999............................................................................................................................................ L
Chart 18-21: Change Unemployment Rates between 1999 and 2002 related to the Regional Pre-accession Aid Share of National Pre-accession Aid in Percentage for the Czech Republic............................................................................................................................. LI
Chart 18-22: Change Unemployment Rates between 1999 and 2002 related to the Regional Pre-accession Aid Share of National Pre-accession Aid in Percentage for Hungary....... LI
Chart 18-23: Change Unemployment Rates between 1999 and 2002 related to the Regional Pre-accession Aid Share of National Pre-accession Aid in Percentage for Lithuania..... LII
Chart 18-24: Change Unemployment Rates between 1999 and 2002 related to the Regional Pre-accession Aid Share of National Pre-accession Aid in Percentage for Poland ........ LII
Chart 18-25: Change Unemployment Rates between 1999 and 2002 related to the Regional Pre-accession Aid Share of National Pre-accession Aid in Percentage for Slovakia..... LIII
Tables
Table 12-1: Indicators developed by ESPON project 2.2.2....................................................... II Table 17-1: Number of performance indicators achieved ..................................................... XVI Table 18-1: Overview on policy data included in the database established by ESPON project
2.2.2.................................................................................................................................LIV

XI
Table 18-2: Availability and Sources of Potential Indicators .................................................LVII Table 18-3: Change of Double Indicators for different Potentials addressed between 1998 and
2000 through Pre-accession Aid Funds ........................................................................LVIII Table 18-4: Definition and Scaling of Variables Used in Correlation and Regression Analyses
........................................................................................................................................LXII Table 18-5: Results of Bivariate Correlation Analyses for Total Pre-accession Aid and
Potential Oriented Pre-accession Aid Allocation with Respect to Potential Indicators, Changes of Potential Indicators and the Initial Situation**** .........................................LXIII
Table 18-6: Results of Bivariate Correlation Analyses for Changing Economic Performance in terms of GDP per Capita in PPS and Unemployment Rates with Respect to Total Pre-accession Aid Allocation, Potential Indicators, Changes of Potential Indicators and the Initial Situation**** ........................................................................................................ LXIV
Table 18-7: Preliminary Regression Analyses Results for the Change of Total and Percentage GDP per capita in PPS in the New Member States and Bulgaria and Romania****..... LXV
Table 18-8: Preliminary Regression Analyses Results for the Change of Total and Percentage Unemployment in the New Member States and Bulgaria and Romania...................... LXVI
Table 18-9: Additional Information on Case Studies Analysing Spatial Impacts of Pre-Accession Aid.............................................................................................................. LXVII
Table 18-10: Additional Information on Case Studies on Cross-Border Regions ............. LXXIV Table 18-11: Additional Information on Case Studies on Transnational Macroregions..... LXXX

XII
14 List of Missing Data Policy data
Data on regional SAPARD allocation Latvia, Bulgaria, Romania
Potential data
GDP in €/in PPS per capita Incomplete time series, e.g. no values Czech Republic 1999
Active Population Single values missing, e.g. Bulgaria 1998, Malta 1998, Slovenia SI00D /SI00E
Indicator multimodal accessibility Time series missing for all countries
Active Population by education (HCI) Values missing for Bulgaria 1999, no NUTS 3 data
Population density Single values missing, e.g. Malta 1998, single regions Poland 2001
Employment by sector Single values missing, e.g. Bulgaria 1998, Malta 1998, no NUTS 3 data
Unemployment rate Single values missing, e.g. Bulgaria 1999, Malta 1999 and 2001, data on NUTS 3 level partly not available, e.g. Slovenia 1999
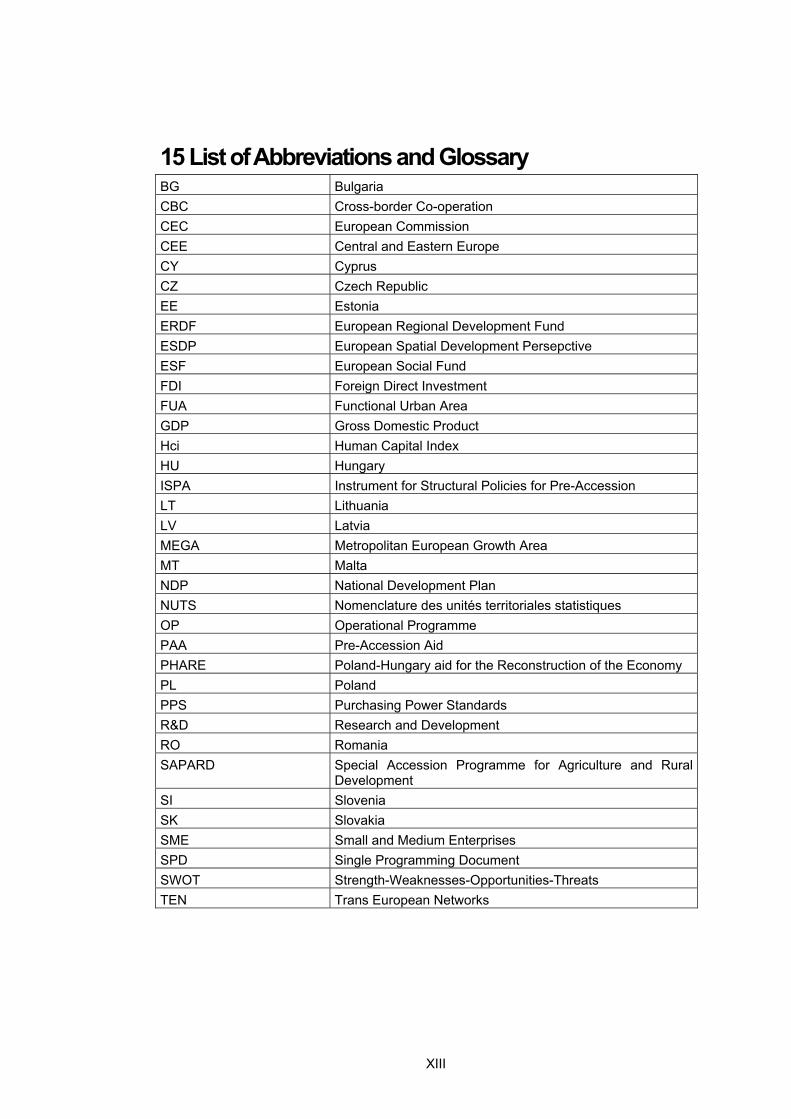
XIII
15 List of Abbreviations and Glossary BG Bulgaria CBC Cross-border Co-operation CEC European Commission CEE Central and Eastern Europe CY Cyprus CZ Czech Republic EE Estonia ERDF European Regional Development Fund ESDP European Spatial Development Persepctive ESF European Social Fund FDI Foreign Direct Investment FUA Functional Urban Area GDP Gross Domestic Product Hci Human Capital Index HU Hungary ISPA Instrument for Structural Policies for Pre-Accession LT Lithuania LV Latvia MEGA Metropolitan European Growth Area MT Malta NDP National Development Plan NUTS Nomenclature des unités territoriales statistiques OP Operational Programme PAA Pre-Accession Aid PHARE Poland-Hungary aid for the Reconstruction of the Economy PL Poland PPS Purchasing Power Standards R&D Research and Development RO Romania SAPARD Special Accession Programme for Agriculture and Rural
Development SI Slovenia SK Slovakia SME Small and Medium Enterprises SPD Single Programming Document SWOT Strength-Weaknesses-Opportunities-Threats TEN Trans European Networks

XIV
16 List of the TPG's Publications and Presentations Resulting from the Project's Research
For the Final Report this list will be updated, especially with the activities from all project partners. However, only presentations and publications outside the immediate activities of the ESPON project are listed.
16.1 Presentations
Kujath, Hans Joachim and Zillmer, Sabine (2003): Potenziale zur wirtschaftlichen Entwicklung Brandenburgs. Ergebnisse aus dem ESPON Projekt. Presentation at the Brandenburg State Ministry of Economics, Potsdam, 24 November
Kunkel, Kirsten and Zillmer, Sabine (2003): ESDP – Sind die Ziele der polyzentrischen Etnwicklung in Osteuropa realistisch?. Presentation held at the Conference of the German Society for Eastern Europe (Deutsche Gesellschaft für Osteuropakunde) at the IFL Leipzig 'Region und Regionalisierung im östlichen Europa – Konzepte, Prozesse und politische Strategien', Leipzig, 5/6 Dezember
Zillmer, Sabine (2004): Die Perspektiven der EU-Förderung in den Kandidatenländern und Ostdeutschland. Presentation at the ARL working group 'Chancen der EU-Osterweiterung für Ostdeutschland', Cottbus, 29 January
Kujath, Hans Joachim and Zillmer, Sabine (2004): Erfahrungen und Erwartungen aus der Sicht der transnationalen Projektgruppe bei der Durchführung des ESPON-Projekts 2.2.2. Presentation at information seminar at the BMVBW (German Ministry for Transport, Building and Housing), Berlin, 2 March
Zillmer, Sabine (2004): Erfahrungen und Erwartungen aus der Sicht der transnationalen Projektgruppe bei der Durchführung des ESPON-Projekts 2.2.2 – Räumliche Auswirkungen des 'Acquis Communitaire', der Vorbeitrittshilfen und der Phare Programme. Presentation at the BBR information seminar 'Wer forscht was?', Bonn, 24 March
Zillmer, Sabine (2004): Territorial Impact Assessment in der EU-Raumentwicklung. Presentation at Spring Workshop 'Stadt – Landschaft – Region – aktuelle Beispiele aus der Evaluationspraxis' of the Working Group 'Stadt- und Regionalentwicklung' of the DeGEval (German Society for Evaluation), Potsdam, 22/23 April
Kunkel, Kirsten (2004): Spatial Impacts of Pre-Accession Aid in Relation to ESDP Objectives. Presentation at international Conference on Research in Spatial Planning and Development in the Enlarged EU organised by SPECTRA and ARL, Bratislava, 24/25 June
Kujath, Hans Joachim and Zillmer, Sabine (2004): Development Potentials of Border Regions – Periphery or Core Regions in Transnational Networking? Presentation at international Conference 'The Regional Development of Ukraine in an International Context', Lviv, 24-29 June
16.2 Publications
Kunkel, Kirsten; McMaster, Irene and Zillmer, Sabine (2004): Regional Conditions in the Candidate Countries in Relation to ESDP Objectives. Working Paper, Erkner, Leibniz-Institut für Regionalentwicklung und Strukturplanung, 2004 (http://www.irs-net.de/download/ESDP.pdf)
Kujath, Hans Joachim and Zillmer, Sabine (2004): Chancen und Herausforderungen aus raumpolitischer Sicht. In: IRS aktuell, No.43, April, Erkner

XV
Kunkel, Kirsten and Zillmer, Sabine (2004): Zur Regionalstruktur der ostmitteleuropäischen Betrittsländer – Potenziale und Handlungserfordernisse. In: IRS aktuell, No.43, April, Erkner
Kunkel, Kirsten (2004): Slowenien – klein aber integrativ. In: IRS aktuell, No.43, April, Erkner

XVI
17 Indication of Performance Indicators Achieved Table 17-1: Number of performance indicators achieved
Number of spatial indicators employed in addition to priority 1:
- in total
covering
- the EU territory
- more than the EU territory
62
Number of spatial indicators applied:
- in total
covering
- the EU territory
- more than the EU territory
8
Number of EU maps produced 25
Number of Funds fully addressed 3
Number of charts on the institutional related to the Funds in their policy context
0
Number of ESDP policy aims mentioned in the ESDP reference addressed by Funds investigated
4

XVII
18 Maps, Graphs and Tables not Included in Part II of the Interim Report
18.1 Maps Map 18-1: Share of Pre-Accession Aid Addressing the Geographic Position, 1998-2000

XVIII
Map 18-2: Share of Pre-Accession Aid Addressing the Environmental Quality, 1998-2000

XIX
Map 18-3: Share of Pre-Accession Aid Addressing Human and Business Resources, 1998-2000

XX
Map 18-4: Share of Pre-Accession Aid Addressing the Geographic Position, 2001-2002
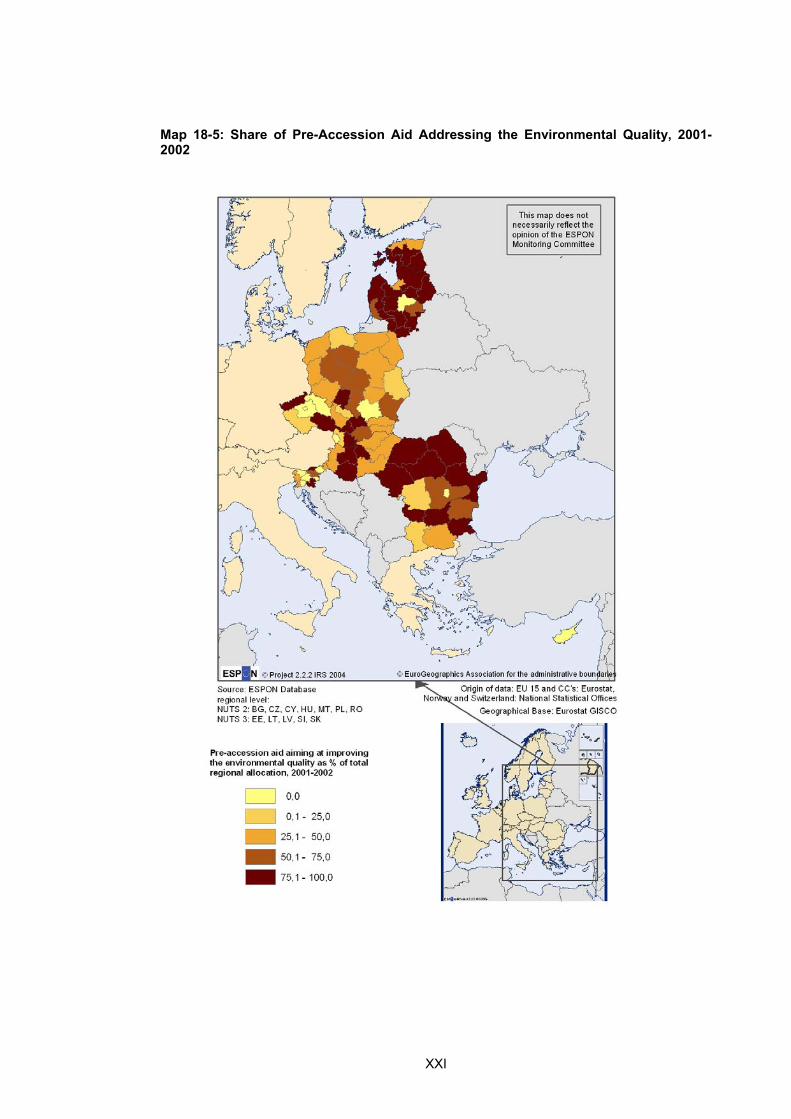
XXI
Map 18-5: Share of Pre-Accession Aid Addressing the Environmental Quality, 2001-2002

XXII
Map 18-6: Share of Pre-Accession Aid Addressing Human and Business Resources, 2001-2002
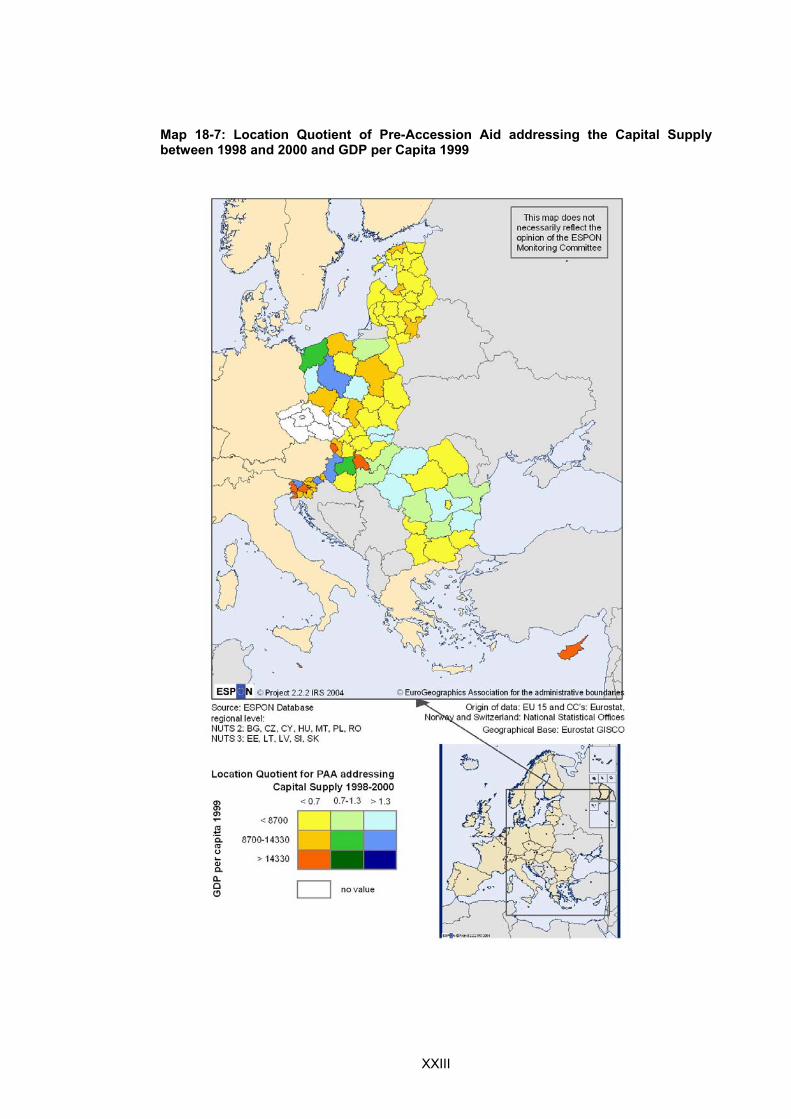
XXIII
Map 18-7: Location Quotient of Pre-Accession Aid addressing the Capital Supply between 1998 and 2000 and GDP per Capita 1999

XXIV
Map 18-8: Location Quotient of Pre-Accession Aid addressing the Regional Market Potential between 1998 and 2000 and Population Density 1998

XXV
Map 18-9: Location Quotient of Pre-Accession Aid addressing Urbanisation and Localisation Advantages between 1998 and 2000 and Share of Employment in Agriculture 1998

XXVI
Map 18-10: Location Quotient of Pre-Accession Aid addressing Urbanisation and Localisation Advantages between 1998 and 2000 and Share of Employment in Industry 1998

XXVII
Map 18-11: Location Quotient of Pre-Accession Aid addressing Urbanisation and Localisation Advantages between 1998 and 2000 and Share of Employment in Services 1998

XXVIII
Map 18-12: Location Quotient of Pre-Accession Aid addressing the Geographic Position between 1998 and 2000 and Multimodal Accessibility
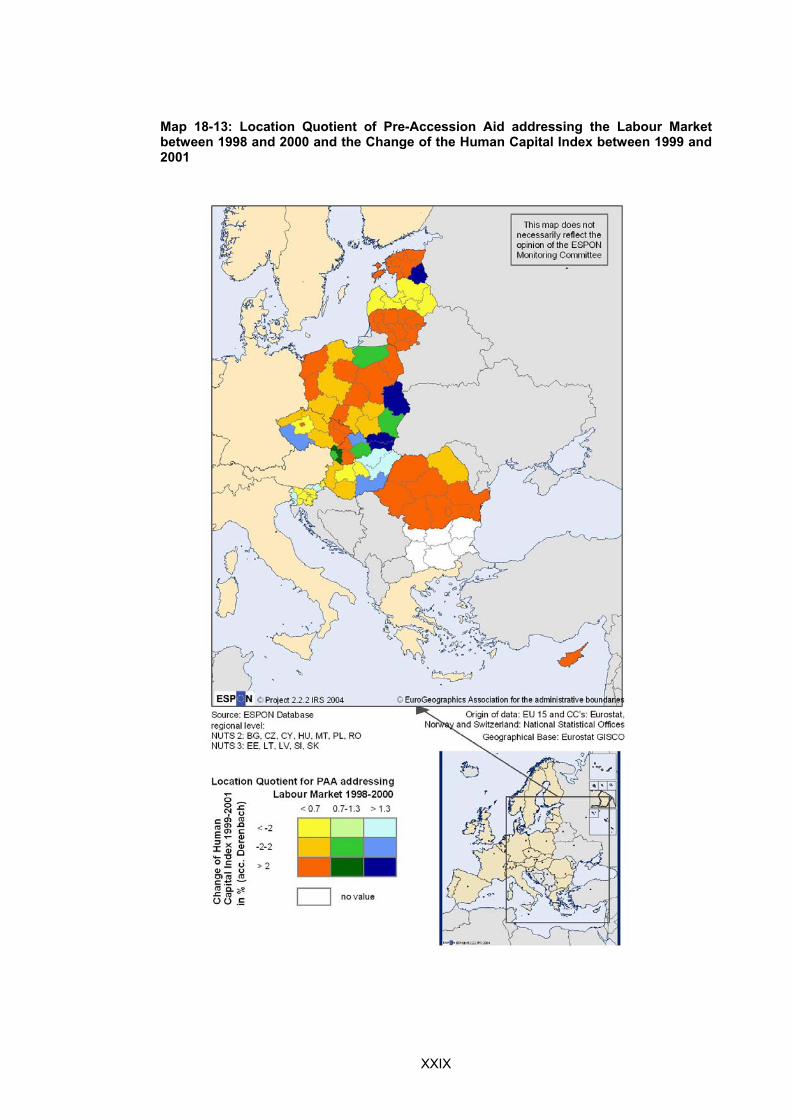
XXIX
Map 18-13: Location Quotient of Pre-Accession Aid addressing the Labour Market between 1998 and 2000 and the Change of the Human Capital Index between 1999 and 2001
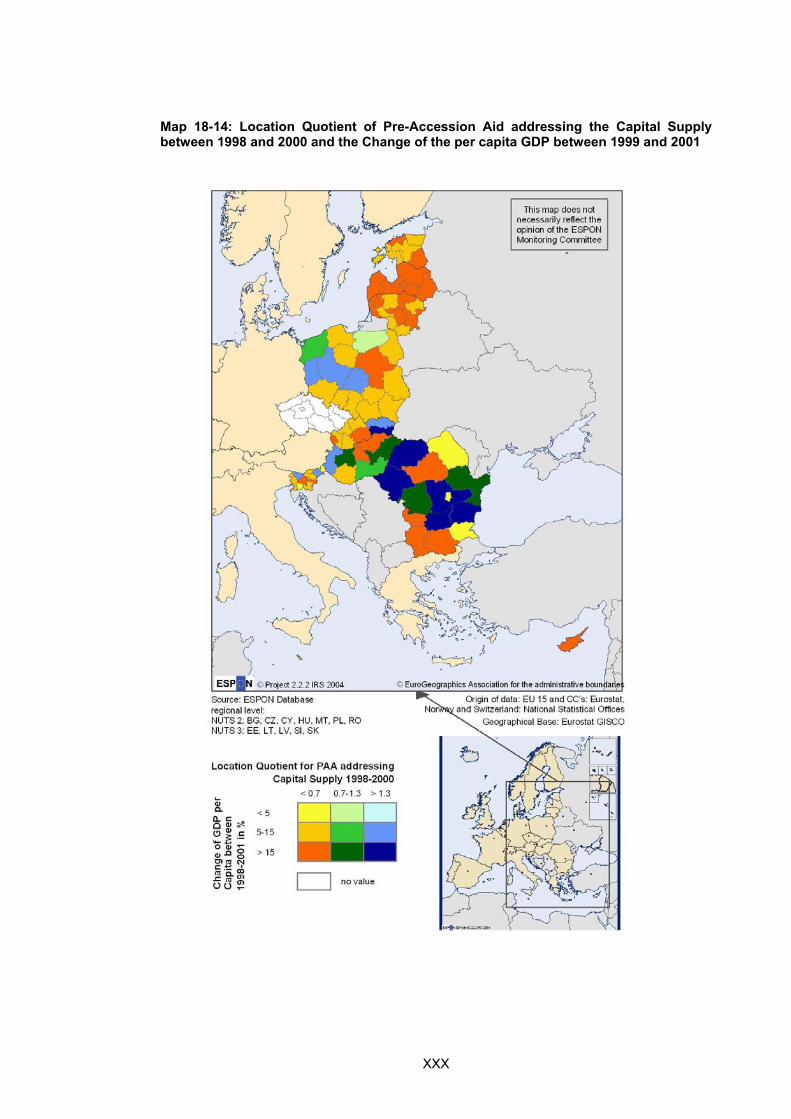
XXX
Map 18-14: Location Quotient of Pre-Accession Aid addressing the Capital Supply between 1998 and 2000 and the Change of the per capita GDP between 1999 and 2001

XXXI
Map 18-15: Location Quotient of Pre-Accession Aid addressing the Regional Market Potential between 1998 and 2000 and the Change of the Population Density between 1998 and 2001

XXXII
Map 18-16: Location Quotient of Pre-Accession Aid addressing Urbanisation and Localisation Advantages between 1998 and 2000 and the Change of the Agricultural Sector Employment Share between 1998 and 2001

XXXIII
Map 18-17: Location Quotient of Pre-Accession Aid addressing Urbanisation and Localisation Advantages between 1998 and 2000 and the Change of the Industrial Sector Employment Share between 1998 and 2001
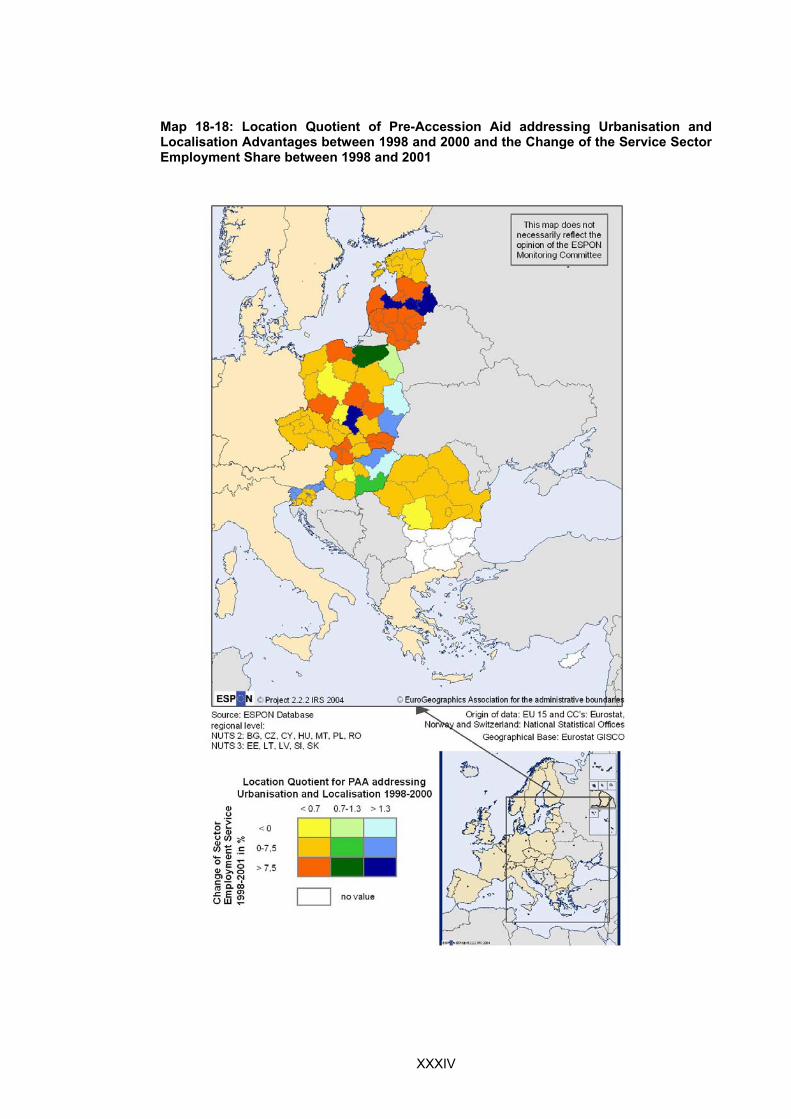
XXXIV
Map 18-18: Location Quotient of Pre-Accession Aid addressing Urbanisation and Localisation Advantages between 1998 and 2000 and the Change of the Service Sector Employment Share between 1998 and 2001

XXXV
18.2 Charts Chart 18-1: GDP per Capita 1999 related to (a) Location Quotient of Pre-Accession Aid addressing the Capital Supply between 1998 and 2000 and (b) % of Pre-Accession Aid addressing the Capital Supply as Share of Total Regional Pre-Accession Aid between 1998 and 2000
0
2
4
6
8
10
12
14
0 5000 10000 15000 20000 25000GDP per inhabitant 1999
Loca
tion
Quo
tient
for P
AA
add
ress
ing
Cap
ital S
uppl
y
BGCZHUEELTLVPLROSISK
0
10
20
30
40
50
60
0 5000 10000 15000 20000 25000GDP per inhabitant 1999
% P
AA
add
ress
ing
Cap
ital S
uppl
y of
tota
l Reg
iona
l PA
A
BGCZHUEELTLVPLROSISK
Source: IRS calculation, ESPON Database

XXXVI
Chart 18-2: Population Density 1998 related to (a) Location Quotient of Pre-Accession Aid addressing the Regional Market Potential between 1998 and 2000 and (b) % of Pre-Accession Aid addressing the Regional Market Potential as Share of Total Regional Pre-Accession Aid between 1998 and 2000
0
10
20
30
40
50
60
0 100 200 300 400 500Population Density 1998(except Prague and Bucaresti)
Loca
tion
Quo
tient
for P
AA
adr
essi
ng R
egio
naM
arke
t(no
valu
es fo
EE a
nd R
O)
BGCZHULTLVPLSISK
0
10
20
30
40
50
0 100 200 300 400 500Population Density 1998 (except Prague and Bucaresti)
% P
AA
add
ress
ing
Reg
iona
l Mar
ket o
f tot
al R
eion
al P
AA
BGCZHUEELTLVPLROSISK
Source: IRS calculation, ESPON Database

XXXVII
Chart 18-3: Share of Employment in Agriculture 1998 related to (a) Location Quotient of Pre-Accession Aid addressing Urbanisation and Localisation Advantages between 1998 and 2000 and (b) % of Pre-Accession Aid addressing Urbanisation and Localisation Advantages as Share of Total Regional Pre-Accession Aid between 1998 and 2000
0
2
4
6
8
10
12
0,00 10,00 20,00 30,00 40,00 50,00 60,00Sector Employment Arg 1998(no values for BG)
LOca
tion
Quo
tient
for P
AA
adr
essi
ng L
ocal
isat
ion
and
Urb
anis
atio
n(no
val
ues
for C
Z)
HUEELTLVPLROSISK
0
10
20
30
40
50
60
70
80
90
0,00 10,00 20,00 30,00 40,00 50,00 60,00Sector Employment Arg 1998
% P
AA
add
ress
ing
Urb
anis
atio
n an
d Lo
calis
atio
n of
tota
l R
egio
nal P
AA
HUEELTLVPLROSISKCZ
Source: IRS calculation, ESPON Database

XXXVIII
Chart 18-4: Share of Employment in Industry 1998 related to (a) Location Quotient of Pre-Accession Aid addressing Urbanisation and Localisation Advantages between 1998 and 2000 and (b) % of Pre-Accession Aid addressing Urbanisation and Localisation Advantages as Share of Total Regional Pre-Accession Aid between 1998 and 2000
0
2
4
6
8
10
12
0,00 10,00 20,00 30,00 40,00 50,00 60,00Sector Employment Industry 1998(no values for BG)
LOca
tion
Quo
tient
for P
AA
adr
essi
ng L
ocal
isat
ion
and
Urb
anis
atio
n(no
val
ues
for C
Z)
HUEELTLVPLROSISK
0
10
20
30
40
50
60
70
80
90
0,00 10,00 20,00 30,00 40,00 50,00 60,00Sector Employment Ind 1998
% P
AA
add
ress
ing
Urb
anis
atio
n an
d Lo
calis
atio
n of
tota
l R
egio
nal P
AA
HUEELTLVPLROSISKCZ
Source: IRS calculation, ESPON Database

XXXIX
Chart 18-5: Share of Employment in Services 1998 related to (a) Location Quotient of Pre-Accession Aid addressing Urbanisation and Localisation Advantages between 1998 and 2000 and (b) % of Pre-Accession Aid addressing Urbanisation and Localisation Advantages as Share of Total Regional Pre-Accession Aid between 1998 and 2000
0
2
4
6
8
10
12
0,00 20,00 40,00 60,00 80,00Sector Employment Service 1998(no values for BG)
LOca
tion
Quo
tient
for P
AA
adr
essi
ng L
ocal
isat
ion
and
Urb
anis
atio
n(no
val
ues
for C
Z) HU
EE
LT
LV
PL
RO
SI
SK
0
10
20
30
40
50
60
70
80
90
0,00 20,00 40,00 60,00 80,00Sector Employment Ser 1998
% P
AA
add
ress
ing
Urb
anis
atio
n an
d Lo
calis
atio
n of
tota
l R
egio
nal P
AA
HUEELTLVPLROSISKCZ
Source: IRS calculation, ESPON Database

XL
Chart 18-6: Multimodal Accessiblity related to (a) Location Quotient of Pre-Accession Aid addressing the Geographic Position between 1998 and 2000 and (b) % of Pre-Accession Aid addressing the Geographic Position as Share of Total Regional Pre-Accession Aid between 1998 and 2000
0
0,5
1
1,5
2
2,5
3
3,5
4
4,5
0 1 2 3 4 5 6MultiModal Accessibility
Loca
l Quo
tient
for P
AA
add
ress
ing
geog
raph
ic p
ositi
on
BGCZHUEELTLVPLROSISK
0
20
40
60
80
100
120
0 1 2 3 4 5 6MultiModal Accessibility
% P
AA
add
ress
ing
Geo
grap
hic
Posi
tion
of to
tal R
egio
nal P
AA
BGCZHUEELTLVPLROSISK
Source: IRS calculation, ESPON Database

XLI
Chart 18-7: Change of the Human Capital Index between 1999 and 2001 related to (a) Location Quotient of Pre-Accession Aid addressing the Labour Market between 1998 and 2000 and (b) % of Pre-Accession Aid addressing the Labour Market as Share of Total Regional Pre-Accession Aid between 1998 and 2000
0
1
2
3
4
5
6
-2 -1,5 -1 -0,5 0 0,5 1 1,5 2
Change of HCI between 1999 and 2001
Loca
tion
Quo
tient
for P
AA
add
ress
ing
Labo
ur M
arke
t
CZHUEELTLVPLROSISK
0,00
5,00
10,00
15,00
20,00
25,00
30,00
-2 -1,5 -1 -0,5 0 0,5 1 1,5 2
Change of HCI between 1999 and 2001
% P
AA
add
ress
ing
Labo
ur M
arke
t of t
otal
Reg
iona
l P
AA
CZHUEELTLVPOROSISK
Source: IRS calculation, ESPON Database, Newcronos

XLII
Chart 18-8: Change of the per capita GDP between 1999 and 2001 related to (a) Location Quotient of Pre-Accession Aid addressing the Capital Supply between 1998 and 2000 and (b) % of Pre-Accession Aid addressing the Capital Supply as Share of Total Regional Pre-Accession Aid between 1998 and 2000
0
2
4
6
8
10
12
14
-20 -10 0 10 20 30 40 50Change(percentage) of GDP per inhabitant between 1999 and 2001
Loca
tion
Quo
tient
for P
AA
add
ress
ing
Cap
ital S
uppl
y
BGCZHUEELTLVPLROSISK
0
10
20
30
40
50
60
-20 -10 0 10 20 30 40 50Change of GDP per inhabitant between 1999 and 2001
% P
AA
add
ress
ing
Cap
ital S
uppl
y of
tota
l Reg
iona
l P
AA
BGCZHUEELTLVPLROSISK
Source: IRS calculation, ESPON Database, Newcronos

XLIII
Chart 18-9: Change of the Population Density between 1998 and 2001 related to (a) Location Quotient of Pre-Accession Aid addressing the Regional Market Potential between 1998 and 2000 and (b) % of Pre-Accession Aid addressing the Regional Market Potential as Share of Total Regional Pre-Accession Aid between 1998 and 2000
0
10
20
30
40
50
60
-20 -15 -10 -5 0 5Change of Population Density betwenn 1998 and 2001(except Prague)
Loca
tion
Quo
tient
for P
AA
adr
essi
ng R
eion
al M
arke
t(no
valu
es fo
r EE
and
RO
) BGCZHULTLVPLSISK
0
5
10
15
20
25
30
-10 -5 0 5Change of Population Density betwenn 1998 and 2001(except Prague)
% P
AA
add
ress
ing
Reg
iona
l Mar
ket o
f tot
al R
eion
BG
CZ
HU
EE
LT
LV
PL
RO
SI
SK
Source: IRS calculation, ESPON Database, Newcronos
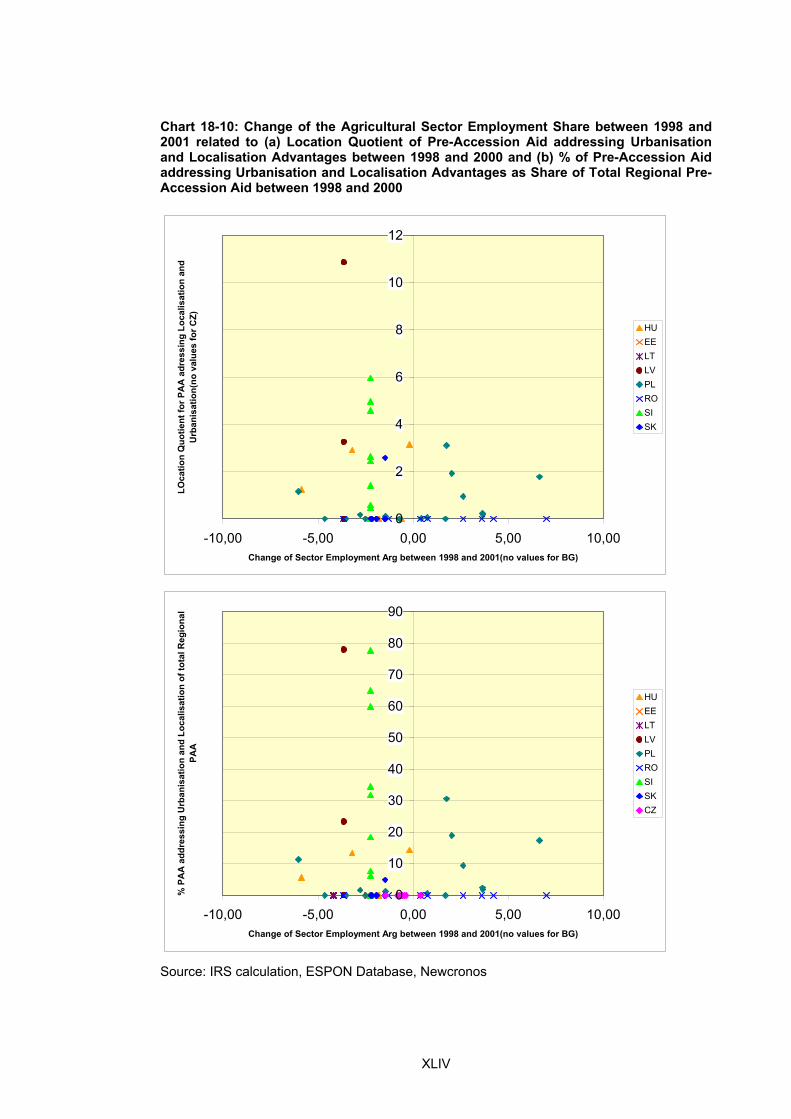
XLIV
Chart 18-10: Change of the Agricultural Sector Employment Share between 1998 and 2001 related to (a) Location Quotient of Pre-Accession Aid addressing Urbanisation and Localisation Advantages between 1998 and 2000 and (b) % of Pre-Accession Aid addressing Urbanisation and Localisation Advantages as Share of Total Regional Pre-Accession Aid between 1998 and 2000
0
2
4
6
8
10
12
-10,00 -5,00 0,00 5,00 10,00Change of Sector Employment Arg between 1998 and 2001(no values for BG)
LOca
tion
Quo
tient
for P
AA
adr
essi
ng L
ocal
isat
ion
and
Urb
anis
atio
n(no
val
ues
for C
Z)
HUEELTLVPLROSISK
0
10
20
30
40
50
60
70
80
90
-10,00 -5,00 0,00 5,00 10,00Change of Sector Employment Arg between 1998 and 2001(no values for BG)
% P
AA
add
ress
ing
Urb
anis
atio
n an
d Lo
calis
atio
n of
tota
l Reg
iona
l PA
A
HUEELTLVPLROSISKCZ
Source: IRS calculation, ESPON Database, Newcronos

XLV
Chart 18-11: Change of the Industrial Sector Employment Share between 1998 and 2001 related to (a) Location Quotient of Pre-Accession Aid addressing Urbanisation and Localisation Advantages between 1998 and 2000 and (b) % of Pre-Accession Aid addressing Urbanisation and Localisation Advantages as Share of Total Regional Pre-Accession Aid between 1998 and 2000
0
2
4
6
8
10
12
-8,00 -6,00 -4,00 -2,00 0,00 2,00 4,00 6,00Change of Sector Employment Industry between 1998 and 2001(no values for BG)
LOca
tion
Quo
tient
for P
AA
adr
essi
ng L
ocal
isat
ion
and
Urb
anis
atio
n(no
val
ues
for C
Z)
HUEELTLVPLROSISK
0
10
20
30
40
50
60
70
80
90
-8,00 -6,00 -4,00 -2,00 0,00 2,00 4,00 6,00Change of Sector Employment Ind between 1998 and 2001(no values for BG)
% P
AA
add
ress
ing
Urb
anis
atio
n an
d Lo
calis
atio
n of
tota
l Reg
iona
l PA
A
HUEELTLVPLROSISKCZ
Source: IRS calculation, ESPON Database, Newcronos

XLVI
Chart 18-12: Change of the Service Sector Employment Share between 1998 and 2001 related to (a) Location Quotient of Pre-Accession Aid addressing Urbanisation and Localisation Advantages between 1998 and 2000 and (b) % of Pre-Accession Aid addressing Urbanisation and Localisation Advantages as Share of Total Regional Pre-Accession Aid between 1998 and 2000
0
2
4
6
8
10
12
-5,00 0,00 5,00 10,00Change of Sector Employment Service between 1998 and 2001(no values for
BG)
LOca
tion
Quo
tient
for P
AA
adr
essi
ng L
ocal
isat
ion
and
Urb
anis
atio
n(no
val
ues
for C
Z) HU
EE
LT
LV
PL
RO
SI
SK
0
10
20
30
40
50
60
70
80
90
-6,00 -4,00 -2,00 0,00 2,00 4,00 6,00 8,00Change of Sector Employment Ser between 1998 and 2001(no values for BG)
% P
AA
add
ress
ing
Urb
anis
atio
n an
d Lo
calis
atio
n of
tota
l Reg
iona
l PA
A
HUEELTLVPLROSISKCZ
Source: IRS calculation, ESPON Database, Newcronos

XLVII
Chart 18-13: Change of GDP per Capita (PPS) between 1998 and 2001 related to the Regional Pre-accession Aid Share of National Pre-accession Aid in Percentage for Estonia
Estonia
0
2000
4000
6000
8000
10000
12000
14000
16000
0 5 10 15 20 25 30
% regional PAA of national PAA
GD
P/c
apita
PP
S
19982001Potenziell (1998)Potenziell (2001)
Source: IRS calculation, ESPON Database
Chart 18-14: Change of GDP per Capita (PPS) between 1998 and 2001 related to the Regional Pre-accession Aid Share of National Pre-accession Aid in Percentage for Hungary
Hungary
0
2000
4000
6000
8000
10000
12000
14000
16000
18000
20000
0 2 4 6 8 10 12
% regional PAA of national PAA
GD
P/c
apita
PP
S
1998
2001
Potenziell(1998)Potenziell(2001)
Source: IRS calculation, ESPON Database

XLVIII
Chart 18-15: Change of GDP per Capita (PPS) between 1998 and 2001 related to the Regional Pre-accession Aid Share of National Pre-accession Aid in Percentage for Lithuania
Lithuania
0
2000
4000
6000
8000
10000
12000
14000
0 2 4 6 8 10 12
% regional PAA of national PAA
GD
P/c
apita
PP
S
1998
2001
Exponentiell(1998)Exponentiell(2001)
Source: IRS calculation, ESPON Database
Chart 18-16: Change of GDP per Capita (PPS) between 1998 and 2001 related to the Regional Pre-accession Aid Share of National Pre-accession Aid in Percentage for Latvia
Latvia
0
2000
4000
6000
8000
10000
12000
14000
0 2 4 6 8 10 12 14
% regional PAA of national PAA
GD
P/c
apita
PP
S
1998
2001
Potenziell(2001)Potenziell(1998)
Source: IRS calculation, ESPON Database
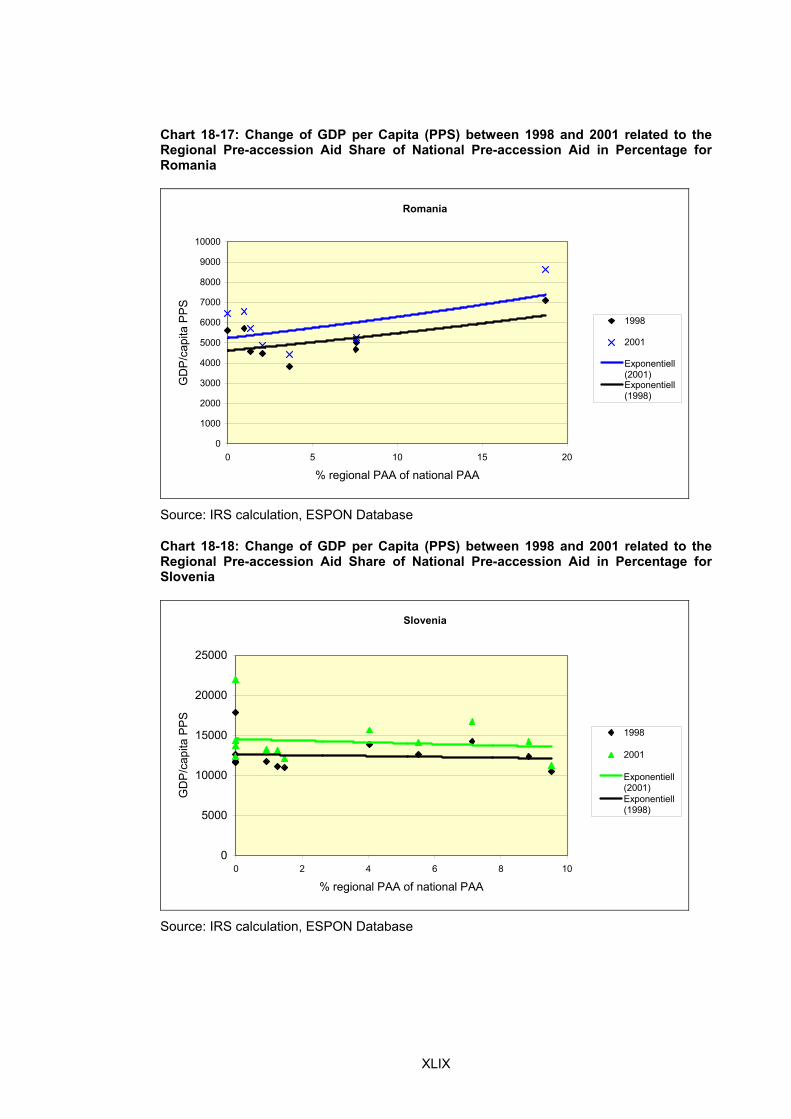
XLIX
Chart 18-17: Change of GDP per Capita (PPS) between 1998 and 2001 related to the Regional Pre-accession Aid Share of National Pre-accession Aid in Percentage for Romania
Romania
0
1000
2000
3000
4000
5000
6000
7000
8000
9000
10000
0 5 10 15 20
% regional PAA of national PAA
GD
P/c
apita
PP
S
1998
2001
Exponentiell(2001)Exponentiell(1998)
Source: IRS calculation, ESPON Database
Chart 18-18: Change of GDP per Capita (PPS) between 1998 and 2001 related to the Regional Pre-accession Aid Share of National Pre-accession Aid in Percentage for Slovenia
Slovenia
0
5000
10000
15000
20000
25000
0 2 4 6 8 10
% regional PAA of national PAA
GD
P/c
apita
PP
S
1998
2001
Exponentiell(2001)Exponentiell(1998)
Source: IRS calculation, ESPON Database

L
Chart 18-19: Change of GDP per Capita (PPS) between 1998 and 2001 related to the Regional Pre-accession Aid Share of National Pre-accession Aid in Percentage for Slovakia
Slovakia
0
5000
10000
15000
20000
25000
30000
0 2 4 6 8 10 12
% regional PAA of national PAA
GD
P/c
apita
PP
S
1998
2001
Exponentiell(2001)Exponentiell(1998)
Source: IRS calculation, ESPON Database
Chart 18-20: Percentage of Regional Pre-accession Aid Spending between 1998 and 2000 as Share of National Pre-accession Aid in Relation to Regional Unemployment Rate in 1999
0
5
10
15
20
25
0 5 10 15 20 25 30
% PAA in region of national PAA
Une
mpl
oym
entra
te 1
999 CZ
HUEELTLVPLROSK
Source: IRS calculation, ESPON Database

LI
Chart 18-21: Change Unemployment Rates between 1999 and 2002 related to the Regional Pre-accession Aid Share of National Pre-accession Aid in Percentage for the Czech Republic
Czech Republic
0
2
4
6
8
10
12
14
16
0 2 4 6 8 10 12 14 16 18 20
% regional PAA of national PAA
Une
mpl
oym
entra
te
1999
2002
Potenziell(2002)Potenziell(1999)
Source: IRS calculation, ESPON Database, Newcronos
Chart 18-22: Change Unemployment Rates between 1999 and 2002 related to the Regional Pre-accession Aid Share of National Pre-accession Aid in Percentage for Hungary
Hungary
0
5
10
15
20
25
0 2 4 6 8 10 12
% regional PAA of national PAA
Une
mpl
oym
entra
te
1999
2002
Potenziell (2002)Potenziell (1999)
Source: IRS calculation, ESPON Database, Newcronos

LII
Chart 18-23: Change Unemployment Rates between 1999 and 2002 related to the Regional Pre-accession Aid Share of National Pre-accession Aid in Percentage for Lithuania
Lithuania
0
5
10
15
20
25
0 2 4 6 8 10 12
% regional PAA of national PAA
Une
mpl
oym
entra
te
1999
2002
Exponentiell (2002)Exponentiell (1999)
Source: IRS calculation, ESPON Database, Newcronos
Chart 18-24: Change Unemployment Rates between 1999 and 2002 related to the Regional Pre-accession Aid Share of National Pre-accession Aid in Percentage for Poland
Poland
0
5
10
15
20
25
30
0 2 4 6 8 10 12 14
% regional PAA of national PAA
Une
mpl
oym
entra
te
1999
2002
Potenziell(1999)Potenziell(2002)
Source: IRS calculation, ESPON Database, Newcronos

LIII
Chart 18-25: Change Unemployment Rates between 1999 and 2002 related to the Regional Pre-accession Aid Share of National Pre-accession Aid in Percentage for Slovakia
Slovakia
0
5
10
15
20
25
30
0 2 4 6 8 10 12
% regional PAA of national PAA
Une
mpl
oym
entra
te
1999
2002
Potenziell(2002)Potenziell(1999)
Source: IRS calculation, ESPON Database, Newcronos

LIV
18.3 Tables Table 18-1: Overview on policy data included in the database established by ESPON project 2.2.2
Country NUTS-level period definition source problems
BG NUTS 2 1998-2003
1998-2003: programme information, year of approval, amount allocated
PHARE programme homepage**
only programme information, project implementation and disbursement up to 4 years after approval, information on location of implementation not complete
CZ NUTS 2/3 1992-2002project information, indicative allocations
EC Delegation in Czech Republic
NUTS 2 level only in place since 2000, NUTS 3 level since 2001 -> regional breakdown problematic
EE NUTS 3 1993-2003
1993-1998: operational programmes, year of approval, amount allocated; 1999-2003: project information, year of approval, amount allocated
1993-1998: PHARE programme search facility*; 1999-2003: EC Delegation in Estonia
only programme information for hte period 1993-1998, project implementation and disbursement up to 4 years after approval, information on location of implementation not complete
HU NUTS 2/3 1998-2003
programme information, year of approval, amount allocated
PHARE programme homepage**
only programme information, project implementation and disbursement up to 4 years after approval, information on location of implementation not complete
LT NUTS 3 1994-2002
1993-1998: operational programmes, year of approval, amount allocated; 1999-2003: programme information, year of approval, amount allocated
1993-1998: PHARE programme search facility*; 1999-2002: Ministry of Finance
only programme information, project implementation and disbursement up to 4 years after approval, information on location of implementation not complete
LV NUTS 3 1993-2002
1993-1997 operational programmes, year of approval, amount allocated, 1998-2002: project information, year of project start, amount allocated
1993-1998: PHARE programme search facility*; 1998-2002: Ministry of Finance
several projects run over more than one year, allocated amount not necessarily disbursed
PL NUTS 2 1991-2003
project information, year of approval, amount allocated
Delegation of the European Commission in Poland
NUTS 2 level only in place since 1998 -> regional breakdown problematic
RO NUTS2/3 1998-2003
programme information, year of approval, amount allocated
PHARE programme homepage**
only programme information on Nuts 0 level, project implementation and disbursement up to 4 years after approval. Programmes on economic and social cohesion, which are mostly located in specific regions could not be regionalised but are assigned to NUTS 0-level.
SI NUTS 2/3 1998-2002
programme information, year of approval, amount allocated
PHARE programme homepage**
only programme information, project implementation and disbursement up to 4 years after approval, information on location of implementation not complete
SK NUTS 2/3 1997-2002
programme information, year of approval, amount allocated
1997: Slovak Republic Government office: http://www.vlada.gov.sk/english/; 1998-2002: PHARE programme homepage**
only programme information, project implementation and disbursement up to 4 years after approval, information on location of implementation not complete
PHARE
* PHARE programme search facility: http://www.europa.eu.int/phare-cgi/plsql/prog.search
** PHARE programme homepage: http://europa.eu.int/comm/enlargement/pas/phare/

LV
Country NUTS-level period definition source problems
BG NUTS 2 1994-2002
programme information, year of approval, amount allocated
1998-2002: PHARE programme homepage**
only programme information, project implementation and disbursement up to 4 years after approval, information on location of implementation not complete
CZ NUTS 2/3 1994-2002project information, indicative allocations
EC Delegation in Czech Republic
NUTS 2 level only in place since 2000, NUTS 3 level since 2001 -> regional breakdown problematic
EE NUTS 3 1994-2002
1993-1998: operational programmes, year of approval, amount allocated; 1999-2003: programme information, year of approval, amount allocated
1993-1998: PHARE programme search facility*; 1999-2003: EC Delegation in Estonia
only programme information, project implementation and disbursement up to 4 years after approval, information on location of implementation not complete
HU NUTS 2/3 1994-2002
1994-2002: programme information, year of approval, amount allocated
1993-1997: PHARE programme search facility*; 1998-2002: PHARE programme homepage**
only programme information, project implementation and disbursement up to 4 years after approval
LT NUTS 3 1994-2002
1993-1998: operational programmes, year of approval, amount allocated; 1999-2003: programme information, year of approval, amount allocated
1993-1998: PHARE programme search facility*; 1999-2002: Ministry of Finance
only programme information, project implementation and disbursement up to 4 years after approval
LV NUTS 3 1994-2002
1994-1997 operational programmes, year of approval, amount allocated, 1998-2002: project information, year of project start, amount allocated
1994-1998: PHARE programme search facility*; 1998-2002: Ministry of Finance
several projects run over more than one year, allocated amount not necessarily disbursed
PL NUTS 2 1994-2003project information, year of approval, amount allocated
Delegation of the European Commission in Poland
NUTS 2 level only in place since 1998 -> regional breakdown problematic
RO NUTS2/3 1999-2002
programme information, year of approval, amount allocated
PHARE programme homepage
only programme information, project implementation and disbursement up to 4 years after approval, information on location of implementation not complete
SI NUTS 2/3 1994-2002
1994-1999 project information, year of approval. amount allocated, 2000-2002 programme information, year of approval, amount allocated
1994-1999 Government Office for European Affairs, 2000-2002 PHARE programme homepage**
for 2000-2002 only programme information, project implementation and disbursement up to 4 years after approval, information on location of implementation not complete
SK NUTS 2/3 1998-2002
programme information, year of approval, amount allocated
PHARE programme homepage**
only programme information, project implementation and disbursement up to 4 years after approval, information on location of implementation not complete
PHARE CBC
* PHARE programme search facility: http://www.europa.eu.int/phare-cgi/plsql/prog.search
** PHARE programme homepage: http://europa.eu.int/comm/enlargement/pas/phare/

LVI
Country NUTS-level period definition source problems
BG NUTS 2
CZ NUTS 3 2001-2002
number of submitted projects per year on NUTS 2, indicative financial allocation only for 2001
Czech SAPARD Agency
no financial allocation for 2002, amounts for 2001 rather not reliable (submissions)
EE NUTS 3 2001-2003amount approved for year of contracting
Estonian Ministry of Agriculture
project implementation and disbursement not totaly in year of contracting
HU NUTS 2/3 2003 amount approved
LT NUTS 3 2000-2003amount approved per region for the total period Ministry of Agriculture no allocation per year
LV NUTS 3
PL NUTS 2 2003project information, year of allocation, amount allocated SAPARD Agency
RO NUTS 2/3
SI NUTS 2/3 -2003
projects approved per measure as in January 2004, amount allocated ECP Slovenia
no alloction per year, probably allocations before 2003
SK NUTS 2/3 -2003
projects approved as in october 2003, payments commited
Slovakian SAPARD Agency
no alloction per year, probably allocations before 2003
SAPARD
Country NUTS-level period definition source problems
BG NUTS 2 2000-2002ISPA budget per year of projects signed
DG Regio mini ISPA report 2000-2002 only indicative amount
CZ NUTS 3 2000-2002ISPA budget per year of projects signed
DG Regio mini ISPA report 2000-2002 only indicative amount
EE NUTS 3 2000-2003year of contracting, approved amount
Estonian Ministry of Finance
project implementation and disbursement not totaly in year of contracting
HU NUTS 2/3 2000-2002ISPA budget per year of projects signed
DG Regio mini ISPA report 2000-2002 only indicative amount
LT NUTS 3 2000-2002ISPA budget per year of projects signed
DG Regio mini ISPA report 2000-2002 only indicative amount
LV NUTS 3 2000-2002ISPA budget per year of projects signed
DG Regio mini ISPA report 2000-2002 only indicative amount
PL NUTS 2 2000-2002ISPA budget per year of projects signed
DG Regio mini ISPA report 2000-2002 only indicative amount
RO NUTS 2/3 2000-2002ISPA budget per year of projects signed
DG Regio mini ISPA report 2000-2002 only indicative amount
SI NUTS 2/3 2000-2002ISPA budget per year of projects signed
DG Regio mini ISPA report 2000-2002 only indicative amount
SK NUTS 2/3 2000-2002ISPA budget per year of projects signed
DG Regio mini ISPA report 2000-2002 only indicative amount
ISPA

LVII
Table 18-2: Availability and Sources of Potential Indicators
Indicator Source
Population Density Own calculation based on:
• Total Population – ESPON database 2.4 and New Cronos Updates July 2004, project 3.1
• Area – ESPON database 2.4., project 2.2.3
Active Population Density Own calculation based on
• Total Active Population – ESPON database 2.4. and New Cronos Updates July 2004, project 3.1
• Area – ESPON database 2.4., project 2.2.3
Share of employment in agriculture
Share of employment in industry
Share of employment in services
Own calculation based on :
• Employment by sector – New Cronos Updates July 2004, project 3.1
Human Capital Index Own calculation based on:
• Active population by education – New Cronos Updates, July 2004, project 3.1
Unemployment rate New Cronos Updates, July 2004, project 3.1
GDP per capita in PPS New Cronos Updates, July 2004, project 3.1
Typology Multimodal accessibility ESPON Database 2.4, project 2.1.1
Productivity Own calculation based on:
• GDP in Mio. €, New Cronos Updates, July 2004, project 3.1
• Employed persons, New Cronos Updates, July 2004, project 3.1
R&D spending as % of GDP not completely available yet for New Member States and Candidate Countries
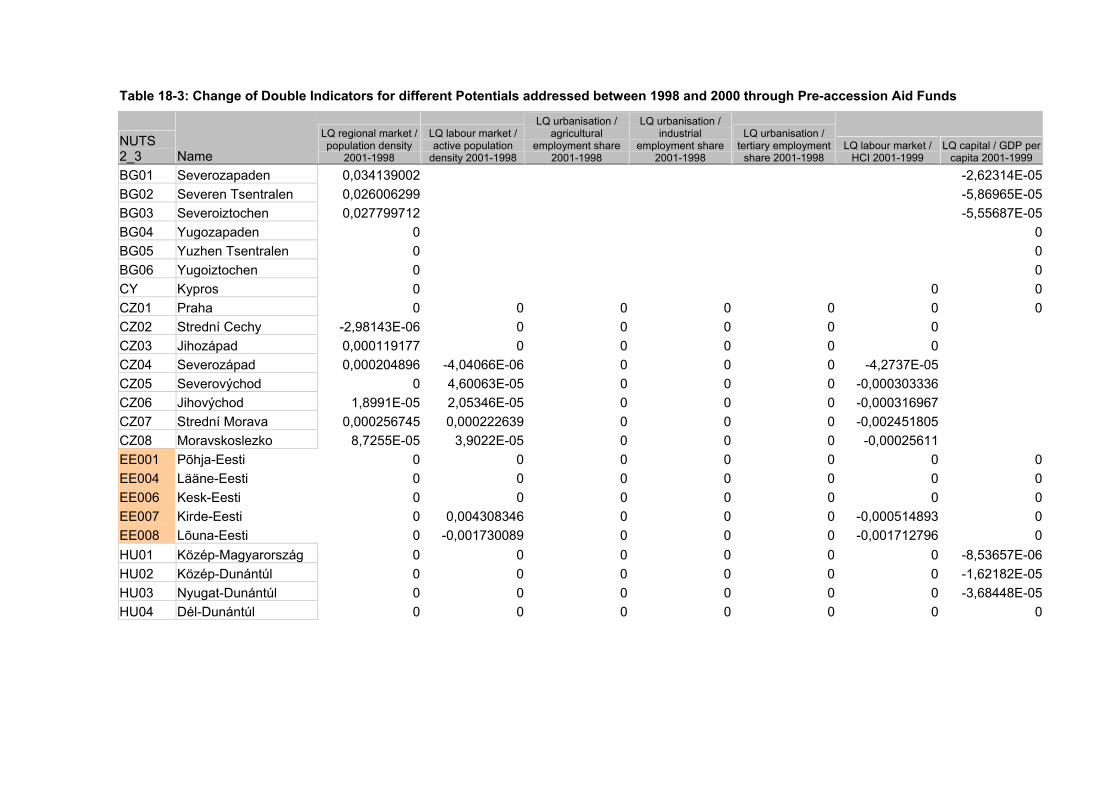
Table 18-3: Change of Double Indicators for different Potentials addressed between 1998 and 2000 through Pre-accession Aid Funds
NUTS 2_3 Name
LQ regional market / population density
2001-1998
LQ labour market / active population
density 2001-1998
LQ urbanisation / agricultural
employment share 2001-1998
LQ urbanisation / industrial
employment share 2001-1998
LQ urbanisation / tertiary employment
share 2001-1998 LQ labour market /
HCI 2001-1999 LQ capital / GDP per
capita 2001-1999
BG01 Severozapaden 0,034139002 -2,62314E-05 BG02 Severen Tsentralen 0,026006299 -5,86965E-05 BG03 Severoiztochen 0,027799712 -5,55687E-05 BG04 Yugozapaden 0 0 BG05 Yuzhen Tsentralen 0 0 BG06 Yugoiztochen 0 0 CY Kypros 0 0 0 CZ01 Praha 0 0 0 0 0 0 0 CZ02 Strední Cechy -2,98143E-06 0 0 0 0 0 CZ03 Jihozápad 0,000119177 0 0 0 0 0 CZ04 Severozápad 0,000204896 -4,04066E-06 0 0 0 -4,2737E-05 CZ05 Severovýchod 0 4,60063E-05 0 0 0 -0,000303336 CZ06 Jihovýchod 1,8991E-05 2,05346E-05 0 0 0 -0,000316967 CZ07 Strední Morava 0,000256745 0,000222639 0 0 0 -0,002451805 CZ08 Moravskoslezko 8,7255E-05 3,9022E-05 0 0 0 -0,00025611 EE001 Põhja-Eesti 0 0 0 0 0 0 0 EE004 Lääne-Eesti 0 0 0 0 0 0 0 EE006 Kesk-Eesti 0 0 0 0 0 0 0 EE007 Kirde-Eesti 0 0,004308346 0 0 0 -0,000514893 0 EE008 Lõuna-Eesti 0 -0,001730089 0 0 0 -0,001712796 0 HU01 Közép-Magyarország 0 0 0 0 0 0 -8,53657E-06 HU02 Közép-Dunántúl 0 0 0 0 0 0 -1,62182E-05 HU03 Nyugat-Dunántúl 0 0 0 0 0 0 -3,68448E-05 HU04 Dél-Dunántúl 0 0 0 0 0 0 0

HU05 Észak-Magyarország 0 0,000114243 0,024209326 0,001879509 -0,001164241 0,00685213 -1,41134E-05 HU06 Észak-Alföld 0 -0,001879794 0,131238402 -0,008713595 0,000230649 0,003059654 -2,10022E-05 HU07 Dél-Alföld 0 -0,000484787 0,043590413 -0,004244443 -0,000805361 0,00039288 -1,19004E-05 LT001 Alytaus (Apskritis) 0 0 0 0 0 0 0 LT002 Kauno (Apskritis) 0 0 0 0 0 0 0 LT003 Klaipedos (Apskritis) 0,002143649 0 0 0 0 0 0
LT004 Marijampoles (Apskritis) 0,004333791 0 0 0 0 0 0
LT005 Panevezio (Apskritis) 0 0 0 0 0 0 0 LT006 Siauliu (Apskritis) 0 0 0 0 0 0 0 LT007 Taurages (Apskritis) -0,008608815 0 0 0 0 0 0 LT008 Telsiu (Apskritis) 0 0 0 0 0 0 0 LT009 Utenos (Apskritis) 0,006246001 0 0 0 0 0 0 LT00A Vilniaus (Apskritis) 0 0 0 0 0 0 0 LV001 Riga 0 0,000233279 0 0 0 0,000900371 0 LV002 Vidzeme 0 0 0 0 0 0 0 LV003 Kurzeme 0,003274273 0 0 0 0 0 0 LV004 Zemgale 0 0 0,042171516 0,008572423 -0,005441606 0 0 LV005 Latgale 0 0 0,140609774 0,02858248 -0,018143596 0 0 MT Malta 0 0 0 PL01 Dolnoslaskie 2,61242E-06 0 -2,89601E-05 4,03012E-05 -1,48785E-05 0 -6,77692E-06 PL02 Kujawsko-Pomorskie 0 0 0 0 0 0 0 PL03 Lubelskie 1,52543E-05 -0,002484373 -0,002882836 0,003882725 0,001275273 -0,00499753 -2,28069E-06 PL04 Lubuskie 0 -0,000700743 0 0 0 -0,000582616 -1,86812E-05 PL05 Lódzkie 0 0 0 0 0 0 -4,39102E-05 PL06 Malopolskie 0 0 -0,001645233 0,001193137 -0,000177771 0 -1,43715E-06 PL07 Mazowieckie -1,17628E-07 -9,19627E-05 0,000227811 -3,83009E-05 -7,15758E-06 -2,71208E-06 PL08 Opolskie 0 0 -0,002002764 0,000397196 5,25936E-05 0 -1,70047E-06 PL09 Podkarpackie -0,00010765 8,06637E-05 -0,016410638 0,012352915 -0,000449795 -0,000626244 -1,29186E-06
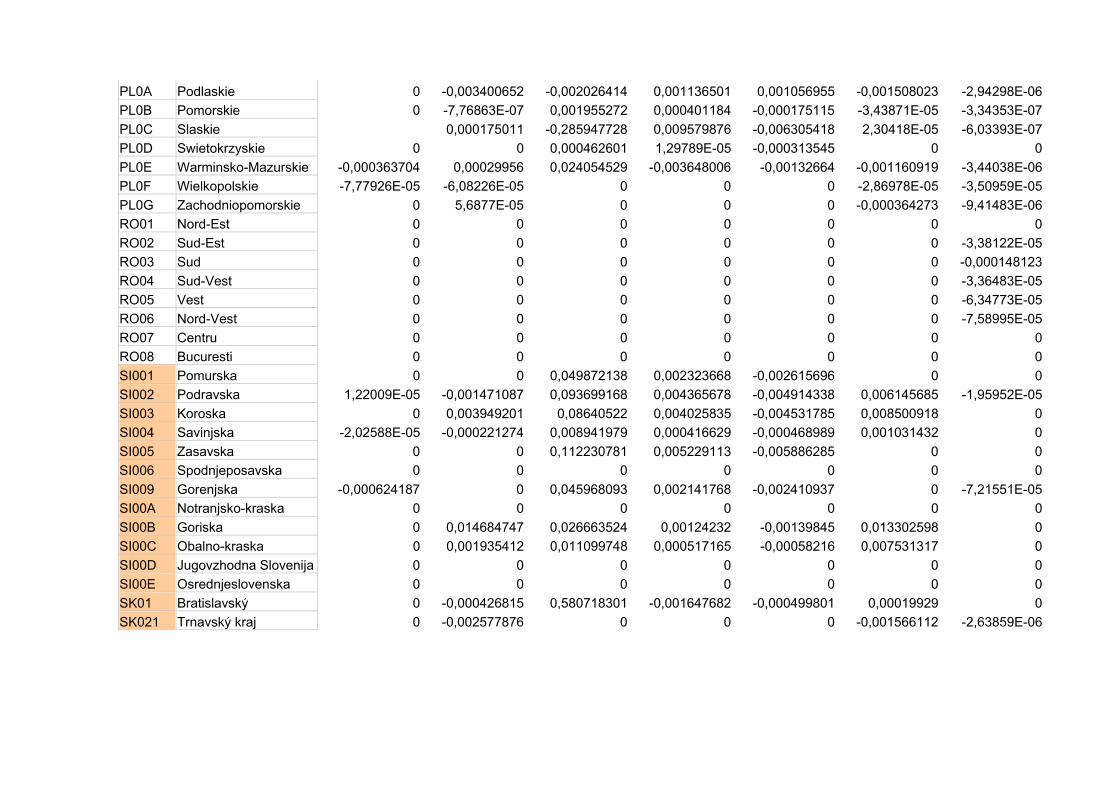
PL0A Podlaskie 0 -0,003400652 -0,002026414 0,001136501 0,001056955 -0,001508023 -2,94298E-06 PL0B Pomorskie 0 -7,76863E-07 0,001955272 0,000401184 -0,000175115 -3,43871E-05 -3,34353E-07 PL0C Slaskie 0,000175011 -0,285947728 0,009579876 -0,006305418 2,30418E-05 -6,03393E-07 PL0D Swietokrzyskie 0 0 0,000462601 1,29789E-05 -0,000313545 0 0 PL0E Warminsko-Mazurskie -0,000363704 0,00029956 0,024054529 -0,003648006 -0,00132664 -0,001160919 -3,44038E-06 PL0F Wielkopolskie -7,77926E-05 -6,08226E-05 0 0 0 -2,86978E-05 -3,50959E-05 PL0G Zachodniopomorskie 0 5,6877E-05 0 0 0 -0,000364273 -9,41483E-06 RO01 Nord-Est 0 0 0 0 0 0 0 RO02 Sud-Est 0 0 0 0 0 0 -3,38122E-05 RO03 Sud 0 0 0 0 0 0 -0,000148123 RO04 Sud-Vest 0 0 0 0 0 0 -3,36483E-05 RO05 Vest 0 0 0 0 0 0 -6,34773E-05 RO06 Nord-Vest 0 0 0 0 0 0 -7,58995E-05 RO07 Centru 0 0 0 0 0 0 0 RO08 Bucuresti 0 0 0 0 0 0 0 SI001 Pomurska 0 0 0,049872138 0,002323668 -0,002615696 0 0 SI002 Podravska 1,22009E-05 -0,001471087 0,093699168 0,004365678 -0,004914338 0,006145685 -1,95952E-05 SI003 Koroska 0 0,003949201 0,08640522 0,004025835 -0,004531785 0,008500918 0 SI004 Savinjska -2,02588E-05 -0,000221274 0,008941979 0,000416629 -0,000468989 0,001031432 0 SI005 Zasavska 0 0 0,112230781 0,005229113 -0,005886285 0 0 SI006 Spodnjeposavska 0 0 0 0 0 0 0 SI009 Gorenjska -0,000624187 0 0,045968093 0,002141768 -0,002410937 0 -7,21551E-05 SI00A Notranjsko-kraska 0 0 0 0 0 0 0 SI00B Goriska 0 0,014684747 0,026663524 0,00124232 -0,00139845 0,013302598 0 SI00C Obalno-kraska 0 0,001935412 0,011099748 0,000517165 -0,00058216 0,007531317 0 SI00D Jugovzhodna Slovenija 0 0 0 0 0 0 0 SI00E Osrednjeslovenska 0 0 0 0 0 0 0 SK01 Bratislavský 0 -0,000426815 0,580718301 -0,001647682 -0,000499801 0,00019929 0 SK021 Trnavský kraj 0 -0,002577876 0 0 0 -0,001566112 -2,63859E-06

SK022 Trencianský kraj 0 0 0 0 0 0 0 SK023 Nitrianský kraj 0 0 0 0 0 0 0 SK031 Zilinský kraj 0 -0,010771598 0 0 0 -0,002246531 0 SK032 Banskobystrický kraj 2,19499E-05 -0,005929944 0 0 0 -0,000572032 -6,93178E-06 SK041 Presovský kraj -0,000373283 -0,041496447 0 0 0 -0,007119061 -3,327E-05 SK042 Kosický kraj -0,000109858 -0,020926891 0 0 0 -0,005176086 -2,82207E-05
Source: IRS calculation, ESPON Database
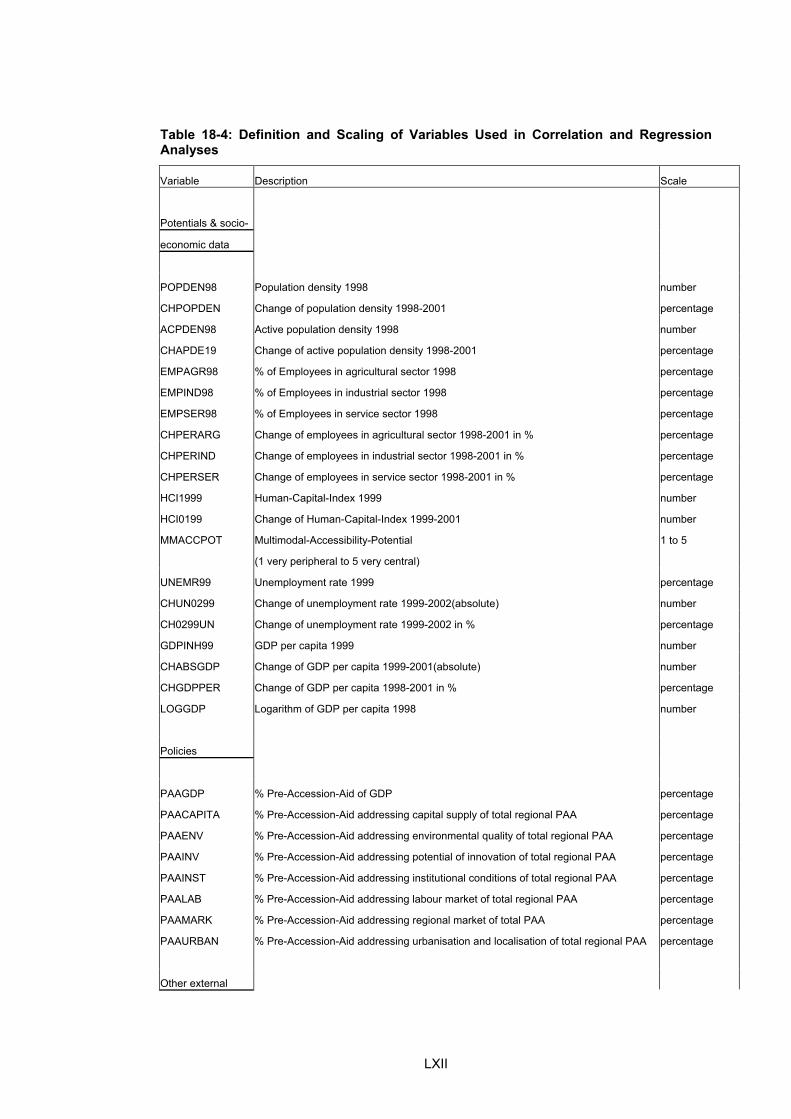
LXII
Table 18-4: Definition and Scaling of Variables Used in Correlation and Regression Analyses
Variable Description Scale
Potentials & socio-
economic data
POPDEN98 Population density 1998 number
CHPOPDEN Change of population density 1998-2001 percentage
ACPDEN98 Active population density 1998 number
CHAPDE19 Change of active population density 1998-2001 percentage
EMPAGR98 % of Employees in agricultural sector 1998 percentage
EMPIND98 % of Employees in industrial sector 1998 percentage
EMPSER98 % of Employees in service sector 1998 percentage
CHPERARG Change of employees in agricultural sector 1998-2001 in % percentage
CHPERIND Change of employees in industrial sector 1998-2001 in % percentage
CHPERSER Change of employees in service sector 1998-2001 in % percentage
HCI1999 Human-Capital-Index 1999 number
HCI0199 Change of Human-Capital-Index 1999-2001 number
MMACCPOT Multimodal-Accessibility-Potential 1 to 5
(1 very peripheral to 5 very central)
UNEMR99 Unemployment rate 1999 percentage
CHUN0299 Change of unemployment rate 1999-2002(absolute) number
CH0299UN Change of unemployment rate 1999-2002 in % percentage
GDPINH99 GDP per capita 1999 number
CHABSGDP Change of GDP per capita 1999-2001(absolute) number
CHGDPPER Change of GDP per capita 1998-2001 in % percentage
LOGGDP Logarithm of GDP per capita 1998 number
Policies
PAAGDP % Pre-Accession-Aid of GDP percentage
PAACAPITA % Pre-Accession-Aid addressing capital supply of total regional PAA percentage
PAAENV % Pre-Accession-Aid addressing environmental quality of total regional PAA percentage
PAAINV % Pre-Accession-Aid addressing potential of innovation of total regional PAA percentage
PAAINST % Pre-Accession-Aid addressing institutional conditions of total regional PAA percentage
PAALAB % Pre-Accession-Aid addressing labour market of total regional PAA percentage
PAAMARK % Pre-Accession-Aid addressing regional market of total PAA percentage
PAAURBAN % Pre-Accession-Aid addressing urbanisation and localisation of total regional PAA percentage
Other external

LXIII
influences
BORDER Western border region dummy (0 non-border region, 1 Western border region) 0, 1
CAPITAL Capital region dummy (0 non-captial region, 1 capital region) 0, 1
EE Country dummy for Estonia (1 for Estonia, 0 other countries) 0, 1
HU Country dummy for Hungaria (1 for Hungaria, 0 other countries) 0, 1
LT Country dummy for Lithuania (1 for Lithuania, 0 other countries) 0, 1
LV Country dummy for Latvia (1 for Latvia, 0 other countries) 0, 1
PL Country dummy for Poland (1 for Poland, 0 other countries) 0, 1
RO Country dummy for Romania (for Romania, 0 other countries) 0, 1
SK Country dummy for Slovakia (for Slovakia, 0 other countries) 0, 1
SI Country dummy for Slovenia (1 for Slovenia, 0 other countries) 0, 1
Table 18-5: Results of Bivariate Correlation Analyses for Total Pre-accession Aid and Potential Oriented Pre-accession Aid Allocation with Respect to Potential Indicators, Changes of Potential Indicators and the Initial Situation****
PAAGDP PAACAPITA PAAENV PAAPOS PAAINV PAAINST PAALAB PAAMARK PAAURBAN
POPDEN98 -0,045 -0,04 -0,106 0,109 -0,015 0,281 *** -0,092 -0,091 -0,038
CHPOPDEN 0,157 -0,131 0,318 *** -0,075 -0,108 -0,023 -0,375 *** -0,162 -0,027
ACPDEN98 -0,055 -0,044 -0,114 0,075 -0,003 0,316 *** -0,105 -0,076 -0,047
CHAPDE19 -0,167 0,252 ** -0,017 0,045 -0,004 -0,036 0,239 ** 0,071 -0,151
EMPAGR98 -0,003 -0,105 0,199 * -0,159 -0,124 0,096 -0,152 -0,068 -0,066
EMPIND98 -0,182 0,267 ** -0,187 * 0,016 0,184 -0,175 0,152 0,088 0,088
EMPSER98 0,141 -0,069 -0,112 0,19 * 0,018 0,01 0,077 0,02 0,018
CHPERIND 0,086 -0,103 0,016 0,008 0,011 -0,036 0,094 0,008 -0,017
CHPERSER -0,033 0,122 -0,017 -0,205 * -0,033 0,146 -0,061 0,168 0,002
HCI1999 0,252 ** -0,214 * 0,094 -0,092 -0,081 0,029 -0,107 0,231 ** -0,094
HCI0199 0,115 0,059 0,101 0,038 -0,099 0,215 * -0,143 0,18 -0,418 ***
UNEMR99 0,307 *** 0,311 *** -0,055 -0,101 0,062 -0,11 0,367 *** 0,09 0,186
CHUN0299 -0,066 0,134 -0,148 0,1 -0,145 0,165 -0,122 0,03 -0,122
GDPINH99 -0,282 ** 0,074 -0,263 ** 0,068 -0,018 0,169 -0,015 -0,194 * 0,107
CHGDPPER -0,007 -0,098 0,059 0,024 0,028 -0,087 0,079 0,043 0,061
MMACCPOT 0,292 *** -0,044 0,348 *** -0,265 ** -0,124 -0,103 0,002 0,159 -0,108
* Level of Signficance 1%, ** Level of Signficance 5%, *** Level of Signficance 10%
**** To reduce the number of columns and lines, only the relevant part of the correlation matrix has been produced rather than the whole upper or lower triangle matrix.
Source: IRS calculation, ESPON Database, Newcronos

LXIV
Table 18-6: Results of Bivariate Correlation Analyses for Changing Economic Performance in terms of GDP per Capita in PPS and Unemployment Rates with Respect to Total Pre-accession Aid Allocation, Potential Indicators, Changes of Potential Indicators and the Initial Situation****
CHUN0299 CH0299UN CHABSGDP CHGDPPER
POPDEN98 -0,042 -0,012 0,143 -0,123
CHPOPDEN -0,063 -0,004 0,031 0,077
ACPDEN98 -0,057 -0,03 0,142 -0,123
CHAPDE19 0,172 0,116 0,012 -0,082
EMPAGR98 0,181 0,283 ** -0,297 ** 0,079
EMPIND98 -0,094 -0,172 -0,033 -0,277 **
EMPSER98 -0,159 -0,231 * 0,404 *** 0,094
CHPERARG 0,159 0,183 -0,269 ** -0,083
CHPERIND -0,315 *** -0,372 *** 0,107 -0,039
CHPERSER 0,223 * 0,183 -0,062 0,015
HCI1999 -0,002 0,016 0,186 0,174
HCI0199 0,493 *** 0,501 *** -0,192 -0,02
PAAGDP -0,066 -0,001 -0,223 ** -0,007
UNEMR99 0,236 * 0,118 -0,266 ** -0,135
CH0299UN 0,956 *** 1 -0,259 ** -0,389 ***
GDPINH99 0,139 0,1 0,606 *** -0,22 **
CHGDPPER -0,453 *** -0,389 *** 0,556 *** 1
MMACCPOT 0,129 0,156 -0,43 *** 0,193 *
* Level of Signficance 1%, ** Level of Signficance 5%, *** Level of Signficance 10%
**** To reduce the number of columns and lines, only the relevant part of the correlation matrix has been produced rather than the whole upper or lower triangle matrix.
Source: IRS calculation, ESPON Database, Newcronos

LXV
Table 18-7: Preliminary Regression Analyses Results for the Change of Total and Percentage GDP per capita in PPS in the New Member States and Bulgaria and Romania****
Table
% change of GDP per capita log total change of GDP per capita
Coefficients Coefficients
(constant) 134,647 *** 89,754 3 **
MMACCPOT 2,132 1,562 1,70E-02
UNEMR99 -0,433 * -1,46E-02 *
PAAGDP -4,386 -5,897 * -0,153
HCI1999 -0,251 0,169 -4,55E-03
EMPARG98 -0,336 ** -5,51E-03
EMPIND98 -0,173 0,232 -6,00E-03
EMPSER98 0,424 *
ACPDEN98
POPDEN98 -8,87E-03 ** -9,57E-03 ** -3,01E-04 **
LOGGDP99 -27,509 *** -29,606 * 0,13
BORDER -4,93E-02 -0,152 -4,69E-03
CAPITAL 12,265 *** 12,686 ** 0,346 **
EE -4,059
HU 3,009
LT
LV 5,649
PL -0,538
RO 9,381
SI 3,705
SK 0,855
R2 0,384 0,45 0,416
F-Test 2,991 *** 2,663 *** 3,342 ***
N 87 87 87
* Level of Signficance 1%, ** Level of Signficance 5%, *** Level of Signficance 10%
**** The number of regions is based on the same differentiation between NUTS 2 and NUTS 3 regions as depicted in the maps of section 8. To avoid reduction of the data set included in the regressions by about one third, as of missing data for one or another variable, missing data have been excluded on the basis of coupled rather than data set exclusion.
Source: IRS calculation, ESPON Database, Newcronos
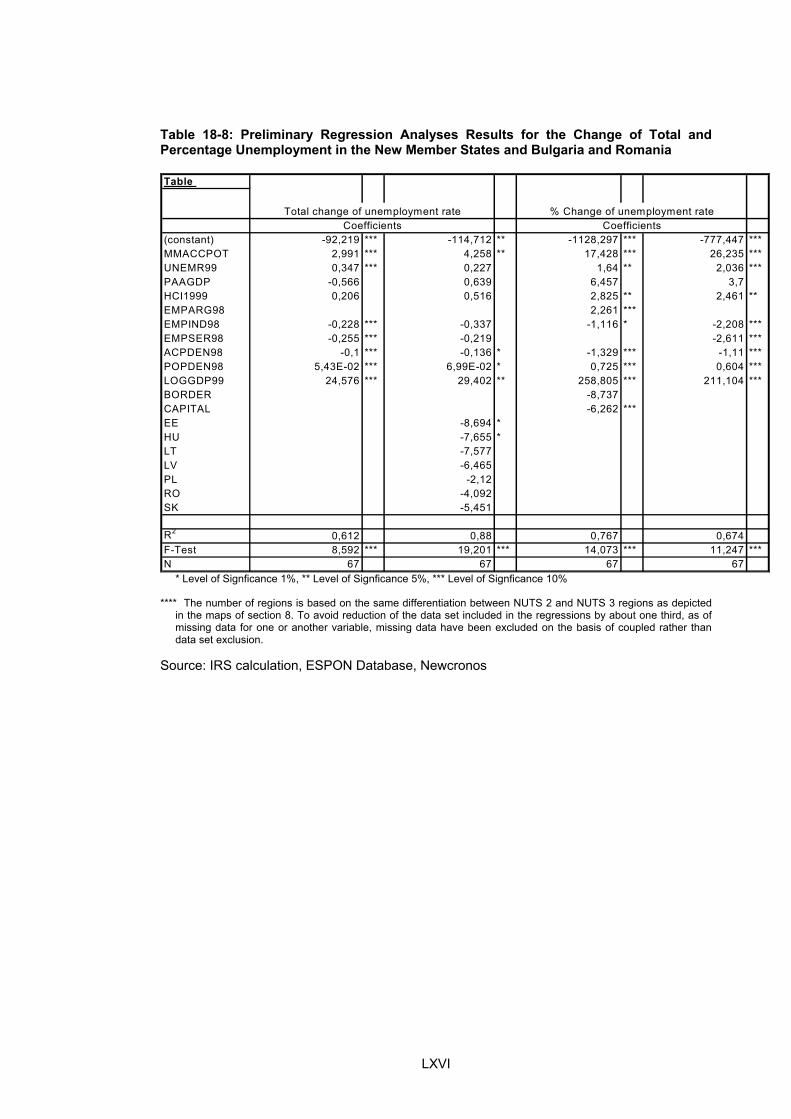
LXVI
Table 18-8: Preliminary Regression Analyses Results for the Change of Total and Percentage Unemployment in the New Member States and Bulgaria and Romania
Table
(constant) -92,219 *** -114,712 ** -1128,297 *** -777,447 ***MMACCPOT 2,991 *** 4,258 ** 17,428 *** 26,235 ***UNEMR99 0,347 *** 0,227 1,64 ** 2,036 ***PAAGDP -0,566 0,639 6,457 3,7HCI1999 0,206 0,516 2,825 ** 2,461 **EMPARG98 2,261 ***EMPIND98 -0,228 *** -0,337 -1,116 * -2,208 ***EMPSER98 -0,255 *** -0,219 -2,611 ***ACPDEN98 -0,1 *** -0,136 * -1,329 *** -1,11 ***POPDEN98 5,43E-02 *** 6,99E-02 * 0,725 *** 0,604 ***LOGGDP99 24,576 *** 29,402 ** 258,805 *** 211,104 ***BORDER -8,737CAPITAL -6,262 ***EE -8,694 *HU -7,655 *LT -7,577LV -6,465PL -2,12RO -4,092SK -5,451
R2 0,612 0,88 0,767 0,674F-Test 8,592 *** 19,201 *** 14,073 *** 11,247 ***N 67 67 67 67
Coefficients Coefficients% Change of unemployment rateTotal change of unemployment rate
* Level of Signficance 1%, ** Level of Signficance 5%, *** Level of Signficance 10%
**** The number of regions is based on the same differentiation between NUTS 2 and NUTS 3 regions as depicted in the maps of section 8. To avoid reduction of the data set included in the regressions by about one third, as of missing data for one or another variable, missing data have been excluded on the basis of coupled rather than data set exclusion.
Source: IRS calculation, ESPON Database, Newcronos
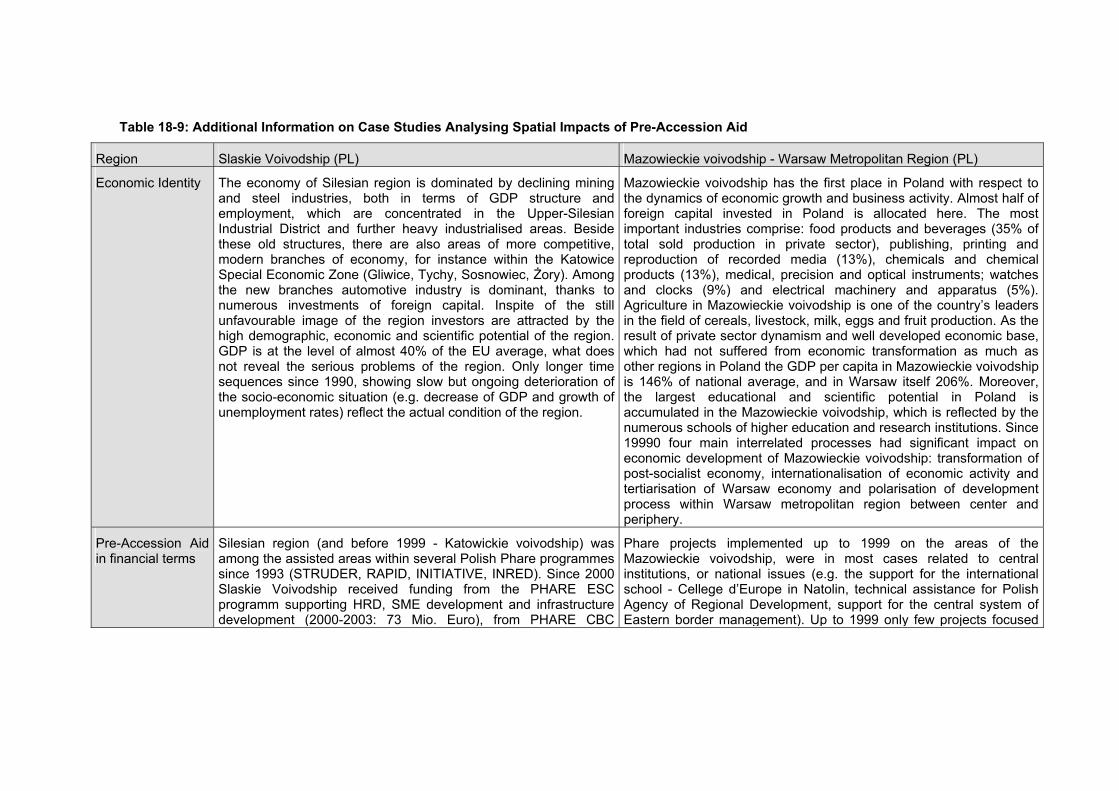
Table 18-9: Additional Information on Case Studies Analysing Spatial Impacts of Pre-Accession Aid
Region Slaskie Voivodship (PL) Mazowieckie voivodship - Warsaw Metropolitan Region (PL)
Economic Identity The economy of Silesian region is dominated by declining mining and steel industries, both in terms of GDP structure and employment, which are concentrated in the Upper-Silesian Industrial District and further heavy industrialised areas. Beside these old structures, there are also areas of more competitive, modern branches of economy, for instance within the Katowice Special Economic Zone (Gliwice, Tychy, Sosnowiec, Żory). Among the new branches automotive industry is dominant, thanks to numerous investments of foreign capital. Inspite of the still unfavourable image of the region investors are attracted by the high demographic, economic and scientific potential of the region. GDP is at the level of almost 40% of the EU average, what does not reveal the serious problems of the region. Only longer time sequences since 1990, showing slow but ongoing deterioration of the socio-economic situation (e.g. decrease of GDP and growth of unemployment rates) reflect the actual condition of the region.
Mazowieckie voivodship has the first place in Poland with respect to the dynamics of economic growth and business activity. Almost half of foreign capital invested in Poland is allocated here. The most important industries comprise: food products and beverages (35% of total sold production in private sector), publishing, printing and reproduction of recorded media (13%), chemicals and chemical products (13%), medical, precision and optical instruments; watches and clocks (9%) and electrical machinery and apparatus (5%). Agriculture in Mazowieckie voivodship is one of the country’s leaders in the field of cereals, livestock, milk, eggs and fruit production. As the result of private sector dynamism and well developed economic base, which had not suffered from economic transformation as much as other regions in Poland the GDP per capita in Mazowieckie voivodship is 146% of national average, and in Warsaw itself 206%. Moreover, the largest educational and scientific potential in Poland is accumulated in the Mazowieckie voivodship, which is reflected by the numerous schools of higher education and research institutions. Since 19990 four main interrelated processes had significant impact on economic development of Mazowieckie voivodship: transformation of post-socialist economy, internationalisation of economic activity and tertiarisation of Warsaw economy and polarisation of development process within Warsaw metropolitan region between center and periphery.
Pre-Accession Aid in financial terms
Silesian region (and before 1999 - Katowickie voivodship) was among the assisted areas within several Polish Phare programmes since 1993 (STRUDER, RAPID, INITIATIVE, INRED). Since 2000 Slaskie Voivodship received funding from the PHARE ESC programm supporting HRD, SME development and infrastructure development (2000-2003: 73 Mio. Euro), from PHARE CBC
Phare projects implemented up to 1999 on the areas of the Mazowieckie voivodship, were in most cases related to central institutions, or national issues (e.g. the support for the international school - Cellege d’Europe in Natolin, technical assistance for Polish Agency of Regional Development, support for the central system of Eastern border management). Up to 1999 only few projects focused

programme (2000-2001: 4 Mio. Euro), from SAPARD (2000-2002: 5,9 Mio. Euro) and from ISPA (376 Mio. Euro).
exclusively on the issues of regional development of the areas localized in the borders of Mazowieckie voivodships. The number of regionally oriented projects increased since 2000 with the start of PHARE ESC, ISPA and SAPARD. In the years 2000-2003 379 MEUR within these programmes were allocated to Mazowiecki voivodship.
Pre-Accession Aid regarding fields of intervention
Biggest amounts within the programmes before 1999 were spent on both small and large infrastructure projects. Significant means were also allocated to institutional building projects. The dominance of largescale infrastructure investment in the environmental and transport sector prevailed in recent years as well within the PHARE ESC programme and was further strengthend by introduction of ISPA. Further fields of action were aiming at SME support, support for the regional innovation capacity and human resource development.
Before 1999 two projects focusing on transport infrastructure (34 978 139 EUR) and two projects dealing with improvement of environmental quality (3 696 912 EUR) wer implemented. Since 2000 the main fields of intervention were: development and improvement of transport infrastructure (roads & railway): 312 MEUR, improving the environmental protection systems (mainly investments in systems of waste management): 39 MEUR, economic development and SMEs support: 11 MEUR, supporting the modernization and restructuring of agricultural sector: 4 ME.
National policy in the region in financial terms
In line with the support programme for the years 2001 - 2003, the state budget allocated ca. 395 million PLN (almost 100 MEUR) for the implementation of tasks envisaged in the Voiovodship Contract for the region.
The main tool of regional policy in Poland are Voivodship Contracts (agreement signed between regional self-government and central government). The amount of 394 082 EUR were allocated for the execution of the Mazowiecki Voivodship Contract signed in 2001. The share of the central government was 258 801 EUR (this includes resources assigned to the Contract priorities as well as 96 000 EUR of special funds designated by the particular Ministries for the specific sectoral policies), Thus, the States budget share was at the level of 65% of the total Contract value. The participation of the self-government (poviats and gminas) was at the level of 35%. Moreover, the central government also assured co-financing off the EU assistance.
National fields of intervention in the region
Voivodship contract for Silesia, a document that constitutes the basis for financing regional programmes, describes 4 priorities: 1.) improvement of educational standards and increase of adaptation abilities of the region's inhabitants, 2.) better social solidarity, improvement of health and public safety standards, 3.) extension and modernisation of transport and communication systems, 4.) increase of innovation capacities and competitiveness of regional economy, including small and medium-sized enterprises. The
The Voivodship Contract includes 7 thematic priorities plus an 8th priority for securing co-financing of PHARE ESC: 1. improvement of the transport and communal infrastructure of the Warsaw Metropolitan region (45% of the total budget), 2. Modernisation and development of the regional transport infrastructure (9%), 3. restructuring and modernisation of the health-care infrastructure (27%), 4. creation of the basis for multifunctional development of rural areas (1%), 5. strengthening of the regional system of education and culture (11%),

biggest funds from the budget (about 50% in the years 2001-2003) were allocated for the implementation of multiannual investments in the region (construction of three hospitals, Silesian stadium in Chorzów, regional tram infrastructure modernisation and water-supply plant in Goczałkowice). Other activities financed from the state budget included investment in transport infrastructure (e.g. transregional itinerary), environment protection, educational system (e.g. teaching college in Bielsko-Biała), social care (e.g. youth centre in Bogumiłek) and culture (e.g. reconstruction of opera building in Bytom).
6. improving the technical infrastructure of the backward areas (3%), 7. strenthening the physical infrastructure of the education system of the areas localised outside the influence of the Warsaw Metropolitan area (4%).
Relation between European and national policy (financial terms and fields of action)
Direct comparison of national and European policies for Silesia stirs some difficulties. One of the problems results from the fact that many programmes that the region definitely benefits from are not typical regional ones. Therefore, the confrontation of amounts will be most accurate only in the case of clearly defined regional programmes. Regarding European assistance ESC and CBC programmes amounted to about 400 Mio. Euro in the years 2000-2003, reagarding national means funds envisaged in the voivodship contract amounted to about 100 Mio. Euro in the same period. Altogether the areas of EU and national intervention seem to coincide, although the very choice of specific instruments may vary. Funds for infrastructure projects are considerable both in regional and EU budgets for Silesia. SME and HRD projects are also perceived as important strategic fields.
Direct comparison of national and European policies is extremely difficult and it can raise misinterpretations. There are number of central government undertakings that address regional development, however they are modes of sectoral policies and thus, they are not classified as regional spending. Moreover, in most of these cases the programme and policy borders are different than the regional one. The examples are big infrastructural projects (transport networks or environment protection). Therefore, the confrontation of amounts and areas could be accurate only for clearly defined regional programmes. For European assistance this refers to the PHARE-ESC programme, which was funded with 14 MEUR in the years 2000-2003 and for national means funds envisaged in voivodship contract are concerned, which amounted up to 140 MEUR for the same period. All in all the fields of action of EU and national intervention are coherent despite some differences in tools and headings of the programmes.
Region Borsod-Abaúj-Zemplén (HU) Szabolcs-Szatmár-Bereg (HU)
Economic Identity Up to 1990 industry was the dominant in the county with national importance of the mining sector and chemical industry. The economic output of Borsod-Abaúj-Zemplén county seriously declined after 1990. The value of industrial production in the middle of the decade was only 63% of the figure for 1990 what in national comparison marks a high above average decrease of output. Due
The economic activity of the population lags behind both the national and the rural average: in 2002, only 44.9% of those in the working age were economically active. Unemployment rate, accordingly, is much higher than the national and the rural average reaching some 13.8% in 2001. The amount of GDP produced in Szabolcs-Szatmár-Bereg county was only 56.6% of the national average in 2001. The economic

to the critical economic situation of the county, a large-scale unemployment far above national average emerged (unemployment rate was 17.6% in 1995 and 13,8% in 2001, national average in 2001: 5,7%). A source of serious social problems is the phenomenon of long-term unemployment that affect 59% of the unemployed.
structure is characterised by a high proportion of agricultural and food processing businesses whereas the turnover of services, trade and tourism is well below the national average. However Szabolcs-Szatmár-Bereg is also home to the first business zone in Hungary and seven industrial parks.
Pre-Accession Aid in financial terms
Since one ISPA project could be located in the county only, the following figures are given for the respective NUTS 2 region: In 1998-2000 ESZAK-MAGYARORSZAG received about 16.4 mio. Euro, what makes out about 10% of the total funds allocated on regional level in Hungary. However it needs to be added that Borsod-Abaúj-Zemplén belongs to the two counties that alone enjoyed PHARE regional support in the first half of the nineties. In the middle of the nineties the support had been extended to 3 or 4 NUTS2 regions (9 or 12 counties), from 2002 to the whole country, to every county and region.
Since two infrastructure projects can be located in the county only, the following figures are given for the repsective NUTS 2 region: In 1998-2000 ESZAK-ALFOELD received about 36 Mio Euro, that is about 23% of the total funding on regional level in Hungary. However it needs to be added that Szabolcs-Szatmár-Bereg is the second county beside Borsod-Abaúj-Zemplén that alone enjoyed PHARE regional support in the first half of the nineties.
Pre-Accession Aid regarding fields of intervention
In 1998-2000 funding in ESZAK-MAGYARORSZAG concentrated on the fields of environmental improvements (ca. 59%), labour market (18%) and economic restructuring with respect to urbanisation and localisation advantages (14%).
In 1998-2000 funds ESZAK-ALFOELD were mainly focused on environment measures (47%), transport infrastructure projects (30%) and to a lesser extent economic restructuring projects aiming at improvement of the urbanisation and localisation advantages (14%).
National policy in the region in financial terms
Borsod-Abaúj-Zemplén county was one of the most favoured target areas of national regional policy in the first half of the nineties. There were years (1993-1994), when more than half of the national support means were allocated to this county due to the status as least developed county in Hungary. Later on, however, this preference diminished, mainly for political and “institutional” reasons. After adopting the Regional Development Act in 1996, all counties of Hungary became subjects of regional policy and support, Regional Development Councils were set up in every county and some support money had to be allocated to each county, so the former high concentration to the least developed ones was not possible any more. The share of Borsod-Abauj-Zemplén county decreased from 50 to 15 percent which is even now the double of their share in the population in Hungary.
Szabolcs-Szatmár-Bereg county has been a selected target of Hungarian regional policy since such a policy has existed. The development strategy of the county was created following the rules set by the Act on Regional Development and Physical Planning and the recommendations of the European Union.

National fields of intervention in the region
The fields of intervention now are the same as in all other counties. There is no more any specific programme for the county with specific objectives and means.
The development priorities for Szabolcs-Szatmár-Bereg county are as follows: 1. The development of the communication and transport infrastructure, 2. The development of the business infrastructure, 3. The development of human resources, 4. The development of entrepreneurial base of the county, 5. Improvement of the (human) infrastructure influencing the quality of life, 6. Improvement of the lagging regions with the tools of rural development, 7. Preparation for the EU-accession; regional marketing, investment promotion. In the nineties the main fields of national intervention was the development of the natural gas pipeline networks and telephone networks. At present, the county is the best provided with these services among the counties in Hungary.
Relation between European and national policy (financial terms and fields of action)
Regarding Hungary as a whole, it can be stated that national funds will exceed EU-funds in the next years. The Operational Programme 2004-2006 for Regional Development supported by the EU Structural Funds contains 300 million euro (HUF 75 billion). The yearly national cofinancing obligation is 14 billion HUF. The overall yearly national regional support is 64 billion in 2004. It means that in these years (2004-2006) only a smaller fraction (14 billion out of 64 billion) of the national support means will be absorbed by co-financing obligations) Obviously, the situation after 2006 will change radically. Concerning fields of intervention the two support schemes served the same objectives and even their regional allocation changed parallel. Therefore, they were rather in a competitive situation. Local governments and applicants generally preferred national support schemes to PHARE ones, because the rules and conditions of the former were much softer than in the case of PHARE (which were, in many cases, really too rigid, bureaucratic and slow), and decision-makers were more easily to be “accessible” to ask a favour.
Regarding Hungary as a whole, it can be stated that national funds will exceed EU-funds in the next years. The Operational Programme 2004-2006 for Regional Development supported by the EU Structural Funds contains 300 million euro (HUF 75 billion). The yearly national cofinancing obligation is 14 billion HUF. The overall yearly national regional support is 64 billion in 2004. It means that in these years (2004-2006) only a smaller fraction (14 billion out of 64 billion) of the national support means will be absorbed by co-financing obligations) Obviously, the situation after 2006 will change radically. Concerning fields of intervention the two support schemes served the same objectives and even their regional allocation changed parallel. Therefore, they were rather in a competitive situation. Local governments and applicants generally preferred national support schemes to PHARE ones, because the rules and conditions of the former were much softer than in the case of PHARE (which were, in many cases, really too rigid, bureaucratic and slow), and decision-makers were more easily to be “accessible” to ask a favour.

Region Malta Estonia
Economic Identity Malta’s GDP per capita in PPS in 2000 was on a 53% level of the EU 15 average, what however is a relative high level among the group of new member states. The employment rate is very low in Malta: 54,7% against 63,8% in EU 15 average. However, the unemployment rate the same year was also comparatively low (6.8% against the average rate of 7.2% in the EU 15). Malta is increasingly becoming a service-oriented economy, and the tourism industry plays a significant role in the contribution to economic growth, job creation and foreign exchange earnings. Per capita value-added in the manufacturing sector has increased significantly in recent years mainly due to a redistribution of the employment from traditional sectors such as footwear and clothing to sectors such as electronics, engineering and health-related products.
In many respects Estonia ranks as one of the most advanced countries amongst the accession countries. Nevertheless ecnomic development indicators of Estonia show average values in comparison to the other CEE accession countries. Estonias GDP in PPS/capita in 2001 was only 42% of the average EU indicator (the average of the 10 CEE candidate countries was 45%). After a sharp incrase of unemployment due to the crisis in Russia in 1999 the unemployment rate has fallen to around 9.1% in 2002 again (12.5% in 2000). Despite a relatively high level of education the Estonian labour market suffers from non-conformity of labour demand and supply, what partly results from an unsufficient system of vocational education. Economic restructuring in Estonia has resulted in a decrease of the agricultural sector and of former soviet industries, while rapid development has taken place in a number of new industries and in the service sector supported by strong FDI flows. The number of employment in the primary sector decreased threefold from 1991 to 2001 to 5%, while employment in services increased considerably.
Pre-Accession Aid in financial terms
Malta was not given access to either of the EU pre-accession programmes, PHARE, ISPA and SAPARD. In stead, EU provided by special pre-accession funds for Malta per Council Regulation (EC) 555/2000 - in total 38 million Euros for the period 2000-2004.
PHARE in Estonia started in 1993 with only a few financially smaller projects in the early years. For the period 1995-1999 the PHARE allocation has totalled € 143 mio. and in the period 2000-2002 another € 130 mio. were allocated. Until the end of 2002 about € 120 mio. were allocated to ISPA projects (starting in 2000) and about € 20 mio. for SAPARD projects (starting in 2001). It lies in the nature of ISPA as instrument for large-scale infrastructure projects that funds are clearly localised; the focus within Estonia lay on the North-east, South-east and Tallinn region.
Pre-Accession Aid regarding fields of intervention
The allocated grants have almost exclusively been given to institution building projects and technical assistance aiming at the adoption of the acquis and institution building for the absorbtion of Community funds after accession. In total 55 projects have been implemented 2000-2004, targeted enhancement of the institutional framework and administrative capacity of a variety of public sectors
Overall national interventions (without SAPARD) in the 1999-2002 period aimed at institutional conditions (98 Mio. €), environmental quality (97 Mio. €) and transport infrastructure needs (59 Mio. €). Given that ISPA accounts for a large share of transport and environmental investments these figures point out that the focus of PHARE during the 1999-2002 period was on institution building while

and organisations. the total of other measures addressing e.g. the labour market, the innovation potential or the regional market potential amounted to 55 Mio. €. Only since 2000 programmes for supporting economic and social cohesion have been launched within PHARE, most of which have a clear regional dimension.
National policy in the region in financial terms
The field of regional policy has for long been weakly institutionalised in Malta. Malta's public administrative structures are highly centralised with a national and a week local level only and no structures addressing the regional level. Due to the special development problems and needs of Gozo a special “semi-regional” administrative arrangement has been set up only for this island. Moreover since 1987 the Ministry of Gozo (MOG) was established on national level, which administers funds provided by Parliament. Malta’s institutional framework and administrative capacity for regional policy have been noticeably strengthened in the course of preparation for EU membership, e.g. by the first quarter of 2001 a Regional Policy Directorate within the Office of the Prime Minister has been set up.
Since 1999 regional policy has been based on the Strategy for Regional Development, which for the first time in Estonia included a well-defined nomenclature for programmes and the areas they target. Although the objective of balanced development is declared in the strategy as well as in other official documents it seems to be of less importance than the objective of overall national growth dynamic. All in all regional policy seems not to be of high priority in Estonia due to the small size of the country and the comparably homogenous structure (at least regarding situation and needs of infrastructure). This becomes also evident from the institutional structures with no portfolio for the Minister for Regional Affairs and the Regional Development Department belonging to the Ministry for Internal Affairs.
National fields of intervention in the region
Due to the late establishment of genuine "regional" policies national governmental intervention has in the past mainly focused on fulfilling the numerous demands mentioned in the national programme for adoption of the Acqui, including alignment of economic, social, environmental legislation, and institution and administrative capacity building.
In accordance with the Strategy for Regional Development (1999), the Government of the Republic has approved seven regional development programmes for: agricultural areas, industrial areas, the isalnds, the Setomaa region, local initiatives, cross-border co-operation, networking of centres.
Relation between European and national policy (financial terms and fields of action)
No information on national funds in terms of finances could be provided. Concerning the fields of action it can be stated, that since EU policies were focused on institution building alone naturaly national regional policies cover a wider range of activities. However, the accession process alone has improved the conceptual as well as the instrumental capabilities of the Maltese administration to target regional problems appropriately by supporting adequate institutional structures.
Comparison of national and EU regional policies would be most accurate when regarding on the one side the national Strategy for Regional Development and on the other side the PHARE ESC programme. Due to lacking data on national spending however this comparison is not possible. Moreover it should be considered, that several sector policies bear regional impacts as well. Concerning fields of action especially the PHARE CBC programme had an important influence on the fields of action addressed by national regional policies. Without this programme domestic policies would never have financed so many activities in the field of cross-border

cooperation. Nevertheless in general Pre-Accession Aid funds are an additional funding source but do not influence the priorities of domestic policies. From the domestic point of view national and EU policies are seen as complementary and additional and so far no conflicts aroused.
Table 18-10: Additional Information on Case Studies on Cross-Border Regions
Region Polish-German (Viadrina) Hungary-Slovakia Hungary- Ukraine
Spatial identity
Euroregion Viadrina is situated within the East-West trade and traffic corridor Berlin-Warsaw-Moscow. The territory covered by Euroregion Pro Europa Viadrina is over 10.000m2- 4.518 m2 in the German side. The population is approximately 850.000. There is only one big city in the region -Gorzow Wielkopolski and it might be regarded as a regional urban and economic centre. Demographic situation in Polish part differs a bit from the average demographic structure in Poland. Comparing the whole Poland, the society in Viadrina is younger than it is in the country. The total number of border checkpoints within Euroregion is 6: 4 roads and 2 railways. The area of Polish part is 1/4 larger than the German one, but at the same time the number of inhabitants is 1/8 lower. Almost 50% of the total area of Euroregion is afforested. It has lots of lakes, water reservoirs, rivers which are remains from glacier epoch. There are 20 nature reserves. Variety of natural landscapes might help to cause this region as an attractive destination for weekend travelers.
The border regions were typically peripheral regions in Hungary. The specific region had 679 klm, distance. Also, this border region can be divided into two parts: a)Danubian region, which was transportation and development zone, an industrialised region. B) Eastern Slovakian border zone, which was a peripheral region with agricultural character, but heavy industry was dominant in some areas. The Danubian region is characterised by a gratual stability and slow rearrangement. Cross-border relationships are intensive primarily in civil sector.
The permeability of the borders palys a dominant role. It is important whether the border has a connecting (bridge) or the separating (wall) function. There is a lach of comparable statistical data for the borders. The population has been decreasing in both regions. Outmigration has characterised both border regions.

Economic identity
The unemployment rate is very high in the Euroregion. It has been increased since 1998, when amounted 11,6 %. It has positive birth rate. The balances of migration both inner and foreign are negative. The employment structure of Viadrina is different from average in Poland. Its economic structures show a variety of sectors with SMEs. Most of them employed less than 5 people. Economic situation is diversified. Financial and immovable services are the sectors being developed the last years. Medical care services as well. Most of the companies belonging to the secondary sector. The foreign trade was growing rapidly in 90ies in Poland, but still the value of foreign trade per capita was lower than in European Union Member States. The retail trade sector in Pro-Europa Viadrina was developing quite dynamically in the period 1990-2001. Due to the fact that it has not foreign tourism, its infrastructures are in a quite low level of attractiveness. The last 10 years were characterised by a growing inflow of foreign investment to Poland. A considerable portion of these has been invested mainly in metropolitan areas and Western part of Poland, including Pro-Europa Viadrina Euroregion.
The unemployment rate is well above the average in the East Slovakian border region (13,4%) which is complemented by much lower income per capita than the national average. It has also lower share of joint ventures than the Danubian zone has. This region is unable to receive development resources from each other. The East Slovakian border region is characterised by significant and lasting employment tensions. the demographic erosion is advancing and the service sector has not appeared yet.
The unemployment rate in 1997 was about 9,1% in border regions. The income per capita was 191105 in the borders. The national average for the unemployment rate was 7,4% while the income per capita was 222662 HUF.
PHARE/ CBC
It receives subsidies from PHARE CBC since 1994. At the same time the German part has been a region eligible to funds within the framework of the INTERREG II initiative. PHARE programmes on regional
As regards former non -EU border sections, only in few cases were international programmes (PHARE CBC, CREDO) experimentaly introduced. The defficiencies of the Slovakian -Hungarian Phare

development in Poland in 1989-1999 were: PHARE STRUDER: € 77,0 mil., PHARE STRUDER II: € 5,3 mil., PHARE CBC: € 311,15 mil., PHARE RAPID: € 14,9 mil., PHARE INRED: € 15,0 mil., PHARE INITIATIVE I: € 30,0 mil. Undoubtedly the PHARE CBC programme had significant influence on the region development processes especially in transport and environment protection sectors. Almost 33% of total spending within the programme was allocated to Viadrina Euroregion. Still the most important programme in financial terms was PHARE CBC. Projects within PHARE ESC were focused on development of SMEs' sector (7 mil. ECU) and human resources development (1,1mil. ECU).
programme with a 2 million euro budget were as follows: 1. political tensions, 2. allocated sums were low and concentrated on a few areas (development of transport connections), 3. competence barrier: local and regional organs on the two sides of the border have different authorities and competencies, 4. economic barriers: performance of the national economies, inflation. The allocated sums were low and concentrated on a few areas (development of transport connections), but they contributed to the gradual building out of the social frameworks of cooperations (CREDO programme).
Fields of intervention
According to the amount of funds distributed: -development and improvement of transport infrastructure (roads and railway): € 64,2 mil. -improving the environmental protection systems and municipal infrastructure (mainly investments in systems and waste management): € 25,2 mil. -economic development and SMEs support: € 8,5 mil. -human resources development (mainly for education and training): € 17,6 mil.
Economic development, human resources development, environmental protection and other concrete projects (border crossing statons. Logistic parks in Zahony etc).
Highlight-projects
- Modernisation and upgrade of National Road (Kostrzyn-Gorzow Wielkopolski): € 30,9 mil.,
- Modernisation of railway line and border crossing point Rzepin-Kunowice: € 23,3 mil.,
30 projects were applicated but 20 were supported. Among them projects relevant to tourism developments (marketing brochures, development of tourism paths, training in tourism). A sum of 100000 euros was given

- Construction of Collegium Polonicum: € 16 mil.,
- Modernisation of the waste treatment plant in Gorzow Wielkopolski: € 15,2 mil., - Solid waste management facilities in Slubice: € 6 mil.
for the establishment of a small office on the basis of the Szabolcs-Szatmar-Bereg development agency.
Small project funds
Exchange and meeting of youths, cultural events and sport events should be mentioned. The basic aims of the SPF were:
- To support the process of social integration between people from Poland and German and
- To strengthen the network of regional institutions
Governance
There are two main legal basis of the present system. Firstly, The Act on regional self-government, adopted in June 5th 1998. According to this document country was divided into 16 voivodships, 315 poviats (administrative districts) and 2489 gminas (communes) with self-government on each of the mentioned level. Secondly, The Act on Supporting Regional Development adopted on 12th of May 2000. This act defined the objectives and tools of the regional policy as well as the responsibilities and relations of the institutions involved in the regional policy. On a central level there are the following actors: -the Council of Ministries, - the State Council for Regional Policy, -Polish Council for Spatial Economy, -the Minister of
The institutional body is comprised by a management body, a secretariat and nine planned working committees. The Ipoly Euroregion International Cross-border Cooperation intends to integrate a geographical, economic and cultural region on the two sides of the border. The initiative is bottom-up, the actors are known and the planned actions can be beneficial to the development of the border region. There are signs that Komaron-Esztergom and Pest country along the border and the Nytira region in Slovakia wish to establish the Vag Danube-Ipoly Euroregion to which the Ipoly Euroregion established by a municipal level initiative will probably join.
There are different administrative levels and competencies and the basically different problems of the adjacent countries, neither the central nor the regional tiers can devote sufficient attention and more importantly resources to the cooperation. The adjacent territorial administrative units of 4 countries -Hungary, Poland, Ukraine and Romania- established in 1993 the Carpathians Euroregion Interregional Alliance. Ita has a permament coordinating organisation (general secretary and a foundation supporting the operation).

Economy, Labour & Social policy, -Agencies and other Ministries involved in the implementation and management of programmes with regional implications. On the regional level there are 3 groups of actors: - 16 regional self-governments, 16 Voivod Offices, Around 70 agencies for regional development that support regional economic development in the Polish regions.
National policy
The main tool of regional policy in Poland is Voivodship contracts (agreement signed between regional self-government and central government). The total amount of the programme is € 46.947.000 plus € 45.639.000 from EU budget. It includes five (5) thematic priorities: - development of the infrastructure and strengthening the regional competitiveness,
- restructuring and diversification of regional economic basis,
- development of human resources,
- improving and restructuring the backwarded regions,
- development of regional cooperation.
The ACT No. LXV. Of 1990 on local self-goverments declares that municipal goverments "can freely associate with other municipal goverments, can be members in regional and national organs of interest representation in order to represent and protect their interests, can cooperate with municipal goverments abroad and join international municipal organisations". These authorities can establish foreign relations, including the creation of cross-border cooperations. On the other hand there are tasks that the local or regional bodies cannot solve, they are in the competencce of the national goverments. The inter-state contracts made with the neighbour countries typically involve, although only superficially, the cross-border cooperations and the potential relations of the municipal goverments.
National fields of intervention
National intervention concentrates most on the "development of the infrastructure and strengthening the regional competitiveness". Investments in development of roads and
Danubian region was an industrialised region. The Hungarian- Slovakian borders section has some physical barriers, which means that on both or only one side

ecological infrastructures are undertaken. Second priority is the "improving and restructuring the backwarded regions". It refers to post industrial areas, as well as former state farms. It also focuses on the phenomenon of high unemployment and creating new workplaces. The priority for "strengthening the Euroregional cooperation" seems to have the lower interest on the state level. Also the activities preventing the phenomena of unemployment and developing quality of human resources have become very important for last years.
infrastructure is deficient, i.e. the transport network is not nuilt out, their management is not profitable, also, border crossing stations are absent or their access is difficult and lengthy- thus the proximity of the state border is definitely a disadvantage for the settlements. In the Eastern Part of the Hungarian -Slovakian border region there is a high unemployment, the economic restructuring has not been implemented yet, the settlement network is almost the same on both sides, i.e. small villages or fragmented settlement system.
Comparison of national and European policies in financial terms
Direct comparison of national and European policies is extremely difficult and it can rises misinterpretations. There are numbers of central government undertakings that address regional development, however they are modes of sectoral policies and thus they are not classified as regional spending. Moreover, in most of these cases the programme and policy borders are different than the regional one. The examples are big infrastructural projects (transport networks or environment protection). The areas of EU and national intervention are coherent despite some differences in tools and headings of the programmes. Furthermore in years 2000-2002 the average ratio national to EU funds is 1:1.
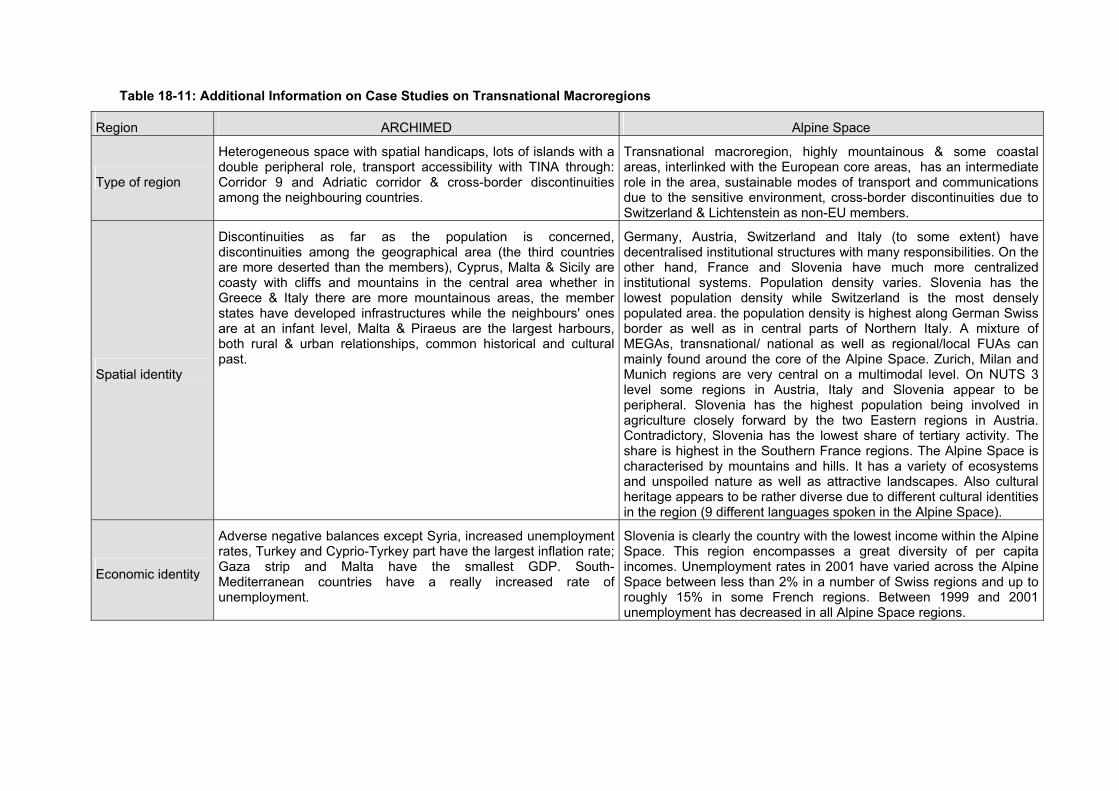
Table 18-11: Additional Information on Case Studies on Transnational Macroregions
Region ARCHIMED Alpine Space
Type of region
Heterogeneous space with spatial handicaps, lots of islands with a double peripheral role, transport accessibility with TINA through: Corridor 9 and Adriatic corridor & cross-border discontinuities among the neighbouring countries.
Transnational macroregion, highly mountainous & some coastal areas, interlinked with the European core areas, has an intermediate role in the area, sustainable modes of transport and communications due to the sensitive environment, cross-border discontinuities due to Switzerland & Lichtenstein as non-EU members.
Spatial identity
Discontinuities as far as the population is concerned, discontinuities among the geographical area (the third countries are more deserted than the members), Cyprus, Malta & Sicily are coasty with cliffs and mountains in the central area whether in Greece & Italy there are more mountainous areas, the member states have developed infrastructures while the neighbours' ones are at an infant level, Malta & Piraeus are the largest harbours, both rural & urban relationships, common historical and cultural past.
Germany, Austria, Switzerland and Italy (to some extent) have decentralised institutional structures with many responsibilities. On the other hand, France and Slovenia have much more centralized institutional systems. Population density varies. Slovenia has the lowest population density while Switzerland is the most densely populated area. the population density is highest along German Swiss border as well as in central parts of Northern Italy. A mixture of MEGAs, transnational/ national as well as regional/local FUAs can mainly found around the core of the Alpine Space. Zurich, Milan and Munich regions are very central on a multimodal level. On NUTS 3 level some regions in Austria, Italy and Slovenia appear to be peripheral. Slovenia has the highest population being involved in agriculture closely forward by the two Eastern regions in Austria. Contradictory, Slovenia has the lowest share of tertiary activity. The share is highest in the Southern France regions. The Alpine Space is characterised by mountains and hills. It has a variety of ecosystems and unspoiled nature as well as attractive landscapes. Also cultural heritage appears to be rather diverse due to different cultural identities in the region (9 different languages spoken in the Alpine Space).
Economic identity
Adverse negative balances except Syria, increased unemployment rates, Turkey and Cyprio-Tyrkey part have the largest inflation rate; Gaza strip and Malta have the smallest GDP. South- Mediterranean countries have a really increased rate of unemployment.
Slovenia is clearly the country with the lowest income within the Alpine Space. This region encompasses a great diversity of per capita incomes. Unemployment rates in 2001 have varied across the Alpine Space between less than 2% in a number of Swiss regions and up to roughly 15% in some French regions. Between 1999 and 2001 unemployment has decreased in all Alpine Space regions.
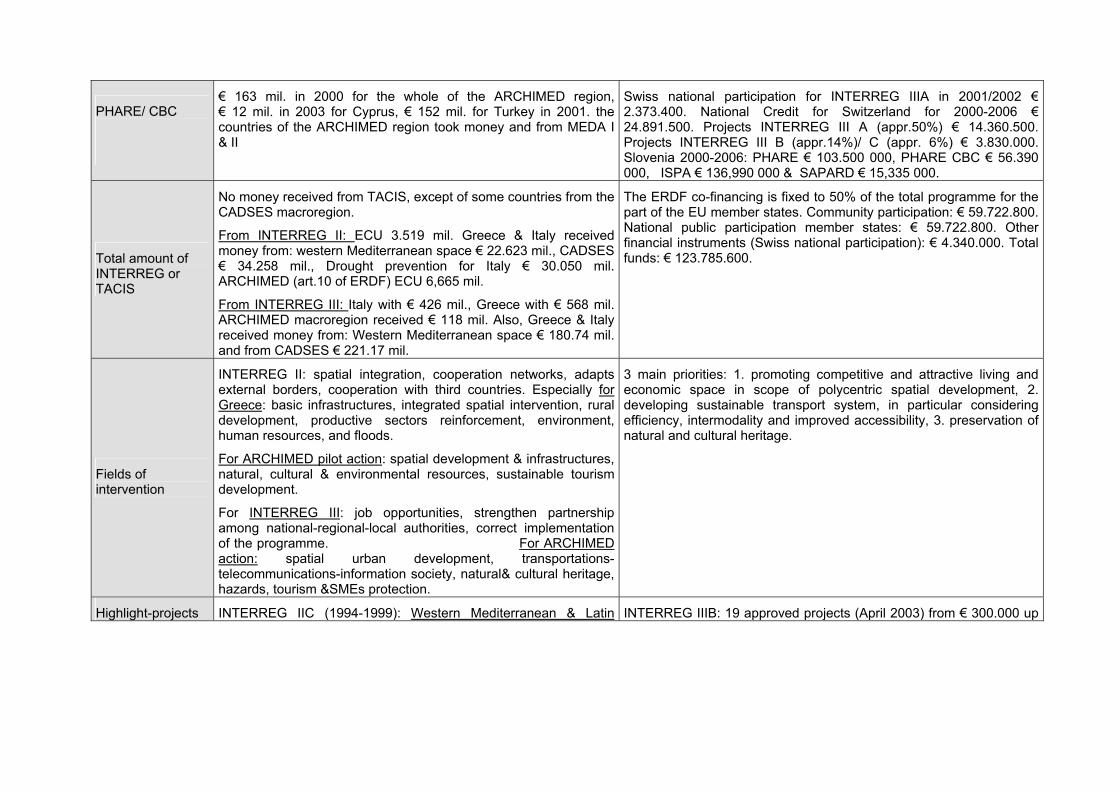
PHARE/ CBC
€ 163 mil. in 2000 for the whole of the ARCHIMED region, € 12 mil. in 2003 for Cyprus, € 152 mil. for Turkey in 2001. the countries of the ARCHIMED region took money and from MEDA I & II
Swiss national participation for INTERREG IIIA in 2001/2002 € 2.373.400. National Credit for Switzerland for 2000-2006 € 24.891.500. Projects INTERREG III A (appr.50%) € 14.360.500. Projects INTERREG III B (appr.14%)/ C (appr. 6%) € 3.830.000. Slovenia 2000-2006: PHARE € 103.500 000, PHARE CBC € 56.390 000, ISPA € 136,990 000 & SAPARD € 15,335 000.
Total amount of INTERREG or TACIS
No money received from TACIS, except of some countries from the CADSES macroregion.
From INTERREG II: ECU 3.519 mil. Greece & Italy received money from: western Mediterranean space € 22.623 mil., CADSES € 34.258 mil., Drought prevention for Italy € 30.050 mil. ARCHIMED (art.10 of ERDF) ECU 6,665 mil.
From INTERREG III: Italy with € 426 mil., Greece with € 568 mil. ARCHIMED macroregion received € 118 mil. Also, Greece & Italy received money from: Western Mediterranean space € 180.74 mil. and from CADSES € 221.17 mil.
The ERDF co-financing is fixed to 50% of the total programme for the part of the EU member states. Community participation: € 59.722.800. National public participation member states: € 59.722.800. Other financial instruments (Swiss national participation): € 4.340.000. Total funds: € 123.785.600.
Fields of intervention
INTERREG II: spatial integration, cooperation networks, adapts external borders, cooperation with third countries. Especially for Greece: basic infrastructures, integrated spatial intervention, rural development, productive sectors reinforcement, environment, human resources, and floods.
For ARCHIMED pilot action: spatial development & infrastructures, natural, cultural & environmental resources, sustainable tourism development.
For INTERREG III: job opportunities, strengthen partnership among national-regional-local authorities, correct implementation of the programme. For ARCHIMED action: spatial urban development, transportations-telecommunications-information society, natural& cultural heritage, hazards, tourism &SMEs protection.
3 main priorities: 1. promoting competitive and attractive living and economic space in scope of polycentric spatial development, 2. developing sustainable transport system, in particular considering efficiency, intermodality and improved accessibility, 3. preservation of natural and cultural heritage.
Highlight-projects INTERREG IIC (1994-1999): Western Mediterranean & Latin INTERREG IIIB: 19 approved projects (April 2003) from € 300.000 up

Space: raising the identity of the Mediterranean basin, maritime transport & telecommunication system, urban development & "metropolitanism", natural & cultural heritage. PAN-project: Mediterranean system of routes in natural & cultural parks: has been completed.
INTERREG III B (2000-2006): Western Mediterranean space: Mediterranean basin, strategy for spatial development & urban systems, transportations & information society, sustainable development & development of assets.
to € 3.338.600. ALPS MOBILITY II € 3.216 960, RIVER BASIN AGENDA € 3.338 600, QUALIMA (Quality of life Improvement) € 2.377 668, DYNALP (Dynamic rural Alpine Space) € 2.397 934.
Small project funds Relevant to Cyprus: 1. Business Support Project Grant Scheme for Greek-Cypriot Small- Medium Sized enterprises and 2. Small Project Funds Grant Scheme for Turkish- Cypriot SMEs.
Small Project Funds seem to be relevant in INTERREG IIIA/ PHARE CBC.
Governance
Decisions for the transnational cooperation are taken upon the national level (Ministry of Economy & Finance) in collaboration with the Regional & Local authorities.
Decisions are taken at different level in the member states. Slovenia with a centralized regional policy, decisions are taken at a national level. In Switzerland at a national and regional level ("round table") due to regional authorities (Kantone). Nevertheless, transnational project partner initiatives are important.
National policy
Spatial Planning at national & regional level is based on L 2742/ 1999 for Spatial Planning and Regional Development. General Spatial Plan at a national level is approved by the parliament. National special plans for mountainous, coastal & island areas, economic activities, social infrastructures, transportation are approved by the Minister of Environment. Spatial Planning & Public Works through ministerial decisions, regional spatial plans are approved through Ministerial decisions after the opinion of the regional authorities. Regional plans' approval will be decentralised to the regional councils. Regional development five year plan financially supported by the Structural Funds. The new public works of large scale are financed through the EU Funding/ Structural Funds.
Transnational cooperation has a priority in national policies of Slovenia and Switzerland as well; especially in the specific area cross-border thinking is very important.
National fields of intervention
For Greece: infrastructures, transportation, telecommunications, industry, cultural& natural heritage, urban networking, social & environmental infrastructures. For Turkey: economic, social &
Infrastructure (transport, Border crossing, railway, tourism), environment (natural heritage, disaster), rural development, demographic problems, cultural heritage, economic development,

cultural development, strengthening the unity of the country, sustainability, equal opportunities, improving the quality of life, urban networking, infrastructures, tourism, SMEs. For Malta: infrastructures, sustainable development, growth of economy, human resources, promotion of a competitive economy, Gozo's development according to its special needs. For Cyprus: industries competitiveness, sustainability, R&D, agriculture-fishery, SMEs, Taxation system, energy.
SMEs, Innovation.
Comparison of national and European policies in financial terms
Most of the programmes are financed both from national and European recourses. Also from the private sector contribution. Greece has also been funded from the Fund of Cohesion. Greece is going to receive € 5,07 bil. For the Environment & Transportations. For Cyprus, in the year 2001, the EU provided € 11.5 million to support projects for institutional capacity building, adoption of the acquis, and bi-communal projects as well as projects that will help meet the costs of Cyprus’ participation in EC programmes and Agencies.
Proportion between national and European policy in financial terms. Proportion between national and European policy concerning fields of intervention. A detailed comparison is possible after interviews at programme level in Slovenia and Switzerland.

LXXXIV
19 Bibliography Agencje Rozwoju Regionalnego w Polsce: Raport, National Association of Regional
Development Agencies, Warsaw 2003 p1 (http://www.narda.org.pl/raport_pol/rap_wst.htm)
Alpine Space Programme, Community-Initiative Interreg III B, final Version 2001.
Archi-Med Interreg IIC evaluation.
Ardy, B. (2000) EU Enlargement and Agriculture: Problems and Prospects, South Bank European Paper no. 4/2000 South Bank University, European Institute
ARL (2003): Regionale Strukturpolitik der EU nach 2006, Positionspapier der ARL. No.53, Hannover
Arndt, M. (1998): Raum ohne Geld. Räumliche Auswirkungen der Konzentrations- und Deregulierungsprozesse des Kreditmarktes. In: Kujath, H.J. (ed.): Strategien der regionalen Stabilisierung – Wirtschaftliche und politiche Antworten auf die Internationalisierung des Raumes. IRS, Berlin.
Bache, I. (1999) ‘The Extended Gatekeeper: Central Government and the Implementation of EC Regional Policy in the UK’ Journal of European Public Policy 6(1).
Bachtler J and Downes R (1999) Regional policy in the Transition Countries: A Comparative Assessment, European Planning Studies, Vol. 7, No. 6
Bachtler J and Yuill D (2001) Policies and Strategies for Regional Development: A Changing Paradigm? Regional and Industrial Policy Research Papers, No. 46, European Policies Research Centre, University of Strathclyde, Glasgow,
Bachtler J, Downes R and Gorzelak G (2000) Transition, Cohesion and Regional Policy in Central and Eastern Europe, Ashgate Publishers, Aldershot
Bachtler J. (2001) Where Is Regional Policy Going? Changing Concepts of Regional Policy, EPRC Discussion Paper, University of Strathclyde, October 2001, p. 5
Bachtler, J, Downes, R, Helenska-Hughes, E, and MacQuarrie, J. (1998) Regional Development in The Transition Countries, EPRC, University of Strathclyde.
Bachtler, J, Taylor, S. and Kearney, C. (1996) Extended Synthesis of Agreed Single Programming Documents on Objective Two Areas. Report to the European Commission (DGXVI).
Bachtler, J. (1995) Regional Development Planning in Objective 1 Regions European Urban and Regional Studies 2: 4 339-371
Bachtler, J. (2003) Reforming EU Cohesion Policy: An Assessment of the Debate, Intereconomics, November/December 2003, pp. 302-305.
Bachtler, J. and Downes, R. (2001) Benchmarking Regional Policy in Europe: Patterns, Trends and Issues Report to international conference ‘Benchmarking Regional Policy in Europe’, Forest Hills Hotel, Loch Ard, 9-12 September 2001.
Baltic Sea Region INTERREG IIIB presentation. www.spatial.baltic.net/programme.html.
Barsi, B. (2003) ‘Preparation for Structural funds in Hungary’ paper presented at the conference ‘Readiness of the Candidate Countries for the EU Regional Policy’ Bratislava 3-5/11/03
Beirat für Raumordnung – Deutschland (2004): Stellungnahme zur Ausgestaltung der Aufgabenverteilung zwischen der EU und Deutschland auf Grundlage des EU-Verfassungsentwurfes.

LXXXV
Benc, V. (2002): Regionalna politika, in: Marcincin, A. editor, Hospodarska politika na Slovensku 2000-2001, SFPA
Benc, V. (2003) ‘Readiness of the Slovak Republic for EU Regional Policy’, paper presented at the conference ‘Readiness of the Candidate Countries for the EU Regional Policy’ Bratislava 3-5/11/03
Bergman Group (2002) Ex-Ante Evaluation of the Czech National Development Plan, March 2002
Biehl, D. (1995): Infrastruktur als Bestimmungsfaktor regionaler Entwicklungspotentiale in der Europäischen Union. In: Karl, H. and Henrichsmeyer, W. (eds.) Regionalentwicklung im Prozess der Europäischen Integration. Bonner Schriften zur Integration Europas, No. 4, Bonn, pp.53-86.
Blažek J (1999) ‘(In)consistency and (In)efficiency of the Czech Regional Policy in the 1990s’, Acta Universitatis Comenianae Geographica, Bratislava, Slovakia, and available at: http://www.natur.cuni.cz/~mak/clanky/blazblava.htm.
Blažek J and Vozab, J. (2003): Ex-Ante Evaluation of the National Development Plan - Instrument for Identification and Elimination of Problems in Preparations for EU Cohesion Policy. In. V. Benč: Readiness of the Candidate Countries for the EU Regional Policy, Conference Almanac, 3-5 November 2003, Bratislava, pp. 163-170,http://europa.eu.int/comm/regional_policy/sources/docoffic/working/doc/exante_en.pdf
Blažek J. (1999) Regional Development and Regional Policy in CEECs in the Perspective of EU Enlargement, in Hampl M. (ed) Geography of Societal Transformation in the Czech Republic, Charles University
Blažek J. (2001) Regional development and Regional Policy in the Czech Republic: An Outline of the EU Enlargement Impacts. Informationen zur Raumentwicklung Heft 11 p.766
Blažek, J. (1999) Local and regional development and policy in the Czech Republic in the 1990s, in V. Hudak, H. Huitfeldt and E. Meegan, Regional Policy Goes East: Essays on Trends and Lessons
Boeri, T. and Brücker, H. et al. (2000), The Impact of Eastern Enlargement on Employment and Labour Markets in the EU Member States, Report for European Commission’s Employment and Social Affairs Directorate, European Integration Consortium (DIW, CEPR, FIEF, IAS, IGIER), Berlin/Milan, Germany/Italy
Bradley, J. et al (2003) The Role of Ex-Ante Evaluation in CEE National Development Planning: A Case Study Based on Polish Administrative Experience with NDP 2004-2006. Paper Presented at the Fifth European Conference on Evaluation of the Structural Funds, Challenges for Evaluation in an Enlarged Europe, (Workshop 5: Capacity for Evaluation), Budapest June 26-27, 2003.
Brown, C.V. and Jackson, P.M. (1990): Public Sector Economics. 4th edition. Blackwell, Cambridge.
Buchta, S (1998) Regionalisation of Slovakia and Labour Market, Zemĕdĕlská Ekonomika, 44 (5)
CADSES ex-post evaluation Interreg IIC.
Cantero, E.M. and Lezama, J.D. (2003) Ex-Ante Evaluation of SPD for Malta, (Quasar, S.A.: Investigaciones y Asistencia Ténica)
Carter, F.W. and Turnock, D. (1993) Environmental Problems in Eastern Europe Routledge
CEC (1999) Council Regulation (EC) No. 1260/1999 of 21 June 1999 laying down general provisions on the Structural Funds (Official Journal L161/1, 26.06.1999).

LXXXVI
CEC (1999) The New Programming period 2000-2006: methodological working papers CEC Brussels, http://europa.eu.int/comm/regional_policy/sources/docoffic/working/doc/exante_en.pdf
CEC (2002) Communication from the Commission to the Council and the European Parliament Road Maps for Bulgaria and Romania, CEC Brussels, http://europa.eu.int/comm/enlargement/docs/pdf/roadmap-br-ro-2002_en.pdf
CEC (2002) Enlargement and Agriculture: Successfully integrating the new Member States into the CAP – Issues Paper CEC, DG Agriculture: Brussels, http://europa.eu.int/comm/enlargement/docs/financialpackage/sec2002-95_en.pdf,
CEC (2002) Towards a European Research Area Key Figures 2002: Science, Technology and Innovation, CEC: DG Research ftp://ftp.cordis.lu/pub/indicators/docs/ind_kf2002.pdf
CEC (2003) Report on the results of the negotiations on the accession of Cyprus, Malta, Hungary, Poland, the Slovak Republic, Latvia, Estonia, Lithuania, the Czech Republic and Slovenia, CEC Brussels, January to the European Union
CEC (2003): The mini ISPA report 2000-2002, Brussels, 25.03.2003 http://europe,eu,int/comm/regional_policy/funds/ispa/pdf/mini_en.pdf
CEC (2004) Commission signs off economic and social development programmes for the new Member States Brussels, 23 June 2004, http://europa.eu.int/rapid/pressReleasesAction.do?reference=IP/04/778&format=HTML&aged=0&language=EN&guiLanguage=fr
Central Statistic Office - Poland, Statistic Office in Wrocław (1999): “Euroregions in new regional division in Poland”.
Centre for Strategy and Evaluation Services (2003): Ex Ante Evaluation of the Lithuanian Objective 1 Programme.
Červený, M and Andrl, A (2000) ‘Czech Republic’ in Bachtler, J, Downes, R and Gorzekal, G (Eds) Transition, Cohesion and Regional Policy in Central and Eastern Europe, Ashgate Publishers, Aldershot.
Committee for European Integration, Poland (2003) Integrated Operational Programme for Regional Development [ZPORR] 2004-2006 Warsaw, February 2003.
Council of Ministries of Poland (2003) Poland: National Development Plan 2004-2006, Warsaw 14/1/03.
Council of the European Union (2000). Council Regulation (EC) No 555/2000. March 13, 2000.
Derenbach, R. (2002): The European Human Capital and the Regions. An empirical contribution for the debate on human capital and regional development in the EU Member states and accession countries.
Development strategy of Mazowieckie voivodship, 2002, Marshall Office.
Development strategy of Śląskie voivodship, (document accepted by Board of Ślaskie Voivodship in 2000), available on the website: www.silesia-region.pl, 2003.
Dornbusch, R. and Fischer, S. (1989): Makroökonomik. 4th edition. Oldenbourg. (English Version: Macroeconomics. McGraw-Hill, New York.)
Eckart, K. et al. (2003): Social, Economic and Cultural Aspects in the Dynamic Changing Process of Old Industrial Regions. In: Eckart, K.; Kowalke, H. and Mazeland, J. (eds.): European Regions, No.1, LIT, Münster.
LXXXVII
EPRC (2003) EU Enlargement, Structural Funds and the implications for Greece, Report to the Ministry of National Economy, Greece, European Policies Research Centre, Glasgow.
European Commission (1991): Die Regionen in den 90er Jahren. Brussels.
European Commission (1995) Europa 2000+: cooperation for the European spatial planning.
European Commission (1997): 1st reference and Tacis Interim Evaluation, Synthesis report, July 1997.
European Commission (1997-2003) Regular Reports (all Candidate Countries), European Commission: Brussels
European Commission (2000): Community Initiative INTERREG II 1994-1999: An initial evaluation, January 2000.
European Commission (2000): Ex-ante evaluation and indicators for INTERREG (strand A&B), the new programming period 2000-2006, October 2000.
European Commission (2001). Accession Partnership – Malta. November 13, 2001.
European Commission (2001): The PHARE Programme. Annual Report 2000.
European Commission (2003) Phare ex post evaluation of country support implemented from 1997–1998 to 2000–2001, carried out by a private consortium consisting of PLS RAMBØLL Management (Denmark) and Eureval-C3E (France). http://europa.eu.int/comm/enlargement/phare_evaluation_pdf/consolidated_summary_uk_9_may_color.pdf
European Commission (2004): From Pre-Accession to Accession. Thematic Evaluation of PHARE Support Allocated in 1999-2002 and Implemented until November 2003 - Cross-border Cooperation.
European Commission, (2004) Towards a new Cohesion for Europe: Convergence and Competitiveness and Cooperation: Third Cohesion Report European Commission: Brussels.
European Commission’s homepage for enlargement: http://europa.eu.int/comm/enlargement//malta/index.htm
EUROREG et al. (2003): Technical Assistance to the Phare CBC Implementing Authority to perform an independent evaluation of the achievements of the completed 1994 - 1999 CBC Programmes, and to develop proposals for incorporating programme level Indicators of Achievement within Phare CBC, consistent with the methodology used in programming EC Structural Funds. Final Report. Warsaw.
EUROSTAT (2003) A selection of Environmental Pressure Indicators for the EU and Acceding countries 2003 EDITION Luxembourg: Office for Official Publications of the European Communities 2003.
EUROTECH et al (2003) Evaluation of SPD for Objective 2, Republic of Cyprus - Planning Bureau November 2003.
Evaluation of Archimed pilot action.
Ferry, M. and McMaster I (2003) Implication of EU Regional Assistance Programmes in Moravia-Silesia and Upper Silesia, in S. Smith and M. Myant (eds) EU Accession, Regional Policy, Social and Economic Development in East Central Europe European Studies Occasional Paper(New Series) Number 2003/03 PBS Working Paper Series Number 2003/03 http://www.paisley.ac.uk/business/cces/downloads/smithmyant.pdf
Ferry, M. (2001) 'Local Government Reform in Poland', Strathclyde Papers on Government and Politics, No. 117.

LXXXVIII
Ferry, M. (2004) Regional Policy In Poland on the Eve of EU Membership: Regional Empowerment or Central Control? European Policy Research Paper, No. 23, EPRC, University of Strathclyde, Glasgow.
Financial Times, (2003) New Members’ Tax Rules ‘Harmful’ to EU, Financial Times 21 July
Financing Memorandum for INICJATIVE II programme
Fraser Associates (2004) Government of Romania, Ministry of European Integration, Ex-Ante Evaluation of the NDP 2004-2006, January.
Gorzelak G. (1996) The Regional Dimension of Transformation in Central Europe, Jessica Kingsley.
Gorzelak,G. (2001) Regional Development in Central Europe and European Integration, Informationen zur Raumentwicklung Heft 11, p744
Government of Latvia, (2002) Latvia Strategy for Sustainable Development of Latvia, approved by the Cabinet of Ministers of the Republic of Latvia on 13 August 2002, Riga 2002.
Government of Poland (2000) Narodowa Strategia Rozwoju Regionalnego (NSRR) 2001-2006 Adapted by the Polish government 28/12/00.
Government of Romania Romania National Programme for Accession of Romania to the European Union (June 2001) http://www.mie.ro/english/mie.htm.
Government of the Czech Republic (1999) Position Paper of the Czech Republic on Chapter 21: Regional Policy and Co-ordination of Structural Investments.
Government of the Republic of Lithuania (1999). Preliminary National Plan of Social and Economic Development for 2000-2002. October 1999.
Government of the Republic of Lithuania (2001). National Development Plan 2002-2004. October 2001.
Government of the Republic of Lithuania, European Committee (2000) Lithuania’s EU Accession Programme, May 2000, http://www.euro.lt/
Government of the Republic of Lithuania, European Committee (2001) Lithuania’s Quarterly Progress Report toward Accession to the EU, October 2001, http://www.euro.lt/
Growth and development strategy - “Viadrina 2000”, 1999, Euroregion Pro Europa Viadrina.
Herz, B. and Vogel, L. (2003): Regional Convergence in Central and Eastern Europe: Evidence from a Decade of Transition. In: Wirtschaftswissenschaftliche Diskussionspapiere, Bayreuth University, Faculty for Law and Economics, No.13-03.
http://europa.eu.int/comm/enlargement/pas/phare/programmes/multi-bene/
http://europa.eu.int/comm/enlargement/phare_evaluation_pdf/consolidated_summary_uk_9_may_color.pdf
http://www.nyirnet.hu/fejlesztesi/ (Szabolcs-Szatmár-Bereg county Regional Development Council and Regional Development Agency)
Ianos, I (2000) ‘Romania’ in Bachtler, J, Downes, R and Gorzelak, G (Eds) Transition, Cohesion and Regional Policy in Central and Eastern Europe, Ashgate Publishers, Aldershot
Illner, M. (2002) ‘Thirteen Years of Reforming Subnational Governments in the Czech Republic’ paper presented at Conference’ Reforming Local Government: Closing the Gap Between democracy and Efficiency, 26-27 September 2002, University of Stuttgart. http://www.uni-stuttgart.de/soz/avps/rlg/papers/CZ-Illner.pdf

LXXXIX
Inforegio news (2004) A New Partnership for Cohesion: Convergence, Competitiveness and Co-operation, News letter, March 2004, No. 120.
Information for the Council of Ministers about programmes for alleviation of employment restructuring costs in Slaskie and Malopolskie regions, available on the website: www.mg.gov.pl, 2003.
Information on Spatial Development Plan of Śląskie Voivodship, available on the website: www.silesia-region.pl, 2003.
Institute for Economic Research (2001) Ex-Ante Evaluation of the National Development Plan 2001-2004 Slovenia.
Jauhianen, J S (2000) Regional Development and Regional Policy European Union and the Baltic Sea Region, University of Turku, Centre for Extension Studies.
Jeffrey, C. (1997) The Regional Dimension of the European Union: Towards a Third Level in Europe? (London: Frank Cass), Börzel, T. (1999) ‘Towards Convergence in Europe? Institutional Adaptation and Europeanisation in Germany and Spain’ Journal of Common Market Studies , Vol. 37. No 4 pp. 573-96.
Joint Programming Document. Regionalprogramm INTERREG IIIA –Phare CBC II 2000-2006 (zur Entwicklung des deutsch – polnischenGrenzraumes des Landes Brandenburg und der Wojwodschaft Lubuskie).
Kára, J (1994) ‘New Czech regional Policy’, in Dostál, P, Illner, M, Kára, J and Barlow, M (Eds) Changing Territorial Administration in Czechoslovakia: International Viewpoints, Universiteit van Amsterdam, Amsterdam.
Karnite, R. (2000) ‘Latvia’ in: Bachtler, J, Downes, R, And Gorzelak, G, (Eds) Transition, Cohesion and Regional Policy in Central and Eastern Europe, Ashgate Publishers, Aldershot.
Kovács T. (2001) Rural development in Hungary Centre for Regional Studies of the Hungarian Academy of Sciences Discussion Papers no. 34.
Kujath, H.J.; Kunkel, K.; Zillmer, S. et.al. (2003): Pre-accession Aid Impact Analysis. 2nd Interim Report to ESPON Project 2.2.2. http://www.espon.lu/online/documentation/projects/policy_impact/697/2.ir-2.2.2.pdf
Kujath, H.J.; Zillmer, S. et.al. (2003): Pre-accession Aid Impact. 1st Interim Report to ESPON Project 2.2.2. http://www.espon.lu/online/documentation/projects/policy_impact/697/1.ir-2.2.2.pdf
Lorentzen, A. (2001) Institution Building in Regional Development, Business Development and Innovation in Poland After 1989, Regional Studies Association Conference, Gdańsk, September 2001.
Lovering J. (1999) ‘Theory Led by Policy: the Inadequacies of the ‘New Regionalism (Illustrated from the Case of Wales)’, International Journal of Urban and Regional Research, 23 (2) pp. 379-90.
Mack, R.S. and Jacobson, D.S. (1996): core periphery analysis of the European Union: a location quotient approach. In: The Journal of Regional Analysis & Policy, Vol.26, No.1, pp.3-21.
Malta-EU Information Centre. Aggornat Special edition. Negotiations on Gozo. February 2003, http://www.mic.org.mt/AGGORNAT/special_edition/AGGSE18e_Gozo.pdf
Malta-EU Information Centre. Aggornat. Negotiations on EU funds. October 2002, http://www.mic.org.mt/AGGORNAT/special_edition/AGGSE18e_Gozo.pdf
Malta-EU Information Centre. Malta’s Negotiation Position Papers, Chapter 21: Regional Policy and Co-ordination of Structural Instruments, http://www.mic.org.mt/Malta-EU/position_papers/chap_21.htm

XC
Martin, D. and Schmeitz, P. (2002): Was ist territorialer Zusammenhalt?, Arbeitspapier im Rahmen der AG „Raum- und Stadtentwicklung“ des EU-Ausschusses für die Entwicklung und Umstellung der Regionen, unveröffentlichtes Manuskript, Brussels.
Mayhew, A. (2000) Financial and Budgetary Implications of the Accession of Central and East European Countries to the European Union SEI Working Paper No. 33, Sussex European Institute, University of Sussex, March.
McMaster I (2001) National Background Reports, Report for international conference 'Benchmarking Regional Policy in Europe', Forest Hills Hotel, Loch Ard, 9-12 September 2001.
McMaster I (2004) From Regional Deficit to Institutional Overload? - Regional Policy in the Czech Republic, European Policy Research Paper, No. 22, EPRC, University of Strathclyde, Glasgow. http://www.eprc.strath.ac.uk/eprc/publications_downloads.htm
McMaster I and Ferry M (2003) Regional Governance in Industrial Regions in Central and Eastern Europe: Case Study of Moravia Silesia, Paper presented at RSA Conference - 'Reinventing Regions in a Global Economy', Pisa, April 2003.
Mid-Term Evaluation INTERREG IIIB Alpine Space Programme 2000-2006, Final Report, 22th December 2003.
Miller, M.M.; Gibson, L.J. and Wright, N.G. (1991): Location Quotient: A Basic Tool for Economic Development Analysis. In: Economic Development Review, Spring, Vol.9, No.2, pp. 65-68.
Ministry of Construction and Regional Development of the Slovak republic (2003) National Development Plan of the Slovak Republic (draft), Bratislava, March 2003.
Ministry of Economy, Labour and Social Policy, Poland, Integrated Regional Operational Programme 2004-2006 (Draft revised after negotiations of CSF), Warsaw, 01 December 2003.
Ministry of Environment of the Slovak Republic (2001) Slovakia Spatial Development Perspective 2001 (KURS 2001).
Ministry of Environmental Protection and Regional Development of the Republic of Latvia, Public Annual Report 1999, Riga. http://www.varam.gov.lv/varam/Publikacijas/gada_parsk/Eparsk.htm
Ministry of Finance of Lithuania (2000). Position paper of the Republic of Lithuania on chapter 21, Regional policy and co-ordination of Structural Instruments. http://www.finmin.lt/engl/tarpt/posit21.htm
Ministry of Finance of Estonia (2003). Estonian National Development Plan - Single Programming Document 2003-2006. http://www.fin.ee/index.php?id=5119.
Ministry of Finance of Latvia Draft Single Programming Document 2004 – 2006.
Ministry of Foreign Affairs of Bulgaria (2000) Bulgaria’s National Programme for the Adoption of Acquis http://www.mfa.government.bg
Ministry of Foreign Affairs of the Czech Republic, National Programme for the Preparation of the Czech Republic for Membership of the European Union (http://www.mzv.cz/EU/en/docs/np99.html)
Ministry of Foreign Affairs of The Republic of Latvia (2000) Position paper of the republic of Latvia Chapter 21: regional policy and structural instruments, http://www.mfa.gov.lv/eng/policy/eu/chapter21.htm
Ministry of Internal Affairs of Estonia (1999) Regional Development Strategy of Estonia. November 1999.

XCI
http://www.erda.ee/english/pdf_english/Estonian_Regional_Development_Strategy.pdf.
Ministry of Internal Affairs of Estonia (1994) Guidelines for regional policy, Department of Local Government and Regional Development.
Ministry of Internal Affairs of Estonia (2001). Strategy of the local government administrative reform. January 2001. http://www.sisemin.gov.ee/atp/doc.php?927
Ministry of Internal Affairs of Estonia (2002). The Structure and Operation of Local and Regional Democracy in Estonia. Situation in 1999. http://www.sisemin.gov.ee/atp/doc.php?932
Ministry of Regional Development (1999) Preparation of the Czech Republic for the Implementation of EU Cohesion Policy from the Year 2000. Structural Funds Series 5/99.
Ministry of Regional Development of the Czech Republic (2000) Strategie regionálního rozvoje, České Republiky.
Ministry of Regional Development of the Czech Republic (2001) Národní Rozvoyový Plán, České Republiky.
Ministry of the Environment – Estonia (2000): Estonian National Environmental Action Plan 2001-2003 (NEAP). http://www.envir.ee/eng/neap.html
Ministry of the Environment – Estonia (2000): Estonian National Environmental Strategy (NES). http://www.envir.ee/eng/strategy.html
Ministry of the Environment of Estonia (2000). English summary of National Spatial Plan ESTONIA 2010, http://www.envir.ee/planeeringud/e2010en.html.
Ministry of the Environment, Spatial Planning and Energy of Slovenia (2003): Setting Up the New Spatial Planning System – National Spatial Planning Documents I.
Ministry of the Environment, Spatial Planning and Energy of Slovenia (2003): Spatial Planning Act. Unofficial Translation.
Ministry of the Environment, Spatial Planning and Energy of Slovenia (2003): Spatial Planning System in Slovenia. Prepared by Margarita Jančič, www.gov.si/mop/
Ministry of the Interior of Lithuania (2000) National Development Plan 2001-2003 of the Republic of Lithuania, November 2000.
Monitor Polski (2001) Koncept of National Spatial Arrangement Policy („Koncepcja Polityki Przestrzennego Zagospodarowania Kraju”) Monitor Polski No 26 Warsaw item 432 of August 16th, 2001.
Monitoring reports on INITIATIVE II programme, prepared by the Polish Agency for Enterprise Development for Sectoral Monitoring Subcommittees Meetings, 2003.
Munoz, E. (2001): Roles of regional, national and European policies in the development and catching up of Less Favoured Regions. In: Working Paper, Grupo de Ciencia, Tecnologia y Sociedad (CSIC), No. 01-11, Madrid.
National Agency for Regional Development (NARD), Republic of Slovenia (1999): White Paper on Regional Development Strategy. Ljubljana.
New Voivodships. Facts, opinions, attitudes, Polish Agency for Regional Development & CBOS, Warsaw 2001.
OECD (1996) Regional Problems and Disparities in the Czech Republic and Slovak Republic, Paris, OCED.
ÖIR – Managementdienste GmbH (2003) Ex-ante Evaluation of the National Development Plan, Office of the National Development Plan and EU Support NOVEMBER 2003.

XCII
Pavel Karasz, Economic Consulting (2003) Ex Ante Evaluation of the National Development Plan of the Slovak Republic.
Phare Project (LE000.12.01) ( 2003) Final Report of the Ex-Ante Evaluation of the Sungle Programming Document of Latvia.
Pilot action under Art. 10 Archi-Med Central and Eastern Mediterranean Space, Greece-Italy, Final Report, June 2002.
Planning and Priority Coordination Directorate, Office of the Prime Minister of Malta (2003). Malta Single Programming Document 2004-2006.
Planning and Priority Co-ordination Directorate. Quarterly Reports from the project Twinning Project Malta-Balearic Islands. http://www.ppcd.gov.mt/english/main.htm
PLS RAMBØLL Management and Eureval-C3E (2003) Phare Ex-Post Evaluation, DG Enlargement.
PLS/RAMBOLL Management A/S (2003): Mid-term evaluation of Baltic Sea Region INTERREG IIIB Programme. Final report.
Polverari L and Bachtler J (Forthcoming) La dimensión territorial de la cohesión económica y social: política regional y planificación territorial en Europa in Joan Romero González and Farinós Dasí Joaquín (Eds.) El Gobierno de los territorios.
Polverari L and Rooney ML with Bachtler J, McMaster I, Raines P, Böhme K and Mariussen A (2001) The Spatial and Urban Dimensions in the 2000-06 Objective 1 Programmes, Report to DG XVI of the European Commission, Brussels.
Preliminary report on the implementation of individual projects within INICJATIVE II programme, Krzysztof Hofman, Polish Agency for Enterprise Development, 2003.
Raagmaa, G. et al. (2002) Ex-Ante Evaluation of the Estonia National Development Plan, SPD 2003-2006.
Reports on the implementation of the INITIATIVE II programme, prepared by the Polish Agency for Enterprise Development, 2003.
Republic of Estonia (2002) ISPA Strategy Paper for the environment sector.
Republic of Malta (2004). Malta Objective 1 Structural Funds Interventions 2004-2006. Programme Complement to the Single Programming Document, 23rd January 2004.
Republic of Malta, Ministry Of Foreign Affairs (2002). National Programme for the Adoption of the Acquis (NPAA). Final Draft. January 2001.
RETI (2000) Candidate Country Profile – Bulgaria, Panorama Handbook http://www.association-reti.org/panorama/Countryrep/Bulgaria.doc
RETI (2000) Candidate Country Profile – Latvia, Panorama Handbook http://www.association-reti.org/panorama/Countryrep/Latvia.doc
Rollo, J. (1998), Economic Aspects of EU Enlargement, in: M. Maresceau (ed.), Enlarging the European Union: Relations Between The EU and Central and Eastern Europe, Longman, London, pp. 252-275.
Rooney ML and Polverari L with McMaster I, Michie R, Raines P and Taylor S (2001) The Spatial and Urban Dimensions in the 2000-06 Objective 2 Programmes, Report to DG XVI of the European Commission, Brussels.Fehler! Hyperlink-Referenz ungültig.
RWI/EPRC (2000), Impact of the Enlargement of the European Union on Small and Medium-sized Enterprises in the Union Final Report to the European Commission DG Enterprise.
Smetkowski, M. (2002), Polish Special Economic Zones as an Instrument of Regional and Industrial Policy, Warsaw University.

XCIII
Spiridonova J and Grigorov, N. (2000) ‘Bulgaria’ in Bachtler, J, Downes, R, and G Gorzelak (Eds) Transition, Cohesion and Regional Policy in Central and Eastern Europe Ashgate Publishers, Aldershot.
Standard Summary Project Fiche for INITIATIVE II programme – annex to Financing Memorandum 1999.
Standard Summary Project Fiche for INITIATIVE III programme– annex to Financing Memorandum 2003.
State Aid Office of the Slovak Republic (2003): Informative package on State Aid.
Statistical yearbook of the lubuskie voivodship, 2002, Central Statistical Office (GUS).
Statistical yearbook of the mazowieckie voivodship, 2002, Central Statistical Office.
Statistical yearbook of the regions – Poland, Central Statistical Office, years 2000 – 2003.
Sýkora, L. (1999) ‘Regional Policy and Planning in Transition States of East Central Europe’. in Balchin, P, Sýkora, L and Bull, G. (Eds) Regional Planning and Policy in Europe, Routledge, London.
Taylor S. and Raines. P. (2001) Implementing Cohesion Policy and the Pre-Accession Instruments, Paper presented at Benchmarking Regional Policy Senior Regional Policy Maker Conference, Forest Hills Loch Ard Scotland 9-12 September 2001.
The Enlargement Process and the three pre-accession instruments: Phare, ISPA, Sapard Proceedings of the conference organised by DG Enlargement and the Permanent Representations of Sweden and Austria to the European Union on 5 th March 2001. http://europa.eu.int/comm/enlargement/pas/phare/pdf/bro-phare-ispa-sapard-2.pdf
The INTERREG EU initiative "Euroregion Pro Europa Viadrina, 2001.
United Nations (2000) Lithuania’s Human Development Report. United Nations.
Vilkas, E. (2000) ‘Lithuania’ in Bachtler, J, Downes, R and Gorzelak, G (Eds.) Transition, Cohesion and Regional Policy in Central and Eastern Europe Ashgate Publishers, Aldershot.
Voivodship Contract (contract concluded between Polish Government and Board of Ślaskie Voivodship), available on the website: www.silesia-region.pl, 2003.
Vovivodship Contract for Lubuskie Region, Warsaw 19 June 2001.
Vovivodship Contract for Mazowieckie Region, Warsaw 19 June 2001.
Wishlade, F. (2003) Regional Aid Control after 2006: the Forces of Change paper presented to the EoRPA Consortium Annual Meeting University of Strathclyde: Ross Priory, October 2003.
Wishlade, F. Yuill, D. et al. (1996) Economic and Social Cohesion in the European Union: The Impact of Member States’ Own Policies Report to the European Commission (DGXVI).
www.euroregion-viadrina.de
www.viadrina.org.pl
Yuill D and McMaster I (2001) Benchmarking Regional Policy in Europe: National Regional Policies, Report for international conference 'Benchmarking Regional Policy in Europe', Forest Hills Hotel, Loch Ard, 9-12 September 2001.
Yuill, Douglas (ed.), (2003) “A Country by Country Review of Recent Regional Policy Developments in the Member States and Norway: Changes in 2002-03”, EPRC, 2003.

XCIV
Zillmer, S. (2002): Arbeitsangebotsverhalten im Transformationsprozess – Eine empirische Analyse des polnischen Agrarsektors. In: Institutional Change in Agriculture and Natural Resources, Vol.9, Shaker, Aachen.
Zillmer, S. (2003): Regional Structural Developments in Selected Polish Regions. In: IRS Working Papers, October, http://www.irs-net.de/download/WP_Zillmer.pdf
ESPON Projects
Nordregio - Nordic Centre for Spatial Development et al. (2003): The role, specific situation and potentials of urban areas as nodes in a polycentric development. ESPON project 1.1.1., http://www.espon.lu/online/documentation/projects/thematic/1091/3-ir.1.1.1_part_1.pdf
Swedish Institute for Growth Policy Studies, ITPS, et al. (2004) The Spatial Effects of Demographic Trends and Migration ESPON project 1.1.4., http://www.espon.lu/online/documentation/projects/thematic/thematic_75.html
University of Tours et al. (2004) Transport Services and Networks: Territorial Trends and Basic Supply of Infrastructure and Infrastructure for Territorial Cohesion, ESPON Project 1.1.2. http://www.espon.lu/online/documentation/projects/thematic/thematic_17.html
Christian Albrecht University of Kiel, Institute of Regional Research, et al. (2004) Territorial Impact of EU Transport and TEN Policies, ESPON project 2.2.1., http://www.espon.lu/online/documentation/projects/policy_impact/index.html
ECOTEC Research and Consulting Ltd., (2004) Territorial Impact of EU Research and Development Policy Development ESPON Project 2.1.2, http://www.espon.lu/online/documentation/projects/policy_impact/policy_impact_20.html
University of Aberdeen, Arkleton Centre for Rural Development Research et al. (2004) The Territorial Impact of CAP and Rural Development Policy, ESPON Project 2.1.3.http://www.espon.lu/online/documentation/projects/policy_impact/policy_impact_21.html
Nordregio - Nordic Centre for Spatial Development et al. (2004) Territorial Effects of the Structural Funds, ESPON project 2.2.1, http://www.espon.lu/online/documentation/projects/policy_impact/policy_impact_62.html


