Contents lists available at SciVerse ScienceDirect
Pedobiologia - International Journal of Soil Biology
jo u rn al homepage: www.elsev ier .de /pedobi
re- and post-glacial diversifications shape genetic complexity of soil-livingicroarthropod species
artin Rosenberger, Mark Maraun, Stefan Scheu, Ina Schaefer ∗
eorg August University Göttingen, J.F. Blumenbach Institute of Zoology and Anthropology, Animal Ecology, Berliner Strasse 28, 37073 Göttingen, Germany
r t i c l e i n f o
rticle history:eceived 30 August 2012eceived in revised form2 November 2012ccepted 13 November 2012
eywords:ribatidaenetic diversityryptic refugia
s u m m a r y
Pleistocene glaciations forced many aboveground animals and plants to retreat to refugia in southernEurope from where central and northern Europe was recolonized during the present warm period. How-ever, it is not clear if patterns of aboveground species also apply to species of the belowground system.Here, we use a mitochondrial (COI) and a nuclear marker (ef 1-˛) to investigate genetic diversity and phy-logeographic structure of the wide-spread soil-living oribatid mite Steganacarus magnus (Nicolet, 1855)(Acari, Oribatida) in Europe. Phylogenetic and haplotype network analyses, diversity indices, genetic dis-tances and AMOVA showed that genetic diversity of the COI gene was very high (32% and 5% at nucleotideand protein level, respectively); analysis of ef 1-˛ with a subset of 26 individuals supports the existenceof distinct genetic lineages within Europe. Individuals from Asia contributed only marginally to the high
iome changeleistocenece-age
genetic distances indicating that major diversifications among lineages originated in Europe. The studyshows that pre-glacial diversification events dominate in this species and that major radiations occurredin the Miocene or earlier (>20 mya). However, post-glacial recolonization of central Europe also occurred,and the assembly of genotypes suggests that individuals survived in multiple cryptic refugia. Overall, theresults indicate that in S. magnus and presumably also in other soil miccroarthropods pre- and post-glacial
form
lineages co-occur thereby
ntroduction
Climatic changes during the past 2.6 million years caused con-iderable range shifts in species’ distributions in the northernemisphere. This led to contractions and expansions in popula-ion sizes in both warm and cold adapted species. The effects ofleistocene glaciations on species’ diversity have been investigatedntensively for animals and plants of aboveground and freshwaterabitats (Beheregaray 2008). For most investigated species thesetudies found populations in southern Europe to be geneticallyiverse whereas those in northern Europe to be genetically homo-eneous, a pattern depicted by the phrase “southern richness andorthern purity” (Hewitt and Ibrahim 2001). Molecular data sup-ort the hypothesis that most taxa retreated to southern refugiauring cold phases, whereas populations expanded rapidly intoigher latitudes with post-glacial climatic warming (Hewitt and
brahim 2001). The Iberian Peninsula, Italy, Greece and the Balkansre assumed to represent the major refuge areas into which species
etreated and survived the hostile Pleistocene climate in central andorthern Europe.
Radiocarbon (Stewart and Lister 2001), pollen (Willis et al. 2000)and molecular data (Pfenninger et al. 2003; Verovnik et al. 2005)indicate that isolated areas in central and northern Europe alsoacted as refugia for temperate organisms, thereby extending theview on classical refugia. These cryptic refugia (Stewart and Lister2001; Provan and Bennett 2008) are difficult to detect as theypresumably were small, geographically isolated, located in windprotected valleys or on ice free Nunataks (Schmitt 2009). Crypticrefugia resemble islands with favourable climatic conditions allow-ing species to survive outside their southern refugia (Stewart andLister 2001; Stewart et al. 2010). Expansions and contractions ofpopulations into refugia had consequences for species-level evo-lution and significantly affected the genetic constitution of species(Stewart et al. 2010). Therefore, understanding the contribution ofcryptic refugia during glacial and interglacial phases is importantfor present day concepts of speciation, biodiversity and intraspe-cific variance of species of the northern hemisphere.
The oribatid mite species Steganacarus magnus (Nicolet, 1855)(Acari, Oribatida) is an excellent model organism to investigatethe existence of cryptic refugia in central and northern Europe. Itis a soil-living microarthropod with Palaearctic distribution; North
American records (Marshall et al. 1987) are considered erroneous(R.A. Norton, pers. communication). This species has low dispersalability (Salomone et al. 2002) and occurs ubiquitously in forestlitter in Europe (Weigmann 2006) but densities vary depending
80 M. Rosenberger et al. / Pedobiologia 56 (2013) 79– 87
ntral E
ooKpcl1m(wgmaw−−sosdbiilht
oEis
Fig. 1. Sampling locations of Steganacarus magnus (a) on Tenerife, in ce
n soil type and humidity (Maraun and Scheu 2000). The life-cyclef S. magnus takes more than 1 year (Webb and Block 1993;aneko 1988) and for development S. magnus requires decom-osing wood or other lignified plant tissue (e.g., leaf petioles,ones scales or seed cupules), since larval stages and nymphsive endophagous in coniferous needles or leave petioles (Norton994). The dependence on host plants is rather unspecific as S.agnus predominantly feeds on dead organic material and fungi
Schneider and Maraun 2005; Pollierer et al. 2009), i.e., resourceshich were omnipresent in central and northern Europe during
lacial periods. This implies that during glacial phases S. magnusay have persisted in geographically isolated areas in which toler-
ble climatic conditions and dead organic matter as food resourceere present. Adults and juveniles may survive temperatures of14 ◦C and the super-cooling point for this species is between7 ◦C and −38 ◦C (Webb and Block 1993). Tolerance against food
hortage, low temperatures, drought and heat is common amongribatid mites (Siepel 1996; Konestabo et al. 2007), and likelyupported survival in northern glacial refugia. However, its naturalistribution shows that S. magnus is not particularly cold-adaptedut possesses a broad temperature tolerance. Also important for
ts suitability as model organism for inferring cryptic refugia ists small body size (∼1.2 mm). Small-bodied organisms are moreikely to survive in cryptic refugia as the carrying capacity of theabitat is higher than for large species, allowing large populationso persist in small habitat patches (Stewart et al. 2010).
We analysed intraspecific genetic diversity of cytochrome
xidase I (COI) of 180 individuals of S. magnus from 44 sites acrossurope and three sites in Eurasia. As genetic diversity is highestn former refuge areas, we expected central refugia to be repre-ented by populations with high genetic distances, high haplotype
urasia and east China and (b) in Europe. For details see Table 1 and S1.
diversity and the presence of distinct haplotypes in populationsnorth of the Alps that are not related to southern Europeanpopulations. To corroborate the genetic structure based on themitochondrial COI gene, the nuclear gene elongation factor 1−˛(ef 1-˛) was sequenced from 26 of the 180 individuals from elevencountries throughout Europe. Sampling in central Europe wasextensive to detect cryptic refugia, which have been proposed toexist in central and northern Europe (Stewart and Lister 2001;Tollesfrud et al. 2008). From the extensive dataset we infer possiblemigration routes from southern refugia into habitats of central andnorthern Europe.
Material and methods
Sampling, DNA amplification and sequence analyses
Leaf litter and the upper soil layer were collected from shadedand humid locations in forests at 44 locations in Europe, two loca-tions in Russia (east of the Ural Mountains), and one locationin China (Fig. 1, Table 1). Animals were extracted by heat from1 to 3 kg of freshly collected litter and soil material (Macfadyen1961; Kempson et al. 1963), collected in water and transferred into75% ethanol. Animals were identified under a stereomicroscope(Weigmann 2006) and stored at −20 ◦C until further preparation.In total, we analysed 180 individuals from 20 different countries.
Genomic DNA was extracted from single individuals using theDNeasy® Blood and Tissue Kit (Qiagen; Hilden, Germany) follow-
ing the manufacturer’s protocol. Washed DNA was eluted in 30 �lbuffer AE. Two genes were amplified, a ∼600 bp fragment of themitochondrial cytochrome c oxidase subunit I (COI, 180 individ-uals) using the primers COIarch1 (5′-GGT TCA ACA AAT CAT AAA
M. Rosenberger et al. / Pedobiologia 56 (2013) 79– 87 81
Table 1Sampling information of Steganacarus magnus with country, abbreviations of sampling locations, individuals and genes used in this study. Diversity indices of populationswith >2 individuals [number of singletons (Ns); number of haplotypes (Nh); haplotype diversity (Hd)] are listed and populations with >120 singletons are marked ingrey. For GenBank accession numbers, location numbers (ln) and details of all sampling sites (location name and coordinates) see Fig. 1 and Supplementary materialTable S1.
ln country loca tion individu als gene Ns Nh Hd ln country loca tion individu als gene Ns Nh Hd
1 Austria A_1 SM_A_1 .1-2 COI 0 1 0 25 Grea t Britain GB_3 SM_G B_3 .1-3 COI 5 2 0.67
2 China CHIINA_1 SM_CHINA_1 .1-2 COI 0 1 0 26 Hu ngary HUN_1 SM_H UN_1 .1 COI - - -
3 Czec h Repu bli c CZ_1 SM_CZ_1 .1-5 COI 132 4 0.9 27 Ir eland IRL_1 SM_IRL_1 .1-2 COI 2 2 1
SM_CZ_1 .1, 2 EF 28 Italy I_1 SM_I_1 .1-10 COI 2 4 0.711
4 Denmark DK_1 SM_D K_1 .1-3 COI 136 3 1 SM_I_1 .4-7 EF5 DK_2 SM_D K_2 .1-5 COI 0 1 0 29 I_2 SM_I_2 .1-4 COI 11 4 1
6 DK_3 SM_D K_3 .1-3 COI 6 2 0.67 30 Netherlands NL_1 SM_N L_1 .1-3 COI 8 3 1
7 DK_4 SM_D K_4 .1-3 COI 1 2 0.67 31 Norway N_1 SM_N_1 .1-3 COI 139 2 0.67
8 Finland FIN_1 SM_FIN_1 .1-3 COI 3 2 0.67 32 Poland PL_1 SM_PL_1 .1-6 COI 7 6 1
9 FIN_2 SM_FIN_2 .1 COI - - - SM_PL_1 .1, 5 EF10 France F_1 SM_F_1 .1-6 COI 138 3 0.6 33 PL_2 SM_PL_2 .1-3 COI 15 2 0.67
11 F_2 SM_F_2 .1-4 COI 2 3 0.833 34 Romania RUM_1 SM_RUM_1 .1-3 COI 2 2 0.67
SM_F_2 .1 EF 35 RUM_2 SM_RUM_2 .1-4 COI 9 4 1
12 F_3 SM_F_3 .1-5 COI 68 4 0.9 36 RUM_3 SM_RUM_3 .1-4 COI 18 2 0.5
13 F_4 SM_F_4 .1-2 COI 0 1 0 SM_RUM_3 .1, 2 EF14 Germany D_1 SM_D_1 .1-14 COI 15 8 0.769 37 RUM_4 SM_RUM_4 .1-3 COI 7 3 1
SM_D .1, 13 EF SM_RUM_4 .1, 3 EF15 D_2 SM_D_2 .1-9 COI 5 4 0.417 38 RUM_5 SM_RUM_5 .1-4 COI 5 4 1
16 D_3 SM_D_3 .1-3 COI 7 3 1 39 RUM_6 SM_RUM_6 .1-3 COI 88 3 1
17 D_4 SM_D_4 .1-9 COI 63 4 0.75 40 Russ ia RUS_1 SM_RUS_1 .1-4 COI 122 4 1
SM_D_4 .3, 6-8 EF 41 RUS_2 SM_RUS_2 .1- COI 36 2 0.4,4
18 D_5 SM_D_5 .1-3 COI 140 3 0.7 42 Sweden S_1 SM_S_1 .1 COI - - -
19 D_6 SM_D_6 .1 COI - - - 43 S_2 SM_S_2 .1-3 COI 187 3 1
20 D_7 SM_D_7 .1-4 COI 36 3 0.833 44 Switze rland CH_1 SM_CH_1 .1 COI - - -
21 D_8 SM_D_8 .1-3 COI 2 2 0.67 SM_CH_1 .1 EF22 D_9 SM_D_9 .1-4 COI 9 3 0.833 45 Tenerife E_1 SM_E_1 .1-2 COI 6 2 1
23 Grea t Britain GB_1 SM_G B_1 .1-5 COI 62 4 0.9 46 E_2 SM_E_2 .1 COI - - -
1
GAo2G3Hst9ieu7dfT(eIcG(uuc
sJJJ
SM_G B_1 .2-5 EF 24 GB_2 SM_G B_2 .1-2 COI 2 2
AY ATY GG-3′) and COIarch2 (5′-TAA ACT TCA GGG TGA CCAAA AAT CA-3′) (Heethoff et al. 2007), and a ∼500 bp fragmentf the nuclear single-copy gene elongation factor 1-˛ (ef 1-˛,6 individuals) using the primers 40.71 F 5′-TCN TTY AAR TAYCN TGG GGT-3′ and 52.RC (5′-CCD ATY TTR TAN ACR TCY TG-′) (Klompen 2000) with the HotStarTaq® Mastermix Kit (Qiagen;ilden, Germany) or the SuperHot Taq Mastermix (Genaxxon Bio-
cience GmbH; Ulm, Germany), respectively. For amplification ofhe COI gene the initial activation step was extended to 15 min at5 ◦C, followed by 36 cycles of denaturation for 30 s at 95 ◦C, anneal-
ng for 60 s at 51 ◦C and elongation for 60 s at 72 ◦C, and a finallongation step for 10 min at 72 ◦C. For ef 1-˛ a two step PCR wassed with 9 cycles of denaturation for 50 s at 95 ◦C, annealing for0 s at 46 ◦C, elongation for 120 s at 72 ◦C followed by 34 cycles ofenaturation for 50 s at 95 ◦C, annealing for 70 s at 50 ◦C, elongationor 120 s at 72 ◦C and a final elongation step for 10 min step at 72 ◦C.he PCR products were purified using the QIAquick® Purification KitQiagen; Hilden, Germany) following the manufacturer’s protocol,luted in 30 �l buffer EB and sent for direct sequencing to Macrogennc. (Seoul, South Korea) or the Department of Experimental Phy-ology and Culture Collection of Algae (Georg August Universityöttingen). Nucleotide sequences were edited in Sequencher v4.9
Gene Codes; Ann Arbor, MI, USA), ambiguous sites were correctedsing the chromatograms and corrected sequences were translatedsing the invertebrate mitochondrial code for COI and the standardode for ef 1-˛, both implemented in Sequencher.
All nucleotide sequences are available at GenBank (acces-
ion numbers JF264001–JF264165, JN16398–JN162413,F264167–JF264170, JF264172, JF264173, JF264177–JF264180,F264182, JF264184–JF264191, JF264194–JF264197,F264199–JF264202, JF264204; Supplementary material Table
47 E_3 SM_E_3 .1-4 COI 12 4 1
S1). For DNA extraction animals had to be destroyed but secondaryvouchers (same morphological species, but different individualssampled from the same population) are available; these are keptin our collections at J.F. Blumenbach Institute of Zoology andAnthropology, Georg August University Göttingen.
Supplementary material related to this article can be found,in the online version, at http://dx.doi.org/10.1016/j.pedobi.2012.11.003.
Southern richness and northern purity, and detection of crypticrefugia
Standard diversity indices i.e., haplotype number (Nh), haplo-type diversity (Hd), and number of singletons (Ns) were calculatedwith DNASP v5.0 (Rozas et al. 2003). The average genetic distancewithin and between populations (uncorrected p-distances) andgeographical structure of genetic diversity among and within popu-lations were estimated with ARLEQUIN v3.01 (Excoffier et al. 2005)by analysis of molecular variance (AMOVA, 16,000 permutations);populations with less than two sampled individuals were excludedfrom the AMOVA. Estimates for population expansion (Tajima’s Dand Fu’s Fs neutrality tests) were calculated for populations withfive and more individuals in ARLEQUIN (10,000 permutations).Sampling sites of Switzerland (CH 1), Germany (D 6), Tenerife (E 2),Finland (FIN 2), Hungary (HUN 1) and Sweden (S 1) were repre-sented by a single individual and integrated only in phylogeneticanalyses and haplotype networks. Correlation between genetic dis-
tances within populations and latitude were calculated in R v2.13.2(R Development Core Team 2011); tests for significant deviationfrom the null hypothesis i.e., no correlation was done with an F-testimplemented in R.
Fig. 2. Pattern of southern richness and northern purity in European populations
TRa
2 M. Rosenberger et al. / P
hylogenetic analyses and reconstruction of migration routes
The complete mitochondrial dataset with 180 individuals andhe subsets with 26 individuals of COI and ef 1-˛ were alignedn ClustalX v1.81 (Thompson et al. 1997) using multiple align-
ent parameters: 10.0 for gap opening and 0.1 for gap extensionsor the nucleotide alignments and default settings for the proteinatasets. All alignments were gap-free and truncated to the lengthf the shortest ingroup sequence, resulting in nucleotide and pro-ein alignments with a total length for COI of 514 bp and 171 aminocids (large dataset) and 598 bp and 199 amino acids (subset with6 individuals) and of 463 bp and 153 amino acids for ef 1-˛. To
dentify monophyletic clusters in the dataset and to infer related-ess among haplotypes alternatively to the Maximum Parsimonypproach of the haplotype network construction, phylogeneticrees with Bayesian and Maximum Likelihood analyses were gen-rated in MrBayes v3.1.2 (Ronquist and Huelsenbeck 2003) and inAxML (Stamatakis 2006). In each of the analyses the oribatid mitepecies Hypochthonius rufulus Koch, 1835 and Rhysotritia duplicataGrandjean, 1953) were set as outgroup. Models of sequence evo-ution were estimated with Modeltest v3.6 (Posada and Crandall998) in PAUP* (Swofford 1999). The best-fit model based on theLRT was GTR+I+G for the large COI dataset, TVM+I+G for the COIubset and TrNef+G for ef 1-˛. Models of protein sequence evolutionere estimated in MrBayes and were mtrev for COI and Jones for ef
-˛. In MrBayes the Markov Chain Monte Carlo was run for ten mil-ion generations and sampled every 1000th generation for the largeOI dataset and with default mcmc settings for the reduced COI andhe ef 1-˛ datasets, burnin was 25% for all analyses. Accordingly, the
odels of sequence evolution in RAxML were GTRGAMMAI for allucleotide datasets, MTREV and JTT for the protein dataset of COInd ef 1-˛, respectively; all Maximum Likelihood analyses wereerformed with 1000 bootstrap replicates.
The genetic diversity among COI sequences of the oribatid mite S.agnus exceeded the connection limit of TCS (Clement et al. 2000).
herefore, parsimony based median-joining haplotype networksBandelt et al. 1999) were generated in NETWORK v4.5 (Fluxus-echnology; Suffolk, UK) with default settings.
esults
outhern richness and northern purity, and detection of crypticefugia
Overall, mean genetic distances within populations increasedith latitude i.e., from southern to northern European countries
Fig. 2). The increase deviated significantly from the null hypothe-is (no correlation) and was more pronounced in the nucleotideR2 = 0.14, p = 0.032) than in the protein dataset (R2 = 0.09,
= 0.062).Standard diversity indices were calculated for 41 populations
174 individuals) that included two and more individuals (Table 1).aximum haplotype diversity (Hd = 1.00) occurred in 15 popula-
ions; in three other populations haplotype diversity was also veryigh (Hd = 0.90). Seven populations had an exceptional high numberf singletons (>120 singletons in populations from CZ 1, D 5, DK 1,
1, N1 1, RUS 1 and S 2). Genetic distances within populations
able 2esults of the AMOVA on the variation in nucleotide (white columns) and protein (grey cond in total. Each population was considered as a separate group. Populations with less th
Source o f variation amon g coun tries 16 16 3668.05 87.71 9.16 Va* 0
amon g popu lations 24 24 3797.55 126.74 32.6 Vb* 1 wit hin popu lations 133 133 1986.6 60.42 14.9 VC* 0.
d.f. sum o f squ ares varian ce comp
of Steganacarus magnus, illustrated as correlation between within-population dis-tances and latitude. For within-population distances of nucleotide (black diamond)and protein sequences (white triangle) see also Table S2.
(uncorrected p-distances; Supplementary material Table S2a) werehigh, ranging between 13 and 26% for the nucleotide and between1 and 2% for the protein dataset and were considerably higherthan within populations from classic refugia (Italy and Romania),in which genetic distances were <2% for the nucleotide and <0.6%for the protein dataset; the only exception was sampling locationRUM 6 in which distances were high for nucleotide and proteinsequences with 12 and 1.2%, respectively. Haplotypes from centralRussia and China contributed little to the genetic distances. Exclud-ing these populations, the maximum distance between Europeanpopulations remained at 30% for the nucleotide dataset betweenthe populations from Austria (A 1) and Germany (D 3). The meanand median genetic distances (Supplementary material Table S2band c) among nucleotide sequences within populations were 5.2and 1.1%, respectively, and between populations 22.5 and 23.9%.For the protein dataset the mean and median genetic distanceswithin populations were 0.5 and 0.2%, respectively, and betweenpopulations 2.0 and 2.1%. Distances within and among populationsof the small COI and ef 1-˛ datasets were similar, except for meanand median distances of the nucleotide datasets which were con-siderably higher for COI.
The genetic variance (AMOVA; Table 2) was very similar for thenucleotide (nct) and protein (aa) datasets, except for the varianceamong countries (nct = 16.2%, aa = 4.2%). The geographic struc-ture in both the nucleotide and protein datasets was weak anddominated by variance among (nct = 57.5%, aa = 67.7%) and withinpopulations (nct = 26.4%, aa = 28.0%) i.e., genetic structure at inter-mediate to small geographic scales predominated.
Fu’s Fs was non-significant for all populations, and Tajima’s Dwas non-significant for most populations, only four out of 13 testedpopulations were significant for Tajima’s D and had an excess oflow-frequency haplotypes. Populations F 3 (D = −1.26, p = 0.003)and RUS 2 (D = −1.25, p = 0.008) deviated significantly from neu-tral evolution based on the nucleotide dataset; populations CZ 1(D = −1.4, p < 0.01) and D 1 (D = −1.54, p = 0.04) were significantaccording to the protein dataset. Negative values of Tajima’s D andFu’s Fs usually indicate population expansion.
Reconstruction of migration routes
The amplified COI sequences of 180 individuals of S. magnusrepresented 111 nucleotide and 67 protein haplotypes, as several
lumns) sequences of COI among countries, among populations, within populationsan two individuals were excluded from the analysis. Significance level is p < 0.05.
fixa tion ind ices
.07 Va 16.15 4.24 FCT 0.16* 0.04
.1 Vb* 57.5 67.74 FS C 0.69* 0.71*
45 Vc* 26.35 28.02 FS T 0.74* 0.72*
onents percent o f total vari ation
M. Rosenberger et al. / Pedobiologia 56 (2013) 79– 87 83
0.06
SM_S_2.2
5 (south. Germ., Lk. Const.)
SM_RUM_5.2
SM_RUM_6.3
RD_D_1.1
SM_F_4.1
6 (Poland, Warsaw )
4 (Tenerife)
SM_RUM_6.2
15
SM_RUM_5.1
SM_CHINA_1.2
7 (Romania 1+2)
9 (Romania 3+4, CZ, N, A)
SM_F_4.2
SM_D_7.4
13
SM_RUM_6.1
10 (Russia, Altai)
SM_PL_1.6
SM_N_1.3
1
SM_RUM_5.4
3
8 (centr. Germ., Moerfelden)
11
SM_D_5.4
SM_F_1.3
2
SM_FIN_2.1
SM_N_1.1
SM_D_7.3
SM_D_4.4 SM_D_5.5
SM_D_7.1
SM_RUM_5.3
16
HR_D_1.1a
12 (south. France, Mt. Blanc)
SM_PL_1.2
HR_D_1.1
SM_D_7.2
14 (Russia, Novosibirsk)
17
SM_CHINA_1.1
94/1
80/1
49/0.92
-/0.77
73/1
47/0.75
80/1
-/0.79
82/1
95/1
99/1
100/1
-/0.81
96/1
81/1
81/1
82/1
63/1
86/1
98/1
94/1
100/1
86/0.78
100/1
100/1
100/1
100/1
53/0.87
46/0.99
94/1
99/1
98/1
100/1
100/1
44/0.86
100/1
(Romania 5+6)
86/1
36/-
56/-
F nces oL t diffei
nlFSbasusfbbh
bbhowt
ig. 3. Bayesian phylogeny after 10 million generations of 180 COI protein sequeikelihood and posterior probabilities for Bayesian analyses. Branch colours represenn Table 3.
ucleotide haplotypes merged in the most common protein hap-otype which occurred in 36 individuals from Germany, Denmark,rance and Italy. Phylogenetic trees and haplotype networks (Fig. 3;upplementary material Fig. S1a–c) were complex and dominatedy deep splits between haplotypes. Distance analyses of nucleotidend protein data indicate that the variance in the COI nucleotideequences in S. magnus is mainly due to neutral mutations; withp to 32% intraspecific genetic distance this gene is close to beaturated. All phylogenetic and haplotype analyses have been per-ormed with the nucleotide dataset, but here we only show resultsased on the protein sequences of COI (Fig. 3), which providedetter resolution and are less complex due to smaller number ofaplotypes.
Phylogenetic analyses recovered three well supported cladesut several individuals were associated with poor support with thelack clade (Fig. 3, Table 3 ). The clade summarizing subclades 1–8
ad high support (bootstrap support of 98, posterior probabilitiesf 1), but positions of individuals from China and Finland/Swedenere weakly supported (bootstrap support of 36 and 56, respec-
ively). The red and the blue clade were well supported (bootstrap
f Steganacarus magnus. Numbers on branches are bootstrap values for Maximumrent clades (black, blue, red). Numbers at final tips represent subclades as explained
support of 73 and 80, respectively, posterior probabilities of 1). Theblack clade comprised 108 individuals, including the individualsfrom China and Finland/Sweden, and was dominated by few andcommon haplotypes forming the largest subclades with 52 indi-viduals (subclade 1) from Italy, Germany and Denmark. Eighteenindividuals from Great Britain, Ireland and The Netherlands werealso combined in a well supported clade (subclade 2). The red cladeincluded 52 individuals, mainly from eastern and northern Europe;all populations in the blue clade were also present in the otherclades (CZ 1, D 4, DK 1, F 1, PL 1, S 2, N 1).
To corroborate the existence of distinct genetic lineages withinEuropean populations of S. magnus, phylogenetic trees were recon-structed with a subset of 26 individuals of which both the nuclearef 1-˛ and the mitochondrial COI were sequenced (Table 1). Thissubset comprised 11 individuals of the black, 8 individuals of thered and 7 individuals of the blue mitochondrial clade. Phylogenetic
trees based on the nucleotide sequences of ef 1-˛ had the best reso-lution, bootstrap support and posterior probabilities and supportedthe existence of three distinct genetic lineages within populationsof S. magnus in Europe (Supplementary material Fig. S2). The three
84 M. Rosenberger et al. / Pedobiologia 56 (2013) 79– 87
Table 3Summary of clades in the phylogenetic tree generated with 180 COI protein sequenesof Steganacarus magnus (see also Fig. 3). (a) For each major clade (black, blue, red),subclades with number of individuals (# Ind) and sampling sites are listed. Indi-viduals with relationships that were resolved as polytomies or weakly supportedclades are indicated as no clade. (b) Summary of populations present in two or moremajor clades.
Subclade # Ind Sampling sites
(a)Black 1081 14 D 1
9 D 24 D 91 DK 13 DK 33 DK 44 F 210 I 14 I 2
2 3 D 81 F 34 GB 12 GB 23 GB 32 IRL 13 NL 1
3 4 F 31 GB 1
4 2 E 11 E 24 E 3
5 3 D 36 3 PL 2
7 3 RUM 14 RUM 2
8 3 D 5No clade 2 S 2.2 +
FIN 2.12 CHINA 14 RUM 52 RUM 61 RUM 6
Red 529 2 A 1
1 CZ 11 N 13 RUM 44 RUM 31 RUS 1
10 3 RUS 111 1 CH 1
3 D 45 DK 22 PL 11 S 2
12 4 F 113 4 FIN 1
1 S 114 5 RUS 2
2 D 72 D 7
No clade 1 D 41 D 51 F 12 F 42 PL 1
Blue 2015 6 D 4
2 DK 11 HUN 1
16 3 CZ 11 F 1
17 1 CZ 11 D 62 PL 11 S 22 N 1
Table 3 ( Continued )
(b)Population Clade
Populationsin 2 clades
CZ 1 Red – blueD 4 Red – blueD 5 Black – redDK 1 Black – blueF 1 Red – blueN 1 Red – blue
PL 1 Red – blue
Populations in 3 clades S 2 Black – blue – red
clades were recovered but individuals of the red clade separatedinto two well-supported clades. In general, resolution of the phylo-genetic trees based on ef 1-˛ was weaker, possibly due to homog-enizing effects like recombination and biparental transmission.
Individuals sampled from classic glacial refugia i.e., Italy, Roma-nia and the Far East, were either included in the black or red clade.Notably, individuals from Romania 1–2 and 5–6 were only includedin the black clade, whereas individuals from Romania 3–4 andRussia were only present in the red clade. Further, within eightpopulations haplotypes were so distinct that they were allocatedto different clades (CZ 1, D 4, D 5, DK 1, F 1, N 1, PL 1, S 2; Fig. 3,Table 3). These ‘disrupted’ populations mirror the complex struc-ture of the haplotype networks and high genetic distances withinthese populations (Supplementary material Fig. S1, Table S2).
Discussion
Results of our study indicate that the genetic structure of thePalaearctic oribatid mite species S. magnus in Europe is exception-ally complex. Genetic structure and high haplotype diversity werepresent at nucleotide and protein level of the mitochondrial COIgene, indicating ancient separation and independent evolution oflineages. The nuclear gene ef 1-˛ supported the differentiation intodistinct genetic lineages and further analysis of 18S rDNA indicatedthat S. magnus does not comprise a cryptic species complex (M.Rosenberger, unpublished data). The used fragment of the COI geneis well established for bar-coding of species (Hebert et al. 2003;Hajibabaei et al. 2007). However, suitability of this fragment as auniversal bar-coding region is questionable due to high intraspe-cific variance in several taxa e.g., the oribatid mites Steganacarus(up to 29% Salomone et al. 2002), Platynothrus peltifer (up to 25%Heethoff et al. 2007) and Scutovertex sculptus (up to 11% Schäfferet al. 2010), the springtail Friesea grisea (up to 18% Torricelli et al.2010), the harvestman Aoraki denticulata (up to 19% Boyer et al.2007) and the intertidal copepod Tigriopus californicus (up to 23%Edmands 2001).
Southern richness and northern purity
High genetic variance was present across Europe and differ-ent genetic lineages coexisted in the same population, contrastingthe pattern of southern richness and northern purity from above-ground animals and plants (Hewitt and Ibrahim 2001). Overall, theresults indicate that genetic diversity is high at small and interme-diate scales and that additional to survival in cryptic refugia, bothpost- and pre-glacial diversifications contributed to the complexgenetic structure.
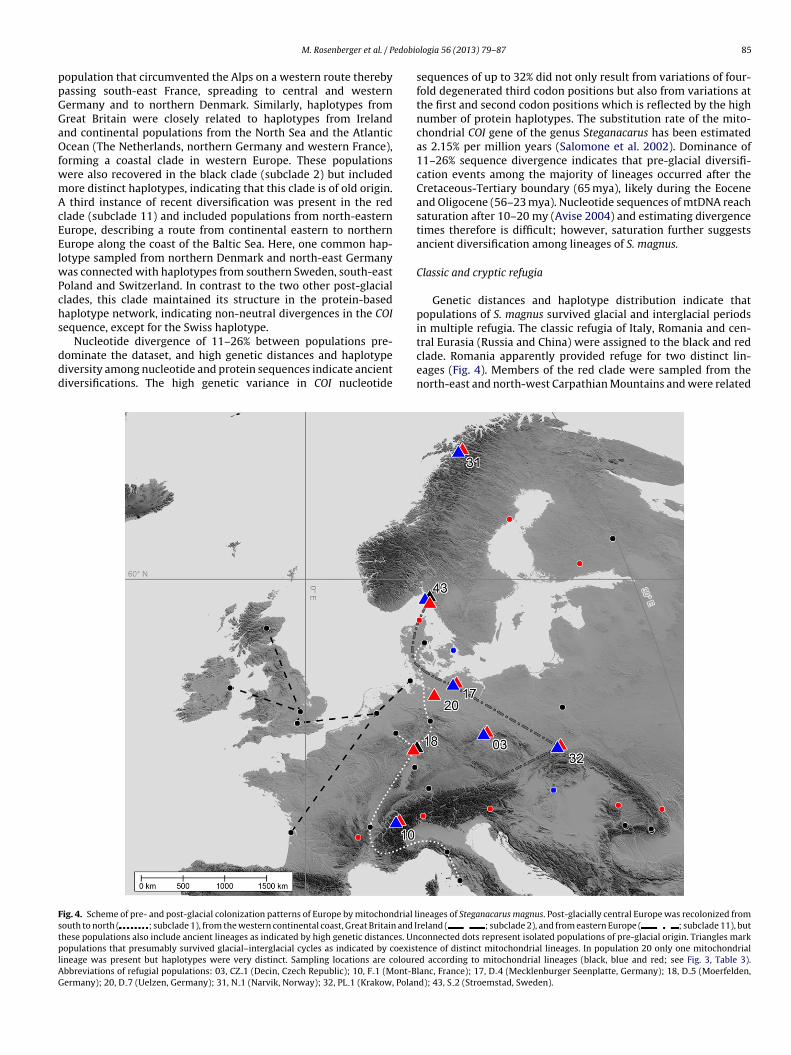
Three recent and independent population expansions can beinferred from the dataset (Fig. 4). The most prominent post-glacial
clade included populations from central Europe along the completecontinental south–north axis. All populations were representedby closely related haplotypes in the black clade (subclade 1),suggesting post-glacial recolonization from an Italian refuge
edobio
ppGGaOfwmAcEElwPchs
ddd
FstplAG
M. Rosenberger et al. / P
opulation that circumvented the Alps on a western route therebyassing south-east France, spreading to central and westernermany and to northern Denmark. Similarly, haplotypes fromreat Britain were closely related to haplotypes from Irelandnd continental populations from the North Sea and the Atlanticcean (The Netherlands, northern Germany and western France),
orming a coastal clade in western Europe. These populationsere also recovered in the black clade (subclade 2) but includedore distinct haplotypes, indicating that this clade is of old origin.
third instance of recent diversification was present in the redlade (subclade 11) and included populations from north-easternurope, describing a route from continental eastern to northernurope along the coast of the Baltic Sea. Here, one common hap-otype sampled from northern Denmark and north-east Germany
as connected with haplotypes from southern Sweden, south-eastoland and Switzerland. In contrast to the two other post-glaciallades, this clade maintained its structure in the protein-basedaplotype network, indicating non-neutral divergences in the COIequence, except for the Swiss haplotype.
Nucleotide divergence of 11–26% between populations pre-ominate the dataset, and high genetic distances and haplotypeiversity among nucleotide and protein sequences indicate ancientiversifications. The high genetic variance in COI nucleotide
ig. 4. Scheme of pre- and post-glacial colonization patterns of Europe by mitochondrial louth to north ( ; subclade 1), from the western continental coast, Great Britain and Ihese populations also include ancient lineages as indicated by high genetic distances. Unopulations that presumably survived glacial–interglacial cycles as indicated by coexist
ineage was present but haplotypes were very distinct. Sampling locations are colourebbreviations of refugial populations: 03, CZ 1 (Decin, Czech Republic); 10, F 1 (Mont-Bermany); 20, D 7 (Uelzen, Germany); 31, N 1 (Narvik, Norway); 32, PL 1 (Krakow, Polan
logia 56 (2013) 79– 87 85
sequences of up to 32% did not only result from variations of four-fold degenerated third codon positions but also from variations atthe first and second codon positions which is reflected by the highnumber of protein haplotypes. The substitution rate of the mito-chondrial COI gene of the genus Steganacarus has been estimatedas 2.15% per million years (Salomone et al. 2002). Dominance of11–26% sequence divergence indicates that pre-glacial diversifi-cation events among the majority of lineages occurred after theCretaceous-Tertiary boundary (65 mya), likely during the Eoceneand Oligocene (56–23 mya). Nucleotide sequences of mtDNA reachsaturation after 10–20 my (Avise 2004) and estimating divergencetimes therefore is difficult; however, saturation further suggestsancient diversification among lineages of S. magnus.
Classic and cryptic refugia
Genetic distances and haplotype distribution indicate thatpopulations of S. magnus survived glacial and interglacial periodsin multiple refugia. The classic refugia of Italy, Romania and cen-
tral Eurasia (Russia and China) were assigned to the black and redclade. Romania apparently provided refuge for two distinct lin-eages (Fig. 4). Members of the red clade were sampled from thenorth-east and north-west Carpathian Mountains and were related
ineages of Steganacarus magnus. Post-glacially central Europe was recolonized fromreland ( ; subclade 2), and from eastern Europe ( ; subclade 11), butconnected dots represent isolated populations of pre-glacial origin. Triangles markence of distinct mitochondrial lineages. In population 20 only one mitochondriald according to mitochondrial lineages (black, blue and red; see Fig. 3, Table 3).
lanc, France); 17, D 4 (Mecklenburger Seenplatte, Germany); 18, D 5 (Moerfelden,d); 43, S 2 (Stroemstad, Sweden).
8 edobio
tbCtac
lItiFmlcEf
pwdLdmiiattspdaipogsaafhttm
tacmt(Mpisaewnaenseu
6 M. Rosenberger et al. / P
o geographically distant lineages from Russia. Members of thelack clade were collected from the south-east and south-westarpathians and were related to haplotypes from Warsaw and cen-ral Germany. Further, one individual (RUM 6.3) was distinct fromll other Romanian haplotypes but distantly related to the coastallade (subclade 2).
High genetic diversity or endemism is typical for refugial popu-ations since habitats have been inhabited for long time (Hewitt andbrahim 2001; Stewart et al. 2010). The most exceptional popula-ions with regard to number of singletons (>120 singletons) andntrapopulation variance (13–26%) were CZ 1, D 4, D 5, D 7, DK 1
1, N 1, PL 1 and RUM 6 and probably are relict populations of S.agnus that have survived in these areas and still coexist at these
ocalities with immigrated individuals today. Except for Italy, thelassic refugia apparently contributed little to central and northernuropean genetic diversity as haplotypes are isolated and separatedrom other European populations by numerous mutation steps.
The genetic patterns of S. magnus cannot be explained by anthro-ogenic or passive dispersal. Oribatid mites can disperse by wind,ater or by migrating animals and birds but this has not beenemonstrated for S. magnus (Norton 1980; Lebedeva et al. 2006;ehmitz et al. 2011). One possible incidence of passive dispersal wasetectable in this dataset; individual DK 1.3 shared the most com-on haplotype of subclade 1 but differed genetically from the other
ndividuals sampled from this location. Likely, this individual wasncidentally introduced from Italy or Germany by anthropogenic ornimal mediated dispersal. Rather than colonization by dispersal,he distinct life-history characters of S. magnus allowed this specieso survive in northern refugia during glacial periods. Small bodyize likely permitted survival of large populations in small isolatedatches with frost tolerance and super-cooling facilitating survivaluring hostile climatic conditions. Temperatures in soil are gener-lly more stable than above the ground and horizontal movementn soil and low metabolism likely enabled individuals to endure colderiods in permafrost areas or in isolated ice-free patches in regionstherwise covered by permanent ice sheets during Pleistocenelaciations. An extended life-cycle as a result of short growing sea-ons have been documented for Alaskozetes antarcticus (Michael)nd this has been interpreted to be typical for oribatid mites (Blocknd Convey 1995). Further, by feeding on dead organic matter andungi S. magnus is rather independent from certain prey species andabitat types. The most fundamental requirement is lignified plantissue for larval development; therefore a small stand of deciduousrees or bushes in central or northern Europe during glaciations
ight have sufficed for survival of S. magnus.Variation in community composition and geographical isola-
ion are characteristic of cryptic refugia, which likely promoteddaptation (Stewart et al. 2010). During the Tertiary constantooling on a global scale and the onset of seasonal changes inducedassive biome changes in central Europe. Deciduous trees began
o overtake tropical evergreen species by the end of the Eocene37–34 mya), grasslands replaced the forest vegetation in the
iocene (∼34–23 mya) (Kürschner et al. 2008). About 3 mya theresent cold period started and steppe vegetation dominated
n central Europe, whereas temperate forests were restricted toouthern refugia and probably to small isolated patches (Stewartnd Lister 2001; Provan and Bennett 2008; Magri et al. 2006; Petitt al. 2008) from which S. magnus presumably expanded witharming climate, following the temperate and boreal forests colo-izing central and northern Europe in the Holocene (11,000 yearsgo to present) (Tollesfrud et al. 2008; Petit et al. 2008). With thisxpansion, representatives of very different lineages met and colo-
ized the same or geographically close locations. Further, repeatedhrinking of populations to isolated patches during glacial andxpansion in interglacial cycles likely contributed to the discontin-ous and complex genetic structure of European populations of S.
logia 56 (2013) 79– 87
magnus. However, estimates for non-random sequence evolution(Tajima’s D and Fu’s Fs) indicate that a large fraction of the studiedpopulations did not experience recent bottlenecks, selectivesweeps or populations expansions, suggesting that population sizehas been high throughout Quaternary glaciations.
The detritus based belowground system buffers abiotic fluc-tuations and detritivores are rather independent of the structureof aboveground communities. However, the large-scale Tertiaryreplacements of plant communities and the corresponding majorchanges in climate and resources entering the belowground systemare likely to have affected the soil microarthropod fauna. Therefore,although below- and aboveground systems are linked, the evolu-tionary forces and time-scales of evolutionary changes presumablyare very different preventing transfer of patterns from above theground to soil-living species.
Acknowledgments
We are grateful to the German Research Foundation (DFG) forfinancial support; all litter collectors, Florian Schwarzmüller for thestatistical analysis in R and Christof Wulff for help with Figs. 1 and 4.
References
Avise, J.C., 2004. Molecular Markers, Natural History and Evolution, 2nd ed. SinauerAssociates, Sunderland, USA.
Bandelt, H.J., Forster, P., Rohl, A., 1999. Median-joining networks for inferringintraspecific phylogenies. Molecular Biology and Evolution 16, 37–48.
Beheregaray, L.B., 2008. Twenty years of phylogeography: the state of the field andthe challenges of the southern hemisphere. Molecular Ecology 17, 3754–3774.
Block, W., Convey, P., 1995. The biology, life cycle and ecophysiology of the Antarcticmite Alaskozetes antarcticus. Journal of Zoology (London) 236, 431–449.
Boyer, S.L., Baker, J.M., Giribet, G., 2007. Deep genetic divergences in Aoraki dentic-ulata (Arachnida, Opiliones Cyphophthalmi): a widespread ‘mite harvestman’defies DNA taxonomy. Molecular Ecology 16, 4999–5016.
Clement, M., Posada, D., Crandall, K.A., 2000. TCS: a computer program to estimategene genealogies. Molecular Ecology 9, 657–1659.
Edmands, S., 2001. Phylogeography of the intertidal copepod Tigriopus californicusreveals substantially reduced population differentiation at northern latitudes.Molecular Ecology 10, 1743–1750.
Excoffier, L., Laval, G., Schneider, S., 2005. Arlequin (version 3.0): an integratedsoftware package for population genetics data analysis. Journal of EvolutionaryBioinformatics 1, 47–50.
Hajibabaei, M., Singer, G.A.C., Hebert, P.D.N., Hickey, D.A., 2007. DNA barcoding: howit complements taxonomy, molecular phylogenetics and population genetics.Trends in Genetics 23, 167–172.
Hebert, P.D.N., Ratnasingham, S., deWaard, J.R., 2003. Barcoding animal life:cytochrome c oxidase subunit 1 divergences among closely related species.Proceedings of the Royal Society B: Biological Sciences 270, S96–S99.
Heethoff, M., Domes, K., Laumann, M., Maraun, M., Norton, R.A., Scheu, S., 2007. Highgenetic divergences indicate ancient separation of parthenogenetic lineages ofthe oribatid mite Platynothrus peltifer (Acari: Oribatida). Journal of EvolutionaryBiology 20, 392–402.
Hewitt, G.M., Ibrahim, K.M., 2001. Inferring glacial refugia and historical migrationswith molecular phylogenies. In: Silvertown, J., Antonovics, J. (Eds.), IntegratingEcology and Evolution in a Spatial Context:. Blackwell Science Ltd., Oxford, UK,pp. 271–294.
Kaneko, N., 1988. Research into the life histories of oribatid mites. Edaphologia 39,1–9.
Kempson, D., Llyod, M., Ghelardi, R., 1963. A new extractor for woodland litter.Pedobiologia 3, 1–21.
Klompen, H., 2000. A preliminary assessment of the utility of elongation factor 1-� inelucidating relationships among basal Mesostigmata. Experimental and AppliedAcarology 24, 805–820.
Konestabo, H.S., Michelsen, A., Holmstrup, M., 2007. Responses of springtail andmite populations to prolonged periods of soil freeze–thaw cycles in a sub-arcticecosystem. Applied Soil Ecology 36, 136–146.
Kürschner, W.M., Kvacek, Z., Dilcher, D., 2008. The impact of Miocene atmosphericcarbon dioxide fluctuations on climate and the evolution of terrestrial ecosys-tems. Proceedings of the National Academy of Science United States of America105, 449–453.
Lebedeva, N.V., Lebedev, V.D., Melekhina, E.N., 2006. New data on the oribatid mite
(Oribatei) fauna of Svalbard. Doklady Biological Sciences 407, 182–186.
Lehmitz, R., Russel, D., Hohberg, K., Christian, A., Xylander, W.E.R., 2011. Wind dis-persal of oribatid mites as a mode of migration. Pedobiologia 54, 201–207.
Macfadyen, A., 1961. Improved funnel-type extractors for soil arthropods. Journalof Animal Ecology 30, 171–184.
edobio
M
M
M
N
N
P
P
P
P
P
RR
R
S
S
M. Rosenberger et al. / P
agri, D., et al., 2006. A new scenario for the Quaternary history of European beechpopulations: palaebotanical evidence and genetic consequences. New Phytolo-gist 171, 199–221.
araun, M., Scheu, S., 2000. The structure of oribatid mite communities (Acari Ori-batida) patterns, mechanisms and implications for future research. Ecography23, 374–383.
arshall, V.G., Reeves, R.M., Norton, R.A., 1987. Catalogue of the oribatida (Acari) ofcontinental United States and Canada. Memoirs of the Entomological Society ofCanada 139, 1–418.
orton, R.A., 1980. Observations on phoresy by oribatid mites (Acari: Oribatida).International Journal of Acarology 6, 121–130.
orton, R.A., 1994. Evolutionary aspects of oribatid mites life histories and conse-quences for the origin of the Astigmata. In: Houck, M. (Ed.), Mites: Ecological andEvolutionary Analyses of Life-history Patterns. Chapman and Hall, New York,USA, pp. 99–135.
etit, R.J., Hu, F.S., Dick, C.W., 2008. Forests of the past: a window to future changes.Science 320, 1450–1452.
fenninger, M., Posada, D., Magnin, F., 2003. Evidence for survival of Pleistoceneclimatic changes in northern refugia by the land snail Trochoidea geyeri (Soоs1926) (Helicellinaem, Stylommatophora). BMC Evolutionary Biology 3, 8.
ollierer, M.M., Langel, R., Scheu, S., Maraun, M., 2009. Compartmentalization ofthe soil animal food web as indicated by dual analysis of stable isotope ratios(15N/14N and 13C/12C). Soil Biology and Biochemistry 41, 1221–1226.
osada, D., Crandall, K.A., 1998. Modeltest: testing the model of DNA substitution.Bioinformatics 14, 817–818.
rovan, J., Bennett, K.D., 2008. Phylogeographic insights into cryptic glacial refugia.Trends in Ecology and Evolution 23, 564–571.
under mixed models. Bioinformatics 19, 1572–1574.ozas, J., Sánchez-DelBarrio, J.C., Messeguer, X., Rozas, R., 2003. DnaSP, DNA poly-
morphism analyses by the coalescent and other methods. Bioinformatics 19,2496–2497.
alomone, N., Emerson, B.C., Hewitt, G.M., Bernini, F., 2002. Phylogenetic relation-ships among the Canary Island Steganacaridae (Acari Oribatida) inferred frommitochondrial DNA sequence data. Molecular Ecology 11, 79–89.
chäffer, S., Koblmüller, S., Pfingstl, T., Sturmbauer, C., Krisper, G., 2010. Contrastingmitochondrial DNA diversity estimates in Austrian Scutovertex minutus and
logia 56 (2013) 79– 87 87
S. sculptus (Acari, Oribatida, Brachypylina, Scutoverticidae). Pedobiologia 53,203–211.
Schmitt, T., 2009. Biogeographical and evolutionary importance of the Europeanhigh mountain systems. Fronters in Zoology 6, 9.
Schneider, K., Maraun, M., 2005. Feeding preferences among dark pigmented fungaltaxa (“Dematiacea”) indicate limited trophic niche differentiation of oribatidmites (Oribatida, Acari). Pedobiologia 49, 61–67.
Siepel, H., 1996. The importance of unpredictable and short-term environmentalextremes for biodiversity in oribatid mites. Biodiversity Letters 3, 26–34.
Stamatakis, A., 2006. RAxML-VI-HPC: maximum likelihood-based phylogeneticanalyses with thousands of taxa and mixed models. Bioinformatics 22, 446.
Stewart, J.R., Lister, A.M., Barnes, I., Dalén, L., 2010. Refugia revisited: individualisticresponses of species in space and time P. Royal Society B: Biological Sciences277, 661–671.
Stewart, J.R., Lister, A.M., 2001. Cryptic northern refugia and the origins of the mod-ern biota. Trends in Ecology and Evolution 16, 608–613.
Swofford, D., 1999. PAUP*: Phylogenetic Analysis using Parsimony (and other meth-ods) Version 4. 0. Sinauer Sunderland, USA.
Thompson, J.D., Gibson, T.J., Plewniak, F., Jeanmougin, F., Higgins, D.G., 1997. TheClustalX windows interface: flexible strategies for multiple sequence alignmentaided by quality analysis tools. Nucleic Acids Research 24, 4876–4882.
Tollesfrud, M.M., Kissling, R., Gugerli, F., Johnson, O., Skroppa, T., Cheddadi, R., van derKnaap, W.O., Latalowa, M., Terhurne-Berson, R., Litt, T., Geburek, T., Brochmann,C., Sperisen, C., 2008. Genetic consequences of glacial survival and post-glacialcolonization in Norway spruce: combined analysis of mitochondrial DNA andfossil pollen. Molecular Ecology 17, 4134–4150.
Torricelli, G., Carapelli, A., Convey, P., Nardi, F., Boore, J.L., Frati, F., 2010. High diver-gence across the whole mitochondrial genome in the “pan-Antarctic” springtailFriesea grisea: evidence for cryptic species? Gene 449, 30–40.
Verovnik, R., Sket, B., Trontelj, P., 2005. The colonization of Europe by the freshwatercrustacean Asellus aquaticus (Crustacea: Isopoda) proceeded from ancient refu-gia and was directed by habitat connectivity. Molecular Ecology 14, 355–4369.
Webb, N.R., Block, W., 1993. Aspects of cold hardiness in Steganacarus magnus (Acari
Cryptostigmata). Experimental and Applied Acarology 17, 741–748.
Weigmann, G., 2006. Hornmilben (Oribatida). In: Dahl, F. (Ed.), Tierwelt Deutsch-lands 76. Teil. Goecke and Evers, Keltern Germany.
Willis, K.J., Rudner, E., Sümegi, P., 2000. The full-glacial forests of central and south-eastern Europe. Quarternary Research 53, 203–213.