Pre-AP Algebra 2 Lesson 2-5 –Graphing linear inequalities & systems of inequalities Objectives: The students will be able to - graph linear functions in slope-intercept and standard form, as well as vertical and horizontal lines. - graph linear & non-linear inequalities and systems of inequalities, and describe the shaded region as the set of all points that solve the inequality. Materials: Bellringer and answers overhead; Pair work and answers overhead; example overheads; homework #2-5 Time Activity 5 min Return Unit 1 Test Hand out solutions. Students need to do corrections as part of their homework. 20 min Do Now Hand out the Is the Point a Solution? worksheet. Review answers on the overhead and show students that we can shade in this entire region to represent a solution set. Have students shade this in on their sheets. Point out that the overlapping section of the shaded regions is the solution set to a system of inequalities. In other words, every point in that region is a solution to both of the inequalities. The shaded regions that don’t overlap give you all the solutions to one, but not the other inequality. The region that has no shading has points that don’t solve either of the inequalities. 30 min Direct Instruction and Practice Hand out the note-taking templates. Background Information: Graphing lines: - y = c is horizontal - x = c is vertical - ax + by = c can be graphed two ways: o convert to y = mx + b (isolate y) o plot the intercepts (plug in 0 for x and y) Concepts: 1) Graph the boundary line. a. With < or >, use a dotted line, to indicate that the boundary is not included. b. With < or > , use a solid line, to indicate that the boundary is included. 2) Determine which side of the boundary is the solution set. a. If it is in standard form, plug in a test point not on the line. Use (0, 0) whenever possible. If the test point is a solution, shade that side. Otherwise, shade the other side. b. If it is slope-intercept form, or vertical or horizontal, the inequality sign indicates which side to shade. (You can still plug in a test point to be sure). Examples: . 1) y < 4 2) x > -1 3) |y| < 3 4) |x| > 4 5) y > 2x – 3 6) 4x – 5y < 10 (make sure to write the boundary line equation first) Background: Solving a system of equations/inequalities means that you are solving more than one at the same time . A solution to a system must make all equations/inequalities true. Concepts: To graph a system of inequalities: - Graph each inequality separately. Lightly shade the solution region for each. - Find where all shaded regions overlap and mark it more darkly. Label it “S” for solution. - This works the same, even if the inequalities are not linear.
Transcript
Pre-AP Algebra 2
Lesson 2-5 –Graphing linear inequalities & systems of inequalities
Objectives: The students will be able to
- graph linear functions in slope-intercept and standard form, as well as vertical and horizontal lines.
- graph linear & non-linear inequalities and systems of inequalities, and describe the shaded region as the set
of all points that solve the inequality.
Materials: Bellringer and answers overhead; Pair work and answers overhead; example overheads; homework #2-5
Time Activity
5 min Return Unit 1 Test
Hand out solutions. Students need to do corrections as part of their homework.
20 min Do Now
Hand out the Is the Point a Solution? worksheet.
Review answers on the overhead and show students that we can shade in this entire region to represent a
solution set. Have students shade this in on their sheets.
Point out that the overlapping section of the shaded regions is the solution set to a system of
inequalities. In other words, every point in that region is a solution to both of the inequalities. The
shaded regions that don’t overlap give you all the solutions to one, but not the other inequality. The
region that has no shading has points that don’t solve either of the inequalities.
30 min Direct Instruction and Practice Hand out the note-taking templates.
Background Information:
Graphing lines:
- y = c is horizontal
- x = c is vertical
- ax + by = c can be graphed two ways:
o convert to y = mx + b (isolate y)
o plot the intercepts (plug in 0 for x and y)
Concepts:
1) Graph the boundary line.
a. With < or >, use a dotted line, to indicate that the boundary is not included.
b. With < or >, use a solid line, to indicate that the boundary is included.
2) Determine which side of the boundary is the solution set.
a. If it is in standard form, plug in a test point not on the line. Use (0, 0) whenever
possible. If the test point is a solution, shade that side. Otherwise, shade the other
side.
b. If it is slope-intercept form, or vertical or horizontal, the inequality sign indicates
which side to shade. (You can still plug in a test point to be sure).
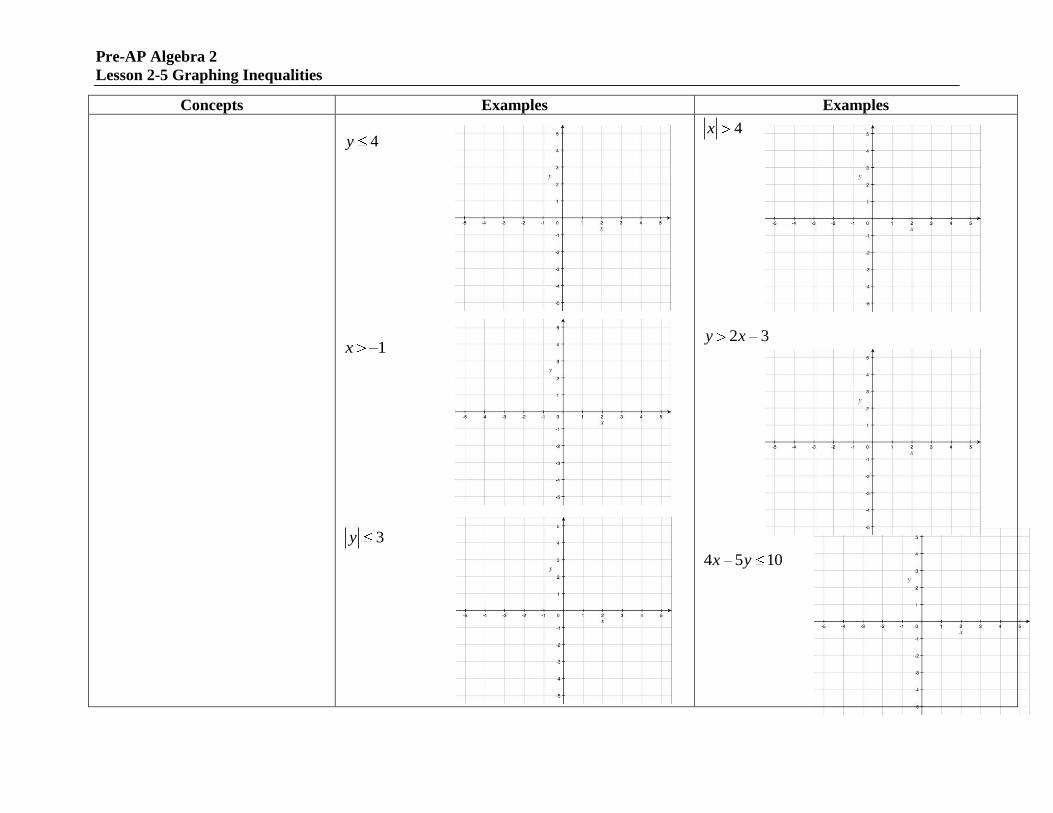
Examples:
.
1) y < 4
2) x > -1
3) |y| < 3
4) |x| > 4
5) y > 2x – 3
6) 4x – 5y < 10 (make sure to write the boundary line equation first)
Background: Solving a system of equations/inequalities means that you are solving more than one at the same time.
A solution to a system must make all equations/inequalities true.
Concepts: To graph a system of inequalities:
- Graph each inequality separately. Lightly shade the solution region for each.
- Find where all shaded regions overlap and mark it more darkly. Label it “S” for solution.
- This works the same, even if the inequalities are not linear.
To graph a non-linear inequality:
- Graph the border function. Determine if it is solid or dashed.
- Use a test point to determine which side to shade.
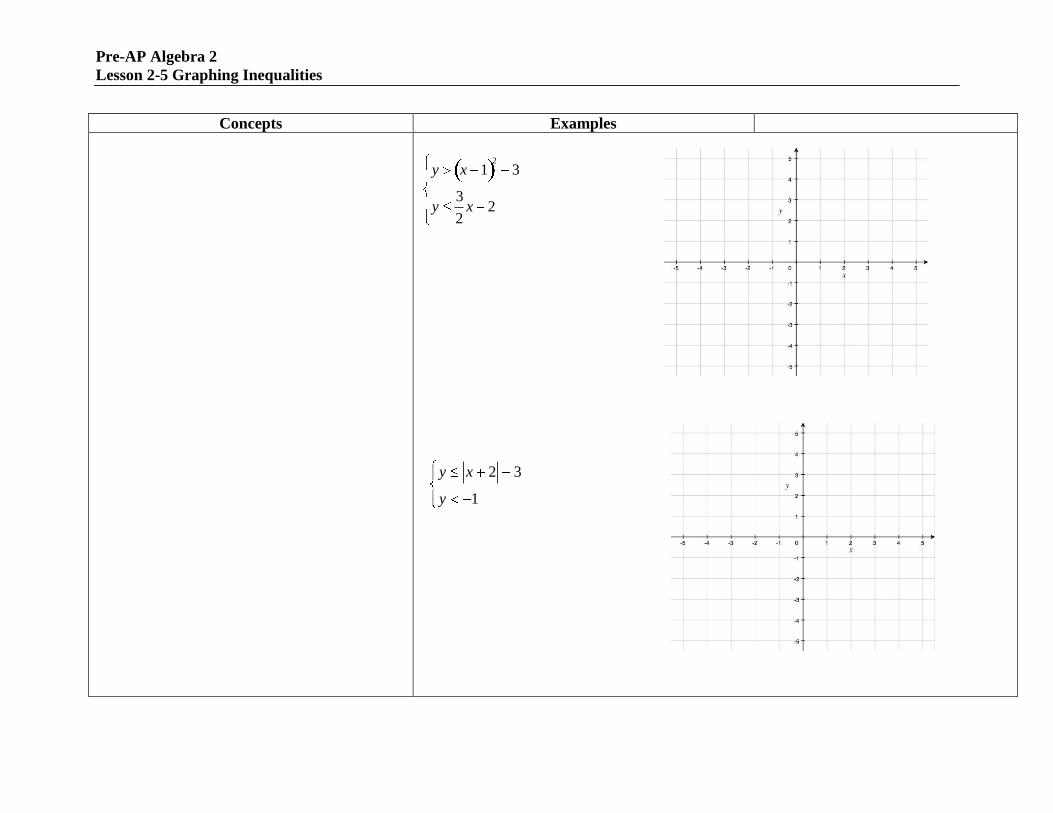
Examples:
Work through the first one together and let them do the second in pairs.
y x 12
3
y3
2x 2
y x 2 3
y 1
15 min Pair Work
Hand out Practice Graphing Inequalities. Show answers on overhead in the last 2 minutes.
Pre-AP Algebra 2
Lesson 2-5 –Bellringer
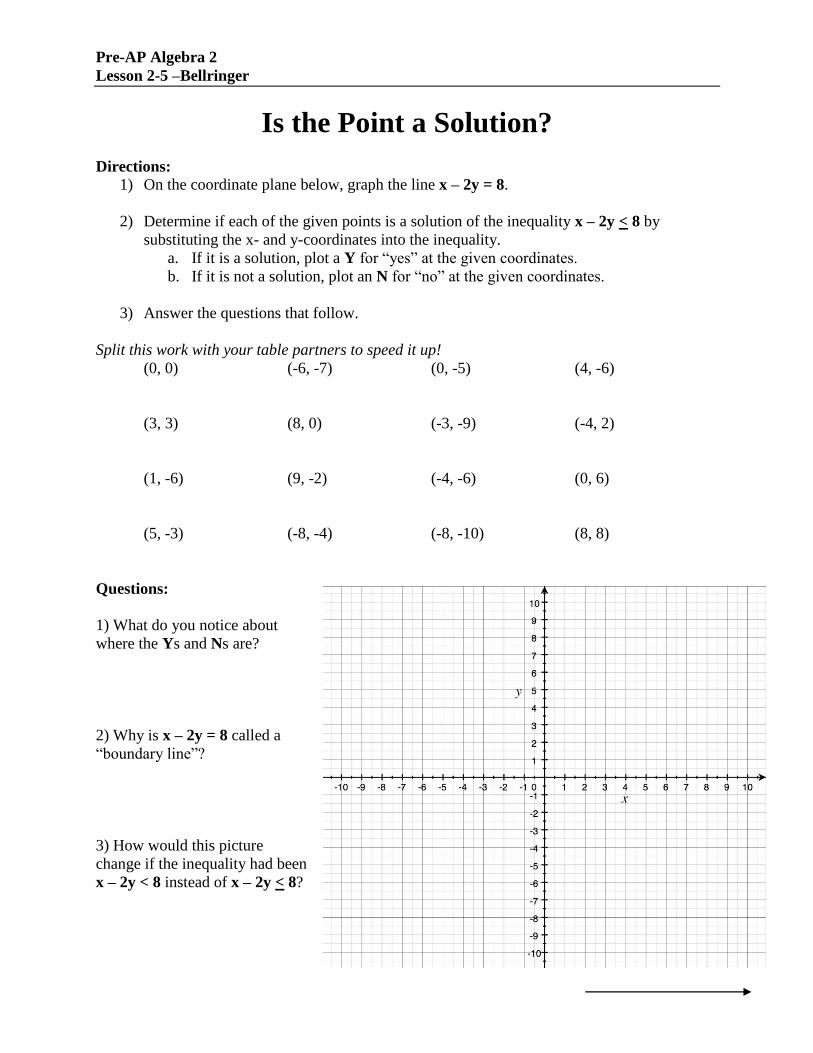
Is the Point a Solution?
Directions: 1) On the coordinate plane below, graph the line x – 2y = 8.
2) Determine if each of the given points is a solution of the inequality x – 2y < 8 by
substituting the x- and y-coordinates into the inequality.
a. If it is a solution, plot a Y for “yes” at the given coordinates.
b. If it is not a solution, plot an N for “no” at the given coordinates.
3) Answer the questions that follow.
Split this work with your table partners to speed it up!
(0, 0) (-6, -7) (0, -5) (4, -6)
(3, 3) (8, 0) (-3, -9) (-4, 2)
(1, -6) (9, -2) (-4, -6) (0, 6)
(5, -3) (-8, -4) (-8, -10) (8, 8)
Questions:
1) What do you notice about
where the Ys and Ns are?
2) Why is x – 2y = 8 called a
“boundary line”?
3) How would this picture
change if the inequality had been
x – 2y < 8 instead of x – 2y < 8?
Pre-AP Algebra 2
Lesson 2-5 –Bellringer
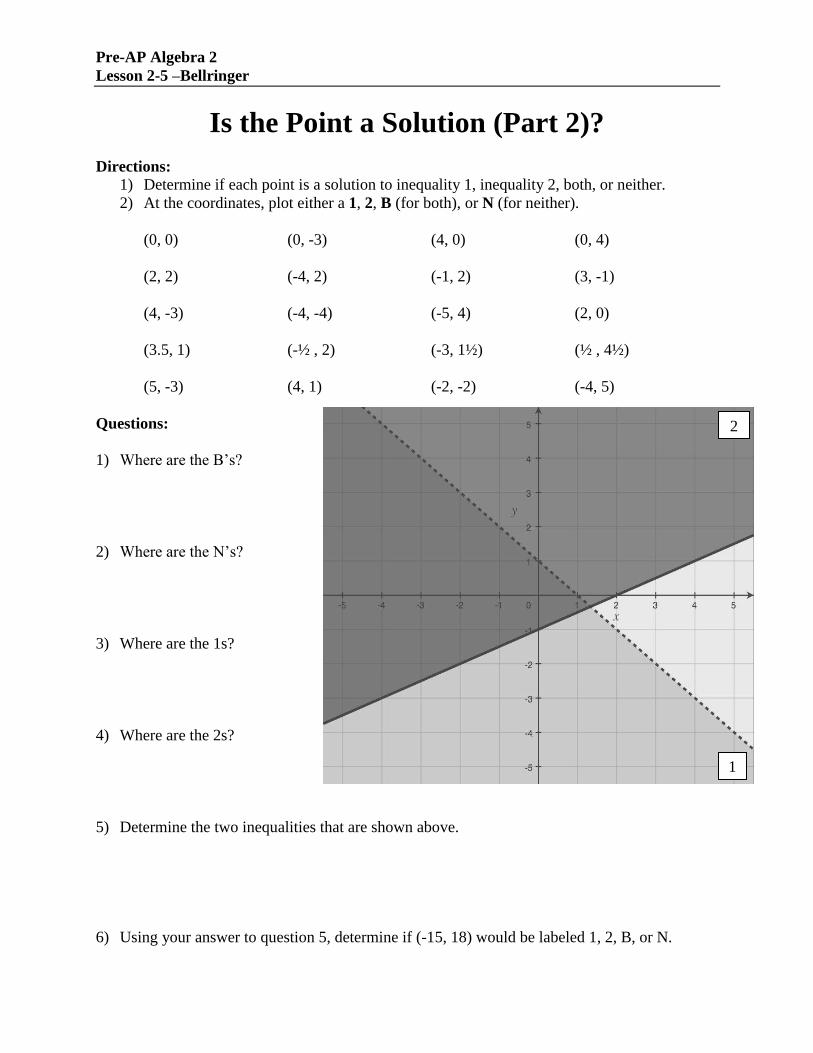
Is the Point a Solution (Part 2)?
Directions: 1) Determine if each point is a solution to inequality 1, inequality 2, both, or neither.
2) At the coordinates, plot either a 1, 2, B (for both), or N (for neither).
(0, 0) (0, -3) (4, 0) (0, 4)
(2, 2) (-4, 2) (-1, 2) (3, -1)
(4, -3) (-4, -4) (-5, 4) (2, 0)
(3.5, 1) (-½ , 2) (-3, 1½) (½ , 4½)
(5, -3) (4, 1) (-2, -2) (-4, 5)
Questions:
1) Where are the B’s?
2) Where are the N’s?
3) Where are the 1s?
4) Where are the 2s?
5) Determine the two inequalities that are shown above.
6) Using your answer to question 5, determine if (-15, 18) would be labeled 1, 2, B, or N.
1
2
Pre-AP Algebra 2
Lesson 2-5 –Pairwork
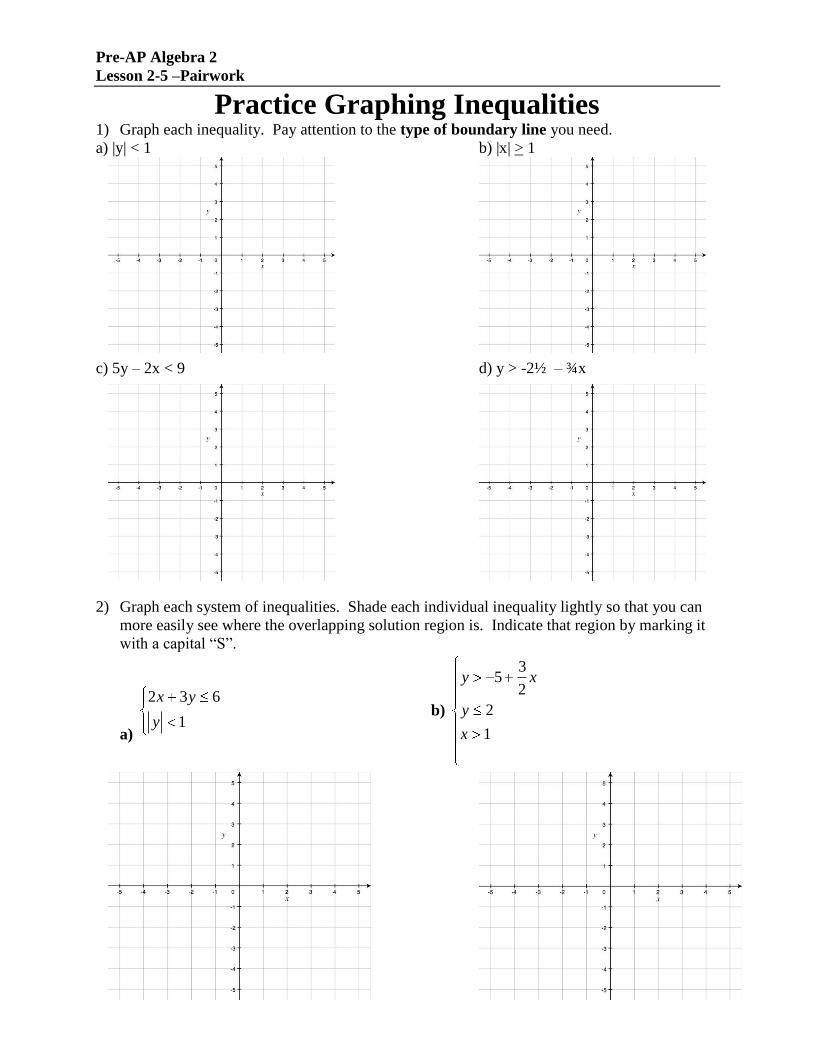
Practice Graphing Inequalities 1) Graph each inequality. Pay attention to the type of boundary line you need.
a) |y| < 1 b) |x| > 1
c) 5y – 2x < 9 d) y > -2½ – ¾x
2) Graph each system of inequalities. Shade each individual inequality lightly so that you can
more easily see where the overlapping solution region is. Indicate that region by marking it
with a capital “S”.
a)
2x 3y 6
y 1 b)
y 53
2x
y 2
x 1
Pre-AP Algebra 2
Lesson 2-5 –Pairwork
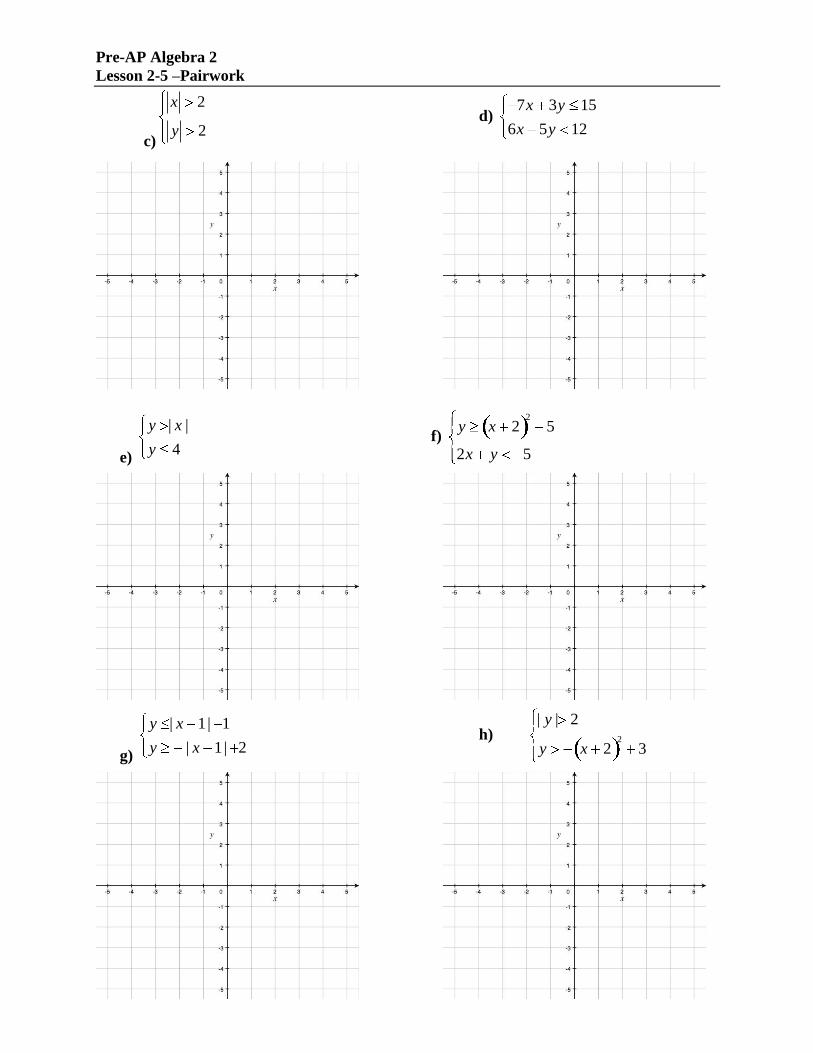
c)
x 2
y 2 d)
7x 3y 15
6x 5y 12
e)
y | x |
y 4 f)
y x 22
5
2x y 5
g)
y | x 1| 1
y | x 1| 2 h)
| y | 2
y x 22
3
Pre-AP Algebra 2
Lesson 2-5 –Homework
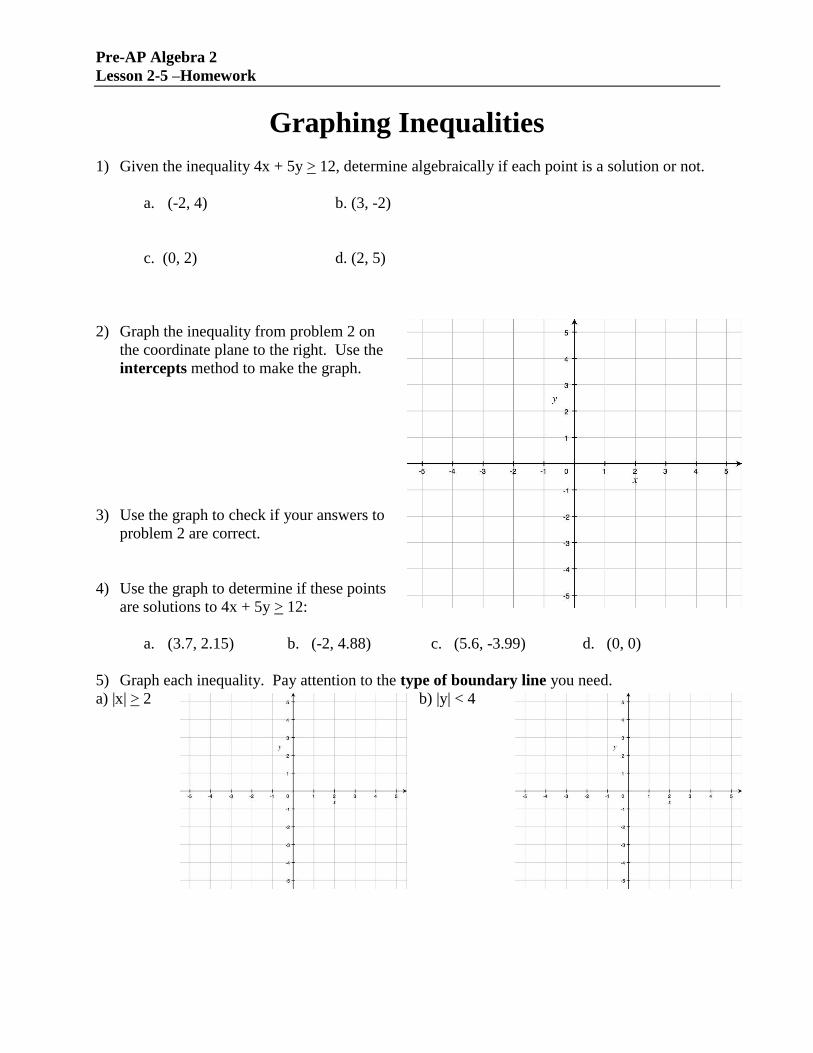
Graphing Inequalities
1) Given the inequality 4x + 5y > 12, determine algebraically if each point is a solution or not.
a. (-2, 4) b. (3, -2)
c. (0, 2) d. (2, 5)
2) Graph the inequality from problem 2 on
the coordinate plane to the right. Use the
intercepts method to make the graph.
3) Use the graph to check if your answers to
problem 2 are correct.
4) Use the graph to determine if these points
are solutions to 4x + 5y > 12:
a. (3.7, 2.15) b. (-2, 4.88) c. (5.6, -3.99) d. (0, 0)
5) Graph each inequality. Pay attention to the type of boundary line you need.
a) |x| > 2 b) |y| < 4
Pre-AP Algebra 2
Lesson 2-5 –Homework
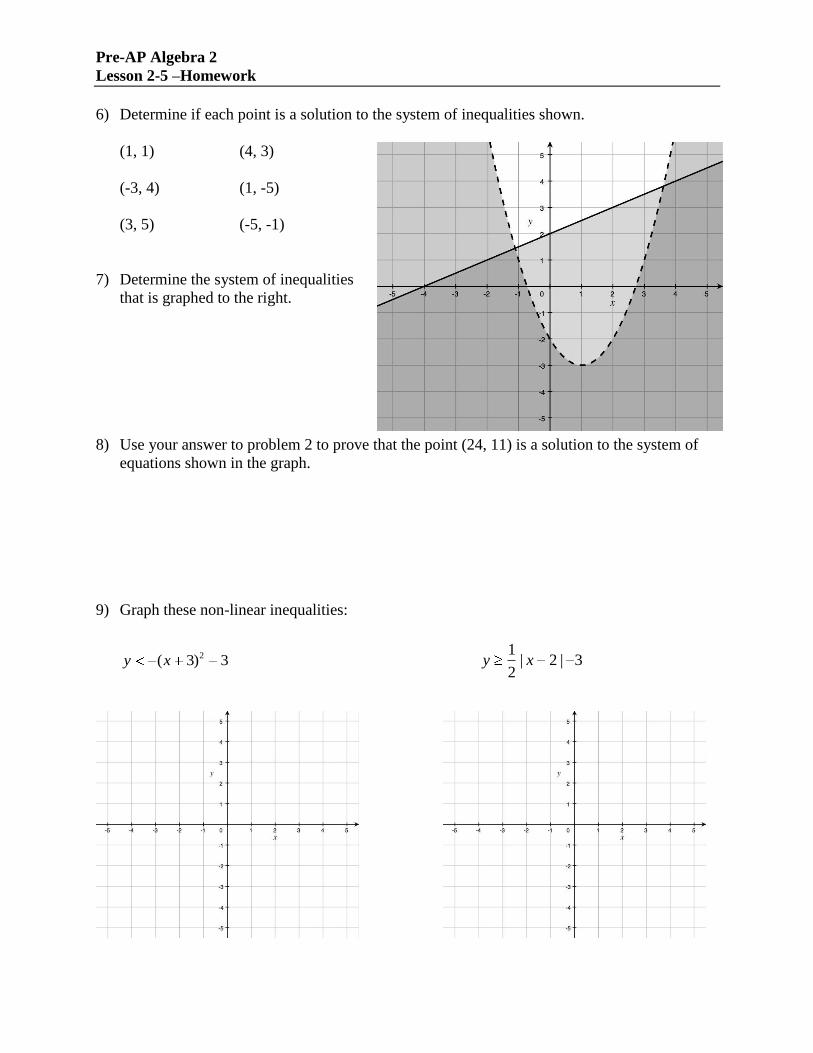
6) Determine if each point is a solution to the system of inequalities shown.
(1, 1) (4, 3)
(-3, 4) (1, -5)
(3, 5) (-5, -1)
7) Determine the system of inequalities
that is graphed to the right.
8) Use your answer to problem 2 to prove that the point (24, 11) is a solution to the system of
equations shown in the graph.
9) Graph these non-linear inequalities:
y (x 3)2 3 y
1
2| x 2 | 3
Pre-AP Algebra 2
Lesson 2-5 –Homework
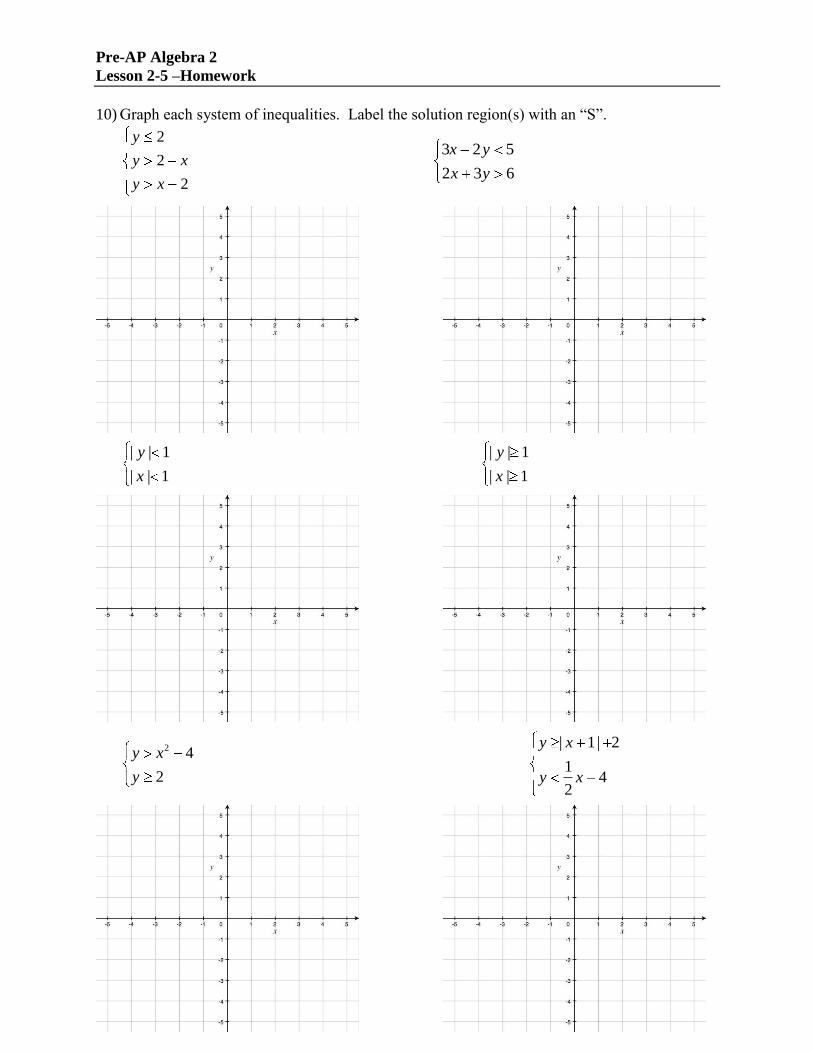
10) Graph each system of inequalities. Label the solution region(s) with an “S”.