Page 1
Accepted Manuscript
Pre-exposure to Nitrite in the Absence of Ammonium Strongly Inhibits Anammox
José M. Carvajal-Arroyo, Daniel Puyol, Guangbin Li, Armando Lucero-Acuña, ReyesSierra-Álvarez, Jim A. Field
PII: S0043-1354(13)00694-5
DOI: 10.1016/j.watres.2013.09.015
Reference: WR 10170
To appear in: Water Research
Received Date: 30 May 2013
Revised Date: 31 August 2013
Accepted Date: 5 September 2013
Please cite this article as: Carvajal-Arroyo, J.M., Puyol, D., Li, G., Lucero-Acuña, A., Sierra-Álvarez,R., Field, J.A., Pre-exposure to Nitrite in the Absence of Ammonium Strongly Inhibits Anammox, WaterResearch (2013), doi: 10.1016/j.watres.2013.09.015.
This is a PDF file of an unedited manuscript that has been accepted for publication. As a service toour customers we are providing this early version of the manuscript. The manuscript will undergocopyediting, typesetting, and review of the resulting proof before it is published in its final form. Pleasenote that during the production process errors may be discovered which could affect the content, and alllegal disclaimers that apply to the journal pertain.
Page 2
MANUSCRIP
T
ACCEPTED
ACCEPTED MANUSCRIPT
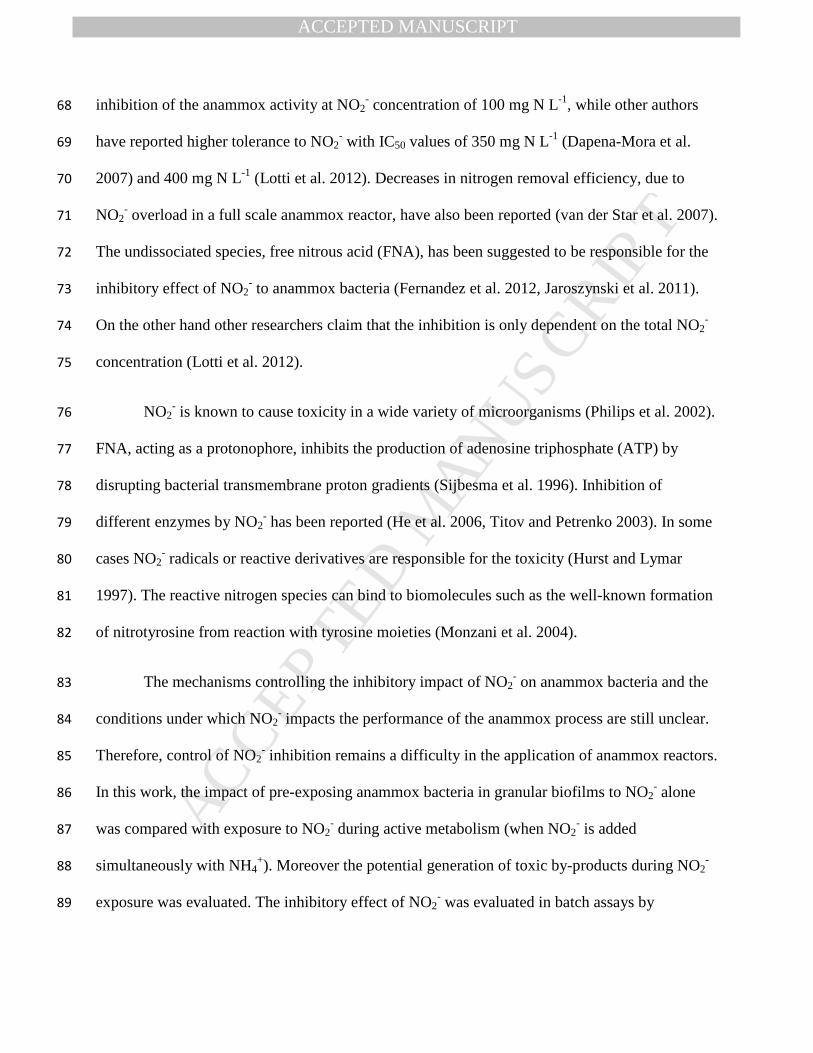
PRE-EXPOSURE PERIOD
tEXP = 24 h
NO2- = 0-100 mg N L-1 NH4
+ = 76 mg N L-1
MONITORING SAA
COMPROMISED
CELLS
NO2-
NO
NH4+
N2H4
N2
ANAMMOX NITRITE INHIBITION�-NO gas accumulation
�- N2 production inhibited
ANAMMOX REACTION:
Page 3
MANUSCRIP
T
ACCEPTED
ACCEPTED MANUSCRIPT
1
2
3
Pre-exposure to Nitrite in the Absence of Ammonium Strongly Inhibits Anammox 4
5
José M. Carvajal-Arroyo*, Daniel Puyol, Guangbin Li, Armando Lucero-Acuña, Reyes Sierra-6
Álvarez, Jim A. Field 7
8
9
Department of Chemical and Environmental Engineering, University of Arizona, 10
P.O. Box 210011, Tucson, Arizona, USA 11
12
13
14
*Corresponding author Tel. +1-520-621-6457, Fax. +1-520-621-6048 15
16
Email: [email protected] (J. M. Carvajal-Arroyo) 17
Page 4
MANUSCRIP
T
ACCEPTED
ACCEPTED MANUSCRIPT
18
Abstract 19
Anaerobic ammonium oxidizing bacteria (Anammox) are known to be inhibited by their 20
substrate, nitrite. However, the mechanism of inhibition and the physiological conditions under 21
which nitrite impacts the performance of anammox bioreactors are still unknown. This study 22
investigates the role of pre-exposing anammox bacteria to nitrite alone on their subsequent 23
activity and metabolism after ammonium has been added. Batch experiments were carried out 24
with anammox granular biofilm pre-exposed to nitrite over a range of concentrations and 25
durations in the absence of ammonium. The effect of pre-exposure to nitrite alone compared to 26
nitrite simultaneously fed with ammonium was evaluated by measuring the anammox activity 27
and the accumulation of the intermediate, nitric oxide. The results show that the inhibitory effect 28
was more dramatic when bacteria were pre-exposed to nitrite in absence of ammonium, as 29
revealed by the lower activity and the higher accumulation of nitric oxide. The nitrite 30
concentration causing 50% inhibition was 53 and 384 mg N L-1 in the absence or the presence of 31
ammonium, respectively. The nitrite inhibition was thus 7.2-fold more severe in the absence of 32
ammonium. Biomass exposure to nitrite (25 mg N L-1), in absence of ammonium, led to 33
accumulation of nitric oxide. On the other hand when the biomass was exposed to nitrite in 34
presence of ammonium, accumulation of nitric oxide was only observed at much higher nitrite 35
concentrations (500 mg N L-1). The inhibitory effect of nitrite in the absence of ammonium was 36
very rapid. The rate of decay of the anammox activity was equivalent to the diffusion rate of 37
nitrite up to 46% of activity loss. The results taken as a whole suggest that nitrite inhibition is 38
more acute when anammox cells are not actively metabolizing. Accumulation of nitric oxide in 39
Page 5
MANUSCRIP
T
ACCEPTED
ACCEPTED MANUSCRIPT
the headspace most likely indicates disruption of the anammox biochemistry by nitrite inhibition, 40
caused by an interruption of the hydrazine synthesis step. 41
42
Keywords 43
Nitrogen removal; toxicity; mechanism; biofilm; anaerobic; nitric oxide 44
Page 6
MANUSCRIP
T
ACCEPTED
ACCEPTED MANUSCRIPT
45
1. Introduction 46
The anaerobic oxidation of ammonium (NH4+) (anammox) is a novel technology for the removal 47
of nitrogen pollution from wastewaters. The anammox process is catalyzed by 48
chemolithoautotrophic bacteria of the phylum Planctomycetes that use nitrite (NO2-) as terminal 49
electron acceptor and NH4+ as an electron donor, allowing for NH4
+ removal in the absence of 50
oxygen (Strous et al. 1999a). Anammox is advantageous over the traditional nitrification-51
denitrification process for nutrient-N containing effluents since oxygen needs are decreased by 52
up to 57%, and no additional electron donor is needed as would otherwise be the case for 53
denitrification. Unlike other prokaryotes, anammox bacteria have a complex internal 54
compartmentalization. The central organelle, called anammoxosome is the locus of the anammox 55
metabolism (Kartal et al. 2011). The catabolism of anammox bacteria involves the reduction of 56
NO2- to nitric oxide (NO) by a nitrite oxidoreductase (NirS). Subsequently, hydrazine synthase 57
enzyme (HZS) forms hydrazine (N2H4) by combining NH4+ with NO. Lastly, N2H4 is oxidized to 58
dinitrogen gas (N2) by hydrazine dehydrogenase (HDH) (Kartal et al. 2011). The oxidation of 59
N2H4 produces four high energy electrons, that are used to generate an intracellular proton 60
gradient which energizes the production of ATP (van der Star et al. 2010). 61
Inhibition of anammox microorganisms by substrates and intermediates has been 62
extensively studied. NH4+ has been found to cause low inhibition corresponding to a 50% 63
inhibiting concentration (IC50) of 770 mg NH4+-N L-1 (Dapena-Mora et al. 2007). Similarly, the 64
intermediates NO and N2H4 cause little or no inhibition to anammox (Carvajal-Arroyo et al. 65
2013, Schalk et al. 1998). On the other hand, different levels of anammox inhibition by NO2- 66
have been reported in batch and continuous reactors. Strous et al. (1999b) found complete 67
Page 7
MANUSCRIP
T
ACCEPTED
ACCEPTED MANUSCRIPT
inhibition of the anammox activity at NO2- concentration of 100 mg N L-1, while other authors 68
have reported higher tolerance to NO2- with IC50 values of 350 mg N L-1 (Dapena-Mora et al. 69
2007) and 400 mg N L-1 (Lotti et al. 2012). Decreases in nitrogen removal efficiency, due to 70
NO2- overload in a full scale anammox reactor, have also been reported (van der Star et al. 2007). 71
The undissociated species, free nitrous acid (FNA), has been suggested to be responsible for the 72
inhibitory effect of NO2- to anammox bacteria (Fernandez et al. 2012, Jaroszynski et al. 2011). 73
On the other hand other researchers claim that the inhibition is only dependent on the total NO2- 74
concentration (Lotti et al. 2012). 75
NO2- is known to cause toxicity in a wide variety of microorganisms (Philips et al. 2002). 76
FNA, acting as a protonophore, inhibits the production of adenosine triphosphate (ATP) by 77
disrupting bacterial transmembrane proton gradients (Sijbesma et al. 1996). Inhibition of 78
different enzymes by NO2- has been reported (He et al. 2006, Titov and Petrenko 2003). In some 79
cases NO2- radicals or reactive derivatives are responsible for the toxicity (Hurst and Lymar 80
1997). The reactive nitrogen species can bind to biomolecules such as the well-known formation 81
of nitrotyrosine from reaction with tyrosine moieties (Monzani et al. 2004). 82
The mechanisms controlling the inhibitory impact of NO2- on anammox bacteria and the 83
conditions under which NO2- impacts the performance of the anammox process are still unclear. 84
Therefore, control of NO2- inhibition remains a difficulty in the application of anammox reactors. 85
In this work, the impact of pre-exposing anammox bacteria in granular biofilms to NO2- alone 86
was compared with exposure to NO2- during active metabolism (when NO2
- is added 87
simultaneously with NH4+). Moreover the potential generation of toxic by-products during NO2
- 88
exposure was evaluated. The inhibitory effect of NO2- was evaluated in batch assays by 89
Page 8
MANUSCRIP
T
ACCEPTED
ACCEPTED MANUSCRIPT
comparison of the anammox activity and accumulation of the intermediate NO in anammox 90
cultures previously pre-exposed to NO2- in the presence or absence of NH4
+. 91
2. Materials and Methods 92
93
2.1. Origin of the biomass 94
95
All the experiments were inoculated with anammox granular sludge cultivated and maintained in 96
a laboratory-scale expanded granular sludge bed (3 L) fed with a synthetic medium at a loading 97
rate of 3.7 g N L-1 d-1. The reactor was originally inoculated with anammox granular sludge 98
provided by Paques BV (Balk, The Netherlands) from a full-scale anammox wastewater 99
treatment plant in The Netherlands. This inoculum was used to start up the reactor which was 100
operated for one year before carrying out the experiments. The volatile suspended solids (VSS) 101
content of the biomass from the laboratory reactor was 5.69 ±0.04% of the wet weight. The 102
average size of the anammox granules was 2.4±0.6 mm (calculated by image analysis of a 103
photograph of the granular sludge sample using the software ImageJ). Bacteria from the genus 104
Brocadia were the dominant anammox microorganisms in the sludge granules (Carvajal-Arroyo 105
et al. 2013). 106
107
2.2. Batch bioassays 108
109
Page 9
MANUSCRIP
T
ACCEPTED
ACCEPTED MANUSCRIPT
Batch assays were performed in duplicate and incubated on an orbital shaker (160 rpm) in the 110
dark at 30±2˚C. Serum flasks (160 mL) were supplied with basal mineral medium (100 mL) and 111
anammox biomass (0.71 g VSS L-1). The mineral medium was prepared using ultrapure water 112
(Milli-Q system; Millipore) and contained the following compounds (mg L-1): NaH2PO4·H2O 113
(57.5), CaCl2·2H2O (100), MgSO4·7H2O (200), and 1.0 mL L-1 of two trace element solutions. 114
Trace element solution 1 contained (in mg L-1): FeSO4 (5,000), and ethylenediamine-tetraacetic 115
acid (EDTA) (5,000). Trace element solution 2 contained (in mg L-1): EDTA (1,500), 116
ZnSO4·7H2O (430), CoCl2·6H2O (240), MnCl2 (629), CuSO4·5H2O (250), Na2MoO4·2H2O (220), 117
NiCl2·6H20 (190), Na2SeO4·10H2O (210), H3BO3 (14), and NaWO4·2H2O (50). Either NaHCO3 118
(47.6 mM), phosphate (30 mM) or 4-(2-hydroxyethyl)-1-piperazineethanesulfonic acid (HEPES) 119
(25 mM) were utilized as buffer systems, as described below. The serum flasks were sealed with 120
rubber stoppers and aluminum crimp seals. When NaHCO3 buffer was used, the liquid and the 121
headspace were purged with a gaseous mixture of He/CO2 (80/20, v/v), resulting in a final pH of 122
7.1-7.2. In the case of using HEPES buffer, the medium was supplemented with NaHCO3 (50 mg 123
L-1) as carbon source, and the pH was adjusted to 7.2 with NaOH. Liquid and the headspace was 124
purged with ultra-high purity He. When phosphate buffer was used, NaH2PO4 and Na2HPO4 125
were added at a molar ratio of 0.46 and the medium was also supplemented with NaHCO3 (50 126
mg L-1). The pH in these experiments was 7.3. 127
Table 1 summarizes the test conditions utilized in the various experiments. The addition 128
of NO2- and NH4
+ to the bioassays was performed following the protocols described below and 129
depicted in Fig. 1. 130
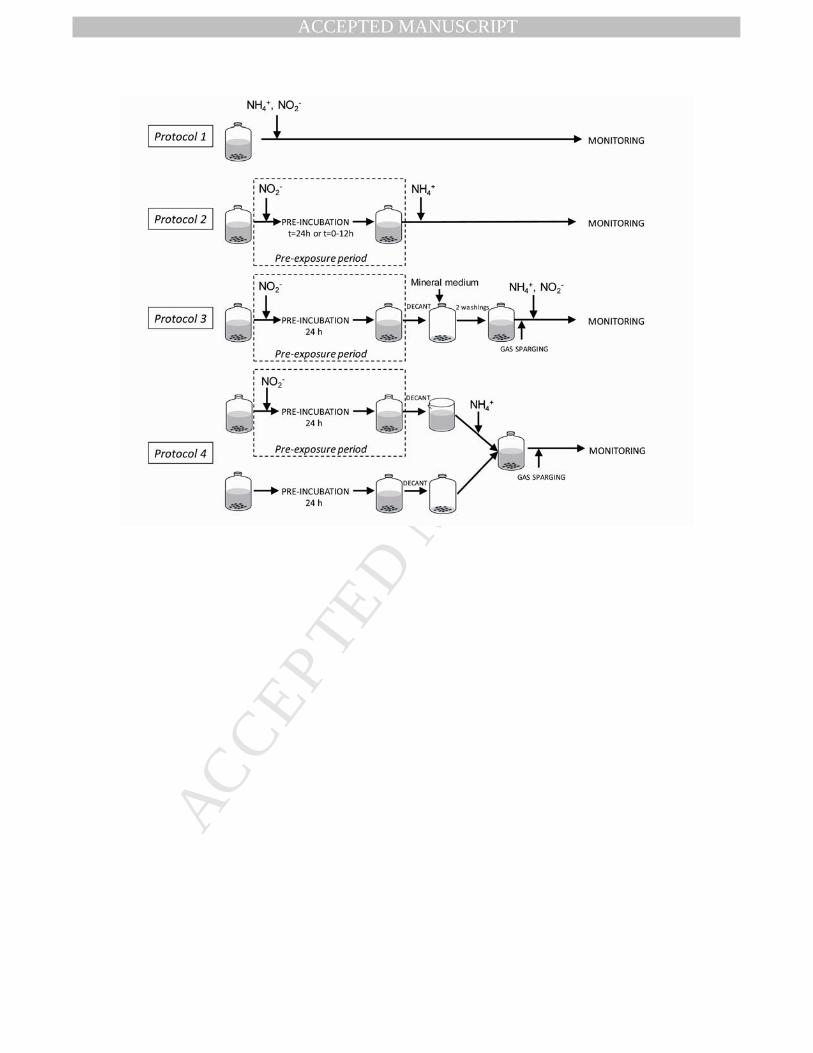
Protocol 1: NH4+ and NO2
- were added simultaneously (“simultaneous exposure”). The 131
experiments were carried out in a mineral medium with NaHCO3/CO2 as buffer system. 132
Page 10
MANUSCRIP
T
ACCEPTED
ACCEPTED MANUSCRIPT
Protocol 2: Bioassays were supplemented with NO2- and pre-incubated for different time 133
periods ranging up to 24 h (“NO2--pre-exposure”). After the pre-exposure period, bioassays were 134
spiked with NH4+. In treatments where the residual concentration of NO2
- was lower than 50 mg 135
N L-1, NO2- was supplemented to attain 50 mg N L-1. The experiments were carried out in a 136
mineral medium with NaHCO3/CO2 as a buffering system. 137
Protocol 3: The biomass was pre-exposed to NO2- for 24 h. After that period, the biomass 138
was allowed to settle and the liquid was decanted and replaced by 100 mL of mineral medium 139
containing no N-compounds. This process was repeated twice to ensure that no NO2- remained in 140
the granules (“washed granules”). Subsequently, the bottles were closed and flushed with He, 141
and NH4+ and NO2
- were added simultaneously. In order to avoid pH variations during the 142
manipulation of the flasks, these experiments were carried out in HEPES buffer and in phosphate 143
buffer. 144
In assays performed according to protocols 2 and 3, controls were included where the 145
biomass was pre-exposed to NH4+ (76 mg N L-1) (in absence of NO2
-) during the “pre-exposure 146
period.” The controls were supplemented with NO2- (100 mg N L-1) after 24 h of incubation. 147
Likewise, controls were included in which no N-containing substrates were added during the pre-148
exposure period. These controls were supplemented with NO2- and NH4
+ after 24 h of 149
incubation. 150
Protocol 4: In these experiments, fresh anammox biomass was incubated with 151
anaerobically decanted liquid medium obtained from a nitrite pre-exposure assay. Afterwards the 152
medium was supplemented with NH4+, the bottles were sealed and purged with He. The 153
experiments were carried out in HEPES- or in phosphate-buffered medium. 154
Page 11
MANUSCRIP
T
ACCEPTED
ACCEPTED MANUSCRIPT
In all the cases, samples of the headspace were analyzed for N2 and NO at the beginning 155
and at the end of the pre-exposure period, and periodically, after addition of NH4+. Liquid was 156
sampled after addition of the substrates and at the end of the experiments, for analysis of NH4+, 157
NO2- and NO3
-. 158
159
2.3. Analytical methods 160
161
Nitrate (NO3-) and NO2
- were analyzed by suppressed conductivity ion chromatography using a 162
Dionex IC-3000 system (Sunnyvale, CA, USA) fitted with a Dionex IonPac AS18 analytical 163
column (4 × 250 mm) and an AG18 guard column (4 × 50 mm). During each run, the eluent (15 164
mM KOH) was used for 20 min. NH4+ was determined using a Mettler Toledo SevenMulti ion 165
selective meter with a Mettler Toledo selective NH4+ electrode (Mettler Toledo, Columbus, OH, 166
USA). N2 was analyzed using a Hewlett Packard 5890 Series II gas chromatograph (Agilent 167
Technologies, Palo Alto, CA, USA) fitted with a Carboxen 1010 Plot column (30 m x 0.32 mm) 168
and a thermal conductivity detector. The temperatures of the column, the injector port and the 169
detector were 220, 110 and 100°C, respectively. Helium was used as the carrier gas and the 170
injection volume was 100 µL. NO was analyzed using a chemiluminescence detector model 171
NOA 280i (General Electric, Fairfield, CT, USA). The VSS content was analyzed according to 172
Standard Methods (APHA, 2005). 173
174
2.4. Assessment of specific anammox activity and inhibition 175
176
Page 12
MANUSCRIP
T
ACCEPTED
ACCEPTED MANUSCRIPT
The specific anammox activity (SAA) was measured based on the N2 production rate and 177
expressed as g N g VSS-1 d-1. The SAA was calculated from the maximum slope of the time 178
course of the N2 concentration in the headspace as follows: (SAA) = ΔN2 (g VSS Δt)-1. The 179
activity of each experiment was normalized with respect to the activity of a control not subjected 180
to inhibitory conditions, normalized anammox activity (nAA, %) = (SAAinhibited/SAAcontrol) x 181
100. The concentration of NO2- causing 50% inhibition (IC50) was calculated by interpolation in 182
the graphs plotting the nAA as a function of the NO2- concentration. 183
184
2.5. NO2- diffusion model 185
186
The effect of the length of the pre-exposure period (Table 1) was compared with a model 187
simulating the diffusion of NO2- through the granules. The evolution of the volume percentage of 188
“un-exposed” biomass uB(%)(t) in an average granule was evaluated with time, and compared 189
with the evolution of nAA(%) of the biomass. 190
The NO2- transport into an average granule could be evaluated by assuming that granules 191
are spherical. The NO2- transport is analyzed with a general mass balance that considers the NO2
- 192
transport only in radial coordinates because of symmetry, and the concentration of NO2- was 193
uniform for a fixed radius. In addition, a constant diffusion coefficient, and no chemical reaction 194
are considered. The model that results was based on Fick’s law: 195
( ) ( ) ( )
∂∂⋅+
∂∂=
∂∂
r
trC
rr
trCD
t
trC ,2,,2
2
(1) 196
Page 13
MANUSCRIP
T
ACCEPTED
ACCEPTED MANUSCRIPT
where r is the radius of the sphere, C is the concentration of NO2- at time t, and D is the 197
apparent diffusivity. At the initial time, the concentration of NO2- is considered to be zero in the 198
entire granule. The concentration of NO2- in the surface of the granule for times larger than zero, 199
is considered constant, and expressed as C(R, t) = C0 where R is the average radius of the 200
granules (1.2 mm). In the center of the sphere, the derivative of the concentration with respect to 201
the radio is considered equal to zero by symmetry. Then, the solution of Eq. (1) results in 202
equation 2 (derivation of the model and other data can be found in Supplementary data, SD): 203
( ) ( )rn
R
rn
enR
C
trC
n
R
tDn
+= ∑∞
=
−
π
ππ
π sincos
21
,
10
2
22
(2) 204
The volume percentage of unexposed biomass (uB%(t)) was calculated as a function of time 205
and it is the percentage of the granule volume exposed at NO2- concentrations of lower than the 206
bulk concentration 98 mg N L-1. 207
( )3
3
100%R
rtuB ×= (3) 208
209
210
3. Results 211
212
3.1. Inhibition by NO2- in the presence or absence of NH4
+ 213
214
Since NO2- is a substrate and inhibitor of anammox bacteria, its impact on the anammox process 215
may be different depending on whether it is being actively metabolized or not. Thus the presence 216
Page 14
MANUSCRIP
T
ACCEPTED
ACCEPTED MANUSCRIPT
of NH4+ may affect the tolerance of anammox bacteria to NO2
- inhibition. The effect of NO2- on 217
the nAA of anammox granular sludge was evaluated over a range of NO2- concentrations in the 218
presence of NH4+ and compared to the residual nAA of biomass pre-exposed to NO2
- in absence 219
of NH4+ during 24 h. The inhibitory effect of NO2
- was greatly enhanced in the absence of NH4+. 220
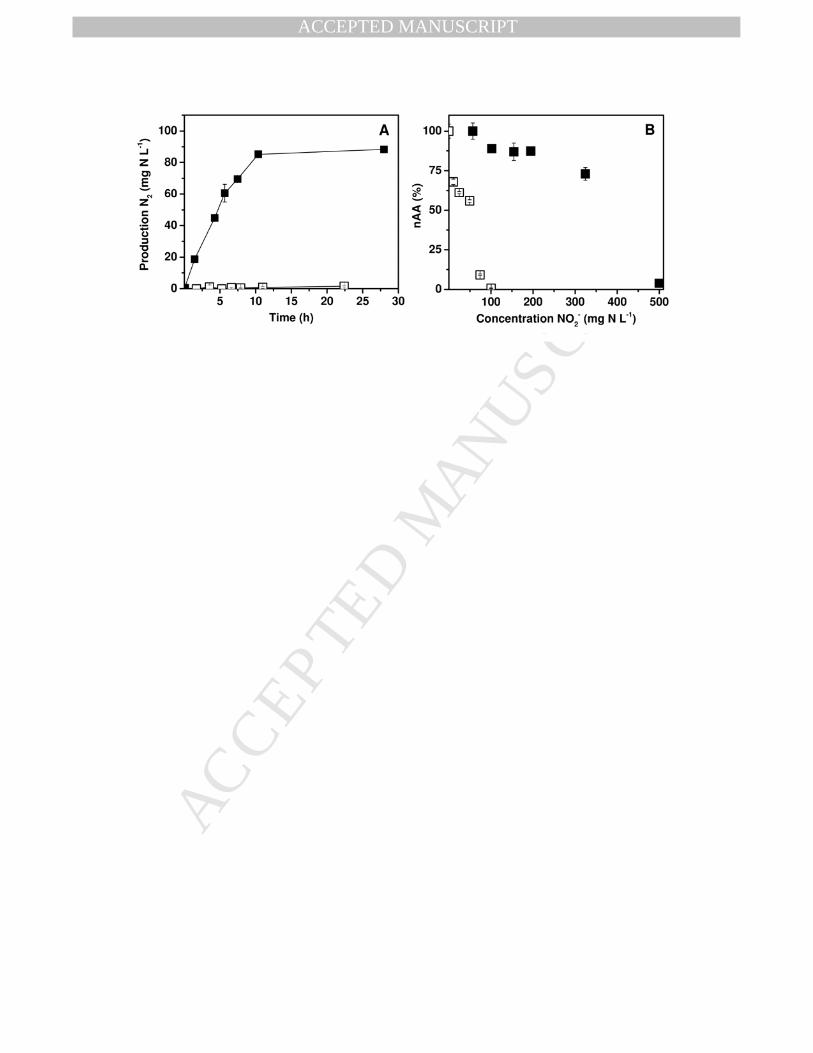
Fig. 2A compares the time course of N2 formation with and without pre-exposure to NO2- (100 221
mg N L-1). In experiments where NH4+ and NO2
- were fed simultaneously from the beginning, 222
rapid production of N2 occurred. However, in experiments where the biomass was first pre-223
exposed to NO2- for 24 h prior to the NH4
+ addition, there was essentially no N2 production for 224
22 h after subsequent addition of NH4+. Fig. 2B shows the nAA as a function of NO2
- 225
concentration with and without NO2- pre-exposure for 24 h. The graph clearly illustrates there is 226
large difference in the impact of NO2- depending on whether it was pre-exposed or fed 227
simultaneously with NH4+. The IC50 values were 53 and 384 mg NO2
--N L-1 for incubations pre-228
exposed to NO2- and simultaneous incubations, respectively. Complete inhibition was observed 229
at 100 and 500 NO2--N L-1, respectively. Based on the IC50 values, the NO2
- was approximately 230
7.2-fold more inhibitory when pre-exposed compared to simultaneous feeding. Controls pre-231
exposed to NH4+ (instead of NO2
-) caused no detrimental effect nor did starving the anammox 232
biomass of both NO2- and NH4
+ have any negative impact (Fig. S1; SD). Thus it is the exposure 233
to NO2- alone rather than a short starvation period that was responsible for the impact. 234
235
3.2. Effect of the duration of the pre-exposure period 236
237
Page 15
MANUSCRIP
T
ACCEPTED
ACCEPTED MANUSCRIPT
A separate experiment was designed in order to determine how rapidly the NO2- pre-exposure 238
inflicts full impact. Anammox granular sludge was pre-exposed to NO2- (100 mg N-NO2
- L-1) for 239
different periods of time prior to the addition of NH4+ in order to test the role of pre-exposure 240
time on inhibition of anammox metabolism (Table 1, Figure 3). The results obtained show that 241
anammox inactivation by NO2- occurred quickly. After only 30 min of pre-exposure to NO2
- the 242
inhibition was 74%. When the pre-exposure was continued up to 12 h, the observed inhibition 243
approached 100%. Calculations of NO2- diffusion rate indicate that over the first 15 min when 244
approximately 46% of the nAA was lost, the rate of activity loss was similar to the diffusion rate 245
(Fig. 3). Thereafter, further increments in the inhibition required more time than the calculated 246
diffusion of NO2- to impart further losses in activity. 247
248
3.3. Role of the liquid medium pre-incubated with NO2- 249
250
The strong inhibition observed following exposure of anammox bacteria to NO2- pre-exposure 251
(Fig. 2) could be due to the formation of toxic byproducts during pre-incubation. To test this 252
hypothesis, anammox bacteria were exposed to decanted culture media obtained from bioassays 253
pre-exposed to NO2- for 24 h. The procedure followed in these assays was according to protocol 254
4 (Fig. 1). Likewise, the medium of anammox bacteria pre-exposed to NO2- for 24 h was 255
decanted; the biomass was washed and the assays were replaced with fresh medium to determine 256
if the washing reversed the toxicity or if the anammox cells were damaged by the NO2- pre-257
exposure. The experimental procedure followed in these assays was protocol 3 (Fig. 1). 258
Page 16
MANUSCRIP
T
ACCEPTED
ACCEPTED MANUSCRIPT
Fig. 4 compares the nAA of biomass simultaneously fed with NH4+ and NO2
- (A), 259
biomass pre-exposed to NO2- (B), biomass washed after pre-exposure to NO2
- (C), and healthy 260
biomass exposed to a medium decanted from a 24 h NO2- pre-exposure treatment (D). These 261
bioassays were conducted both in HEPES and phosphate buffer. Washing the biomass after the 262
pre-exposure period caused a moderate relief in the inhibition. The observed nAA after recovery 263
was higher in HEPES buffer (42%) than in phosphate buffer (20%). The use of a medium pre-264
incubated with NO2- caused inhibition of healthy biomass (22% in HEPES buffer, and 39% in 265
phosphate buffer). These results indicate that inhibition occurred partly due to the inactivation of 266
the biomass by NO2- and partly due to the formation of soluble toxic intermediates. 267
268
3.4. Nitric oxide accumulation 269
270
Accumulation of NO gas, an anammox intermediate (Kartal et al. 2011), was observed in the 271
headspace of bioassays inhibited by exposure to NO2-. In experiments where the biomass was 272
exposed simultaneously to NO2- and NH4
+ , accumulation of NO was only observed in treatments 273
with very high NO2- levels (500 mg NO2
--N L-1) coinciding with conditions in which N2 274
production was completely inhibited (Fig. 5). In contrast, NO gas was detected at much lower 275
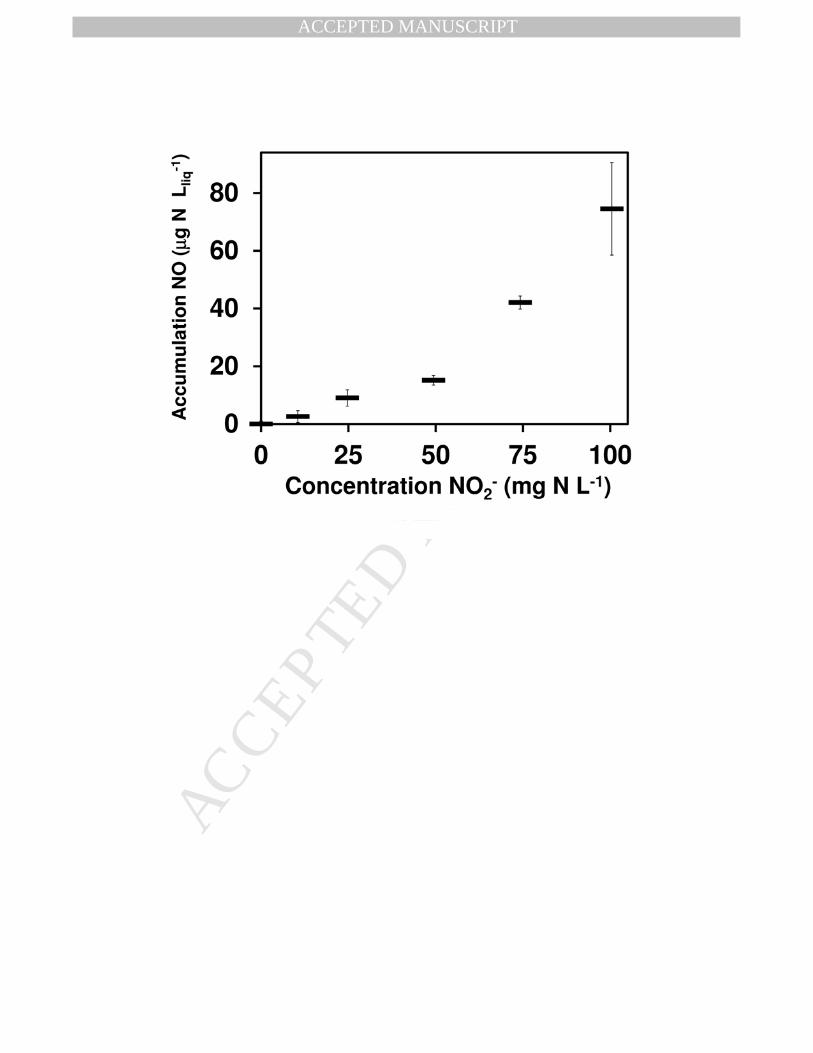
NO2- concentrations if the biomass was pre-exposed to NO2
- (Fig. 6). Such conditions occurred 276
when the NO2- concentration was equal or higher than 25 mg NO2
--N L-1. As shown in Fig. 6, the 277
concentration of NO in the headspace of these assays increased with the increasing 278
concentrations of NO2- in the pre-exposure period. At 500 mg NO2
--N L-1, the 24 h production of 279
NO in simultaneously fed cultures (Fig. 5) was the same as that of 100 NO2--N L-1 in NO2
- pre-280
Page 17
MANUSCRIP
T
ACCEPTED
ACCEPTED MANUSCRIPT
exposed cultures (Fig. 5) suggesting that a 5-fold lower NO2- concentration was needed to 281
achieve the same impact on NO production in the pre-exposed cultures. 282
The impact of the duration of NO2- pre-exposure (100 mg NO2
--N L-1) on anammox 283
activity and NO accumulation was also evaluated (Fig. 7). The increasing durations of the pre-284
exposure had increasing inhibitory impacts on the anammox activity and caused parallel 285
increases in the NO accumulation. By comparison, NO levels in the control were below the 286
detection limit. At the end of the pre-exposure period, the levels of NO in the headspace were 287
considerably higher in treatments exposed to NO2- for longer periods. After addition of NH4
+ (76 288
mg N L-1), the concentration of NO in the gas phase continued to increase with time in all the 289
pre-exposed treatments suggesting that the anammox bacterial cells were damaged. However, 290
NO levels decreased gradually after 2 to 6 h of incubation after NH4+ addition, which occurred in 291
synchrony with the moment there was partial recovery in the anammox activity. 292
293
294
4. Discussion 295
296
4.1. Influence of physiological state on NO2- inhibition of anammox bacteria 297
298
The results obtained indicate that the inhibitory effect of NO2- to anammox is greatly enhanced 299
in the absence of NH4+ (Fig. 2). The IC50 value determined for NO2
- was 7.2 times lower when 300
the anammox culture was pre-exposed to NO2- (non-metabolizing) versus simultaneous exposure 301
to NH4+ that enables active metabolism. Although a NO2
- concentration of 100 mg N L-1 has 302
Page 18
MANUSCRIP
T
ACCEPTED
ACCEPTED MANUSCRIPT
been reported to be a safe limit for operation of anammox bioreactors (Jin et al. 2012), the results 303
in this work show that under non-metabolizing conditions, considerable inhibition can occur 304
following pre-exposure to lower NO2- concentrations. 305
Non-metabolic pre-exposure to NO2- was shown to cause detrimental impact very 306
quickly, with 74% of the full impact occurring within 30 min of incubation (Fig. 3). The 307
decrease in the SAA(%) was compared to the decrease of the uB(%), obtained from the 308
simulation of NO2- diffusion through the granule (Fig. 3). The uB(%) represents the percentage 309
volume of an average granule, not impacted by a NO2- concentration of 98 mg N L-1 or higher, 310
and it decreases as the NO2- diffuses through the granule. The results in Fig. 3 suggest that in the 311
absence of NH4+ the initial toxic effect is controlled by the diffusion of NO2
- through the granule. 312
After 15 min of pre-exposure, further penetration of the NO2- does not cause a proportional 313
decrease in activity. The delay of the inhibition with respect the diffusion of NO2- could be due 314
to two reasons. The first may be an active mechanism of detoxification carried out by cells. The 315
second may be due to additional time required to extensively damage biomolecules. Other 316
authors have suggested that mass transfer limitation may impact the extent of the inhibition 317
caused by NO2-. Suspended biomass has been shown to be more sensitive to NO2
- than granular 318
sludge (Cho et al. 2010), and the highest tolerance to NO2- inhibition, reported in the literature, 319
was observed in anammox biomass embedded in a gel carrier (Kimura et al. 2010). 320
In order to determine if the toxicity caused by pre-exposure of anammox cells to NO2- is 321
irreversible, the cells were washed prior to addition of NH4+ and NO2
-. The washing caused a 322
modest recovery of the SAA, when compared to the non-washed biomass (Fig. 4). This indicates 323
that the NO2- toxicity is only partially reversible by washing, confirming that a large portion of 324
Page 19
MANUSCRIP
T
ACCEPTED
ACCEPTED MANUSCRIPT
the toxicity observed was due to a lasting damage to cells. The low recovery of activity after 325
biomass washing obtained in this work contrasts with the high recovery rates previously reported 326
in the literature. For example, Scaglione (2012) observed almost complete recovery of SAA after 327
pre-exposure to 100 mg NO2--N L-1 for 48 h, and Lotti (2012) observed that the SAA decrease 328
after exposure to 500 mg N L-1 was not higher than 35%. In these two cases the NO2- 329
concentration applied after the washing was lowered to 50 mg N L-1, while in our case the level 330
of NO2- was the same as in the pre-exposure period (100 mg N L-1). Other factors such as pH 331
differences may have also contributed to the divergence. The medium pH is known to have a 332
marked influence on NO2- inhibition to anammox activity (Jaroszynski et al. 2011). The medium 333
pH used in the current study was 7.2-7.3; whereas the previous studies applying washing used 334
pH values ranging from 7.5-7.7 (Lotti et al. 2012, Scaglione et al. 2012). 335
Additionally, activity tests performed with liquid medium recovered from the pre-336
incubation with NO2- (100 mg N L-1) showed that this medium inhibited healthy anammox cells 337
(38.8 and 21.5% in phosphate and HEPES buffers, respectively) (Fig. 4). These findings indicate 338
that a toxic by-product may have been formed during the pre-incubation period. The difference 339
in the results obtained in HEPES buffer and phosphate buffer may be related to the chemistry of 340
the formation of the toxic by-product, favored in phosphate buffered medium. 341
The formation of toxic NO2- derivatives in biological medium has been previously 342
reported (Philips et al. 2002). NO and intermediates produced by NO2- reduction can potentially 343
generate other toxic products like nitrogen dioxide or peroxynitrite anion with high reactivity 344
against biomolecules, including DNA, lipids, or proteins (e.g.,tyrosine residues) (Mehl et al. 345
1999). The reaction products of NO2- and different aminoacids were shown to be more toxic to 346
activated sludge, than NO2- itself (Philips et al. 2002). 347
Page 20
MANUSCRIP
T
ACCEPTED
ACCEPTED MANUSCRIPT
348
4.2. NO accumulation, evidence of disrupted anammox cells 349
350
NO gas accumulated in experiments where NO2- inhibition occurred. Five times more NO2
- were 351
needed to cause NO gas accumulation in experiments with simultaneous exposure than in NO2- 352
pre-exposed treatments. The amount of NO accumulated in the headspace depended on the NO2- 353
concentration as well as on the length of the pre-exposure period (Figs. 6 and 7B). 354
In anaerobic environments, NO can be generated chemically or, from biological 355
reduction of NO2- by denitrification or anammox. NO can be generated chemically from the 356
reaction of Fe2+ in the medium and NO2- (Kampschreur et al. 2011). The observed dependence of 357
the NO production on the NO2- concentration could suggest a chemical reaction as the source of 358
the NO in our assays. Nevertheless, chemical formation of NO was discarded from evidence in 359
abiotic controls containing 100 mg NO2--N L-1, in which NO could not be detected. Another 360
possible source of NO gas is endogenous denitrification. Experiments where the granular sludge 361
was amended with NO2- (100 mg N L-1), and hydrogen or methanol at stoichiometric 362
concentrations, were monitored for longer than 24 h, and denitrifying activity could not be 363
detected (Fig. S2; SD). Therefore, anammox seems to be the source of the NO. The low amount 364
of NO detected is consistent with the use of an endogenous source of electrons by anammox 365
bacteria. As shown in Fig. 7, the accumulation of NO did not cause a complete halt in the N2 366
production, and therefore the accumulation of NO seems to be an indicator of disruption of 367
anammox metabolism by NO2- inhibition, rather than the cause of the inhibition (Kartal et al. 368
2010). NO and NH4+ are the substrates of the enzyme hydrazine synthase which produces N2H4, 369
Page 21
MANUSCRIP
T
ACCEPTED
ACCEPTED MANUSCRIPT
later oxidized to N2. The accumulation of NO under conditions of NO2- inhibition suggests that 370
this step of the anammox catabolism may be interrupted. 371
372
4.3. Hypothesis for NO2- inhibition 373
374
The absence of NH4+ enhances the toxic effect of NO2
-. The big difference in the extent of the 375
inhibition observed under metabolizing conditions or under non-metabolizing conditions (in 376
absence of NH4+) suggests that the inhibition does not depend only on the NO2
- concentration but 377
also in the physiological status of the cells. 378
Three different phenomena could explain this behavior. Firstly, active anammox metabolism 379
is only made feasible in the presence of NH4+, which provides a sink for NO2
-, lowering its 380
concentration to non-toxic levels. Clearly the accumulation of NO2- in the anammoxosome is due 381
in part to this first phenomena since without NH4+ there will be no metabolism of NO2
-. 382
Consequently it will accumulate and potentially inhibit HZS and as a consequence NO will 383
accumulate as was witnessed in this study. The NO accumulation and anammox inhibition linger 384
even after adding NH4+. 385
Secondly, mechanisms of NO2- detoxification are probably dependent upon the availability of 386
metabolic energy to pump NO2- out of sensitive regions of the cell. If cells are non-metabolizing, 387
NO2--pumps will not be active. Consequently NO2
- may not be adequately pumped out of 388
sensitive areas of the cell (e.g. riboplasm, anammoxosome) where lasting damage to 389
biomolecules can potentially be imparted. Anammox catabolism leads to the generation of an 390
intracellular proton gradient between both sides of the anammoxosome membrane (van der Star 391
Page 22
MANUSCRIP
T
ACCEPTED
ACCEPTED MANUSCRIPT
et al. 2010). NO2- active transport proteins (NirC) have been found in the anammox genome (van 392
de Vossenberg et al. 2012), which are H+ and NO2- symporters dependent on a transmembrane 393
proton motive force. Therefore, the capability of anammox bacteria to actively metabolize NH4+ 394
and NO2- , and maintain the proton gradient, will directly affect the active transport of NO2
- 395
between the anammoxosome and the other compartments (e.g. riboplasm). Some authors have 396
suggested that the intracellular proton gradient is positive inside the anammoxosome (van der 397
Star et al. 2010, van Niftrik and Jetten 2012), therefore NirC could be involved in NO2- 398
detoxification, translocating NO2-. In order to validate this mechanism, the role of NO2
- transport 399
proteins in anammox bacteria, as well as the effect of the pH on NO2- inhibition need to be 400
further investigated. 401
Thirdly NH4+ may act as a reductant for the proper turn-over of enzymes and their cofactors. 402
Inactivated oxidized enzyme cofactor requires electron equivalents to properly turn over. There 403
is ample evidence that NO2- inhibited cells can be rapidly recovered using highly reduced 404
substrates such N2H4 or hydroxyl amine (NH2OH) (Bettazzi et al. 2010, Strous et al. 1999b). 405
The higher permeability of biological membranes to undissociated compounds has led to the 406
belief that free nitrous acid and not the NO2- anion causes inhibition of anammox bacteria 407
(Fernandez et al. 2012, Jaroszynski et al. 2011). Nevertheless, the uniqueness of the ladderane 408
anammoxosome membrane (Fuerst et al. 2006) has been suggested to be a barrier for FNA 409
passage (Lotti et al. 2012), and therefore the mechanism of NO2- accumulation in the 410
anammoxosome would not depend only on the bulk concentration of free nitrous acid. 411
412
4.4. Implications 413
Page 23
MANUSCRIP
T
ACCEPTED
ACCEPTED MANUSCRIPT
414
The anammox process can be inhibited by nitrite. NO2- inhibition is not only dependent on the 415
bulk NO2- concentration, but also on the physiological status of the cells. The susceptibility of 416
anammox bacteria to inhibition by NO2- is higher when NH4
+ is not available. On the other hand, 417
when NH4+ is actively being metabolized, anammox bacteria have a higher resistance to NO2
- 418
inhibition. The inhibitory effect of NO2- in absence of NH4
+ occurs very quickly, impacting the 419
activity of the cells in a matter of minutes. The detrimental effect of NO2- can be partially 420
reverted by washing of the cells. The anammox process is applied in combination with a 421
previous step, of partial nitrification, were approximately half of the NH4+ is oxidized to NO2
-. 422
This can be done in different configurations (i.e., CANON, SHARON, sequencing batch 423
reactor). This work shows that the operation of the nitritation step is critical for the safe 424
application of the anammox process. An event resulting in complete oxidation of NH4+ to NO2
- , 425
during the nitritation step, could lead to failure of the anammox process. Or if NH4+ and NO2
- are 426
being pumped into an anammox reactor from two different sources, a failure of the NH4+ 427
delivery pump could have a serious inhibitory impact. Strategies must be followed to avoid such 428
events and, in the case that they occur, measures need to be in place to minimize the duration of 429
the disturbance. 430
431
432
433
Acknowledgements 434
This work has been supported by the University of Arizona Water Sustainability Program, and 435
by the National Science Foundation (under Contract CBET-1234211). 436
Page 24
MANUSCRIP
T
ACCEPTED
ACCEPTED MANUSCRIPT
437
438
References 439
440
APHA 2005. Standard methods for the examination of water and wastewater. Eaton, A. D., 441
Clesceri, L. S., Rice, E. W., Greenberg, A. E., Eds., 21st Ed. Washington D.C., American 442
Public Health Association. 443
Bettazzi, E., Caffaz, S., Vannini, C., Lubello, C., 2010. Nitrite inhibition and intermediates 444
effects on Anammox bacteria: A batch-scale experimental study. Process Biochemistry 45 445
(4), 573-580. 446
Carvajal-Arroyo, J.M., Sun, W., Sierra-Alvarez, R.,Field, J.A., 2013. Inhibition of anaerobic 447
ammonium oxidizing (anammox) enrichment cultures by substrates, metabolites and 448
common wastewater constituents. Chemosphere 91 (1), 22-27. 449
Cho, S., Takahashi, Y., Fujii, N., Yamada, Y., Satoh, H., Okabe, S., 2010. Nitrogen removal 450
performance and microbial community analysis of an anaerobic up-flow granular bed 451
anammox reactor. Chemosphere 78 (9), 1129-1135. 452
Dapena-Mora, A., Fernandez, I., Campos, J.L., Mosquera-Corral, A., Mendez, R., Jetten, 453
M.S.M., 2007. Evaluation of activity and inhibition effects on Anammox process by batch 454
tests based on the nitrogen gas production. Enzyme and Microbial Technology 40 (4), 859-455
865. 456
Fernandez, I., Dosta, J., Fajardo, C., Campos, J.L., Mosquera-Corral, A.,Mendez, R., 2012. 457
Short- and long-term effects of ammonium and nitrite on the Anammox process. Journal of 458
Environmental Management 95, S170-S174. 459
Page 25
MANUSCRIP
T
ACCEPTED
ACCEPTED MANUSCRIPT
Fuerst, J., Webb, R., Niftrik, L., Jetten, M.M., Strous, M., 2006. Complex Intracellular Structures 460
in Prokaryotes. Shively, J. (Ed), 259-283, Springer, Berlin, Germany. 461
He, Q., Huang, K.H., He, Z., Alm, E.J., Fields, M.W., Hazen, T.C., Arkin, A.P., Wall, J.D., 462
Zhou, J., 2006. Energetic consequences of nitrite stress in Desulfovibrio vulgaris 463
Hildenborough, inferred from global transcriptional analysis. Applied and Environmental 464
Microbiology 72 (6), 4370-4381. 465
Hurst, J.K., Lymar, S.V., 1997. Toxicity of peroxynitrite and related reactive nitrogen species 466
toward Escherichia coli. Chemical Research in Toxicology 10 (7), 802-810. 467
Jaroszynski, L.W., Cicek, N., Sparling, R., Oleszkiewicz, J.A., 2011. Importance of the operating 468
pH in maintaining the stability of anoxic ammonium oxidation (anammox) activity in moving 469
bed biofilm reactors. Bioresource Technology 102 (14), 7051-7056. 470
Jin, R.C., Yang, G.F., Yu, J.J., Zheng, P., 2012. The inhibition of the Anammox process: A 471
review. Chemical Engineering Journal 197, 67-79. 472
Kampschreur, M.J., Kleerebezem, R., de Vet, W.W.J.M., van Loosdrecht, M.C.M., 2011. 473
Reduced iron induced nitric oxide and nitrous oxide emission. Water Research 45 (18), 5945-474
5952. 475
Kartal, B., Tan, N.C.G., Van de Biezen, E., Kampschreur, M.J., Van Loosdrecht, M.C.M., Jetten, 476
M.S.M., 2010. Effect of nitric oxide on anammox bacteria. Applied and Environmental 477
Microbiology 76 (18), 6304-6306. 478
Kartal, B., Maalcke, W.J., de Almeida, N.M., Cirpus, I., Gloerich, J., Geerts, W., den Camp, H., 479
Harhangi, H.R., Janssen-Megens, E.M., Francoijs, K.J., Stunnenberg, H.G., Keltjens, J.T., 480
Jetten, M.S.M., Strous, M., 2011. Molecular mechanism of anaerobic ammonium oxidation. 481
Nature 479 (7371), 127-U159. 482
Page 26
MANUSCRIP
T
ACCEPTED
ACCEPTED MANUSCRIPT
Kimura, Y., Isaka, K., Kazama, F., Sumino, T., 2010. Effects of nitrite inhibition on anaerobic 483
ammonium oxidation. Applied Microbiology and Biotechnology 86 (1), 359-365. 484
Lotti, T., van der Star, W.R.L., Kleerebezem, R., Lubello, C., van Loosdrecht, M.C.M.,2012. 485
The effect of nitrite inhibition on the anammox process. Water Research 46 (8), 2559-2569. 486
Mehl, M., Daiber, A., Herold, S., Shoun, H., Ullrich, V., 1999. Peroxynitrite reaction with heme 487
proteins. Nitric Oxide-Biology and Chemistry 3 (2), 142-152. 488
Monzani, E., Roncone, R., Galliano, M., Koppenol, W.H., Casella, L., 2004. Mechanistic insight 489
into the peroxidase catalyzed nitration of tyrosine derivatives by nitrite and hydrogen 490
peroxide. European Journal of Biochemistry 271 (5), 895-906. 491
Philips, S., Laanbroek, H., Verstraete, W., 2002. Origin, causes and effects of increased nitrite 492
concentrations in aquatic environments. Reviews in Environmental Science and 493
Biotechnology 1 (2), 115-141. 494
Scaglione, D., Ruscalleda, M., Ficara, E., Balaguer, M.D., Colprim, J., 2012. Response to high 495
nitrite concentrations of anammox biomass from two SBR fed on synthetic wastewater and 496
landfill leachate. Chemical Engineering Journal 209 (0), 62-68. 497
Schalk, J., Oustad, H., Kuenen, J.G., Jetten, M.S.M., 1998. The anaerobic oxidation of 498
hydrazine: a novel reaction in microbial nitrogen metabolism. FEMS Microbiology Letters 499
158 (1), 61-67. 500
Sijbesma, W.F.H., Almeida, J.S., Reis, M.A.M., Santos, H., 1996. Uncoupling effect of nitrite 501
during denitrification by Pseudomonas fluorescens: An in vivo 31P-NMR study. 502
Biotechnology and Bioengineering 52 (1), 176-182. 503
Page 27
MANUSCRIP
T
ACCEPTED
ACCEPTED MANUSCRIPT
Strous, M., Fuerst, J.A., Kramer, E.H.M., Logemann, S., Muyzer, G., van de Pas-Schoonen, 504
K.T., Webb, R., Kuenen, J.G., Jetten, M.S.M., 1999a. Missing lithotroph identified as new 505
planctomycete. Nature 400 (6743), 446-449. 506
Strous, M., Kuenen, J.G., Jetten, M.S.M., 1999b. Key physiology of anaerobic ammonium 507
oxidation. Applied and Environmental Microbiology 65 (7), 3248-3250. 508
Titov, V.Y., Petrenko, Y.M., 2003. Nitrite-catalase interaction as an important element of nitrite 509
toxicity. Biochemistry-Moscow 68 (6), 627-633. 510
van de Vossenberg, J., Woebken, D., Maalcke, W.J., Wessels, H.J.C.T., Dutilh, B.E., Kartal, B., 511
Janssen-Megens, E.M., Roeselers, G., Yan, J., Speth, D., Gloerich, J., Geerts, W., van der 512
Biezen, E., Pluk, W., Francoijs, K.-J., Russ, L., Lam, P., Malfatti, S.A., Tringe, S.G., Haaijer, 513
S.C.M., Op den Camp, H.J.M., Stunnenberg, H.G., Amann, R., Kuypers, M.M.M., Jetten, 514
M.S.M., 2013. The metagenome of the marine anammox bacterium ‘Candidatus Scalindua 515
profunda’ illustrates the versatility of this globally important nitrogen cycle bacterium. 516
Environmental Microbiology, 15 (5), 1275-1289. 517
van der Star, W.R.L., Abma, W.R., Blommers, D., Mulder, J.W., Tokutomi, T., Strous, M., 518
Picioreanu, C., Van Loosdrecht, M.C.M., 2007. Startup of reactors for anoxic ammonium 519
oxidation: Experiences from the first full-scale anammox reactor in Rotterdam. Water 520
Research 41 (18), 4149-4163. 521
van der Star, W.R.L., Dijkema, C., de Waard, P., Picioreanu, C., Strous, M., van Loosdrecht, 522
M.C.M., 2010. An intracellular pH gradient in the anammox bacterium Kuenenia 523
stuttgartiensis as evaluated by (31)P NMR. Applied Microbiology and Biotechnology 86 (1), 524
311-317. 525
Page 28
MANUSCRIP
T
ACCEPTED
ACCEPTED MANUSCRIPT
van Niftrik, L., Jetten, M.S.M., 2012. Anaerobic ammonium-oxidizing bacteria: unique 526
microorganisms with exceptional properties. Microbiology and Molecular Biology Reviews 527
76 (3), 585-596. 528
529
Page 29
MANUSCRIP
T
ACCEPTED
ACCEPTED MANUSCRIPT
Table 1 - Summary of conditions applied to each experiment.
Pre-exposure Period Monitoring Period Experiment Protocol
NO2- (mg N L-1) Time (h)
NO2
- (mg N L-1) NH4+(mg N L-1)
NO2-inhibition in
presence of NH4+
Protocol 1 - -
50-500 38
NO2-inhibition in
absence of NH4+
Protocol 2 0-100 24
50-100 38
Effect of the length of the pre-
exposure period Protocol 2 100 0-12
100 76
Washing Effect Protocol 3 100 24
100 76
Toxicity of pre-incubated medium
Protocol 4 100 24
100 76
Page 30
MANUSCRIP
T
ACCEPTED
ACCEPTED MANUSCRIPT
Figure Captions 1
2
Fig. 1 - Experimental protocols for addition of substrates in batch bioassays. 3
4
Fig. 2 - Impact of NO2- pre-exposure on NO2
- inhibition. A, Time course of N2 production with 5
NO2- pre-exposure for 24 h (�) and with simultaneous NO2
- and NH4+ feeding (�). The NO2
- 6
and NH4+ concentrations used were 100 and 38 mg N L-1, respectively. B, The effect of NO2
- 7
concentration on the nSAA after pre-exposure for 24 h to NO2- alone (�) or when 8
simultaneously fed with NH4+ and NO2
- (�). The maximum SAA in simultaneously fed 9
treatments and pre-exposed treatments, was 0.33±0.02 and 0.40±0.02 g N g VSS-1 d-1, 10
respectively 11
12
Fig. 3 - Effect of the time of pre-exposure to 100 mg N-NO2- L-1 on nAA of anammox sludge in 13
absence of NH4+. The SAA of the non-pre-exposed control was 0.98±0.02 g N g VSS-1 d-1. 14
Insert, comparison of the nAA(%)(�) with the simulation of diffusion to calculate the uB(%) 15
(dotted line) as a function of time. 16
17
Fig. 4 - The nAA of simultaneously fed biomass (A), biomass pre-exposed to NO2- (B), biomass 18
washed after biomass pre-exposure (C), and healthy biomass exposed to a medium decanted 19
from another NO2- pre-exposed assay (D). Bars indicate the buffer system used in each 20
Page 31
MANUSCRIP
T
ACCEPTED
ACCEPTED MANUSCRIPT
experiment: HEPES buffer (�), phosphate buffer (). The SAA of the simultaneous fed controls 21
(A) were 0.80±0.03 and 0.92±0.04 g N g VSS-1 d-1 in HEPES and phosphate buffer, respectively. 22
23
Fig. 5 - Time course of N2 production (closed symbols) and NO accumulation (open symbols) at 24
initial NO2- concentrations of 57 (diamonds), and 500 (squares) mg NO2
--N L-1 when a 25
simultaneous feeding protocol of NO2- and NH4
+ was utilized. 26
27
Fig. 6 - NO gas accumulation after 24 h of pre-exposing the anammox biomass to different 28
concentrations of NO2- in the absence of NH4
+. 29
30
Fig. 7 - Time course of N2 (A) and NO (B) produced after pre-exposing the anammox biomass to 31
100 mg NO2--N L-1 for 0 min (●), 15 min (♦), 1h (▲) and 12 h (■). 32
33
Page 32
MANUSCRIP
T
ACCEPTED
ACCEPTED MANUSCRIPT
Page 33
MANUSCRIP
T
ACCEPTED
ACCEPTED MANUSCRIPT
Page 34
MANUSCRIP
T
ACCEPTED
ACCEPTED MANUSCRIPT
Page 35
MANUSCRIP
T
ACCEPTED
ACCEPTED MANUSCRIPT
Page 36
MANUSCRIP
T
ACCEPTED
ACCEPTED MANUSCRIPT
Page 37
MANUSCRIP
T
ACCEPTED
ACCEPTED MANUSCRIPT
Page 38
MANUSCRIP
T
ACCEPTED
ACCEPTED MANUSCRIPT
Page 39
MANUSCRIP
T
ACCEPTED
ACCEPTED MANUSCRIPT
• The inhibitory impact of nitrite on anammox activity is enhanced in absence of NH4+
• NO2- itself can cause inhibition of anammox metabolism
• NO2- leads to the generation of toxic byproducts damaging the cells
• The inhibitory effect is partially reversible
• Nitric oxide (NO) gas accumulates as a result of NO2- inhibition
Page 40
MANUSCRIP
T
ACCEPTED
ACCEPTED MANUSCRIPT
Supplementary data
Pre-exposure to Nitrite in the Absence of Ammonium Strongly Inhibits Anammox
José M. Carvajal-Arroyo*, Daniel Puyol, Guangbin Li, Armando Lucero-Acuña, Reyes Sierra-Alvarez, Jim A. Field
Department of Chemical and Environmental Engineering, University of Arizona, P.O. Box 210011, Tucson, Arizona, USA
1. Effect of pre-exposure to NH4+ in absence of NO2
-
NO2- pre-exposure was studied and discussed in the manuscript. In order to discard side effects,
exposure to NH4+ was also studied. The biomass was incubated for 24h in presence of NH4
+ (76
mg N L-1). After the pre-exposure period, NO2- was supplemented (up to 100 mg N L-1). As
shown in Fig. SD1, neither exposing the anammox granular sludge to NH4+ , nor starving
biomass for 24 h had a negative effect on the SAA. Non-pre-incubated control had a SAA of
0.92±0.02 g N g VSS d-1 and NH4+ pre-exposed biomass showed an SAA of 0.90±0.00 g N g
VSS d-1. The biomass starved for 24 h, showed a SAA of 0.92±0.04 g N g VSS d-1.
Fig. S1 - Time course of N2 production of non-pre-incubated biomass (�), biomass pre-
incubated in absence of N compounds (�), and biomass pre-exposed to NH4+ for 24 h ().
0
50
100
150
200
0 5 10 15 20
Pro
duct
ion
N2
(mg
N L
-1)
Time (h)
Page 41
MANUSCRIP
T
ACCEPTED
ACCEPTED MANUSCRIPT
2. Denitrifying activity of the anammox granular sludge
The anammox granules were tested for denitrification. Batch experiments were carried out were
the biomass was incubated in presence of NO2- (100 mg N L-1) and stoichiometric amounts of H2
gas or methanol, as electron donors for denitrification.
0
50
100
150
200
0 5 10 15 20 25
Pro
duct
ion
N2
(mg
N L
-1)
Time (h)
Fig. S2 – Timec ourse of N2 production of non-pre-incubated biomass (�), biomass incubated in
presence of NO2- only (�), biomass incubated in presence of NO2
- and H2 (∆) or methanol ().
As shown in Fig. S2, the production of N2 by the anammox granular sludge was not
stimulated in presence of electron donors that could be potentially used by denitrifiers. The N2
production by biomass incubated in presence of NO2- only, as well the one incubated in presence
of H2 or methanol, was almost inexistent. The NO accumulation was also very similar in the
three cases.
3. NO2- diffusion model
Page 42
MANUSCRIP
T
ACCEPTED
ACCEPTED MANUSCRIPT
The NO2- transport into the bacteria clusters could be evaluated by assuming that clusters are
spherical. The NO2- transport is analyzed with a general mass balance that considers the NO2
-
transport only in radial coordinates because of symmetry, and the concentration of NO2- uniform
for a fixed radius. In addition, a constant diffusion coefficient and no chemical reaction are
considered. The model that results get defined by Fick’s law:
(S1)
where r is the radius of the sphere, C is the concentration of NO2- at time t, and D is the apparent
diffusion coefficient, calculated as:
τφρ
φ
+
⋅=
bd
aq
k
DD
1
(S2)
being Φ the porosity of the granular sludge, assumed equal to 0.96 (Alphenaar et al. 1992), Daq
the diffusion coefficient of NO2- in water, 1,700 µm2 s-1 (Picioreanu et al. 1997), ρb the density of
water at 30ºC (995.65 g L-1), kd the partition coefficient water-cells, (assumed kd= 1), and τ the
tortuosity of the granule (assumed τ= 1.414).
The system is analyzed with the initial and boundary conditions:
(S3)
(S4)
(S5)
To solve this problem, we introduce a change of variable,
Page 43
MANUSCRIP
T
ACCEPTED
ACCEPTED MANUSCRIPT
(S6)
Then, applying Eq. (S6), the system of equations becomes,
(S7)
with the initial and boundary conditions:
(S8)
(S9)
(S10)
Now, the solution of Eq. (S7) could be obtained by a method of separation of variables of the
form:
(S11)
Eq. (S7) then becomes:
(S12)
From this we have:
(S13)
where is a constant to be determinated. Eq. (S13) contains two expressions:
(S14)
Page 44
MANUSCRIP
T
ACCEPTED
ACCEPTED MANUSCRIPT
(S15)
The solution of Eq. (S14) becomes:
(S16)
Eq. (S15) has a solution of the form:
(S17)
Applying B.C. (S9) in Eq. (S17) result that , therefore,
(S18)
and now, from applying B.C. from Eq. (S10) into Eq. (S18) result:
(S19)
which is the Eigen value condition for Therefore, the solution resultant
for Eq. (S11), after substitution of Eqs. (S16) and (S18), is of the form:
(S20)
and applying the initial condition presented in Eq. (S8), the following equation is obtained:
(S21)
Now, applying the orthogonallity condition results in:
Page 45
MANUSCRIP
T
ACCEPTED
ACCEPTED MANUSCRIPT
(S22)
solving Eq. (S22) for , the following equation is obtained:
(S23)
and using Eq. (S19) into Eq. (S23) results in:
(S24)
Substituting Eqs. (S20) and (S24) into Eq. (S6) we get:
(S25)
where the concentration is normalized, resulting in the final equation:
(S26)
Fig. S3 presents the graphic solution of Eq. (25) when the apparent diffusivity calculated
for NO2-, and a radius (R) of 1,200 µm were used. The concentration of NO2
- is function of the
radius and the time. The plot shows that in the surface of the granule, the concentration of NO2-
remain constant for all the times, which is consistent with the boundary condition assumed. In
addition, the concentration for a given radius increment with the time, taking around 20 min to
reach concentrations larger than 98% of NO2- in the center of the granule, which means that a lag
Page 46
MANUSCRIP
T
ACCEPTED
ACCEPTED MANUSCRIPT
phase should be considered between the addition of NO2- to the system and the and the response
of the bacteria.
1200
700
200
5
0.00.10.20.30.40.50.60.70.80.91.0
Ra
dius
(µm
)
C/C
o
Time (min)
0.9-1.0
0.8-0.9
0.7-0.8
0.6-0.7
0.5-0.6
0.4-0.5
0.3-0.4
0.2-0.3
0.1-0.2
0.0-0.1
Fig. S3 - Transport of NO2- into the bacteria granules by diffusion. Radius of the granules of
1,200 µm, and an apparent diffusivity of 565.224 µm2/s.
Page 47
MANUSCRIP
T
ACCEPTED
ACCEPTED MANUSCRIPT
References
Alphenaar, P.A., Perez, M.C., Berkel, W.H., Lettinga, G. 1992. Determination of the
permeability and porosity of anaerobic sludge granules by size exclusion chromatography.
Applied Microbiology and Biotechnology 36 (6), 795-799.
Picioreanu, C., Van Loosdrecht, M., Heijnen, J. 1997. Modelling the effect of oxygen
concentration on nitrite accumulation in a biofilm airlift suspension reactor. Water Science
and Technology 36 (1), 147-156.