Preattentive texture discrimination with early visionmechanisms
Jitendra Malik and Pietro Perona
Department of Electrical Engineering and Computer Sciences, University of California, Berkeley,Berkeley, California 94720
Received July 7, 1989; accepted December 28, 1989
We present a model of human preattentive texture perception. This model consists of three stages: (1) convolu-tion of the image with a bank of even-symmetric linear filters followed by half-wave rectification to give a set ofresponses modeling outputs of V1 simple cells, (2) inhibition, localized in space, within and among the neural-response profiles that results in the suppression of weak responses when there are strong responses at the same ornearby locations, and (3) texture-boundary detection by using wide odd-symmetric mechanisms. Our model canpredict the salience of texture boundaries in any arbitrary gray-scale image. A computer implementation of thismodel has been tested on many of the classic stimuli from psychophysical literature. Quantitative predictions ofthe degree of discriminability of different texture pairs match well with experimental measurements of discrimina-bility in human observers.
1. INTRODUCTION
Classical theories of texture perception by Julesz'-3 andBeck- 6 attribute preattentive texture discrimination to dif-ferences in first-order statistics of stimulus features such asorientation, size, and brightness of constituent elements.These theories have typically been constructed for black-and-white dot or line patterns and are not directly applica-ble to gray-scale images (though Voorhees and Poggio7 pro-vide a definition of textons for gray-scale images). Experi-mental results describing phenomena that are not wellexplained by these theories have been reported.810 An al-ternative approach 9 "1'-13,146 to texture perception is basedon the responses of the linear mechanisms (psychophysicallyobserved spatial-frequency channels and neurophysiologi-cally observed blob-, bar-, and edge-sensitive neurons) thathave been used to explain a range of phenomena in earlyspatial vision. While these efforts have demonstrated that afiltering approach can explain some phenomena that are notconsistent with the texton theory, a complete model has notyet been presented. Such a model should satisfy the follow-ing criteria:
1. Biological plausibility: The stages of the modelshould be motivated by, and be consistent with, knownphysiological mechanisms of early vision.
2. Generality: The model should be general enough thatit can be tested on any arbitrary gray-scale image.
3. Quantitative match with psychophysical data: Themodel should make a quantitative prediction about the sa-lience of the boundary between any two textured regions.Rank ordering of the discriminability of different texturepairs should agree with that measured psychophysically.
We outline our model in Section 2. In Section 3 we moti-vate the necessity of each stage of the model with physiologi-cal, psychophysical, and computational arguments. In Sec-tion 4, quantitative predictions from our model are com-
pared with psychophysical data on the discriminability ofseveral texture pairs collected by Gurnsey and Browse' 0 andKrose.17 We also show in Section 5 that our model performssatisfactorily on the texture pairs invented by Julesz andKrose18 and by Williams and Julesz' 9 in order to pose diffi-culties for other quasi-linear-filtering models. We concludewith a critical discussion in Section 6.
2. MODEL FOR TEXTURE PERCEPTION
In the first stage we model the output of VI simple cells (orsubunits of Vi complex cells as described by Spitzer andHochstein2 0 ). The image I(x, y) is convolved with a bank oflinear filters Fk followed by half-wave rectification. We willindicate the positive part with R+(x, y) = max[R(x, y), 01 andthe negative part with R-(x, y) = max[-R(x, y), 0], whichgive a set of neural responses Ri(x, y), where the index iidentifies the orientation-frequency channel:
R2 k = (I * Fk)+(x, y), R2 k+1 = (I * Fk)-(x, y). (1)
Radially symmetric filters model nonoriented simple cells.Directionally tuned filters with even-symmetric cross sec-tions perpendicular to their axes model bar-sensitive simplecells. In Subsection 3.A we give the details of the choice ofthe filters.
The second stage of our model is nonlinear inhibition,localized in space, within and among the neural-responseprofiles, which results in the suppression of weak responseswhen there are stronger responses at the same or nearbylocations. Details are in Subsection 3.F. Let PIRi(x, y) bethe postinhibition response in the ith channel.
The third stage of our model is the computation of thetexture gradient2 ' (Subsection 3.G). We define the texturegradient to be maxi 11 v (PIRi * G,) (x, y) 11, where G,, is a radi-ally symmetric Gaussian function with standard deviation a'and the index i ranges over all channels.
A schematic view of the model is presented in Fig. 1.
Fig. 1. Simplified schematics of our model for texture perception.The image (bottom) is filtered using the kernels F ... Fm and ishalf-wave rectified to give the set of simple-cell responses R1 ... R0 .The postinhibition responses PIR1 ... PIRn are computed bythresholding the Ri and taking the maximum of the result over smallneighborhoods. The thresholds depend on the activity of all chan-nels. The texture gradient is computed by taking the maximum ofthe responses of wide odd-symmetric filters acting on the postinhi-bition responses PIRi.
3. MOTIVATION FOR THE STAGES OF THEMODEL
The general structure of our model follows the findings ofJulesz,1-3 Beck,4 -6 and Treisman2 2 that state that in preat-tentive vision, precise positional relationships between tex-tons are not important; only densities matter. These find-ings suggest that when two textures T and T2 are discrimi-nable, they are distinguished by different spatial averages ST 1 R(x, y) and S ST2 R(x, y) of some locally computedneural response R. A discussion of how earlier models fitinto this framework may be found in Ref. 23.
Within this framework, a set of appropriate neural mecha-nisms that produce responses R and a pooling mechanismutilizing these responses to compute the texture gradienthave to be chosen. Our guiding principles for these twochoices are biological plausibility and parsimony. The finaltest for the model is, of course, whether it reproduces humanperformance.
A. Choice of the FiltersSeveral models have been proposed for the point-spreadfunction of simple cells and subunits of complex cells.These include Gabor functions,24 differences of offset Gaus-sians2 5 (DOOG), and differences of offset differences ofGaussians.2 6 We have chosen to use DOOG (Fig. 2) for oursimulations, given their good fit with the physiological mea-surements and their computational simplicity. We believethat this is not a critical choice. Any of the families offunctions mentioned above could have been used instead.
The radially symmetric filter classes DOG1(o-) and
DOG2(a) (Figs. 2a and 2b) model nonoriented simple cells.Directionally tuned filters DOOG2 (a, r, 0) with even-sym-metric cross sections perpendicular to their axes (Fig. 2c)model bar-sensitive simple cells. In our simulations we usedsix equally spaced orientations 0 and a constant aspect ratior = 3.
Implicit in the DOOG model is the assumption that recep-tive field profiles in the direction that is perpendicular to theaxes are either odd-symmetric or even-symmetric and not ofan intermediate phase. This model is suggested by psycho-physical studies on phase discrimination.27 28 One has to beaware that electrophysiological mapping of the impulse-re-sponse function of single-cortical simple cells does not sup-port this view.26 At the cell level there seems to be not asharp dichotomy but rather a continuum between even andodd symmetry. One explanation of this discrepancy couldbe that the responses of different cells are pooled together insuch a way that one effectively gets strictly odd- or even-symmetric mechanisms. We hypothesize (Subsection 3.H)that information from odd-symmetric mechanisms is notused for texture perception and therefore exclude from ourmodel odd-symmetric mechanisms, which respond optimal-ly to appropriately oriented edges.
The a parameter of the three filter classes that were usedcorresponds to a nominal spatial frequency in cycles perdegree (c/deg) (given the viewing distance and size of image).
Fig. 2. Point-spread functions of some of the filters used in oursimulation. The filters were designed after Young25 by summingGaussian functions G(xo, yo, ax, ay) - 1/2raxay exp-(x - o/ax)2 +(y - y0/y)2]j and have zero-mean value. a, Linear combination ofthree circular concentric Gaussian functions, DOG2(a) - a G(O, 0,ai, a) + b G(O, 0, a, a) + c G(O, 0, o-, a) with variance a:a:ao in aratio of 0.62:1:1.6 and a:b:c in a ratio of 1:-2:1. b, Linear combina-tion of two circular concentric Gaussian functions, DOGl(a) -a -G(0, 0, a, a) + b G(0, 0, ao, a), with variance ai: a:a, in a ratio of0.71:1:1.14 and coefficients a:b in a ratio of 1:-i. c, Linear combina-tion of three offset identical Gaussian functions DOOG2(a, r, ) -a * G(O,y., a., ay) + b . G(O,yb, ax, ay) + c G(O,yc, ax, ry). Variancesare ay = a, a = r * a, offsets are Ya = Yc = a, Yb = 0, and coefficientsare a:b:c in a ratio of -1:2:-i for the filter with an axis of symmetryalong the x direction ( = 0). The other DOOG2( ) filters areobtained by rotation about the center of the middle Gaussian. Thescaling coefficients aDOG1:aDOG2:aDOOG2 were in a ratio of 3:4.15:2,which was designed to equalize the dynamic range of the respectiveresponses.
J. Malik and P. Perona
Vol. 7, No. 5/May 1990/J. Opt. Soc. Am. A 925
iwi I gm )Lima~d
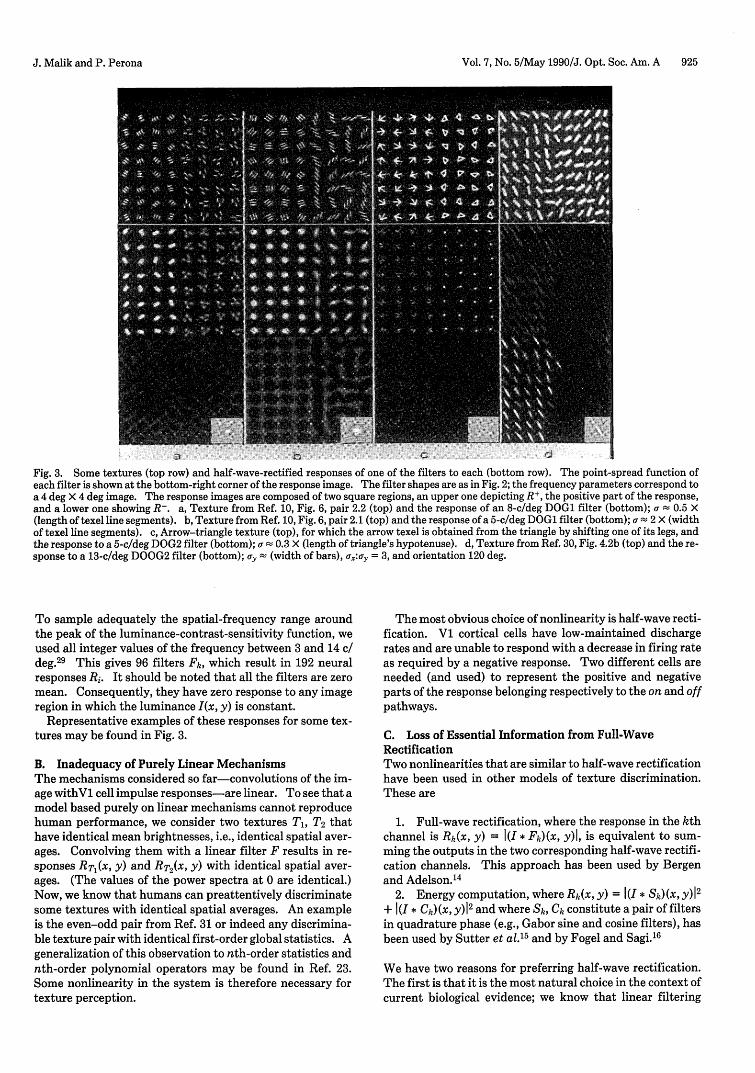
Fig. 3. Some textures (top row) and half-wave-rectified responses of one of the filters to each (bottom row). The point-spread function ofeach filter is shown at the bottom-right corner of the response image. The filter shapes are as in Fig. 2; the frequency parameters correspond toa 4 deg X 4 deg image. The response images are composed of two square regions, an upper one depicting R+, the positive part of the response,and a lower one showing R-. a, Texture from Ref. 10, Fig. 6, pair 2.2 (top) and the response of an 8-c/deg DOG1 filter (bottom); a 0.5 X(length of texel line segments). b, Texture from Ref. 10, Fig. 6, pair 2.1 (top) and the response of a 5-c/deg DOG1 filter (bottom); a 2 X (widthof texel line segments). c, Arrow-triangle texture (top), for which the arrow texel is obtained from the triangle by shifting one of its legs, andthe response to a 5-c/deg DOG2 filter (bottom); a 0.3) X(length of triangle's hypotenuse). d, Texture from Ref. 30, Fig. 4.2b (top) and the re-sponse to a 13-c/deg DOOG2 filter (bottom); a, - (width of bars), au:a, = 3, and orientation 120 deg.
To sample adequately the spatial-frequency range aroundthe peak of the luminance-contrast-sensitivity function, weused all integer values of the frequency between 3 and 14 c/deg.2 9 This gives 96 filters Fk, which result in 192 neuralresponses Ri. It should be noted that all the filters are zeromean. Consequently, they have zero response to any imageregion in which the luminance I(x, y) is constant.
Representative examples of these responses for some tex-tures may be found in Fig. 3.
B. Inadequacy of Purely Linear MechanismsThe mechanisms considered so far-convolutions of the im-age withV1 cell impulse responses-are linear. To see that amodel based purely on linear mechanisms cannot reproducehuman performance, we consider two textures T1, T2 thathave identical mean brightnesses, i.e., identical spatial aver-ages. Convolving them with a linear filter F results in re-sponses RT1(X, y) and RT2(X, y) with identical spatial aver-ages. (The values of the power spectra at 0 are identical.)Now, we know that humans can preattentively discriminatesome textures with identical spatial averages. An exampleis the even-odd pair from Ref. 31 or indeed any discrimina-ble texture pair with identical first-order global statistics. Ageneralization of this observation to nth-order statistics andnth-order polynomial operators may be found in Ref. 23.Some nonlinearity in the system is therefore necessary fortexture perception.
The most obvious choice of nonlinearity is half-wave recti-fication. V1 cortical cells have low-maintained dischargerates and are unable to respond with a decrease in firing rateas required by a negative response. Two different cells areneeded (and used) to represent the positive and negativeparts of the response belonging respectively to the on and offpathways.
C. Loss of Essential Information from Full-WaveRectificationTwo nonlinearities that are similar to half-wave rectificationhave been used in other models of texture discrimination.These are
1. Full-wave rectification, where the response in the kthchannel is Rk(x, y) = I(I * Fk)(x, y)l, is equivalent to sum-ming the outputs in the two corresponding half-wave rectifi-cation channels. This approach has been used by Bergenand Adelson.14
2. Energy computation, where Rk(x, y) = I(I * Sk)(X, y)12+ I * Ck)(X, y)12 and where Sk, Ck constitute a pair of filtersin quadrature phase (e.g., Gabor sine and cosine filters), hasbeen used by Sutter et al.'
5 and by Fogel and Sagi.' 6
We have two reasons for preferring half-wave rectification.The first is that it is the most natural choice in the context ofcurrent biological evidence; we know that linear filtering
J. Malik and P. Perona
926 J. Opt. Soc. Am. A/Vol. 7, No. 5/May 1990
a
b
C
dFig. 4. a, Texture pair that was constructed by adding to a uniformgray field the zero-mean micropatterns M (right) and -M (left).The two textures are easily discriminable, though it may be shownthat spatially averaged responses for any linear filter followed byeither half- or full-wave rectification are identical for both and thusinsufficient for the discrimination. b, Cross section of Malong the xaxis. c, d, Cross sections of the responses to M and -M in onechannel (corresponding to convolution with F = M followed bypositive half-wave rectification). The areas under c and d are equal.For any zero-mean filter F ( F = 0) we have r (M * F) = 0;henceff(M*F) = f(M*F)= (-M*F)+.
that is followed by half-wave rectification is a good first-order approximation for modeling responses of simple cellsand subunits of complex cells. Cells computing energieshave not yet been documented. Second, in both full-waverectification and energy computation, the sign of the filterresponse is lost. Consequently, the response in a full-waverectification channel or in an energy channel is identical formicropatterns M and -M and would remain so after anysubsequent processing. This response results in the predic-tion that a texture pair composed of micropatterns M on oneside and -M on the other (bright bars and dark bars, say)
cannot be discriminated. Since we can discriminate easilymany such texture pairs (for example, Fig. 4a) it is obviousthat these nonlinearities cannot be part of all the channels ofthe visual pathway that performs texture perception.
D. Need for a Second NonlinearityA model of texture discrimination that uses half-wave recti-fication as the only nonlinearity before the pooling stage (atwhich the texture gradient is computed) successfully ex-plains human performance on a number of examples. How-ever, we can prove that such a model cannot discriminatetexture pairs composed of micropatterns M and -M. Onesuch texture pair can be seen in Fig. 4a; human observershave no difficulty in discriminating the bright-bar regionfrom the dark-bar region.
Of course, the responses of a channel (linear filtering fol-lowed by half-wave rectification) to micropatterns M and-M are in general going to be different. However when theyare pooled, i.e., spatially averaged over a region greater thanthe area of a micropattern, then they result in identicalvalues. For any zero-d.c. filter F(f F = 0), the averageresponse is 5 5(M * F) = 0, which implies that the positiveand negative parts of the response on each texture have thesame average, i.e., that 5 5(M * F)+ = 5 5(M * F)-. Nowthe response to M in the off channel (M * F)- is the sameas that to -M in the on channel (-M * F)Y. It follows that5 (M * F)+ = (-M * F)+ and consequently, pooledresponses in any on channel cannot be used to discriminatethe two textures. The situation is similar for any off chan-nel. Segmentation is therefore impossible for any channelcorresponding to zero-mean filters. For a graphicalrepresentation of this argument see Fig. 4.
E. Choices of Second NonlinearityThe argument in Subsection 3.D provides a motivation forincluding additional nonlinearities in the channels. Howev-er the form and site of the nonlinearity are left largely un-specified.
The first decision to be made is whether to have the non-linearity precede or follow the simple-cell response stage(linear filtering and half-wave rectification). A well-knownearly nonlinearity in the visual system-that of retinal adap-tation3 2 -has been postulated to play a significant role intexture discrimination according to Sutter et al.'5 and Gra-ham et al.33 This nonlinearity clearly plays an importantrole in vision because it enables the system to respond tolocal contrast over ten log units of illumination changes.The crucial question is whether it is sufficient to account fortexture discriminability data, with no later nonlinearity re-quired. Relevant evidence comes from data on binary tex-tures with only two distinct gray levels (Section 4), so thatlocal contrasts are equal. For these stimuli, adaptation can-not account for the deviation of rank ordering of psycho-physically measured texture discriminability with that pre-dicted in the absence of a late nonlinearity. See the discus-sion in Section 6. This suggests that a late nonlinearity isessential.
There are at least two physiologically plausible choices fora late nonlinearity:
1. A nonlinear contrast response function g could bepicked. Typicallyg has a sigmoidal shape with neurons thatexhibit a threshold effect for low contrast and a saturation
J. Malik and P. Perona
J. Malik and P. Perona ~~~~~~~~~~~Vol. 7, No. 5/May 1990/J. Opt. Soc. Am. A 927
effect for high contrast (e.g., as discussed by Albrecht andHamilton 34).
2. Intracortical inhibition could occur within and amongthe responses in the different channels.
In our model, we have chosen to use intracortical inhibi-tion. We studied a few variations on this theme, which areexplored in Subsection 3.F.
F. Nonlinear InhibitionInhibitory connections and interactions (some nonlinear)among the neurons in the primary visual cortex have beenwell documented by physiological and anatomical tech-niques35-37 and are presumably the substrate for psycho-physically observed inhibition among channels. 3 8 A num-ber of functional roles, including the generation or sharpen-ing of orientation and length selectivity and contrast gaincontrol, have been attributed to these connections. We pro-pose that another consequence of intracortical inhibition isthe suppression or reduction of spurious responses in nonop-timally tuned channels.
What do we mean by spurious responses? First, we dis-cuss some observations about neurons with linear receptivefield functions. Such a neuron typically gives a nonzeroresponse to a stimulus to which it is not optimally tuned.For example, consider the texture in Fig. 4a. The bright-barchannel is tuned to the stimulus M (Fig. 4b), and its response(Fig. 4c) has a strong peak at the position of the stimulus.The dark-bar channel is not tuned to the stimulus and givesa response (Fig. 4d) consisting of two smaller peaks. We callthis response spurious. The concept is general; the responsein an orientationally tuned DOOG2 channel (as in Fig. 2) to aDOGi stimulus may similarly be regarded as spurious.
In Subsection 3.E we showed an example for which thespatial averaging of the response in the optimal channelgives the same value as the spatial average of a spuriousresponse. The peak value is of course greater for the opti-mal channel. If intracortical inhibition acted in a way so asto favor responses in optimal channels and reduce the spuri-ous responses, texture discrimination would then be possibleby using pooled responses.
Physiological experiments on inhibition in Vi have not yetconverged on a definitive model; indeed it is likely that thereare several inhibitory circuits with different roles. Atpresent we can only hypothesize a model and argue for (a) itsfunctional adequacy and (b) its biological plausibility. Forbiological plausibility, we imposed three design constraintson the inhibition model: a neural implementation should(1) require only local connections (in the same or nearby VIhypercolumns), (2) require only a few neural time steps, and(3) not demand unduly specific interconnection strengthsbetween arbitrary pairs of neurons.
One way to model this inhibition is as follows. Thresh-olds Ti(xo, Yo) for neurons belonging to channel i with retino-topic coordinates xo, yo are computed:
Ti(xo, yo) = max max aRj (x, y).j X~yEIji(Xo'ye)
(2)
Here Ij is the neighborhood of (xo, Yo) in which neurons inchannel]j are able to inhibit neurons in channel i, and a is ameasure of the effectiveness of this inhibition. The postin-hibition response PIRi(x 0, yo) is given by
This results in a suppression of responses below the thresh-old. S(xo, Yo) is a sampling neighborhood from which thestrong responses in channel i are selected for subsequentprocessing.
One way to think about this mechanism is as a so-calledleaders-take-most feedforward network; it is a variant of thewinner-take-all type mechanisms quite popular in the neu-ral-network literature.
We were guided in our choice of Ijj and aji by the designcriterion of eliminating spurious responses. As an example,consider channels i and j that correspond to the positive andnegative responses of the filter DOOG2(cr). Figures 4c and4d show the responses in the two channels to a bright bar.The peaks in the negative (spurious) response are approxi-mately 0.65 times the positive central peak and are displacedfrom it by 1.25cr. This prompts a choice of ajt = 0.65 and Ijto be a disk of radius 1.25cr in order to ensure a suppression ofthe negative response. This procedure can be repeated forall the 192 X 192 pairs of channels. However this violatesour third criterion for biological plausibility because specificinterconnection strengths are required between arbitrarypairs of neurons. We can however exploit the known clus-tering; nonorientationally tuned neurons tend to occur inthe Vi blobs, and neurons sharing similar orientation prefer-ences occur together. This clustering leads us to form eightgroups of channels in our framework (two radially symmet-ric + six oriented). I and caji are identical for all channels iin one of these groups; these values have been computedfrom the spurious responses in the channel i with the same crparameter as channel]. The actual values used in our simu-lations are shown in Tables 1 and 2. S was chosen to be adisk of constant radius. We will refer to this model ofinhibition as model A.
Model A seems rather elaborate, and it is natural to seeksimpler models that might be adequate. In model B, we setcaji = 0.5. This corresponds to having a nonspecific localinhibitory pool of neurons and would be more consistentwith the physiological evidence of Bonds.3 In model C, cajj
Table 1. Inhibitory Coefficients ajA for Model Aa~
a In Models C and D the neighborhoods Iji are irrelevant.
J. Malik and P. Perona
928 J. Opt. Soc. Am. A/Vol. 7, No. 5/May 1990
= 0, which eliminates the threshold but keeps the stage ofcomputing local, strong responses in a neighborhood S.One could relate this model to outputs of complex cells thatdo not show a significant modulation in their response whena stimulus is moved across the receptive field. Finally, mod-el D served as a control with PIRi = Ri.
G. Computation of the Texture GradientNothdurft 2 l has shown two characteristics of texture per-ception that any model must explain. Texture discrimina-bility depends on (a) the density of micropatterns in theimage, with higher densities leading to easier discrimination,and (b) local differences rather than global differences.This naturally suggests the idea of computing the gradient ofthe smoothed postinhibition responses in each channel.
The texture gradient that we use is defined as maxiv(PIRj * Gr)(x, y). Biologically, the computation of the gra-dient of the smoothed postinhibition response in each chan-nel can be done by using odd-symmetric oriented mecha-nisms similar to the edge-sensitive cells in V1. Of course,the mechanisms responsible for computing the texture gra-dient have large receptive fields ( is a measure of the size)and presumably occur in some extrastriate area. The maxi-mum operation seems a natural way of combining the out-puts of the different channels. Texture boundaries may bedefined as corresponding to local peaks of the texture gradi-ent magnitude (Fig. 5).
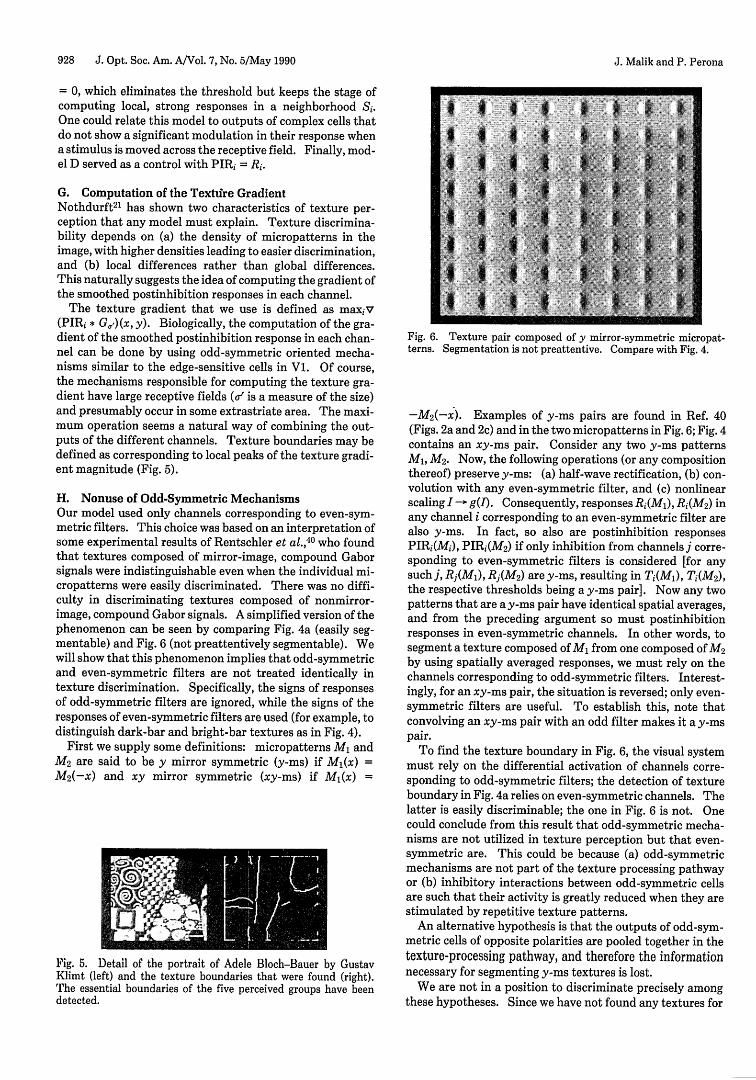
H. Nonuse of Odd-Symmetric MechanismsOur model used only channels corresponding to even-sym-metric filters. This choice was based on an interpretation ofsome experimental results of Rentschler et al.,
4 0 who foundthat textures composed of mirror-image, compound Gaborsignals were indistinguishable even when the individual mi-cropatterns were easily discriminated. There was no diffi-culty in discriminating textures composed of nonmirror-image, compound Gabor signals. A simplified version of thephenomenon can be seen by comparing Fig. 4a (easily seg-mentable) and Fig. 6 (not preattentively segmentable). Wewill show that this phenomenon implies that odd-symmetricand even-symmetric filters are not treated identically intexture discrimination. Specifically, the signs of responsesof odd-symmetric filters are ignored, while the signs of theresponses of even-symmetric filters are used (for example, todistinguish dark-bar and bright-bar textures as in Fig. 4).
First we supply some definitions: micropatterns M1 andM2 are said to be y mirror symmetric (y-ms) if Ml(x) =M 2 (-x) and xy mirror symmetric (xy-ms) if Ml(x) =
Fig. 5. Detail of the portrait of Adele Bloch-Bauer by GustavKlimt (left) and the texture boundaries that were found (right).The essential boundaries of the five perceived groups have beendetected.
Fig. 6. Texture pair composed of y mirror-symmetric micropat-terns. Segmentation is not preattentive. Compare with Fig. 4.
-M 2(-x). Examples of y-ms pairs are found in Ref. 40(Figs. 2a and 2c) and in the two micropatterns in Fig. 6; Fig. 4contains an xy-ms pair. Consider any two y-ms patternsM1 , M2. Now, the following operations (or any compositionthereof) preserve y-ms: (a) half-wave rectification, (b) con-volution with any even-symmetric filter, and (c) nonlinearscaling I - g(I). Consequently, responses Ri(M1), Ri(M2) inany channel i corresponding to an even-symmetric filter arealso y-ms. In fact, so also are postinhibition responsesPIRi(M), PIRi(M2 ) if only inhibition from channels j corre-sponding to even-symmetric filters is considered [for anysuch j, Rj(Ml), Rj(M2) are y-ms, resulting in Ti(Ml), Ti(M 2),the respective thresholds being a y-ms pair]. Now any twopatterns that are a y-ms pair have identical spatial averages,and from the preceding argument so must postinhibitionresponses in even-symmetric channels. In other words, tosegment a texture composed of M1 from one composed of M2by using spatially averaged responses, we must rely on thechannels corresponding to odd-symmetric filters. Interest-ingly, for an xy-ms pair, the situation is reversed; only even-symmetric filters are useful. To establish this, note thatconvolving an xy-ms pair with an odd filter makes it a y-mspair.
To find the texture boundary in Fig. 6, the visual systemmust rely on the differential activation of channels corre-sponding to odd-symmetric filters; the detection of textureboundary in Fig. 4a relies on even-symmetric channels. Thelatter is easily discriminable; the one in Fig. 6 is not. Onecould conclude from this result that odd-symmetric mecha-nisms are not utilized in texture perception but that even-symmetric are. This could be because (a) odd-symmetricmechanisms are not part of the texture processing pathwayor (b) inhibitory interactions between odd-symmetric cellsare such that their activity is greatly reduced when they arestimulated by repetitive texture patterns.
An alternative hypothesis is that the outputs of odd-sym-metric cells of opposite polarities are pooled together in thetexture-processing pathway, and therefore the informationnecessary for segmenting y-ms textures is lost.
We are not in a position to discriminate precisely amongthese hypotheses. Since we have not found any textures for
J. Malik and P. Perona
J. Malik and P. Perona Vol. 7, No. 5/May 1990/J. Opt. Soc. Am. A 929
which odd-symmetric mechanisms are necessary, we havechosen to exclude odd-symmetric mechanisms from ourmodel.
4. EXPERIMENTAL RESULTS
We have compared the degree of texture discriminabilitythat was predicted by our algorithm with psychophysicaldata from Kr6se' 7 and Gurnsey and Browse.10 Figure 7shows seven bipartite textures with elements constructedafter Krbse17 (Section 3.2, pp. 34-39), two after Williams andJulesz,19 and one composed of R's and mirror-image R's(called R-mirror-R). For two of these textures, the texturegradient ( = 12 pixels, Si = constant) obtained by ouralgorithm, using model A for inhibition, is plotted as a func-tion of column number (Fig. 8). The texture boundary(column 64) is associated with the central peak in the gradi-ent. The value of the gradient associated with this peak istaken to be a measure of the discriminability predicted byour algorithm. In Table 3, these data are presented in amore easily readable form and compared with data fromKr6se (Table 3.1, p. 39; stimulus onset asychrony, 320) andGurnsey and Browse (pairs 1.1, 1.2, 1.3, 3.1) for mean overalldiscriminability. Note that the rank order of discriminabil-ity predicted by our model matches the rankings found ex-perimentally.
The Williams-Julesz textures were constructed to demon-strate essential nonlinearities in texture preception. Their
-'k . v.+ 0 00 0%.+ .'r+ cO O 0
+ X OO OOX%9 + 0 00 00
X % + A- 00 00-J. X+ - o0000
(+ 0)
LLLL'%`',%',
(L M)
,V + .r+ ~ ~ *.+( 4 X ~ 1
% + k . a 4X 'A + r j. 4
(+ X)
jH\ # ,S soo o'S -S t s
I S , - -/ 5_ U r
Cff C}' ' o|
(+ 0)
A;r~ P- :W) 4
.4 9 4 '~ icq ' Q
4 T A4 J
Y Y,<, < f
-1 A, I >r-
-A 'Y4 Y )L r
(T L)
(R-mi rr-(R-mirror-R)
-) )"+x xX c x +
( L X X
J'N/ >~ + + X
L 4 + k1
(L +)
+ 5+ x T )+ X *X
A(~ + 4 T'4Ar, .X c + + A x - y
(+ T)
(LL~ ~ L) 'L I
1001<11%1L,_LL.
(LL M)
Fig. 7. Nine textures that were used in our experiments.
300T00
200T00
100.00
0.I I I
0.00 100.00
Fig. 8. Texture gradient as a function of column number. For the128 X 128 textures in Fig. 7 the texture gradient is averaged alongthe vertical direction on the central middle portion of each columnand plotted with respect to the horizontal coordinate. Such plotsare shown for the most (L +) and least (R-mirror-R) discriminabletextures. The value of the texture gradient at its central peak istaken to be the prediction of our model and is reported in Table 3,column 3.
Table 3. Comparison of Predictions from TextureSegmentation Algorithm with Two Sets of
Psychophysical Dataa
DiscriminabilityData Refs. Data Predicted
Texture Pair 41 and 42 Ref. 43 Data
+ 0 100(saturated) n.a. 407+ a 88.1 n.a. 225L + 68.6 0.736 203L M n.a. n.a. 165A1 52.3 0.4-0.55 159+ T 37.6 0.496 120+ X 30.3 n.a. 104T L 30.6 0.421 90*LL ML n.a. n.a. 85R-mirror-R n.a. n.a. 50*
a The symbol * indicates that a side peak of the texture gradient was higherthan the reported central peak. Because of differences in the scales used, thethree columns should be compared only by the rank ordering of discriminabil-ity. The rank order of discriminability for the predicted data matches bothother data rankings exactly. The L M and LL LL textures have been inventedby Williams and Julesz as a counterexample to purely linear theories.1 9 Ouralgorithm correctly ranks the L M pair within the most discriminable texturesand the LL ML pair within the least discriminable ones. The discriminabilityof the + 0 texture given by Krose saturates his psychophysical scale (topvalue, zero standard deviation), so it cannot be compared quantitatively withthe other discriminability figures (standard deviation ranging between 6.7and 11.7); n.a., not available. Also compare Fig. 8.
reasoning is as follows. The LMtexture is easily discrimina-ble; not so the LLML texture (call it C), which is obtained byadding to the LM texture (call it A) a uniform texture oflittle L's (call it B) placed at the endpoints of the L and Mmicropatterns. If the discriminability between the left andright regions were a linear function of the image, then thediscriminability of C = A + B would be the sum of thediscriminabilities of A and B. As B is a single-texture regionits discriminability is of course zero, so the discriminabilityof C should be equal to that of A. Clearly it is not.
The match with the experimental data that we have ob-tained is surprisingly good; we are not aware of any other
400T00
+ 0
R-mirror-R
930 J. Opt. Soc. Am. A/Vol. 7, No. 5/May 1990
Table 4. Comparison of the Predictions from Models A-D with Segmentability Measurements for Two Sets ofExperimental Dataa
DiscriminabilityPredicted Data
Model A Model B Model C Model DData Refs. Data Ref. Specific Constant No No Inhibition,
Texture Pair 41 and 42 43 Inhibition Inhibition Inhibition Si = 1 pixel
model that fits these data. Of course, the usual notes ofcaution for any model with parameters that are not directlymeasured from physiology or psychophysics apply. Theparticular equations and parameters that we have proposedare surely wrong in detail. To have any relevance to biologi-cal texture perception, the model should degrade gracefully,i.e., roughly similar ideas should work as well, and choices ofparameters should not be too critical.
One can gain additional insight into these issues by study-ing simplified variants of the inhibition model A. We didthat by replacing it with the models B, C, and D described inSubsection 3.F. The results of these simulations are shownin Tables 4 and 5. Additional simulation results with aslightly different choice of parameters of model A may befound in Ref. 44.
Some qualitative features of the results are noted below.Appropriate caution should be exercised as we do not haveany error bars for the simulation data for the four models.
1. Model A matches the experimental data best.2. Model B does almost as well. The order of discrimi-
nability of the textures (+ 3) and (L +) is reversed. Mostsignificant is the decrease in the discriminability of the tex-ture (A1); it is now in the same group as the three significant-ly less discriminable textures (+ T), (T L), and (+ X).
3. For model C, we note that, in addition to the errorsmentioned for model B, we have the unwanted increase inthe discriminability of the texture (+ X).
4. Model D serves as a control, with PIR = Ri. Theerrors here can not be explained by the adaptation nonlin-earity proposed by Graham et al.3 3 For these binary images,contrast is the same for all micropatterns.
5. LAPLACIAN PYRAMID TEXTURES
Julesz and Kr6se' 8 studied a texture, which was composed ofL's and +'s, that Bergen and Adelson 4 say is segmentable byusing the output of a simple center-surround Laplacian-of-Gaussian filter. Julesz and Krose decomposed this imageinto a series of bandpass-filtered images by using the Lapla-cian pyramid technique. Levels 2, 3, and 4 of the pyramidappeared to be the ones showing a difference between thetexture of L's and the texture of T's and hence responsiblefor texture discrimination. Julesz and Krose constructed anew image for which these levels had been replaced by uni-form gray. The textures however remained highly discrimi-nable, which casts doubt on the validity of Bergen and Adel-son's explanation.
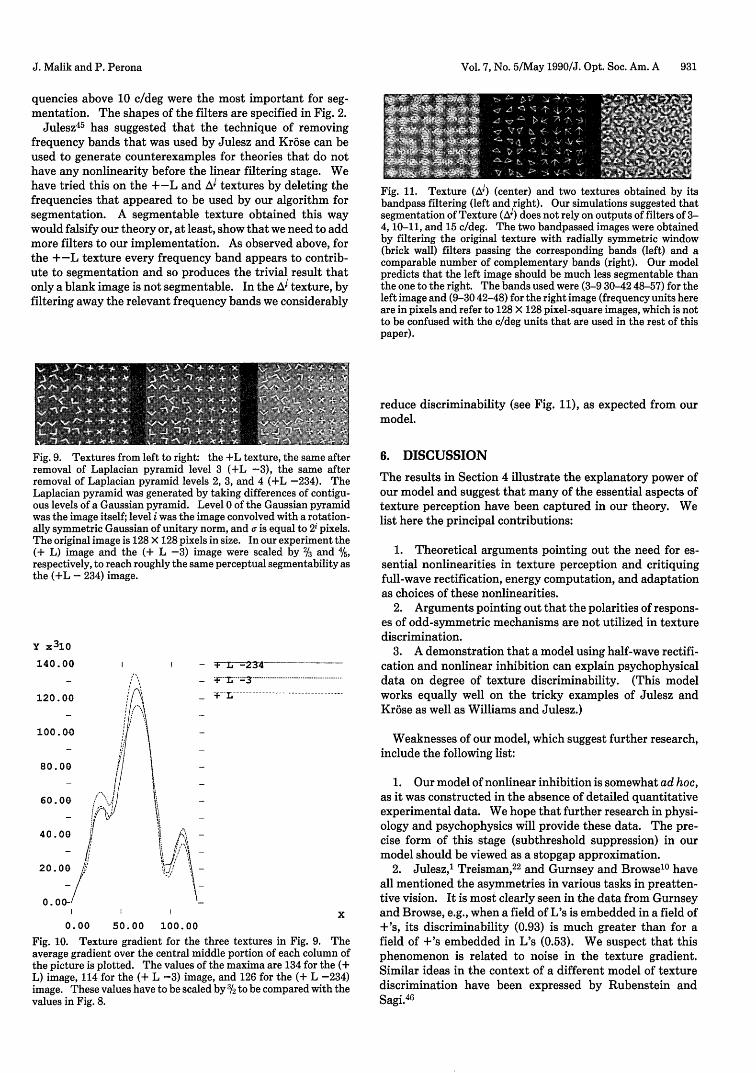
We re-created this phenomenon (Fig. 9). The three tex-tures appear equally discriminable, and a correct model oftexture perception should be able to predict this fact. Wetested our model on these textures, and the results may befound in Fig. 10. It is seen that our model finds the texturesapproximately equally discriminable, as indeed it should.On examining various bandpass-filtered versions of the tex-tures, we observed that at most frequency bands there issome difference between the L's texture and the +'s texture;this difference can be amplified and used by the subsequentnonlinear stages of the model. In our simulation we foundthe most significant differences in the postinhibition re-sponses PIRi correspond to the positive part of DOG1 filtersbetween 3 and 9 c/deg for the original +-L texture, corre-sponding indeed to the levels 2, 3, and 4 of the Laplacianpyramid. For the +-L texture deprived of the levels 2, 3,and 4 of the Laplacian pyramid, the DOG2 filters with fre-
J. Malik and P. Perona
Vol. 7, No. 5/May 1990/J. Opt. Soc. Am. A 931
quencies above 10 c/deg were the most important for seg-mentation. The shapes of the filters are specified in Fig. 2.
Julesz4 5 has suggested that the technique of removingfrequency bands that was used by Julesz and Kr6se can beused to generate counterexamples for theories that do nothave any nonlinearity before the linear filtering stage. Wehave tried this on the +-L and A1 textures by deleting thefrequencies that appeared to be used by our algorithm forsegmentation. A segmentable texture obtained this waywould falsify our theory or, at least, show that we need to addmore filters to our implementation. As observed above, forthe +-L texture every frequency band appears to contrib-ute to segmentation and so produces the trivial result thatonly a blank image is not segmentable. In the Ai texture, byfiltering away the relevant frequency bands we considerably
Fig. 11. Texture (A1) (center) and two textures obtained by itsbandpass filtering (left and right). Our simulations suggested thatsegmentation of Texture (A1) does not rely on outputs of filters of 3-4, 10-11, and 15 c/deg. The two bandpassed images were obtainedby filtering the original texture with radially symmetric window(brick wall) filters passing the corresponding bands (left) and acomparable number of complementary bands (right). Our modelpredicts that the left image should be much less segmentable thanthe one to the right. The bands used were (3-9 30-42 48-57) for theleft image and (9-30 42-48) for the right image (frequency units hereare in pixels and refer to 128 X 128 pixel-square images, which is notto be confused with the c/deg units that are used in the rest of thispaper).
Fig. 9. Textures from left to right: the +L texture, the same afterremoval of Laplacian pyramid level 3 (+L -3), the same afterremoval of Laplacian pyramid levels 2, 3, and 4 (+L -234). TheLaplacian pyramid was generated by taking differences of contigu-ous levels of a Gaussian pyramid. Level 0 of the Gaussian pyramidwas the image itself; level i was the image convolved with a rotation-ally symmetric Gaussian of unitary norm, and a is equal to 2' pixels.The original image is 128 X 128 pixels in size. In our experiment the(+ L) image and the (+ L -3) image were scaled by % and 4/5,respectively, to reach roughly the same perceptual segmentability asthe (+L - 234) image.
y x3 10
140. 00
120.0-0
100.0-0
80.0G
60. 0G
40.00
20.0G
0.0I
- FfL-234
- t1 -a
+ --L -- - - - - - - --- - - - - -- -
I I X
0.00 50.00 100.00Fig. 10. Texture gradient for the three textures in Fig. 9. Theaverage gradient over the central middle portion of each column ofthe picture is plotted. The values of the maxima are 134 for the (+L) image, 114 for the (+ L -3) image, and 126 for the (+ L -234)image. These values have to be scaled by 3/2 to be compared with thevalues in Fig. 8.
reduce discriminability (see Fig. 11), as expected from ourmodel.
6. DISCUSSION
The results in Section 4 illustrate the explanatory power ofour model and suggest that many of the essential aspects oftexture perception have been captured in our theory. Welist here the principal contributions:
1. Theoretical arguments pointing out the need for es-sential nonlinearities in texture perception and critiquingfull-wave rectification, energy computation, and adaptationas choices of these nonlinearities.
2. Arguments pointing out that the polarities of respons-es of odd-symmetric mechanisms are not utilized in texturediscrimination.
3. A demonstration that a model using half-wave rectifi-cation and nonlinear inhibition can explain psychophysicaldata on degree of texture discriminability. (This modelworks equally well on the tricky examples of Julesz andKrose as well as Williams and Julesz.)
Weaknesses of our model, which suggest further research,include the following list:
1. Our model of nonlinear inhibition is somewhat ad hoc,as it was constructed in the absence of detailed quantitativeexperimental data. We hope that further research in physi-ology and psychophysics will provide these data. The pre-cise form of this stage (subthreshold suppression) in ourmodel should be viewed as a stopgap approximation.
2. Julesz,1 Treisman, 2 2 and Gurnsey and Browse10 haveall mentioned the asymmetries in various tasks in preatten-tive vision. It is most clearly seen in the data from Gurnseyand Browse, e.g., when a field of L's is embedded in a field of+'s, its discriminability (0.93) is much greater than for afield of +'s embedded in L's (0.53). We suspect that thisphenomenon is related to noise in the texture gradient.Similar ideas in the context of a different model of texturediscrimination have been expressed by Rubenstein andSagi. 46
J. Malik and P. Perona
932 J. Opt. Soc. Am. A/Vol. 7, No. 5/May 1990
3. In our simulations, the choice of a' was made by hand(8, 12, or 16 pixels) in the computation of the texture gradi-ent.
ACKNOWLEDGMENTS
We thank Martin Banks, Bela Julesz, and Paul Kube fortheir useful comments. In particular, we would like tothank Bela Julesz for suggesting the comparison of our mod-el with Kr6se's psychophysical data. This research wasfunded by an IBM Faculty Development award, DefenseAdvanced Research Projects Agency contract N00039-88-C-0292, Northrop, and the California Micro Program. Someof the results were summarized previously.4 7
REFERENCES AND NOTES
1. B. Julesz, "Textons, the elements of texture perception andtheir interactions," Nature (London) 290,91-97 (1981).
2. J. Bergen and B. Julesz, "Rapid discrimination of visual pat-terns," IEEE Trans. Syst. Man Cybern. 13, 857-863 (1983).
3. B. Julesz, "Texton gradients: the texton theory revisited,"Biol. Cybern. 54, 245-251 (1986).
4. J. Beck, "Similarity grouping and peripheral discriminabilityunder uncertainty," Am. J. Psychol. 85, 1-19 (1972).
5. J. Beck, "Textural segmentation," in Organization andRepresentation in Perception, J. Beck, ed. (Erlbaum, Hillsdale,N.J., 1982).
6. J. Beck, K. Prazdny, and A. Rosenfeld, Human and MachineVision (Academic, New York, 1983), pp. 1-38.
7. H. Voorhees and T. Poggio, "Computing texture boundariesfrom images," Nature (London) 333, 364-367 (1988).
8. J. Enns, "Seeing textons in context," Percept. Psychophys. 39,143-147 (1986).
9. J. Beck, A. Sutter, and R. Ivry, "Spatial frequency channels andperceptual grouping in texture segmentation," Comput. VisionGraphics Image Process. 37, 299-325 (1987).
10. R. Gurnsey and R. Browse, "Micropattern properties and pre-sentation conditions influencing visual texture discrimination,"Percept. Psychophys. 41, 239-252 (1987).
11. T. Caelli, "Three processing characteristics of visual texturesegmentation," Spatial Vision 1, 19-30 (1985).
12. J. Coggins and A. K. Jain, "A spatial filtering approach totexture analysis," Pattern Recogn. Lett. 3, 195-203 (1985).
13. M. Turner, "Texture discrimination by gabor functions," Biol.Cybern. 55, 71-82 (1986).
14. J. Bergen and E. Adelson, "Early vision and texture percep-tion," Nature (London) 333, 363-364 (1988).
15. A. Sutter, J. Beck, and N. Graham, "Contrast and spatial vari-ables in texture segregation: testing a simple spatial-frequencychannels model," Percept. Psychophys. 46, 312-332 (1989).
16. I. Fogel and D. Sagi, "Gabor filters as texture discriminators,"Biol. Cybern. 61, 103-113 (1989).
17. B. J. Kr6se, A Description of Visual Structure, Ph.D. disserta-tion (Delft University of Technology, Delft, The Netherlands,1986).
18. B. Julesz and B. Kr6se, "Features and spatial filters," Nature(London) 333, 302-303 (1988).
19. B. Julesz, AT&T Bell Laboratories, Murray Hill, New Jersey07974 (personal communication).
20. H. Spitzer and S. Hochstein, "Simple- and complex-cell re-sponse dependences on stimulation parameters, and A complexcell receptive-field model," J. Neurophysiol. 53, 1244-1286(1985).
21. H. C. Nothdurft, "Sensitivity for structure gradient for texturediscrimination tasks," Vision Res. 25, 1957-1968 (1985).
22. A. Treisman, "Preattentive processing in vision," Comput. Vi-sion Graphics Image Process. 31, 156-177 (1985).
23. P. R. Kube, On Image Texture, Ph.D. dissertation (Universityof California, Berkeley, Berkeley, Calif., 1988).
24. J. D. Daugman, "Two dimensional spectral analysis of corticalreceptive field profiles," Vision Res. 20, 847-856 (1980).
25. R. Young, "The Gaussian derivative theory of spatial vision:analysis of cortical cell receptive field line-weighting profiles,"Tech. Rep. GMR-4920 (General Motors Research, Warren,Mich., 1985).
26. A. Parker and M. J. Hawken, "Two-dimensional spatial struc-ture of receptive fields in monkey striate cortex," J. Opt. Soc.Am. A 5, 598-605 (1988).
27. D. Field and J. Nachmias, "Phase reversal discrimination," J.Vis. Res. 24, 333-340 (1984).
28. D. Burr, C. Morrone, and D. Spinelli, "Evidence of edge and bardetectors in human vision," Vision Res. 29, 419-431 (1989).
29. We have used a linear sampling of the frequency space insteadof the more common logarithmic sampling. The way we com-bine the output of the different channels makes this choiceimmaterial, provided that the sampling is dense enough.
30. H. Voorhees, "Finding texture boundaries in images," Tech.Rep. 968 (Massachusetts Institute of Technology, Artificial In-telligence Laboratory, Cambridge, Mass., 1987).
31. B. Julesz, E. N. Gilbert, and J. D. Victor, "Visual discriminationof textures with identical third order statistics," Biol. Cybern.31, 137-140 (1978).
32. R. Shapley and C. Enroth-Cugell, "Visual adaptation and reti-nal gain controls," Prog. Retinal Res. 4, 263-347 (1984).
33. N. Graham, J. Beck, and A. Sutter, "Two nonlinearities intexture segregation," Invest. Ophtalmol. Vis. Sci. 30,161 (1989).
34. D. Albrecht and D. Hamilton, "Striate cortex of monkey andcat: contrast response function," J. Neurophysiol. 48, 217-237(1982).
35. K. Toyama, M. Kimura, and K. Tanaka, "Organization of catvisual cortex as investigated by cross-correlation techniques," J.Neurophysiol. 46, 202-214 (1981).
36. K. De Valois and R. Tootell, "Spatial-frequency-specific inhibi-tion in car striate cortex cells," J. Physiol. 336, 359-376 (1983).
37. A. M. Sillito and P. C. Murphy, Neurotransmitters and CorticalFunction: From Molecules to Mind (Plenum, New York,1988), Chap. 11.
38. D. Tolhurst, "Adaptation to square wave gratings: inhibitionbetween spatial frequency channels in the human visual sys-tem," J. Physiol. 226, 231-248 (1972).
39. A. B. Bonds, "Role of inhibition in the specification of orienta-tion selectivity of cells in the car striate cortex," Visual Neu-rosci. 2,41-55 (1989).
40. I. Rentschler, M. Hubner, and T. Caelli, "On the discriminationof compound Gabor signals and textures," Vision Res. 28, 279-291 (1988).
41. Data are from Ref. 17. The tabulated data correspond to tb(Table 3.1, p. 39; stimulus onset asynchrony, 320).
42. B. Krose, "Local structure analyzers as determinants of preat-tentive pattern discrimination," Biol. Cybern. 55, 289-298(1987).
43. Data are from Ref. 10. The tabulated data correspond to meanoverall discriminability (pairs 1.1, 1.2, 1.3, 3.1) averaged overforeground/background and different stimulus durations.
44. J. Malik and P. Perona, "A computational model of textureperception," Tech. Rep. UCB/CSD 89/491 (Computer ScienceDivision, University of California, Berkeley, Berkeley, Calif.,1989).
45. B. Julesz, AT&T Bell Laboratories, Murray Hill, New Jersey07974 (personal communication).
46. B. Rubenstein and D. Sagi, "Texture variability across the ori-entation spectrum can yield asymmetry in texture discrimina-tion," Perception 18, 517 (1989).
47. J. Malik and P. Perona, "A computational model of humantexture perception," Invest. Ophthalmol. Vis. Sci. 30, 161(1989).