Property Council of Australia (SA Division) Pre Budget Submission 09-10
129
. . . . . . 142 GAWLER PLACE, ADELAIDE SA 5000 PH 08 8236-0900 - FAX 08 8223-6451 www.propertyoz.com.au The Voice of Leadership Pre-Budget Pre-Budget Submission: Submission: 2009-2010 2009-2010 SA State Budget SA State Budget Property Council of Australia Property Council of Australia February, 2009 February, 2009 Alliance Partner
Pre-Budget Pre-Budget Submission:Submission:2009-2010 2009-2010 SA State BudgetSA State Budget
Property Council of AustraliaProperty Council of AustraliaFebruary, 2009February, 2009
Alliance Partner
.........
Table of ContentsExecutive Summary...............................................................................iiiThe Property Council in Brief.................................................................iv2008 in Review .....................................................................................vRecommendations.................................................................................viA Guide to Reading this Submission......................................................x1. Building SA for Growth.....................................................................1
1.1 Urban Renewal Initiative .................................................21.2 Local Action Plans............................................................5
2. Climate Change and the Environment.............................................72.1 A Climate Change Policy for the Built Environment..........82.2 The Second Plank: Green Depreciation.............................112.3 Delivering Water Use Reductions.....................................13
3. Community Dividends......................................................................143.1 Corporate Responsibility..................................................................154. Governing Smarter...........................................................................164.1 Modernising Metropolitan Governance.............................................174.2 Modernising Local Governance........................................................205. Fairer Taxes.....................................................................................21
5.1 Broad tax review..............................................................225.2 Land tax...........................................................................235.3 Stamp duty.......................................................................255.4 Rationalisation Program...................................................26
Attachment 1: Recycled Water Pipeline Position Paper..........................28Attachment 2: Cost Benefit Evaluation of Reducing Taxes....................36Attachment 3: Unit Trust Rationalisation Model.....................................73Attachment 4: Unit Trust Gap Analysis..................................................79Attachment 5: Unit Trust CRE Rationalisation Model..............................83Attachment 6: Unit Trust CRE Gap Analysis...........................................88
- ii -
.........
Executive SummaryThis submission focuses on the contribution of the property investment and development sectors to the broader community. The Property Council supports a budget that delivers: a return to strong, ongoing economic growth of three to
four per cent; a public policy reform framework for long-term sustainable
growth; and programs that build community capacity and better balance
the social, environmental and economic targets of South Australia’s Strategic Plan.
In addition, the Property Council contends that a new approach to setting fiscal policy – based on the following concepts – should inform the design of the 2009/2010 budget: Key performance indicators – greater clarity about the
measurable goals of all budget programs; Community capacity building – lifting the ability of
individuals, families and firms to make the most of their relative talents and opportunities;
Sustainability – optimising governance, economic, social and environmental assets for the long-term benefit of the community;
A war on red tape – more efficient regulation, less duplication and minimal conflict of policy settings;
Tax reform – lower taxes achieved through more efficient tax design that also delivers lower compliance costs and promotes a competitive economy;
Modern policy assessment instruments – adoption of methodologies that better allocate scarce resources (such as capital spending on infrastructure) on a triple bottom line basis, and allow for more effective assessment of regulatory impacts;
Accounting for spatial implications – an understanding of the spatial consequences of all policy programs; and,
Incentives – the use of incentives to transform market behaviour to meet community goals as an alternative to regulation.
These concepts are not all directly addressed in this submission however the Property Council (SA Division) will be addressing each of these areas in the leadup to the State Election in March 2010. The Property Council is available to discuss each of the areas outlined above.
- iii -
.........
The Property Council in BriefThe Property Council represents the property investment sector in Australia.
Its members include every major property investor in the State.
Members are engaged in the entire property investment universe, which includes all:
dimensions of property activity (financing, funds management, development, ownership, asset management, transaction and leasing);
major property types (offices, shopping centres, residential development, industrial, tourism, leisure, aged care, retirement and infrastructure);
major regions of Australia and international markets; and,
the four quadrants of investment – public, private, equity and debt.
Some key statistics:
the value of investment grade stock under management in South Australia is $3.5 billion;
more than half a million South Australians collectively own major segments of the state’s most valuable commercial property assets;
the market value of foreign assets owned by Australians is $50 billion;
Total construction spending across South Australia in 2009 is forecast to be $9.46 billion; comprising $4.3 billion in residential construction, $1.5 billion in commercial construction and $3.6 billion in infrastructure1 (this does not take into account the recent Federal Government Economic Stimulus Package);
$61 million flows in to the property sector from super funds in an average week; and,
$1.5 billion in property specific taxes are paid annually to the State Government.
1 Construction Forecasting Council [http://www.cfc.acif.com.au/] January 2009
- iv -
.........
2008 in Review Globally, 2008 was a tough year. While the year started well, the gradual collapse of the financial sector in the US and UK culminated in a market meltdown in the last quarter.
The flow-on effects of this are expected to felt until late 2010.
While the global financial crisis has had an impact on Australia, the overall impact on South Australia to date has been comparatively limited; in the main it has resulted in fewer options for financing and downward pressure on property values.
In 2008, the Government put into place a range of reforms that will ensure a bright future for the State including planning reforms incorporating delivery of transit oriented developments, a new planning instrumentality, and significant infrastructure investment that will enable the State to meet the needs of a growing population while delivering increased prosperity.
In 2009 it is expected that there will be an increase in the numbers of commercial properties transacted but at lower values than have been seen over the last 12 to 24 months. It is also expected that finance will become easier to source over the year, reducing pressure on the economy and facilitating delivery of more critical projects.
While the State Budget is under pressure from reduced GST revenues and stamp duty receipts, the medium to long term outlook for the state economy remains positive with growth in the resources and defence sectors.
The big negative for 2008 was the significant increase in property valuations which resulted in sudden and unexpected increases in land tax bills. These increases were unwelcome in a softening climate and it is worth noting that the Queensland Government took immediate action to freeze land tax valuations to protect jobs and bolster the economy. The impact has already been seen in a reduction in forward development, declining employment levels and falling investment levels. The key issue is the uncompetitively high levels of land tax in South Australia compared to every other jurisdiction in Australia, compounded by the fact that land tax bills cannot be budgeted for.
It is imperative that the Government use this time to prepare the State for prosperity. The State must be moving onto a ‘war footing’ so that the potential prosperity does not pass us by.
- v -
.........
Recommendations Building SA for Growth
Urban Renewal Initiative – Recommendations:
First: Establish an Urban Renewal Initiative, overseen by the Urban Renewal Unit.
Second: Establish an Urban Renewal Unit, to deliver the Urban Renewal Initiative.
Third: Develop community capacity building KPIs, to be used to guide for State Government funding support. Such KPIs could underpin a sustainability and growth charter along lines recommended by the House of Representatives reports on Sustainable Cities (2005) and Sustainability for Survival (2007).
Fourth: Identify and fund five catalyst urban renewal projects (confirm five years of State Government financial support).
Local Action Plans – Recommendations:First: Establish a working group to develop and deliver Local
Action Plans.
Second: Deliver better governance by making financial support contingent on the achievement of community capacity building KPIs.
Third: Use PPPs and other innovative funding mechanisms to accelerate the delivery of infrastructure projects.
Climate Change and Environment
A Strategy for Transforming Market Behaviour – Recommendations:
First: Develop voluntary interim performance targets across all eco efficiency categories – energy/greenhouse abatement, water, waste and indoor environmental quality – to enable to achievement of targets in South Australia’s Strategic Plan.
Second: Provide $300,000 over two years to the Property Council to enhance the Government/Property Council Green Buildings Tune-Ups Program, specifically to develop and disseminate
- vi -
.........information such as a tune-up and retro-greening toolkit and help to build industry capacity.
Fourth: Cut environmental red tape. Fifth: Establish a state demonstration program that makes the
business case for green development/buildings and promotes innovative practices.
Sixth: Develop a One Stop Shop for all water, waste and energy reduction stratgies, directing building owners to sources of financial and non-financial incentives.
Green Depreciation – Recommendation:
First: Support the introduction of accelerated depreciation for buildings that retrofit (retro-green) to meet higher environmental standards.
Delivering Water Use Reductions – Recommendations: The Property Council proposes the following package of measures: First: Cut water connection charges by 50 per cent for
commercial properties that deliver significant reductions in potable water use.
Second: Finance the extension of the recycled water pipeline through the CBD.
Community Dividends
Corporate Responsibility – Recommendation:
Note the existence of the Property Council’s draft template for corporate responsibility reporting and the Code of Conduct for the property investment and development sectors.
First: Adopt the Property Council’s proposed Metropolitan Governance Principles and work with local government to deliver.
Modernising Local Governance - Recommendations:
First: Help to reform and improve the performance of local government with the following programs:
- institute an inquiry into the optimal size of local councils that balances democratic representation, efficient delivery of services, environmental catchments, funding powers and ability to attract (and retain) professional staff;
- support a constitutional commission to develop a model for establishing councils as local parliaments. A key feature of the model would be the application of the separation of powers doctrine to key local government activities;
- require all councils to develop local action plans based on key performance indicators (KPIs), similar to South Australia’s Strategic Plan. All councils should develop 25-year infrastructure plans;
- require councillors who sit on planning committees to undertake professional development provided by a registered training provider;
- offer incentive payments to, and abolish rate capping for, local governments that undertake reforms; and
- establish a fiscal responsibility protocol for local government.
- viii -- viii -
......... Fairer Taxes A broad tax review – Recommendations:First: Immediately undertake a broad review of South Australia’s
taxation base with a view to aligning with the Federal Henry Review of Taxation.
Second: Examine and remove financial disincentives to skilled employees and investors considering South Australia as an employment and investment destination.
Third: Ensure that existing and proposed tax measures do not constrain the ability of the property industry to adjust to environmental demands.
Land Tax – Recommendations: First: Immediately freeze property valuation increases to provide
relief to businesses and investors in South Australia.Second: Increase the base threshold to $250,000 and the maximum
threshold to $2.5 million at a rate of 2.5c per dollar.
Stamp Duty on Non-Residential Conveyances– Recommendations: First: Immediately abolish Stamp Duty on Non-Residential
Conveyances.
Rationalisation Program – Recommendations: First: Immediately adopt and implement the rationalisation models.
- ix -
.........
A Guide to Reading this SubmissionThis submission provides recommendations on 12 policy topics grouped by five broad themes:
1. Building SA for growth
2. Climate change and the environment
3. Community dividends
4. Governing smarter
5. Fairer taxes
This submission focuses on policy issues with implications for the 2009-2010 State budget. In general, one to two pages of commentary and recommendations are provided for each topic. As each section has been written to assist the State to meet targets in South Australia’s Strategic Plan, each applicable target is identified.
The Property Council of Australia can provide considerably more detail for each subject area, including extensive research reports prepared by Australia’s leading independent consultants and academics.
We are keen to share these resources with the South Australian Government.
the creation of local action plans. the need for an urban renewal program in South Australia to
revitalise Adelaide and provide a diverse range of housing products to meet growing demand;
Fiscal Implications – 2009 State Budget:Urban Renewal Commission – minimal fiscal impact in year one.Local Action Plans – minimal fiscal impact in year one.
The Property Council welcomes the establishment of the State Government’s commitment to urban renewal and investment in the rail network.
We believe this is a good first step, but to achieve the targets established by South Australia’s Strategic Plan an Urban Renewal Unit, similar to the Major Cities Unit at the federal level, should be created to be responsible for developing and implementing an Urban Renewal Initiative, which would link all aspects of urban infrastructure to economic, livability, environmental and governance KPIs.
South Australia’s next leap in competitiveness and living standards will occur in Adelaide and the State’s major regional centers.
While ongoing reform programs focus on key sectoral drivers, such as transport, health, education and infrastructure, we need to hardwire these programs into an overarching strategy that addresses the urban communities that generate 80 per cent of the State’s GSP.
There are already myriad government programs that touch on the State’s major cities and townships. However, outside of South Australia’s Strategic Plan there is little public policy logic that ties these programs into a coherent community capacity building strategy.
Urban Renewal Initiative: Principal Proposition
The concept of a national urban renewal action plan is based on these basic propositions:
renewal plans are needed for major locales in Adelaide based on medium and long-term targets for community capacity building;
such targets should address factors that drive prosperity, including health services, education, transport, information connectivity, and the natural environment – as they relate to local communities;
renewal plans should be linked to infrastructure delivery programs;
each plan should be financed by modern public and private funding practices;
each plan would provide an assessment of estimated dividends versus the total cost of implementation; and,
- 2 -
......... the Urban Renewal Initiative should work in conjunction with other
government objectives to reduce red tape, improve governance and ensure the optimal democratic involvement of local communities.
What Would the Urban Renewal Initiative Aim to Achieve?
The Urban Renewal Initiative would seek to facilitate a major boost to both South Australia’s competitiveness and living standards.
To be successful the state’s cities and major regional centres need diverse, vibrant and inclusive communities.
They must be exciting, accessible and safe places where we can build the social capital that reduces poverty and unleashes creativity.
In short, our cities must be magnets that attract and leverage both capital and talent.
The centrepiece of the Urban Renewal Initiative is a concept of sustainability that involves better managing the community's economic, social, environmental and governance assets to produce dividends that improve opportunities for all citizens.
Delivering the Urban Renewal Initiative (URI) – Role of the Urban Renewal Unit
An Urban Renewal Unit Board compromising senior government, industry and community representatives should be established to guide and oversee the work of the Commission. A property industry representative should be included on the Board – reflecting the significance of integrating land use and infrastructure planning. A work program for the Urban Renewal Unit should be established by December 2009. The community capacity building KPIs developed by the Unit should be applied as a basis for determining continued access to State funding. The Urban Renewal Unit should identify and seed fund major projects that demonstrate governance reform. Five catalyst urban renewal projects should be identified and provided with five years of State support (a five year program). These should be selected on merit (projects which would deliver the greatest community capacity building dividends). Detailed renewal plans should be agreed and implemented for selected precincts, including land use and infrastructure plans. The Urban Renewal Unit should also link into the State Government’s systemic reform to improve Australia’s land use and infrastructure planning system. Specifically, the Property Council asks the South Australian Government to:
- 3 -
.........
Urban Renewal Initiative – Recommendations:
First: Establish an Urban Renewal Initiative, overseen by the Urban Renewal Unit.
Second: Establish an Urban Renewal Unit, to deliver the Urban Renewal Initiative.
Third: Develop community capacity building KPIs, to be used to guide for State Government funding support. Such KPIs could underpin a sustainability and growth charter along lines recommended by the House of Representatives reports on Sustainable Cities (2005) and Sustainability for Survival (2007).
Fourth: Identify and fund five catalyst urban renewal projects (confirm five years of State Government financial support).
Sources:
Tax Increment Financing to Fund Infrastructure in Australia, PricewaterhouseCoopers (2008, forthcoming)Funding Urban Public Infrastructure, Allen Consulting Group (2003)Recapitalising Australia’s Cities, Allen Consulting Group (2002)
Sustainable Communities: a national plan of action, Centre for International Economics (2006)
Sustainable Cities, House of Representatives Standing Committee on Environment and Heritage (2005)
Sustainability for Survival, House of Representatives Standing Committee on Environment and Heritage (2007)
- 4 -
.........
1.2 Local Action Plans
South Australia's next leap in competitiveness and living standards will occur in its cities and towns. While ongoing reform programs focus on key sectoral drivers, such as transport, health, education and infrastructure, we need to hardwire these programs into an overarching strategy that addresses the urban communities that generate 80 per cent of the state’s GSP. In doing so, we should aim to forge far-sighted reform strategies that are sustainable. This action plan for urban South Australia outlines a model for achieving these goals. The concept of a local action plan is based on these basic propositions:
there should be a plan for every locale in South Australia that sets targets for building community capacity – aligned to South Australia’s Strategic Plan;
these targets would address all factors that drive prosperity - health services, education, transport, information connectivity, the natural environment (to name a few) - as they relate to local communities;
each local plan would be backed by an infrastructure delivery program that would help achieve these targets;
each plan would be financed by modern public and private funding practices;
each plan would provide an assessment of the dividends it is expected to deliver versus its total cost of implementation;
each plan would strive to reduce red tape, improve governance and ensure the optimal democratic involvement of local communities
The State Government should tie financial assistance (or project funding) to Local Governments achieving agreed, common objectives (or KPIs).
More use should be made of PPPs and innovative funding mechanisms to accelerate the delivery of key infrastructure projects.
The Property Council commissioned research by PricewaterhouseCoopers into tax increment financing (TIF) techniques employed successfully in the United States and Europe.
TIFs involve appropriating increases in tax revenue arising from an investment in infrastructure to amortise the cost of providing infrastructure.
TIFs draw on the financial dividend that infrastructure delivers over time to help fund up front costs. There are no additional taxes.
The recommendation is based on a National Report titled, Sustainable Communities: a national plan of action, developed by the Centre for
- 5 -
.........International Economics, following extensive stakeholder consultation over the past four years.
Specifically, the Property Council asks the South Australian Government to:
Local Action Plans – Recommendations:First: Establish a working group to develop and deliver Local Action
Plans.
Second: Deliver better governance by making financial support contingent on the achievement of community capacity building KPIs.
Third: Use PPPs and other innovative funding mechanisms to accelerate the delivery of infrastructure projects.
Sources:
Tax Increment Financing to Fund Infrastructure in Australia, PricewaterhouseCoopers (2008, forthcoming) Funding Urban Public Infrastructure, Allen Consulting Group (2003)Recapitalising Australia’s Cities, Allen Consulting Group (2002)
- 6 -
.........
2. Climate Change and the Environment
This chapter recommends an overarching strategy for dealing with climate change and the built environment, including the extension of the Green Buildings Tune-Ups Program; promoting accelerated green depreciation; and reforms to deliver increased waste water re-use.
The Property Council commends the State Government on its forward-thinking legislation to establish targets aimed at reducing greenhouse gas emissions and its budgetary support for the Green Building Tune-Ups Program. The Property Council has concluded a Sector Agreement with the State Government as provided by Legislation.
The Property Council sees programs that focus on broad-scale improvements in the energy efficiency of the built environment (and building users) as a crucial pathway to achieving deep cuts in greenhouse gases and water use.
Fiscal Implications – 2009 State Budget:Climate change and the built environment – repackaging of existing programs. Enhanced Green Buildings Tune-Ups Program –$300,000 over two years. Support for accelerated depreciation – no fiscal impact to South Australia.Water Use Minimisation Strategy – estimated to cost $5m.
2.1 A Climate Change Policy for the Built Environment
The Property Council and the State Government are working together to deliver a greener built environment; a partnership based on a Sector Agreement. The recommendations in this section are designed to build on the existing strong relationship.
“…in order to make an overall longer term impact on drawing down carbon emissions…energy efficiency [is the] second plank.”
Kevin Rudd, Prime Minister of Australia, 19 August, 2008
Buildings and their occupants account for 23% of Australian’s greenhouse gas emissions (GHG).2
The Built Environment Offers a Ready Source of GHG Savings
Research conducted by the Australian Sustainable Built Environment Council (ASBEC)3 showed that significant abatement can be achieved with properly targeted incentives.
Relying on the Carbon Pollution Reduction Scheme (CPRS) alone the building sector is expected to reduce emissions by around 8 Mt a year.
The ASBEC research demonstrates that with complementary measures and incentives, abatement of around 60 Mt per annum is achievable by 2030.
The Opportunity
A strategic approach to building energy efficiency could:
halve electricity use in commercial building stock by 2030 and 70% by 2050;
reduce GHG emissions by 30% within two decades;
cut the cost of carbon abatement by 14% or $30 per tonne by 2050;
return $38 billion each year to the GDP compared to conventional GHG abatement programs by 2050;
provide breathing space for the development of clean energy alternatives; and,
help the country reduce its carbon footprint faster and with less fuss.
2 Capitalising on the Building Sector’s Potential to Lessen the Cost of a Broad Based GHG Emissions Cut, Centre for International Economics (September, 2007)3 The Second Plank – Building A Low Carbon Economy With Energy Efficient Buildings, Centre for International Economics for ASBEC (August, 2008)
- 8 -
.........Eco-efficiency in the Built Environment
Energy efficiency does not provide the only opportunity for the built environment. A focus on eco-efficiency could deliver other significant sustainability dividends:
new commercial buildings and their occupants could:
o consume 60%-70% less water;
o generate 40% less waste; and,
o deliver higher indoor environmental quality;
new dwellings and their occupants could halve their eco footprint compared to business as usual performance; and
retrofitted existing commercial buildings could achieve at least half the efficiencies of new buildings over the next decade.
The Second Plank
The ASBEC/CIE paper proposed three specific policy measures that would allow energy efficiency in the building sector to deliver greater abatement opportunities:
a national white certificate scheme;
provision of green depreciation; and,
public funding for building retrofits – aimed at both the retail (residential and commercial buildings) and wholesale (energy retailer) sectors.
These recommendations are covered in more detail in the next section.
Sources:
Capitalising on the Building Sector’s Potential to Lessen the Cost of a Broad Based GHG Emissions Cut, Centre for International Economics (September, 2007)
The Second Plank – Building A Low Carbon Economy With Energy Efficient Buildings, Centre for International Economics for ASBEC (August, 2008)
- 9 -
.........The recommendations outlined below will enable South Australia to achieve significant social and economic benefits while also ensuring we meet our national and international obligations. The requested funding of an additional $300,000 over two years will enable the Property Council to deliver education programs and materials that encourage the property sector to refurbish existing buildings. This expenditure will enhance the Government/Property Council Green Buildings Tune-Ups Program announced in the 2008/09 State Budget.
Specifically, the Property Council asks the South Australian Government to:
A Strategy for Transforming Market BehaviourThe Property Council proposes the following package of measures: First: Develop voluntary interim performance targets across
all eco efficiency categories – energy/greenhouse abatement, water, waste and indoor environmental quality – to enable to achievement of targets in South Australia’s Strategic Plan.
Second: Provide $300,000 over two years to the Property Council to enhance the Government/Property Council Green Buildings Tune-Ups Program, specifically to develop and disseminate information such as a tune-up and retro-greening toolkit and help to build industry capacity.
Fourth: Commit to reducing environmental red tape. Fifth: Establish a state demonstration program that makes the
business case for green development/buildings and promotes innovative practices.
Sixth: Develop a One Stop Shop for all water, waste and energy reduction strategies, directing building owners to sources of financial and non-financial incentives.
- 10 -
.........
2.2 The Second Plank: Green Depreciation
The quickest way to achieve deep emissions cuts is to improve energy efficiency in existing buildings.
There are 330 million square metres of existing non-residential property stock in Australia.
Accelerated ‘green’ depreciation would fast track efforts to rebuild existing stock to higher environmental standards.
Green depreciation would cost $2.3 billion over 10 years, starting with a $90 million annual outlay.
Independent research indicates the investment would save 203 Mt of carbon over the first decade. That equates to removing 6.4 million cars from our roads every year.4
What is Green Depreciation?
Green depreciation is accelerated depreciation for buildings that meet an environmental standard.
The standard, to be set by government, would be based on scientific and engineering advice.
Australian governments have traditionally used accelerated depreciation to stimulate the economy.
In the 1992 One Nation package, then Prime Minister Paul Keating introduced an accelerated depreciation scheme to stimulate the economy:
“The Government has decided to provide substantial acceleration of depreciation deductions for plant and equipment for tax purposes….The tax preference….will encourage [domestic plant and equipment] investment relative to alternatives, including foreign investment abroad…The acceleration of depreciation for plant and equipment will be focussed particularly on assets with long lives.”
Paul Keating, Prime MinisterOne Nation, 26 February 1992, pp71-72
In the current economic climate, an accelerated depreciation scheme for green building retrofits will help to stimulate the economy and deliver sustainability dividends.
The Property Council proposes accelerated depreciation be used to stimulate a massive investment in improved environmental performance.
4 Green Depreciation: A Preliminary Analysis, Centre for International Economics, (November, 2007)
- 11 -
.........
How Would Green Depreciation Work?
Green depreciation involves the provision of accelerated depreciation allowances for building investments that install specific energy efficient fittings, fixtures and fabric or raise the overall energy performance of the building to a predetermined standard.
It would play a key role in overcoming timing gap problems, allowing investors to defer tax payments in exchange for bringing forward energy efficiency and GHG reductions.
Accelerated depreciation would establish an important foundation for a Green New Deal program recently announced by a coalition including the ACF, the ACTU, ACOSS and the Property Council.
The SA Government should advocate in favour of Accelerated Green Depreciation with its COAG counterparts.
Specifically, the Property Council asks the South Australian Government to:
Green Depreciation – Recommendation:
First: Support the introduction of accelerated depreciation for buildings that retrofit (retro-green) to meet higher environmental standards.
Sources:
Capitalising on the Building Sector’s Potential to Lessen the Cost of a Broad Based GHG Emissions Cut, Centre for International Economics (September, 2007)
Green Depreciation: A Preliminary Analysis, Centre for International Economics (November, 2007)
The Second Plank – Building A Low Carbon Economy With Energy Efficient Buildings, Centre for International Economics for ASBEC (August, 2008)
Towards a Green New Deal: Economic stimulus and policy action for the double crunch, Australian Conservation Foundation, Australian Council of Social Services, The Climate Institute, Property Council of Australia, Australian Council of Trade Unions, Australian Green Infrastructure Council, Australian Institute of Superannuation Trustees (December, 2008)
- 12 -
.........
2.3 Delivering Water Use Reductions
As the community and the Government recognises, one the State’s biggest challenge is future supplies of potable water.The Property Council supports the Government’s efforts to reduce potable water use through desalination, stormwater harvesting, and the recycled water pipeline to the Adelaide Parklands. However, more must be done to reduce usage of potable water for non-essential purposes.The greatest economic barriers to improved water efficiency in non-residential buildings is the annual supply charge for connection to mains water. The low cost of water mean there is little or no incentive to cut usage levels as the significant cost for non-residential users is the annual supply charge.The implication of this is that there is no incentive for reducing water usage in non-residential properties.
Case Study on World Park One
World Park One is a new campus-style development just outside of the Adelaide CBD. The development is designed to be water neutral, delivering outcomes for the community as a whole. However, despite this, the owners and tenants will continue to pay about $120,000 per annum in connection charges (based on a property value of $150 million).
The State and Federal Governments are making a major investment in the Glenelg to Adelaide Parklands Recycled Water Pipeline to provide water for the parklands. For a minimal additional investment, a spur of this pipeline could be run through the CBD to allow commercial buildings to plumb in cooling towers and other non-potable uses to this water source. This adds an economic benefit to the project and clearly has the potential to deliver significant water savings.Specifically, the Property Council asks the South Australian Government to:
Delivering reduced Water UseThe Property Council proposes the following package of measures: First: Cut water connection charges by 50 per cent for
commercial properties that deliver significant reductions in potable water use.
Second: Finance the extension of the recycled water pipeline through the CBD.
Attachment:1. Recycled Water Pipeline Position Paper (April 2008)
- 13 -
.........
3. Community DividendsThis chapter provides a recommendation on:
corporate responsibility.
Fiscal Implications – 2009 State Budget:
Corporate responsibility – no fiscal implications.
3.1 Corporate ResponsibilityThe Property Council has developed a corporate responsibility (CR) reporting template for the property sector.
This is part of a broader Code of Practice for the property and capital markets communities.
The template takes the form of a voluntary industry standard.
It will integrate with the de facto global standard developed by the Global Reporting Initiative and conforms to the United Nations Global Compact’s 10 principles of social responsibility.
The template is also consistent with the Dow Jones Sustainability Index and the FTSE For Good reporting scheme.
While there are no fiscal implications for the 2009 State Budget, the voluntary standard is an alternative to any mandated reporting requirement.
Specifically, the Property Council asks the South Australian Government to:
Corporate Responsibility – Recommendation:
Note the existence of the Property Council’s draft template for corporate responsibility reporting and the Code of Conduct for the property investment and development sectors.
Sources:
A Guide to Corporate Responsibility Reporting in the Property Sector, Version 2.1, Property Council of Australia (2009, forthcoming)
Draft Code of Practice, Property Council of Australia (2009, forthcoming)
- 15 -
.........
4. Governing SmarterThree issues are addressed in this chapter:
a methodological approach to modernising metropolitan governance;
delivering improved local governance.
Fiscal Implications – 2009 State Budget:
Modernising metropolitan governance – no fiscal implications.
Modernising local governance – minimal fiscal impact in 2009.
South Australia’s Strategic Plan Targets:T1.1, T1.2, T1.5, T1.6, T1.7, T1.8, T.19, T1.10, T1.11, T1.12, T1.14, T1.16, T2.21, T 5.4, T5.5
- 16 -
.........
4.1 Modernising Metropolitan Governance
Toward an Australian set of leading practice urban governance principles“…cities will face growing social exclusion and increasing financial pressure in a more complex, fragmented institutional environment.
“Cities will need to be more creative, more institutionally innovative…the challenge of devising effective models of governance will become increasingly urgent.”
Michael Parkinson “Developing Competitive and Cohesive European Cities”, European Institute for Public Affairs, 2002
The early 1990s witnessed a revival of programs that aimed to improve competitiveness and social opportunity in cities.
A decade later, many policy makers concluded that urban strategies often failed in the face of outmoded governance arrangements.
Causes of Urban Governance Failure
The 2001 OECD report Cities for Citizens: Improving Governance in Metropolitan Areas, identified three main failures of urban governance:
the fragmentation of administrative jurisdictions within metro areas;
the financial/fiscal strain faced by local authorities at a time when major investment in infrastructure is required; and
the absence of transparent, accountable decision-making frameworks at the local level.
The OECD encouraged its members to develop governance models that addressed these shortcomings.
Modern Governance Principles
More recently, the United Nations5 identified seven principles of leading practice urban governance:
sustainability in all dimensions of urban development;
subsidiarity of authority and resources to the appropriate level;
equity of access to decision-making processes and the basic necessities of urban life;
5 Global Campaign on Urban Governance (Concept Paper), UN-HABITAT (2002)
- 17 -
......... efficiency in the delivery of public services and in promoting local
economic development;
transparency and accountability of decision makers and all stakeholders;
civic engagement and citizenship; and,
security of individuals and their living environment
These principles were employed to develop a performance measure called the “urban governance index”.
There are many other menus of urban governance principles, all of which cover similar territory.
Metropolitan Governance Principles for Australia
To kick start debate, the following metropolitan governance principles are proposed:
1. Commit to strategic sustainability that aims to maximise multiple economic, social, ecological and governance dividends.
2. Increased competitiveness based on long-term investments in social development and economic infrastructure.
3. Place-shaping that increases local choice, diversity and opportunity within broader regional/national contexts.
4. Greater transparency, accountability and probity that enhances trust in metropolitan government.
5. Greater fiscal capacity to capitalise city services and investment programs adequately, while minimising deadweight taxes/charges.
6. Improved equity and access to opportunity across the community.
7. Greater subsidiarity, participation and civic engagement that refreshes civic mandates.
8. Greater efficiency, coordination and integration of public service delivery.
9. A commitment to innovation and inspiring leadership that continuously improves city governments’ capacity to meet evolving community needs.
10. Rational and coherent spatial boundaries that establish a logical nexus between the responsibilities of city government and the communities they serve.
Specifically, the Property Council asks the South Australian Government to:
First: Adopt the Property Council’s proposed Metropolitan Governance Principles and work with local government to deliver.
Sources:
Modernising Metropolitan Governance: Toward an Australian set of leading practice urban governance principles, Version 2.0, Property Council of Australia (December, 2008)
Developing Competitive and Cohesive European Cities”, Michael Parkinson European Institute for Public Affairs (2002)
Cities for Citizens: Improving Governance in Metropolitan Areas, Organisation for Economic Co-operation and Development (2001)
Global Campaign on Urban Governance (Concept Paper), UN-HABITAT (2002)
Cities Strategy, Version 3.0 Property Council of Australia (October, 2008) (See Appendix 2)
- 19 -
.........
4.2 Modernising Local Governance
In addition to Federal-State reforms that are currently being negotiated through COAG, local government also needs to be modernised.
The recommendations outlined below provide a clear pathway to improved local governance that will benefit all levels of government, and more importantly, the community.
Specifically, the Property Council asks the South Australian Government to:
Modernising Local Governance - Recommendations:
First: Help to reform and improve the performance of local government with the following programs:
- institute an inquiry into the optimal size of local councils that balances democratic representation, efficient delivery of services, environmental catchments, funding powers and ability to attract (and retain) professional staff;
- support a constitutional commission to develop a model for establishing councils as local parliaments. A key feature of the model would be the application of the separation of powers doctrine to key local government activities;
- require all councils to develop local action plans based on key performance indicators (KPIs), similar to South Australia’s Strategic Plan. All councils should develop 25-year infrastructure plans;
- require councillors who sit on planning committees to undertake professional development provided by a registered training provider;
- offer incentive payments to, and abolish rate capping for, local governments that undertake reforms; and
- establish a fiscal responsibility protocol for local government.
- 20 -
.........
5. Fairer TaxesThis chapter addresses the need for local tax reform in the areas of:
A broad tax review Stamp duty Land tax
The State Government adjusted Payroll Tax rates in the last two State Budgets and while times are tough, it is now time for property tax reform, reforms that will deliver the greatest economic benefit for every South Australia.The Federal Government has instigated the Henry Review of Taxation that will seek to deliver ‘root and branch’ reform to taxation. The State Government must work collaboratively with this review to maximise the economic benefit for South Australia.
Fiscal Implications – 2009 State Budget:Tax review – minimal fiscal impact in year one.Land Tax – about $80 million in year one.Stamp Duty on non-residential conveyances – $250 million in year one.Unit Trust and CRE Rationalisation – minimal fiscal impact.
As South Australia continues to gear up for the opportunities in the mining and defence industries, it is in competition with other states and jurisdictions for investment, jobs and population. Despite commitments within South Australia’s Strategic Plan, the State seriously lags in instituting a competitive taxation regime that balances fairness, social and economic needs and the demands of a growing economy. Particularly in these challenging times, our tax system must be designed to attract skills and investment, not repel them.The recent global economic turmoil has exposed the risk to the State’s finances of overly relying on the property market, which can fluctuate dramatically. Additionally, the recent increases in land valuations have significantly increased the land tax bills of mums and dads, businesses and investors. These increases have resulted in employees being laid off, increasing prices of goods and services and has threatened the future of the economic prosperity of South Australia. Equally, the increase in land tax bills is working counter to many initiatives aimes at improving environmental efficiency in the built environment.The Property Council recommends that South Australia initiate a taxation review and implement a broad tax review as a matter of urgency.
Specifically, the Property Council asks the South Australian Government to undertake:
A broad tax review – Recommendations:First: Immediately undertake a broad review of South Australia’s
taxation base with a view to aligning with the Federal Henry Review of Taxation.
Second: Examine and remove financial disincentives to skilled employees and investors considering South Australia as an employment and investment destination.
Third: Ensure that existing and proposed tax measures do not constrain the ability of the property industry to adjust to environmental demands.
- 22 -
.........
5.2 Land TaxLand tax in South Australia is the most uncompetitive State tax, impacting on South Australian businesses and private land investors.Almost every other State has reformed their land tax regimes over the last couple of years, leaving South Australia in a precarious competitive situation. As can be seen from the graph below, the land tax bill on a property worth $25 million in South Australia is about $283,000 more than the same investment scenario in Tasmania, the next highest jurisdiction, about $435,000 more than in Western Australia and around $500,000 more than in Queensland. This is clearly uncompetitive and urgent action is required.
Land tax paid by State (commercial)
$0
$100,000
$200,000
$300,000
$400,000
$500,000
$600,000
$700,000
$800,000
$900,000
$2,500,000 $5,000,000 $10,000,000 $25,000,000
unimproved land value
tax
paid
Vic NSW QLD WA* SA TAS ACT
The two key concerns in South Australia remain the significant valuation increases in 2008/09 and the unchanged rates and thresholds in the face of recent significant valuation increases. It is simply inconceivable with property values being what they are and the absence of purchasers that the base threshold in South Australia is $110,000 and the maximum $1 million. The Property Council believes that in order to alleviate the severe uncompetitiveness in the system, the State Government must immediately freeze all property valuations at last year’s value and further to this, increase the base threshold to $250,000, the maximum threshold to $2.5 million at a maximum rate of 2.5c per dollar in this year’s State Budget. Recently the Queensland Government put a freeze on land tax valuations to provide desperately needed relief for small businesses and investors. The situation in South Australia is no different with the significant increases in land valuations severly hurting small businesses in the State. The State Government must provide immediate relief for these businesses by freezing property values at the previous year’s value.A report prepared for the Property Council by Hudson Howells indicates that the proposal to increase the thresholds and lower the rates is estimated to cost $80 million in year one, and would deliver an additional 1,650 jobs within the State. It would also increase state incomes in real terms by 0.23 per cent as a result of new build activity.
- 23 -
.........This clearly demonstrates significant benefits of reducing land tax through increased investment, increased jobs and increased state incomes.
Specifically, the Property Council asks the South Australian Government to:
Land Tax – Recommendations: First: Immediately freeze property valuation increases to provide
relief to businesses and investors in South Australia.Second: Increase the base threshold to $250,000 and the maximum
threshold to $2.5 million at a rate of 2.5c per dollar.
Attachments:2. A Cost Benefit Evaluation of Reducing Taxes on Property in South
Australia (Hudson Howell) 2008.
- 24 -
.........
5.3 Stamp Duty
Stamp duty on non-residential conveyances continues to impact on investment in South Australia.This is the most inefficient state tax and has potential to yield the greatest economic benefit from reduction or abolition than any other state tax. Economic modelling commissioned by the Property Council indicates that the cost of this reform is in the order of $250m per year. The principal benefits of this reform are the creation of an estimated 6,900 jobs within the state and an increase of state incomes, in real terms, by 0.9 per cent. This is clearly the most beneficial property tax reform and should be adopted immediately by the Government. The modeled growth stems from the instantaneous creation of an improved business environment.The advantage of this reform is that it will make South Australia the first and only jurisdiction to abolish this tax – thereby making investment in this state far more attractive and giving a notable point of difference for investors.
Specifically, the Property Council asks the South Australian Government to:
Stamp Duty on Non-Residential Conveyances– Recommendations: First: Immediately abolish Stamp Duty on Non Residential
Conveyances.
Attachments:2. A Cost Benefit Evaluation of Reducing Taxes on Property in South
Australia (Hudson Howell) 2008.
- 25 -
.........
5.4 Rationalisation Program
As the State Government is already aware, the Property Council has been undertaking a program to rationalise land rich stamp duty definitions and provisions across Australia. Our recommendations have been adopted in Western Australia and are being favourably considered in other jurisdictions.Stamp duty on property is collected by all states however, the definitions and provisions applying stamp duty are different in each jurisdiction. The delivery of this program will encourage domestic property investment and improve international competitiveness.The lack of consistency between jurisdictions creates unnecessary complexity for property owners who want to invest across multiple jurisdictions or from overseas. These investors incur additional legal and administrative costs to comply with different state taxes and the movement of capital into and across Australia is made more difficult by the complex variation in state stamp duty regimes. It makes investment in some jurisdictions unattractive and uncompetitive. This inhibits capital investment in Australian property. Copies of the Rationalisation Models and Gap Analyses are attached for detailed consideration.
Specifically, the Property Council asks the South Australian Government to:
Rationalisation Program – Recommendations: First: Immediately adopt and implement the rationalisation
models.
Attachments:3. Unit Trust Rationalisation Model
4. Unit Trust Gap Analysis
5. Unit Trust CRE Rationalisation Model
6. Unit Trust CRE Gap Analysis
- 26 -
.........
ContactPlease contact the following about any aspect of this submission:
Nathan PaineExecutive Director – South AustraliaProperty Council of Australia
142 Gawler Place Adelaide SA 5000t. 08 8236 0900m. 0448 445 177e. [email protected]
Attachment 1:Recycled Water Pipeline Position Paper
- 28 -
.........Recommendations
1. Immediately support the proposed extension of the Glenelg-City Pipeline.2. Provide funding for the extension of the pipeline. 3. Establish a Working Group to clarify the route of the pipeline and resolve any
technical issues.4. Deliver a publicity campaign highlighting the benefits of the project. 5. Charge a water learning hub with raising awareness levels around issues of
recycled water.
Support for these recommendations will assist the State Government in achieving the following targets in South Australia’s Strategic Plan: T1.1, T1.10, T1.22, T3.7, T3.9, T3.10 and T3.11.
About the Property Council of Australia
The Property Council of Australia is the nation’s chief advocate for the property investment, development and property services sector. It champions members' interests by engaging governments on key public policy issues, as well as creating a more informed and connected marketplace.
Our members help shape, build and finance our cities. These organisations have a long-term interest in the future of Australia’s urban areas. They include the bulk of the State's investors in office towers, shopping centres, industrial parks, tourism accommodation and residential developments.
The South Australian Division represents members with interest in more than $33 billion of property investment, of which, nearly $5 billion is invested by superannuation funds in South Australian property. More than 500,000 South Australians now have a stake in these investments through their superannuation, life insurance, managed fund property trusts, syndicates and direct ownership investments.
- 29 -
.........Our proposal
The Property Council of Australia (SA Division) recognises that the property industry is in a unique position to improve the State’s environmental performance. The Property Council has been examining opportunities arising from the proposed recycled water pipeline from the Glenelg treatment works to the Adelaide parklands for irrigation purposes.
The Property Council believes there is potential to extend this water supply into the CBD for use in cooling towers of commercial buildings. There is some urgency attached to this proposal as supplying additional buildings could necessitate a larger diameter pipe than currently proposed. Changing the pipe size would have minor fiscal and logistical impact on the project as it stands, especially when compared with the potential benefits.
It should be noted that this proposal holds national significance. The proposed use of highly treated waste water in cooling towers has not been investigated interstate, positioning South Australia as a pioneer in this field.
Background
The State and Federal Governments have committed to building a new recycled water supply pipeline from Glenelg to the Adelaide parklands to provide non-potable water for the irrigation purposes. The Property Council supports this initiative as amenable public space is crucial to the health of our community and the parklands are a key natural attribute of the city. The current proposal is to install a pipeline along ANZAC Highway and complete a ring around the city. In an effort to reduce pressures on Adelaide’s potable water supply it is intended to use highly treated waste water as the source water for this irrigation project.
The owners of the new SA Water Building in Victoria Square (VS1), in their endeavours to develop a water-efficient building, have already reached an agreement with SA Water to run an extension of the pipeline from the parklands to VS1.
- 30 -
.........The Property Council believes that this program can be easily and cheaply extended to include all commercial buildings. Conversations with SA Water and the South Australian Department of Health have indicated that this proposal is achievable. As noted earlier, a larger pipe size may be required to transfer the larger volumes of water needed. In addition, as ANZAC highway is a potential development corridor, the pipeline design should allow for other developments along the route to ‘bolt on’ to the recycled water supply. In any event it is less costly to over-engineer the pipe before it is installed than to replace it to meet increased demand in years to come.
Discussion
The Property Council has held extensive discussions with SA Water and the South Australian Department of Health and has determined that significant savings of potable water can be made by extending the proposed pipeline into the CBD and running supplies into the cooling towers of major buildings.
Initial preliminary calculations have revealed that running recycled water into commercial building cooling towers could save in the realm of one billion litres of potable water annually, enough water to fill 4,000 Olympic sized swimming pools or alternatively supply the needs of all the flats, units and apartments in the City of Holdfast Bay council area (based on usage of 250 kilolitres per home; Australian Bureau of Statistics, Census Data, 2006 Community Profiles).
Cooling towers are a typical air conditioning component of buildings world-wide. And while the property industry in South Australia is extremely proactive in making new buildings as environmentally friendly as possible, there are limitations to greening the existing built environment. For example, while new buildings can be plumbed to run recycled water to toilets and cooling towers, this is more complex to implement in existing buildings.
Running a dedicated feed to an existing roof-mounted cooling tower is one immediately feasible means of using recycled water in existing buildings. As cooling towers are one of the biggest users of water in a commercial building, they present an effective use of this new water supply in a way that also contributes to economic development.
- 31 -
.........As mentioned earlier, this opportunity has already been identified by the owners of Adelaide’s first – and Australia’s highest design rated - Six Star Green Star Building, the VS1 building scheduled for completion in the final quarter of 2008. Recycled water from this supply will be used for the building’s cooling towers and toilet flushing systems.
The Property Council, through its membership base, is aware of many new developments which could promptly connect into the proposed scheme if the opportunity existed. It is therefore imperative that the pipeline be extended throughout the core of the CBD.
Financial issues
The current proposed pipeline from Glenelg to Adelaide is expected to cost $30 million and the additional treatment plant to be developed as part of the project another $30 million. This is a significant outlay and it makes sense to maximise the State’s environmental return for this investment. The Property Council estimates the government’s additional contribution for the extension of the project through the CBD to be in the order of $5 million. This is based on a generous costing of $500 per metre cost for additional in-ground pipe work - an insignificant outlay when considering the benefit to the State and the River Murray in saving one billion litres of potable water a year.
Costs that might be associated with this project are: building alteration and maintenance costs; the cost of increasing the size of the pipe work already under consideration;
and any requirements to expand the capacity of water treatment facilities.
Compared with these relatively low costs the benefits are significant: savings of up to one billion litres of potable water per year; substantially increased use of recycled water; bolstering South Australia’s water security credentials; positive messaging to the public around water reuse and recycling; and asserting South Australia’s leadership in innovative water security policy.
- 32 -
.........Implementation
The Property Council has discussed a possible route for the pipeline extension with the SA Water’s Project Manager for the current scheme. This proposal runs the extension past a concentration of major commercial buildings to maximise usage of this recycled water. A draft map is attached but the Property Council would welcome the opportunity to discuss the practicalities of implementation with the Project team.
Timing
Although the Glenelg Pipeline scheme has not yet entered construction phase, it is imperative the issues of main pipe size and treatment plant capacity are reviewed urgently in the light of the proposition to extend the pipeline. The pipe size might need to be doubled or even tripled to account for significantly increased volumes of water. To do this at the planning stage is relatively inexpensive. Enhancing public awareness of recycled water use
The successful achievement of this project would be a milestone in the South Australian Government’s Waterproofing Adelaide strategy to secure a reliable potable water supply. The Property Council is also an Alliance Partner in South Australia’s Strategic Plan and, as such, the South Australian Government and the Property Council should cooperate in developing and implementing a communications strategy that shows South Australia as an exemplar in major water-saving projects and simultaneously promotes the use of recycled water to the public.
Ongoing public education on these matters is vital. Practical initiatives such as these can contribute significantly to the increased usage of recycled water but public awareness of recycled water is very limited. In these times of extended drought it is imperative that these awareness levels are raised substantially to facilitate ever-greater uptake of recycled water.
The Property Council would therefore also advocate that the South Australian Government charge the “water learning hub” – currently in development – with increasing public understanding of the issues of recycled water and the importance of its use.
The hub should act as a single clearing house for policy ideas and messages around recycled water to ensure that the public receives clear and reliable messages that encourage the uptake of recycled water and water reuse technology.
- 33 -
.........
Recommendations
1. Immediately support the proposed extension of the Glenelg-City Pipeline.2. Provide funding for the extension of the pipeline. 3. Establish a Working Group to clarify the route of the pipeline and resolve any
technical issues.4. Deliver a publicity campaign highlighting the benefits of the project. 5. Charge a water learning hub with raising awareness levels around issues of
recycled water.
- 34 -
.........Proposed Pipeline Extension
- 35 -
.........
Attachment 2:Reducing Taxes on Property Cost Benefit Analysis of Tax Reform A Report by The Property Council of Australia (SA Division)
9th February 2008
This paper has been prepared under the auspices of the Property Council of Australia, with the assistance of Hudson Howells Pty Ltd. . This study, while embodying the best efforts of the investigators, is but an expression of the issues considered most relevant, and neither the individuals nor the associated organisations can be held responsible for any consequences that ensue from the use of the information herein.
- 36 -
.........
Table of ContentsEXECUTIVE SUMMARY....................................................................37INTRODUCTION.............................................................................37
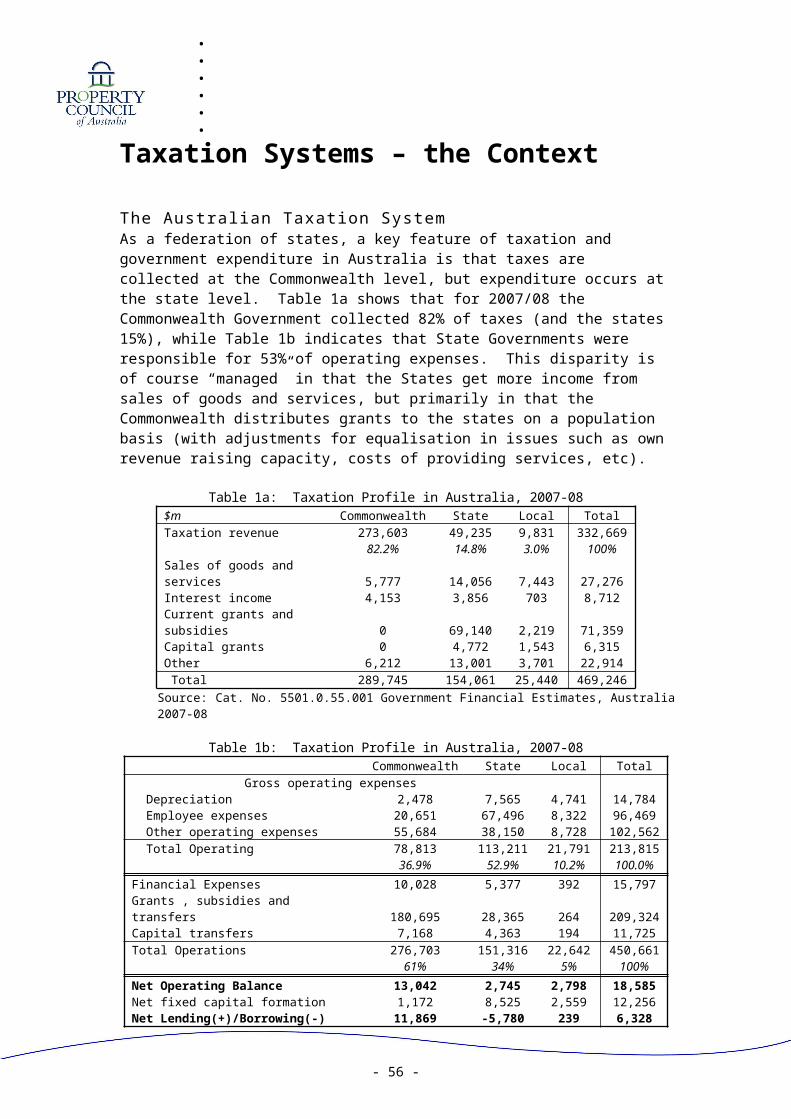
TAXATION SYSTEMS – THE CONTEXT...............................................37THE AUSTRALIAN TAXATION SYSTEM....................................................................37REGIONAL TAXATION.........................................................................................37
State Taxation in South Australia.........................................................37Local Government Revenues...............................................................37
A THEORETICAL CONTEXT – A VIEW ON TAX....................................37CORE TAXATION PRINCIPLES...............................................................................37PROPERTY TAX – THE THEORETICAL CONTEXT........................................................37
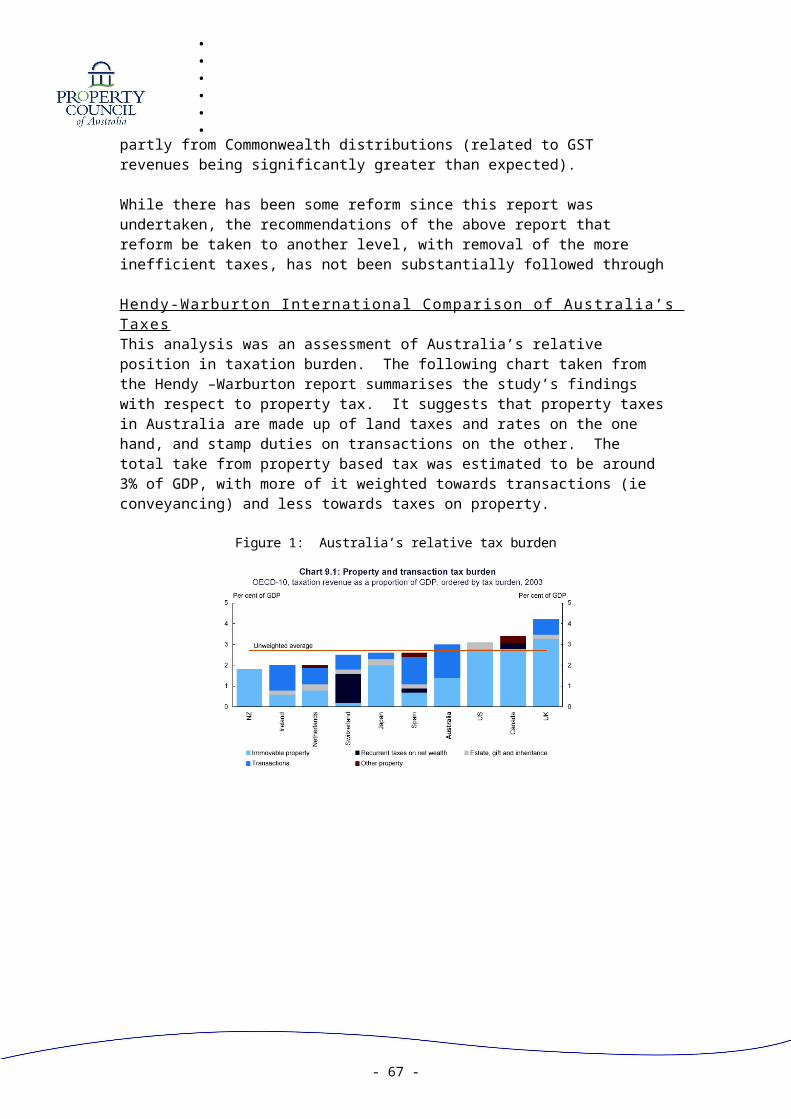
LITERATURE REVIEW......................................................................37AXING THE ALCABALA: A PROGRAM FOR A 21ST CENTURY STATE TAX SYSTEM................37HENDY-WARBURTON INTERNATIONAL COMPARISON OF AUSTRALIA’S TAXES.................37REAL ESTATE INSTITUTE....................................................................................37PROPERTY COUNCIL..........................................................................................37OTHER RESEARCH............................................................................................37
A DETAILED DESCRIPTION OF PROPERTY TAX PARAMETERS.............37LAND TAX:......................................................................................................37STAMP DUTIES.................................................................................................37
Stamp Duty on Transfer of Real Property (Land).................................37Stamp Duty on Mortgages...................................................................37
Water Supply Charges.........................................................................37Council Rates.......................................................................................37
TAX COMPARISONS...........................................................................................37Bracket Creep - Tax implications over time.........................................37Interstate Competitiveness..................................................................37
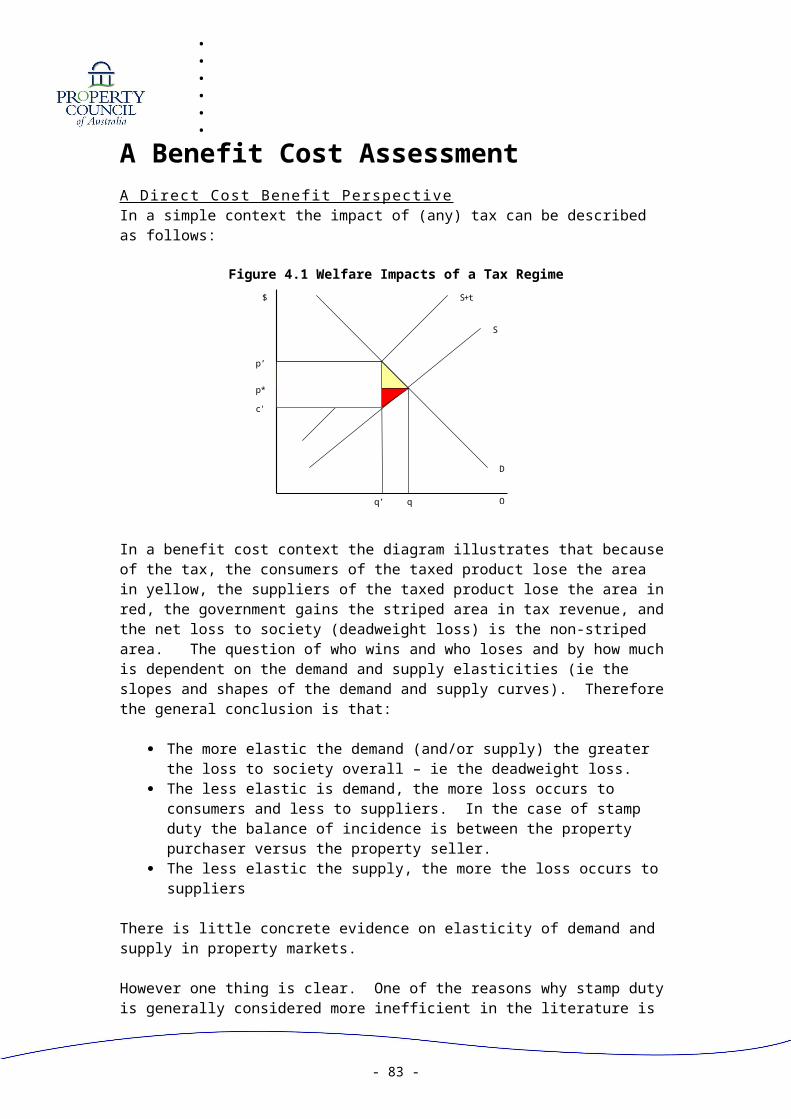
A BENEFIT COST ASSESSMENT.......................................................37A DIRECT COST BENEFIT PERSPECTIVE.................................................................37
Benefit/cost analysis of abolishing Stamp Duty on Non-Residential Conveyances.......................................................................................37Benefit/cost analysis of abolishing Stamp Duty on new homes...........37Benefit/cost analysis of land tax reform scenarios:..............................37A flat rate of 1.7c/$ at a threshold of $250,000...................................37
A BROADER BENEFIT COST PERSPECTIVE..............................................................37CONCLUSIONS...............................................................................37
- 37 -
.........
Executive SummaryThe objectives of this project were to undertake a
Benefit/Cost analysis of abolishing Stamp Duty on Non-Residential Conveyances.
Benefit/Cost analysis of abolishing Stamp Duty on new homes. Benefit/Cost analysis of the following land tax reform scenarios:
Raising the base threshold from $110,000 to $250,000 and raising the maximum threshold from $1m to $2.5m with a top rate of 2.5c/$
A flat rate of 1.7c/$ at a threshold of $250,000.
To set the context of the analysis we note that: State Governments raise only 15% of taxes raised in Australia, but
undertake 53% of operational expenditure and 37% of capital expenditure. State Governments are therefore heavily dependent on grants from the Commonwealth – and own taxation revenue is a critical part of economic management.
Commonwealth Government budgets are in significant surplus, while State Governments in aggregate require external financing.
There has been extensive growth in the contribution of property tax to State Government’s own purpose revenue. Property tax has grown at 9.5% per annum over the last 5 years, while State Government taxation has grown by 7.3% per annum.
From a South Australian perspective the evidence suggests that On average, the SA Government is at the upper end of reliance on
property tax compared with other states, both in percentage terms (of GSP), and in relative impact on property prices – particularly higher value properties (note this may in large part be due to the smaller number and proportion of higher valued properties in the state. In summary - property taxes amount to 39.5% of the state government tax take, and specifically conveyancing taxes make up 21%.
Therefore a benefit/cost analysis of property tax reductions must recognise that the State Government is limited in reducing property tax per se, they must either persuade the Commonwealth Government to provide a proportion of their surpluses to the States, reduce expenditures, or modernise the State Taxation regime. While the need to do this is recognised, it is beyond the scope of this paper to make these comparisons. However it is noted that the off-setting benefits of reductions in property tax will ameliorate the direct revenue impact.
- 38 -
.........While no tax is “desirable”, the theory gives the following principles for selecting the “best taxes”:
Equity in burden distribution –there should be both horizontal and vertical equity – in terms of those who can afford to pay the tax.
Efficiency in resource use – the tax should not distort production and consumption decisions significantly – and this is best achieved when demand for product is relatively inelastic.
Consistency re goals of macro policy – where macroeconomic policy is ensuring stability in business cycles and encouraging growth.
Ease of administration
The literature and other analyses critically suggest that stamp duties on conveyancing are very inefficient taxes, while land tax is a fairly inefficient tax. On the other hand, state government taxes that are considered more efficient include payroll tax and gambling taxes. But we note there is also significant opposition to these taxes from a political perspective.A literature review makes the point that Australia is a low-tax country. Australia’s overall tax burden (31.6 per cent), measured as the tax to GDP ratio, is the eighth lowest of the 30-member OECD countries. Australia’s mix of direct and indirect taxation is in line with other OECD countries, although the composition differs. Australia’s reliance on property and transaction taxes is the seventh highest of the OECD, but its tax burden from taxes on immovable property is below the unweighted average of the OECD-10, while Australia has the highest financial and capital transaction burden (which includes taxes such as stamp duties on conveyances).Therefore the conclusion to be reached is that Australia should reorient its tax system away from stamp duties on conveyances and taxes on fixed property (land tax), and replace them with other taxation bases.The first step in undertaking a benefit/cost evaluation of the suggested policy changes is to estimate the revenue change associated with the policy shift. There is no robust data publicly or easily available to model these changes (the data required is the number of “transactions” AND the distribution of values involved). A further unknown is that there will be price and value shifts as a consequence of the policy changes, which are dependent on the elasticity of demand and supply. However the result is modelled (indicatively at this point) using simple normal distributions around average values.On the basis of this indicative modelling:
Abolishing Stamp Duty on Non-Residential Conveyances would reduce the taxation take of the state government by an estimated $250 million (4% of total taxation).
Abolishing Stamp Duty on new homes would reduce the taxation take by $100 million (around 2% of total revenue).
- 39 -
......... In terms of land tax:
Raising the base threshold from $110,000 to $250,000 and raising the maximum threshold from $1m to $2.5m with a top rate of 2.5c/$ would reduce taxation revenues by $80 million (around 2%). This reduction is made up of: $15 million in private residential rental property. $9 million in public rental property. $54 million in commercial property (both public and private).
A flat rate of 1.7c/$ at a threshold of $250,000 would reduce taxation revenues by $72 million. This reduction is made up of: Increase in $10 million in private residential rental property. Increase in $9 million in public rental property. A $90 million benefit in commercial property (both public and
private).
Reductions in taxation revenue do not tell us fully about the economic or benefit cost improvements that will result from the taxation fall. The impact, and who it falls on is a consequence of supply and demand factors – the elasticity of demand and supply. Put simply, the more price sensitive the demand for a product, the more distorting is a given tax change. The second factor of course is also how big the tax is in relation to the taxation base. The conclusion of the literature is that property taxes are amongst the most distorting of the state government taxation methods – a consequence of both of these points.
So what are the implications of these reductions in taxation revenue from a benefit cost perspective:
Abolishing Stamp Duty on Non-Residential Conveyances would see the prime benefit being for users and suppliers of commercial property. The implication would be to reduce costs for business, and therefore increase the relative competitiveness of firms/industries facing external competition, and reduce costs for firms supplying the local market with limited competition.
Abolishing Stamp Duty on new homes would improve new house affordability but not directly improve affordability of established homes. There are some 28,000 sales of established homes per year, and 8,000 new home builds. Stamp duty will be paid on the land in some cases, but in speculative build will be paid on both land and property. While having some effect on improving housing affordability, it complicates the relationship between the new and established housing market – producing something of a bias or stimulus for new home builds. But the implications of the way this affects the market need to be considered.
Reducing land tax – provides a gain to the private rental market, and for commercial property. The gains for commercial property are as discussed above. The gains for the rental market again provide for some distortions between interacting markets, but in the context of existing distortions, and further given the current tightness in the rental market.
One of the issues that will have led to the distorting effects being at the level noted above is the structure of the tax base. In the same way that
- 40 -
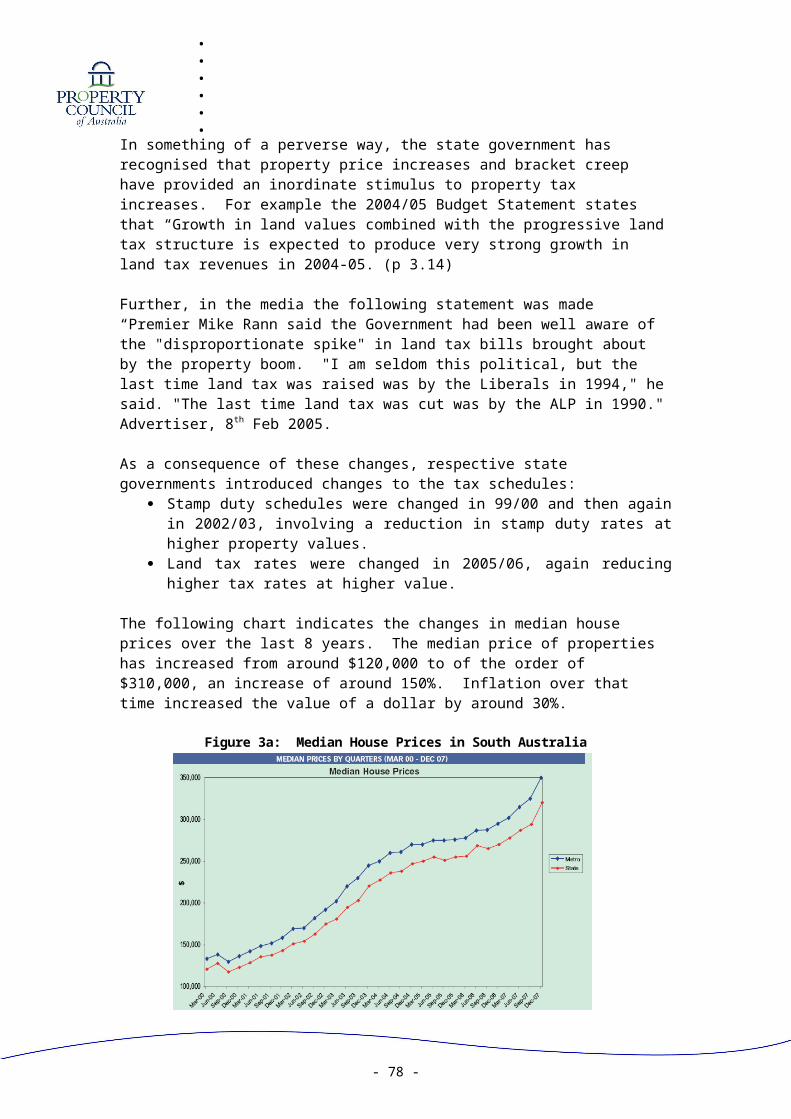
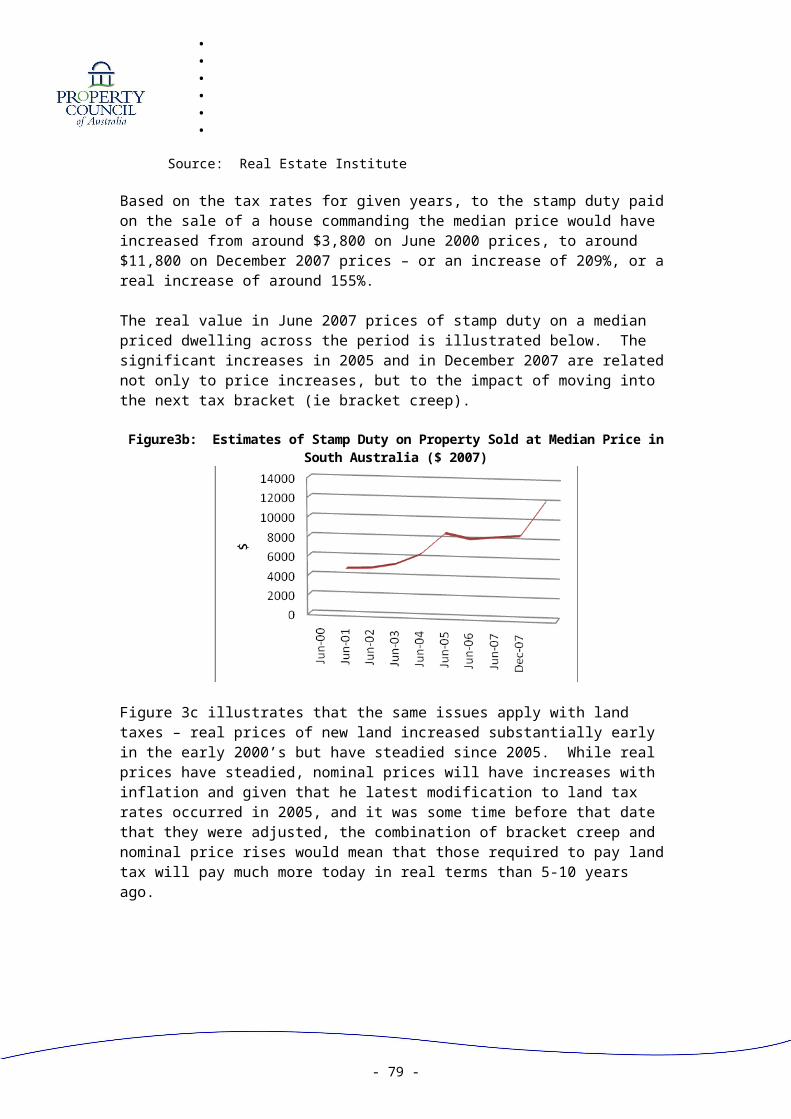
.........bracket creep has led to increased takes of individual income tax revenue, bracket creep is an issue in property tax as well – meaning that the tax revenue will grow simply because of inflation. The analysis suggests that over the last 8 years, average property prices have grown at 11% per year, but there have only been 2 adjustments of the tax rate parameters, and therefore the tax on a median value property is 155% more than it was in 2000 in real terms.
The above represents outcomes from a direct and tangible benefit context. In addition, outcomes need to consider indirect and intangible benefits and costs. The major source of indirect impact is in terms of impact on industry competitiveness and therefore economic activity.
In the case of stamp duty on owner occupied residences, the tax represents a decline in real income over what would otherwise be the case.
In the case of land tax and stamp duty on rental residences, the tax represents a decline in real income for renters, and a shortage of supply from the perspective of the market.
In the case of land tax and stamp duty on commercial property, the tax represents an increased cost of doing business, and therefore produces a decrease in competitiveness.
In summary, it is estimated that: A $100 million decline in tax payments on residential property will
create of the order of 700 jobs in the state and increase real incomes (GDP) by 0.12%.
A $100 million decline in tax payments on commercial property will create of the order of 2,800 jobs in the state and increase real incomes by 0.38%.
Therefore for the policy changes assessed in this paper: Abolishing Stamp Duty on Non-Residential Conveyances would
create an estimated 6,900 jobs within the state, and increase state incomes in real terms by 0.9%.
Abolishing Stamp Duty on new homes would create an estimated 670 jobs within the state, and increase state incomes in real terms by 0.1%.
In terms of land tax: o Raising the base threshold from $110,000 to
$250,000 and raising the maximum threshold from $1m to $2.5m with a top rate of 2.5c/$ would create an estimated 1,650 jobs within the state, and increase state incomes in real terms by 0.23%.
o A flat rate of 1.7c/$ at a threshold of $250,000 would create an estimated 2,400 jobs within the state, and increase state incomes in real terms by 0.33%.
The issue as noted above is that these lost revenues must be replaced by an alternative source, and detailed analysis of exactly what this could or would entail is beyond the scope of this paper. However there would be three possible approaches to this, which include:
- 41 -
......... The outcome is that the above is a net community gain within South
Australia if the foregone revenue was replaced by additional Commonwealth grants (providing this was not just a shared arrangement - ie it is revenue that would not otherwise be available – but this is unlikely.
The second option is that lowering government expenditure could finance the reduced revenue. Modelling by Access Economics indicates that a $100 million reduction in property taxes would result in a $20-30 million net gain in welfare terms ($50 million where the reduction is in non-residential property conveyancing taxes). Note that there is a significant increase in welfare from property “consumers” (ie households) and this is partly offset by losses in other sectors due to offsetting implications of the lower aggregate tax base. Note that simplifying the system by either options 1, 2 or 3b would also potentially add a benefit of reduced administration costs associated with property tax collection
The third option is to replace the taxation revenue by alternative taxation sources. Analysing this option is beyond the scope of this paper, and the outcomes will depend on the efficiency of the alternative taxation mechanism. However we note the literatures suggests that property taxes are amongst the most inefficient of all state taxes.
The following table summarises the above outcomes:
Policy Reform Est. Cost to Budget Benefit6 to South AustraliaEstimated Jobs Est. Inc. State Income
Abolishing Stamp Duty on Non-Residential Conveyances
$250 million (4% of total taxation)
6,900 jobs 0.9%
Abolishing Stamp Duty on new homes
$100 million (around 2% of total revenue)
670 jobs 0.1%
Land TaxRaising the base threshold from $110k to $250k and raising the maximum threshold from $1m to $2.5m with a top rate of 2.5c/$
$80 million (around 2% of total revenue)
1,650 jobs 0.23%
A flat rate of 1.7c/$ at a threshold of $250k
$72 million 2,400 jobs 0.33%
6 This benefit assumes that the taxation revenue losses can be replaced by inputs of greater federal funding, and excludes the costs of losses through alternative taxation measures adopted to replace the foregone revenue.
- 42 -
.........
IntroductionProject ObjectivesThe objectives of this project were to undertake a
Benefit/Cost analysis of abolishing Stamp Duty on Non-Residential Conveyances.
Benefit/Cost analysis of abolishing Stamp Duty on new homes. Benefit/Cost analysis of the following land tax reform scenarios:
Raising the base threshold from $110,000 to $250,000 and raising the maximum threshold from $1m to $2.5m with a top rate of 2.5c/$
A flat rate of 1.7c/$ at a threshold of $250,000.
The first and third analyses involved an assessment of the available revenue data from the State Government to identify the annual cost of each measure. They also included an assessment of the benefits including contribution to increased economic growth for the State and potential jobs created.
The second scenario focussed on the cost implications for new homes (which begin from a premise of identifying all the costs involved in developing new homes) of abolishing stamp duty, as well as the potential benefit for the State from increased construction activity to cope with increased demand of new homes.
Project IssuesThis paper is prepared with an acknowledgement that tax reform of any kind is a difficult and politically charged topic. All taxes, by definition, incorporate some form of economic distortion, so removing them will (in a comparative statics context) result in a welfare improvement – and a given tax will hurt some element of the community more than others. On the other hand though, there are benefits from the provision of public goods funded through a taxation base, and not to provide those goods would also result in a distortion. The task of government is to find the right balance in terms of aggregate level of taxation and spend, and makeup of the taxation and spend profiles.
A further complication that permeates the debate about property taxes is the confusion between a charge for a service and a tax. There has been a tendency in the property industry to argue against government taxes and then in the analysis lump in what might be considered government charges for provision of a private service. So rather than a simple question as to whether the tax is distorting, the more pertinent questions in relation to these charges is “is the charge at the right level?”, or is the method of service delivery (government based) the best method.
There is no question in the economics that taxes on the property industry result in the reduction of economic activity. A paper prepared for the UDIA estimated that:“For every million dollars of activity that is reduced in the SA development industry due to property taxes there is “lost”:
- 43 -
......... Over $300,000 of direct value added Around 4 jobs in the development industry $165,000 of wages paid to workers in the development industry $15,000 in state taxes paid”
A conjoint argument to that of impact on economic activity is the impact on housing affordability. There is of course significant debate at present about the impact of higher housing prices on housing affordability – and commitments by governments to lower this pressure. A less emotive but equally debated issue is that that affordability of industrial and commercial land has represented an economic advantage for South Australia, producing economic benefits.
Another issue in terms of scoping this project is the substantial lack of data available to estimate at any detailed level the specifics of the taxation impost.
Lastly, while taxes can be considered a negative influence on the property sector, there are also ways in which the government supports urban development – which offsets the negative impacts of the taxes themselves. Examples include:
First Home Owner Grant (FHOG) scheme – supports construction and property development outcomes.
Supports to planning systems – proper planning improves property development outcomes, and while causing some private costs (mainly financing and opportunity costs while development approvals are enacted) overall the system produces community benefits.
Expenditure on urban infrastructure – the government provides from public funding large parts of the necessary community infrastructure that would be underprovided if left to private providers.
Concessions in the property taxation system for equity purposes (eg pensioner concessions).
- 44 -
.........
Taxation Systems – the ContextThe Australian Taxation SystemAs a federation of states, a key feature of taxation and government expenditure in Australia is that taxes are collected at the Commonwealth level, but expenditure occurs at the state level. Table 1a shows that for 2007/08 the Commonwealth Government collected 82% of taxes (and the states 15%), while Table 1b indicates that State Governments were responsible for 53% of operating expenses. This disparity is of course “managed” in that the States get more income from sales of goods and services, but primarily in that the Commonwealth distributes grants to the states on a population basis (with adjustments for equalisation in issues such as own revenue raising capacity, costs of providing services, etc).
Table 1a: Taxation Profile in Australia, 2007-08$m Commonwealt
h State Local TotalTaxation revenue 273,603 49,235 9,831 332,669 82.2% 14.8% 3.0% 100%Sales of goods and services 5,777 14,056 7,443 27,276Interest income 4,153 3,856 703 8,712Current grants and subsidies 0 69,140 2,219 71,359Capital grants 0 4,772 1,543 6,315Other 6,212 13,001 3,701 22,914 Total 289,745 154,061 25,440 469,246
Source: Cat. No. 5501.0.55.001 Government Financial Estimates, Australia 2007-08
Source: Cat. No. 5501.0.55.001 Government Financial Estimates, Australia 2007-08
- 45 -
.........Table 1c below shows the amount of tax type from a national perspective as a proportion of Gross Domestic Product over time. The proportion of taxes to income paid by the community have all increased across the period 1970-2000, but since that point have stabilised somewhat, and even fallen slightly relative to GDP. The most significant increases have been with respect to company tax – consequent upon increases in corporate profitability over the period (related to the strong economy), and clearly individual income tax remains the most dominant form of taxation income for government.
Property taxes represent of the order of 2.5c per $ of Gross Domestic Product (0.4c in land tax, 0.9c in municipal rates and 1.4c in financial transactions cost - but some of this is not related to property). While this may look small, it can also be considered a significant burden on one segment of the economy - this is discussed further below. The issue that is relevant however is that, while direct property taxes have only increased in relative terms by small amounts, the taxes on transactions (which mainly represents stamp duties on conveyancing) significantly increased in relative terms.
Source: ABS Cat 5206.0 - Australian National Accounts: National Income, Expenditure and Product, Mar 2006, Table 39
- 46 -
.........Regional TaxationState Taxation in South AustraliaProperty taxes are a major source of own source funds raised by state governments. For the South Australian government, property related taxes in 2005/06 are estimated to represent 39% of the total own source tax. As illustrated in Table 2a, revenue collected from property taxes has been growing in relation to the surge in property values. In 2005/06 that growth stabilised (in response to required adjustments based on the Intergovernmental Agreement on the Reform of Commonwealth-State Financial Relations) but this is marginal in light of the previous increases. But in short the average growth rate of land tax and conveyancing stamp duties has been close to double that of other taxes over the last 6 years. The growth rates in South Australia have been marginally higher than for all State Governments in aggregate.
Table 2a: Tax Revenues for the SA Government 2001-2006 ($ million)
South Australia 2000/01 2001/02 2002/03 2003/04 2004/05 2005/06
Source: Cat. No. 5501.0.55.001 Taxation Estimates, Australia 2007-08
- 47 -
.........The impact of property taxes on the operations of the property development sector is often debated. Not only is there an issue of the affect of property taxes on housing affordability, but also it is often considered to limit reinvestment in property (in that it represents a cost that provides “no value” in the transfer of ownership). Further, the introduction of the GST required state governments to reduce a range of taxes, some of which included property based taxes.
While the issue has often been debated, as noted above, the changes that have actually occurred have in reality been marginal, and the tax take remains large. The concern about this issue seems to intensify after a period of rapid house price rises (and noting that the housing market is very cyclical) as has been the experience of the last five years. Indeed Table 2c and 2d indicate that in framing the budget for the next five years, the state government is relying heavily on increases in property tax (at about 1% above the average).
Table 2c: Forecast Property Tax Revenues for the SA Government
Table 2d: Forecast Tax Revenues for the SA Government2005-06 2006-072007-08 2008-09 2009-10 2010-11 Annual
.........Note that given recent property price increases, it would be expected that the budget estimates for property tax in 2007/08 will again be significantly under the actual outcome, as has generally been the case over recent years.
Local Government RevenuesCouncil rates are another property tax, imposed by local government, and represent the bulk of local government own source revenue. Again we can see significant growth (above average taxation). It is also noted that in South Australia local government rates represent between 70-80% of the State Government’s property tax revenue, while for Australia as a whole it is more like 50-60%.
Table 2e: Municipal Rates 2001-2006 ($ million)
Australia 2000/01 2001/02 2002/03 2003/04 2004/05 2005/06
Source: Cat. No. 5501.0.55.001 Government Financial Estimates, Australia 2007-08
A Theoretical Context – A View on TaxGiven a situation where the debate has been prolonged, and yet change has been marginal, the implication is that the issues must be complicated. The economic theory says that every tax is distorting in that it moves the market price, unless it involves correction of an externality. However, the range of public goods that society needs requires funding, and therefore general taxes in addition to correcting taxes are necessary. The general principles of economic theory are to find a combination of taxes that maximise efficiency, equity and simplicity. These characteristics are in part conflicting. For example the larger the rate at which an individual tax is collected, the less likely it will be efficient (in that it will distort the market more significantly) while it will probably make the taxation systems somewhat simpler.
- 49 -
.........Core Taxation PrinciplesWhile all taxes are by definition distorting to some degree, taxation revenue is necessary to fund public goods. Therefore the economic literature outlines the following principles for a “good” tax (which by definition means minimally distorting):
Equity in burden distribution – that is there should be both horizontal and vertical equity – in terms of those who can afford to pay the tax
Efficiency in resource use – the tax should not distort production and consumption decisions significantly – and this is best achieved when demand for product is relatively inelastic
Consistency re goals of macro policy – where macroeconomic policy is ensuring stability in business cycles and encouraging growth
Ease of administration – primarily involving minimising compliance costs or costs of administering the system
One of the most well used text books in public finance is by Musgrave and Musgrave (Public Finance in Theory and Practice) and this summarises the above into a number of characteristics which we can use to assess a given taxation measure, as follows:
Revenue yield should be adequate – that is the tax revenue should be sufficient to mean that administration burdens etc are worth it.
The distribution of the tax burden should be equitable. Everyone should be made to pay their fair share. What matters in this context is not only the impact point at which the tax imposed but its final resting place (does the tax impact the consumer and/or supplier).
Taxes should be chosen so as to minimize interference with economic decisions in otherwise efficient markets. Such interference imposes "excess burdens" which should be minimized.
The tax structure should facilitate the use of fiscal policy for stabilization of growth objectives.
The tax system should permit fair and non-arbitrary administration and should be understandable by the taxpayer.
Administration and compliance costs should be as low as is compatible with the other objectives.
Given these principles the key to a benefit/cost analysis of reducing the property tax burden is to understand how significantly the taxes sit against these elements.
Property Tax – the Theoretical ContextEven acknowledging this, when we look at property taxes generally, the issues become confused in a number of additional ways. These can be summarised as follows:
Where is a particular impost a tax and where it is a charge – there needs to be a distinction between a tax and a user-charge. This distinction is particularly difficult in the property sector – as some imposts have elements of both – ie they are seen to some degree as
- 50 -
.........being targeted taxation measures (in the same way the RAA calls for fuel taxes to be targeted at road improvement). For example, council rates are seen as providing the core funding for the services delivered to properties (rubbish collection, planning policy, etc) and therefore have an element of user pays – but also because they are set on the basis of property value rather than the cost of the service supplied, they have an element of taxation to them. What can be concluded is that when the sector lays claims of the distorting nature of property tax, it needs to be recognised that there can be some element that provides a direct benefit. This however seems to be more an issue for development fees and charges, and council rates, rather than land tax and stamp duty. Further – part of the issue is that some of this benefit has in the past been paid out of general revenues – and this has been justified on the basis of public good characteristics of particularly infrastructure – so the issue is complex in a static sense. In addition, the move towards “user pays” has inter-generational implications.
Property taxes effectively are a wealth tax – and one of the few wealth tax taxation options used in Australia. Other taxes are either on income, or on products or transactions. One notes that this introduces different problems where the tax is on-going (eg rates and land tax) versus where it is on transfer of ownership (discussed further below) where individuals are asset rich and income poor.
With respect to ongoing taxes, one element (ie land tax) is “aimed” at the “commercial sector”, including residential rental properties, but not applied to home ownership. This produces distortions where a piece of land can have alternative uses.
The overall level of taxation and impacts on competitiveness – the Commonwealth Government released its report into International Comparison of Australia’s Taxes (the Hendy Warburton review). This report (discussed in more detail below) was instigated by a widespread view that for Australian industry to remain internationally competitive, Australia must have a competitive taxation regime (relative to the role of government). Individual taxes are a part of the story, but must be considered in the context of the total tax mix. The report concludes that “Australia is a low-tax country. Australia’s overall tax burden (31.6 per cent), measured as the tax to GDP ratio, is the eighth lowest of the 30-member OECD. Australia’s mix between direct and indirect taxation is in line with other OECD countries, although the composition differs. For example, Australia’s indirect tax mix differs through a lower reliance on value-added and sales taxes, and a relatively higher reliance on property and transaction taxes - further, Australia does not levy any wealth, estate, inheritance or gift taxes”.
Literature ReviewAs noted above the topic of property tax reduction is a popular one and there has been much written on it. The following is a brief summary of the relevant literature, and the conclusions reached.
- 51 -
.........
Axing the alcabala: a program for a 21 s t century state tax system (Report by Access Economics, November 2004) This report, undertaken for the Business Coalition for Tax Reform, concludes on the basis of economic modelling, that at the time the states retained some very inefficient turnover-type taxes, namely as the most inefficient:
stamp duties on non-residential conveyancing, stamp duties on various financial instruments, stamp duties on insurance
The report also concluded that removal of these inefficient taxes could be financed partially by the extra economic activity generated as a consequence of their removal, and partly from Commonwealth distributions (related to GST revenues being significantly greater than expected).
While there has been some reform since this report was undertaken, the recommendations of the above report that reform be taken to another level, with removal of the more inefficient taxes, has not been substantially followed through
Hendy-Warburton International Comparison of Australia’s Taxes This analysis was an assessment of Australia’s relative position in taxation burden. The following chart taken from the Hendy –Warburton report summarises the study’s findings with respect to property tax. It suggests that property taxes in Australia are made up of land taxes and rates on the one hand, and stamp duties on transactions on the other. The total take from property based tax was estimated to be around 3% of GDP, with more of it weighted towards transactions (ie conveyancing) and less towards taxes on property.
Figure 1: Australia’s relative tax burden
- 52 -
.........So the outcomes can be described as:
Australia has a comparatively high reliance on property and transaction taxes relative to the OECD-30, but is broadly in line with the average of the OECD-10.
Australia’s reliance on property and transaction taxes of 3.0 per cent of GDP is the seventh highest of the OECD-30, however it is only 0.3 percentage points above the OECD-10 average (2.7 per cent).
Australia’s tax burden from taxes on immovable property is below the unweighted average of the OECD-10.
Australia has the highest financial and capital transaction tax burden of the OECD-10.
Australia’s top rate for stamp duty on conveyances (7 per cent) is the equal second highest of the OECD-10.
Of the OECD-10, Australia has the highest financial and capital transaction burden ([which] includes taxes such as stamp duties on conveyances)," the report says.”
Real Estate Institute Like the rest of the property sector, those impacted directly by the taxation regime, the Real Estate Institute has a strongly held position against property taxes (and they are particularly concerned about stamp duties and taxes on transfer of ownership). In 2000, REIA commissioned a report from Access Economics (Access Economics Report: The Economic Impact of Reducing State Taxes on Property) which the REIA concludes demonstrated a clear economic case for cutting State taxes on real estate. The key findings of the report were that:
Reducing stamp duties on conveyances of non-residential property would result in gains to economic welfare, economic activity and investment many times greater than the gains from reducing payroll taxes by the same amount, and
Reducing any of the State taxes on property individually would provide economic benefits greater than the benefits that would be achieved by reducing payroll taxes by the same amount.
The chart below, extracted from this report, shows the net benefit of reducing the revenues from a given taxation basis. Note that the modelling assumes that government expenditure is not reduced, but deficits must be funded from borrowings. The modelling indicates that a $100 million reduction in property taxes would result in a $20-30 million net gain in welfare terms ($50 million where the reduction is in non-residential property conveyancing taxes). Note that there is a significant increase in welfare from property “consumers” (ie households) and this is partly offset by losses in other sectors due to offsetting implications of the lower aggregate tax base.
- 53 -
.........Figure 2: State tax efficiency ranking
Source: Access Economics Report: The Economic Impact of Reducing State Taxes on Property
Consistent with this, Access Economics also wrote a report on taxation reform generally, summarised as follows – that Computable General Equilibrium (CGE) modelling produces an inefficiency ranking of selected remaining state business taxes as follows:
The Most Inefficient State Taxeso Stamp duties on non-residential conveyancingo Stamp duties on insuranceo Stamp duties on motor vehicleso Fire services levyo Third party insurance
Fairly Inefficient State Taxeso Stamp duty on residential conveyancingo Other stamp dutieso Land taxes
Relatively Efficient State Taxeso Payroll taxo Taxes on gambling
Property Council The Property Council of Australia (through their off-shoot, the Residential Development Council of Australia) released in 2006 a report prepared by Urbris/HD – which involved a region by region analysis.
In a press release in April 2006, the PCA summarised the outcomes of the study with the following table:
- 54 -
.........Table 3a: Property Council Estimates of Taxes on Property
To put this into context, it is worth considering the findings against the underlying cost of a house, as presented in the following table. The analysis concluded that in Adelaide, government costs amounted to around 21% of the total cost of a house. While Adelaide was the lowest proportion of the regions reviewed, the range for the majority of regions reviewed was 21%-25%. Only in Sydney were the costs a much higher proportion. There is a high correlation between total cost and government cost, because of the influence of GST collection on the calculation.
Table 3b: Property Council Estimates of Government cost in land development
Source: Government taxes, charges and compliance costs and their impact on housing affordability.
- 55 -
.........Other Research The Australian Housing and Urban Research Institute has developed a model, and their work quantifies the cost of property taxe.An example from AHURI-3M (their modelling framework) demonstrates that State and Territory Land Tax and Stamp Duty create disincentives for single property landlords who wish to add to their investments in rental housing, thereby potentially limiting the supply of dwellings in the private rental market
Another example of work that has been undertaken in this area includes a paper by C Rose of the Theoretical Research Institute - “Tax Liability and Land Value”. This paper shows that the marginal tax rate of the residential land tax introduced in NSW was at such a level to be significantly distorting and discouraging to investment in housing. The paper argues that the tax liability of a Residential Land Tax should be considered across time, in 'net present value' terms, to allow calculation of 'effective' tax rates for land both above and below the threshold. The paper illustrates that if real land values grow at just 2% the actual tax liability can easily consume over 50% of present land value, while at higher growth rates, the tax liability is more severe. The conclusion is that Land Tax thus represents a significant transition of wealth from the private sector to the state, not only for property above the threshold, but quite generally also for property below the threshold.
A Detailed Description of Property Tax ParametersThe following is a discussion of the property tax profiles in place in South Australia at the time of writing.
Land Tax:The general rule is that land tax is payable on all properties except for permanent residence.
Total Taxable Site Value Rate
Up to $110, 000 Nil$110,001 - $350,000
30 cents for each $100 or part $100 above $110,000
$350,001 - $550,000
$720 plus 70 cents for each $100 or part $100 above $350,000
$550,001 - $750,000
$2,120 plus $1.65 for each $100 or part $100 above $550,000
$750,001 - $1,000,000
$5,420 plus $2.40 for each $100 or part $100 above $750,000
Over $1,000,000 $11,420 plus $3.70 for each $100 or part $100 above $1,000,000
Exemptions are also available where land is used for the following purposes;
- 56 -
......... Land which is used wholly or mainly for primary production
purposes and primary production is the owner's main business;
Land which is used wholly or mainly for religious or educational purposes;
Land which is used for non-profit associations for the purpose of recreation for the local community, the preservation of buildings, the holding of agricultural shows or other specified purposes (charitable or sporting purposes).
Stamp Duties Stamp Duty on Transfer of Real Property (Land)All transfers of land are subject to duty on the instrument of transfer based on the value of the land (including improvements) or the consideration (including GST) whichever is greater (unless an exemption or concession applies). When a business is purchased, land may also be transferred as part of the contract for sale, or the business may at some future time purchase land - this transfer of land is also subject to duty. This payment is made by the purchaser of the property.
Where value of the property conveyed Amount of Duty
Does not exceed $12,000 $1.00 for every $100 or part of $100Exceeds $12,000 but not $30,000
$120 plus $2.00 for every $100 or part of $100 over $12,000
Exceeds $30,000 but not $50,000
$480 plus $3.00 for every $100 or part of $100 over $30,000
Exceeds $50,000 but not $100,000
$1,080 plus $3.50 for every $100 or part of $100 over $50,000
Exceeds $100,000 but not $200,000
$2,830 plus $4.00 for every $100 or part of $100 over $100,000
Exceeds $200,000 but not $250,000
$6,830 plus $4.25 for every $100 or part of $100 over $200,000
Exceeds $250,000 but not $300,000
$8,955 plus $4.75 for every $100 or part of $100 over $250,000
Exceeds $300,000 but not $500,000
$11,330 plus $5.00 for every $100 or part of $100 over $300,000
Exceeds $500,000 $21,330 plus $5.50 for every $100 or part of $100 over $500,000
- 57 -
.........Stamp Duty on MortgagesFrom 1 July 2005, all mortgages taken out for the purposes of securing a loan that has been or is to be applied for home acquisition or improvement is exempt from stamp duty.
A loan is considered to be applied for home acquisition or improvement purposes to the extent that it is used for one or more of the following purposes:
purchasing land on which residential premises have been, or are to be built, that the mortgagor (or, if there are two or more mortgagors, at least one of them) intends to occupy as his or her sole or principal place of residence; or
building, or making additions or improvements to, residential premises that the mortgagor (or, if there are two or more mortgagors, at least one of them);
occupies or intends to occupy as his or her sole or principal place of residence; or
repaying a loan previously taken out for one or more of the above purposes.
Rate of Stamp Duty - Loan not for home acquisition or improvement purposesMortgages securing an
amount Amount of Duty (from 1/7/2007)
$400 and less Exempt from dutyGreater than $400 but not more than $6,000 $10
Greater than $6,000 $10 plus $0.30 for every $100 or part of $100 over $6,000
From 1 July 2008 the rate of duty on dutiable mortgage transactions will be reduced to 15 cents per $100
Emergency Services Levy In 1999, the then existing fire services levy on insurance premiums was replaced with a new broader based emergency services levy on property. This levy funds the provision of emergency services in South Australia and applies to all fixed property and some mobile property.
The levy is charged with a fixed component ($50), and a variable component with a rate of 1.271¢ per $100 of capital value (with adjustment factors for areas and land use). Commercial land has an adjustment factor over double that of residential, and industrial land over triple – meaning business (non-farm) properties pay a much greater amount relative to underlying value than do residential.
Other
Water Supply ChargesThe price for water mains supplied water is the same across the whole state.
- 58 -
.........
Water pricing for residential customers (houses, attached residences and vacant residential land) is made up of an annual charge for supplying the service and a stepped pricing system for water use.
The residential water charges set by Government for 2007/2008 are: A quarterly access charge of $39.35 50 cents per kilolitre (kL) for the first 125 kL used in the year $1.16 per kL for residential consumption above 125 kL over the year
Commercial, industrial and other property have the same parameters for use, and an annual supply charge based on property value - 0.09 cents per $100 of property value subject to a minimum of $174.60 (or quarterly 0.0225% of property value with a minimum of $43.65)
It is of course expected that charges will increase given water access and drought issues (eg the potential for a desalinisation plant).
Council RatesIn South Australia, Council Rates are a form of property taxation and property values play an important part in determining how much each individual rate payer contributes. As it is a system of taxation, the rates paid may not directly relate to the services used by each rate payer. The higher the value of the property, the higher the amount to be paid in the form of rates (while the amount funds services, if it was a use charge the value would be linked to the service, not the property value). The amount paid is around 0.3-0.5 cents in the dollar of capital value, depending on the council (and some councils charge on land value rather than capital). This produces some equity issues across council borders.
Tax Comparisons
Bracket Creep - Tax implications over timeAs noted above, the tax rates on property are stepped, with the marginal tax rate increasing for increasing values. As in the case of personal income tax, this produces a situation of bracket creep in property taxation, unless there is specific adjustment. As inflation pushes property prices higher, there will be a real increase in taxation revenue generated as properties move into higher brackets. This is more an issue for small businesses and residences, but where it occurs is clearly is an issue of taxation by stealth.
- 59 -
.........In something of a perverse way, the state government has recognised that property price increases and bracket creep have provided an inordinate stimulus to property tax increases. For example the 2004/05 Budget Statement states that “Growth in land values combined with the progressive land tax structure is expected to produce very strong growth in land tax revenues in 2004-05. (p 3.14)
Further, in the media the following statement was made “Premier Mike Rann said the Government had been well aware of the "disproportionate spike" in land tax bills brought about by the property boom. "I am seldom this political, but the last time land tax was raised was by the Liberals in 1994," he said. "The last time land tax was cut was by the ALP in 1990." Advertiser, 8th Feb 2005.
As a consequence of these changes, respective state governments introduced changes to the tax schedules:
Stamp duty schedules were changed in 99/00 and then again in 2002/03, involving a reduction in stamp duty rates at higher property values.
Land tax rates were changed in 2005/06, again reducing higher tax rates at higher value.
The following chart indicates the changes in median house prices over the last 8 years. The median price of properties has increased from around $120,000 to of the order of $310,000, an increase of around 150%. Inflation over that time increased the value of a dollar by around 30%.
Figure 3a: Median House Prices in South Australia
Source: Real Estate Institute
Based on the tax rates for given years, to the stamp duty paid on the sale of a house commanding the median price would have increased from around $3,800 on June 2000 prices, to around $11,800 on December 2007 prices – or an increase of 209%, or a real increase of around 155%.
The real value in June 2007 prices of stamp duty on a median priced dwelling across the period is illustrated below. The significant increases in
- 60 -
.........2005 and in December 2007 are related not only to price increases, but to the impact of moving into the next tax bracket (ie bracket creep).
Figure3b: Estimates of Stamp Duty on Property Sold at Median Price in South Australia ($ 2007)
Figure 3c illustrates that the same issues apply with land taxes – real prices of new land increased substantially early in the early 2000’s but have steadied since 2005. While real prices have steadied, nominal prices will have increases with inflation and given that he latest modification to land tax rates occurred in 2005, and it was some time before that date that they were adjusted, the combination of bracket creep and nominal price rises would mean that those required to pay land tax will pay much more today in real terms than 5-10 years ago.
Figure 3c: New Land Prices
Source: Housing Industry Prospects Forum, Sept 2007
Interstate CompetitivenessThe state government makes strong claims about state competiveness, lauding as an advantage of living and investing in South Australia. The Government’s own web site claims that “South Australia is highly affordable. The State offers great economic value and is one of the easiest
- 61 -
.........and most cost-competitive locations in which to set up a business”, and specifically notes that cost advantages in land is an attraction in that South Australia has “Some of the lowest rents in Australia – including prime office, commercial and industrial property, and factory space”, and “competitively priced industrial land – among the lowest cost in the Asia-Pacific”.
Given the government recognises the argument, it is clear that this competitive position would be even further enhanced if the state had competitive taxation regimes. Table 3c indicates that South Australia’s tax position in land tax is clearly uncompetitive, even after allowing for differences in underlying prices, particularly in lower price brackets.
Table 3c: LAND TAX FOR INDIVIDUALS ACROSS AUSTRALIAQld NSW Vic ACT SA Tas WA NTMinimum threshold $600,000 $352,000 $225,000 $0 $110,000 $25,000 $250,000
Maximum rate 1.25% 1.60% 2.50% 1.40% 3.70% 2.50% 2.30%
Land tax payable$300,000 $0 $0 $400 $4,200 $570 $1,563 $75$600,000 $1,200 $4,316 $1,180 $4,549 $2,945 $6,837.50 1,155$900,000 $4,425 $9,416 $2,680 $8,749 $9,020 $13,587.50 $2,295Note: The above examples do not take into account any variables such as partial exemptions,discounts and adjustments and does not include the Qld rate for companies and trusteesUsers' Guide to Land Tax: state by state, by Bob Wilson, 15th October 2007
What this demonstrates is that for a commercial property with a value of $25 million, the annual land tax liability would be $899,420 – this is $283,332 more per year than the same value building in Tasmania and over $500,000 more per year than in Queensland.
The situation is similar in the case of stamp duty. So for example in 2005/06 sale of a $300,000 property in South Australia would accrue stamp duty of $11,330 compared to $8,990 in NSW, and $8,975 in Queensland. Victoria is more expensive. Since that time other states have made adjustments which have worsened this comparison. Table 3d outlines the comparative taxes for the major states.
- 62 -
.........Table 3d: STAMP DUTIES FOR CONVEYANCING ACROSS AUSTRALIA
Source: NSW Treasury, Interstate Comparison of Taxes, 2005-06
In short, it is clear that the advantage in cheaper land prices are somewhat offset by the a less competitive tax regime for ownership and transfer. The argument could be extended to say that the benefits of a more cost competitive economy could be enhanced if the non-competitive property tax regime was brought under control.
- 63 -
.........
A Benefit Cost AssessmentA Direct Cost Benefit PerspectiveIn a simple context the impact of (any) tax can be described as follows:
Figure 4.1 Welfare Impacts of a Tax Regime
q’ q
S
S+t
D
Q
$
p*
p’
c'
In a benefit cost context the diagram illustrates that because of the tax, the consumers of the taxed product lose the area in yellow, the suppliers of the taxed product lose the area in red, the government gains the striped area in tax revenue, and the net loss to society (deadweight loss) is the non-striped area. The question of who wins and who loses and by how much is dependent on the demand and supply elasticities (ie the slopes and shapes of the demand and supply curves). Therefore the general conclusion is that:
The more elastic the demand (and/or supply) the greater the loss to society overall – ie the deadweight loss.
The less elastic is demand, the more loss occurs to consumers and less to suppliers. In the case of stamp duty the balance of incidence is between the property purchaser versus the property seller.
The less elastic the supply, the more the loss occurs to suppliers
There is little concrete evidence on elasticity of demand and supply in property markets.
However one thing is clear. One of the reasons why stamp duty is generally considered more inefficient in the literature is because the transaction itself is more elastic (particularly where it involves a change over of property). In the case of investment in property, investors face a lot of choice for alternative investments and choose between property markets and say share or bond markets – so the relativities of total transaction costs (made up of stamp duty and fees) will impact on the decision. There is no stamp duty on changing share ownership, and over time fees have been coming down as financial markets have been getting more efficient. For owner occupiers over their life cycle their housing needs change – as size of family changes, stage of life etc, but one would expect small differences in the financial decision framework to have
- 64 -
.........significant effects on this choice. Additionally, the stamp duty rate is in relative terms a higher proportion of value and secondly, is a high rate relative to the changeover price rather than the absolute price.
Against all of this it is also necessary to consider that the implications are different for different property markets - both in terms of direct and indirect impacts. There is no public or published data on this so the starting point for the analysis is to identify the taxation base – which requires knowing how many “transactions” occur. Attachment A includes the detailed data and modelling context. The basic approach is to:
Indicatively estimate the property data base - numbers within various price ranges (note at the present time this is based on a rough estimates of count, mean value and std deviation) to give an indicative frequency distribution of property values.
Apply the tax rates. Consolidate this against the aggregate taxation revenues.
Calculating the impact of changing the property tax profile requires knowing the tax characteristics (as described above) and also knowing the distribution of property values and distribution of sales prices. This information should be available from the Land Series Group data base, but a number of enquiries/requests revealed that the data is not made available in this form. Neither could we trace any other source of consistent and comprehensive data that would reliably indicate the value and sales distributions as above. Therefore we have modelled a result, based on assumptions and limited information, with an over-arching constraint that in 2007, land tax is estimated to be approximately $330 million, while stamp duties on property conveyancing are estimated at almost $700 million. Being able to improve the data set would significantly enhance this analysis.
The modelling is based on assuming the following property market characteristics. Table 4.1 illustrates the assumptions made about number, mean and standard deviation across various markets, and then the market is assumed to be normally distributed7 (though not possible to go below a minimum value of around $100,000 in any market).
7 This normal distribution is an unfortunate simplification, in that it is understood that the property market is heavily right skewed – with higher than predicted numbers in the upper end of the market and cut off points that represent minimum values. However with the non-availability of actual data this initial analysis is limited to this perspective.
- 65 -
.........Table 4.1: Assumed key distributional characteristics of property markets Number of Properties Sales of Properties
Count Mean Std Dev Count MeanStd Dev
Residential Properties Vacant Land 14000 150000 50000 4000 135000 45000 Improved Properties Unimproved value 545455 160000 53333 32000 144000 48000 Improved value 545455 280000 93333 32000 252000 84000Industrial Properties Vacant Land 2000 250000 125000 200 250000 125000 Improved Properties Unimproved value 25000 375000 187500 1250 375000 187500 Improved value 25000 875000 875000 1250 875000 437500Commercial/Office Properties Vacant Land 1000 300000 150000 100 300000 150000 Improved Properties Unimproved value 20000 450000 225000 1000 450000 225000 Improved value 20000 1050000 2100000 1000 1050000 525000Retail Properties Vacant Land 1000 500000 250000 100 500000 250000 Improved Properties Unimproved value 20000 750000 375000 1000 750000 375000 Improved value 20000 1750000 875000 1000 1750000 875000Agricultural Properties Vacant Land 1000 300000 150000 100 300000 150000 Improved Properties Unimproved value 15000 250000 250000 750 250000 125000 Improved value 15000 350000 350000 750 350000 175000
Other sources of information to help inform the values in this table include:
Information from the Housing Industry Prospect Forum reports and volumes of house sales and house construction, along with average prices.
Information provided by industry representatives on prices and sales – however it is noted this is very indicative because of small sample issues.
Information from the ABS on the number and valuing of building work. This however includes renovation projects, and additionally does not include the underlying land value.
This information has been reviewed to inform the above parameters. However given the limitations the parameters again can only be taken as
- 66 -
.........indicative. This analysis would be improved greatly with better data through the property valuation system.
Table 4b indicates the results of this distribution of values, modelled against the current tax regime – to give estimates of tax revenues from land tax and stamp duties.
As can be seen, with this distribution, the land tax estimates are slightly higher than actual and the stamp duty slightly under, but they are of a similar order of magnitude.
Benefit/cost analysis of abolishing Stamp Duty on Non-Residential ConveyancesThe first objective is to consider the benefit cost outcomes associated with abolishing stamp duty on non - residential conveyances. The outcome of this change is modelled as follows, ignoring the elasticity effect.
Table 4bModelled Outcome ALTERNATIVE 1 No Stamp Duty on Non Residential Conveyances
Before Change After Change Difference ($ ) Difference (%)
Therefore business property purchasers and renters will be better off by $246 million, while tax revenue will be reduced by $246 million, which represents a 24% decline in property revenue. Under this scenario the residential property market is not directly affected, and all the reduction is a benefit to the commercial and business market.
- 67 -
.........However, in considering this estimate it is noted that:
Given the elasticity impacts discussed earlier, we note there will be an expansion in activity in the market, which results in an offsetting increase in revenues.
There will be a net gain to the community associated with this outcome, and
Benefit/cost analysis of abolishing Stamp Duty on new homesTable 4c below shows the impact of a policy shift in terms of abolishing stamp duty on new homes. This would result in a modelled reduction in tax revenue of $95 million, or 9% of overall revenues. The impact is entirely on the housing market, with revenues paid by that sector falling an estimated 22% (impacting the new house market).
Table 4cModelled Outcome ALTERNATIVE 2 No stamp duty on new dwellings
Before Change After Change Difference ($ ) Difference (%)
Benefit/cost analysis of land tax reform scenarios:Raising the base threshold from $110,000 to $250,000 and raising the maximum threshold from $1m to $2.5m with a top rate of 2.5c/$ is estimated to cause a revenue decline of $76 million, or 7% of total revenue. The impact is spread across both the residential and commercial sector, with the residential rental sector being the most significantly effected.
Table 4dModelled Outcome ALTERNATIVE 3 Changed land tax
Before Change After Change Difference ($ ) Difference (%)
A flat rate of 1.7c/$ at a threshold of $250,000Table 4e shows the impact of introducing this flat land tax level. Overall revenues are estimated as falling by $72 million, or 7% of total revenue. The benefits are spread across all sectors, but with the current modelling the impact is most significant for higher value properties – so in industrial and commercial.
- 68 -
.........Table 4eModelled Outcome ALTERNATIVE 4 Changed land tax - flat 1.7c
Before Change After Change Difference ($ ) Difference (%)
Again it is noted that this is a partial analysis, in that these revenue losses will be offset by increased activity. So for example the removal of stamp duty on new residential will result in increased new-build activity. It should be recognised that this in itself may create some distortions in the relationship between the established market and the new market.
A Broader Benefit Cost Perspective The above estimates are modelled estimates of the benefits to the property sector – in terms of the reduced tax they have to pay. This is a very partial view and the community interest will be in the broader implications of this change. That is, the above represents outcomes from a direct and tangible benefit context for a select group. Indirect and intangible outcomes also need to be considered. The major source of indirect impact is in industry competitiveness and therefore economic activity:
In the case of stamp duty on owner occupied residences, the tax represents a decline in the real income of the new owner and the seller (while the payment is made by the purchaser, the incidence depends on what the relative elasticities are) over what would otherwise be the case – this leaves them with less to spend on other activities or to create in real value by spending more on the property itself, or in the longer term will result in higher labour costs for doing business.
In the case of land tax and stamp duty on rental residences, the tax represents a decline in real income for renters, and a decline in the return earned by renters – resulting in a shortage of supply from the perspective of the market (the balance between these two factors is dependent on elasticities, as noted above.
In the case of land tax and stamp duty on commercial property, the tax represents an increased cost of doing business, and therefore produces an decrease in competitiveness.
That these outcomes have a broader impact on competitiveness and activity is undisputable. A complete study of the issue would require application of an advanced model to cover all the nuisances and issues – such as a CGE model like the Monash Model (eg the MMRF model would identify regional and national impacts of economic shocks such as this. Further it would allow the consideration of relative outcomes under a balanced budget versus a non-balanced budget situation – presenting some bigger picture options). However this is outside of the scope of this analysis, and therefore the approach adopted is to use a simplistic modelling framework to estimate the benefits. This should be considered indicative only. Further, it considers the economic benefits of
- 69 -
.........reducing property taxes in isolation, and does not consider the implications of alternative taxes to balance the budget for a given level of spend on the one hand, or reduced government expenditure to match the tax revenue reduction on the other hand.
Given the deficiencies in data availability to accurately model the taxation revenue shifts themselves, the extra detail and rigour in using more advanced modelling techniques would be premature.Using some simple assumptions and a basic modelling approach, it is indicatively estimated that:
A $100 million decline in tax payments on residential property8 will create of the order of 700 jobs in the state and increase real incomes (GDP) by 0.12% through the extra real income effect for households
8 It is assumed that the bulk of the savings will be passed on to the users of housing directly, or alternatively extra profitability to developers will result in incomes that are spent. Therefore the savings provide a stimulus to real consumer demand, resulting in $100 million additional consumption expenditure. That additional spend is assumed to be distributed over the average consumption vector (as derived from the state input output tables – as reported in Quantifying the Economic Contribution of Regional South Australia, A report prepared for Regional Communities Consultative Council, Local Government Association of SA, Regional Development SA, EconSearch, 2005. This is then adjusted by the consumption multiplier (also derived from the input output tables) for regional income and employment. The various changes modelled may have different effects on the average consumption vector, which will create other changes in the market. So for example, the reduction of stamp duties on new homes only (option 2) will result in a “swing:” in the consumption vector to housing sector. These nuances have not been modelled at this stage, but would not particularly change the overall magnitude.
- 70 -
......... A $100 million decline in tax payments on commercial property will
create9 of the order of 2,800 jobs in the state and increase real incomes by 0.38% through the competitiveness effects for businesses.
Therefore for the policy changes assessed in this paper: Abolishing Stamp Duty on Non-Residential Conveyances create an
estimated 6,900 jobs within the state, and increase state incomes in real terms by 0.9%
Abolishing Stamp Duty on new homes would create an estimated 670 jobs within the state, and increase state incomes in real terms by 0.1%
In terms of land tax: o Raising the base threshold from $110,000 to $250,000 and
raising the maximum threshold from $1m to $2.5m with a top rate of 2.5c/$ would create an estimated 1,650 jobs within the state, and increase state incomes in real terms by 0.23%
o A flat rate of 1.7c/$ at a threshold of $250,000 would create an estimated 2,400 jobs within the state, and increase state incomes in real terms by 0.33%
9 Again it is assumed that the bulk of the savings will be passed on to the users of the commercial property either directly or indirectly in the long run. This saving will therefore in short term reflect in increased profitability, but in the long run will result increased competitiveness. As such it will encourage an expansion in production, and based on the literature a supply elasticity (or export demand elasticity) of 5 is assumed. The supply elasticity estimates are broad level assumptions with evidence from other research. For example Stephen Tokarick , The World Economy, April 2005, Who Bears the Cost of Agricultural Support in OECD Countries? noted that “the values used for the export supply elasticity ranged from 1.5 to 10, depending on the product”. Balassa, in The Overvaluation of the Dollar, American Economic Review, March 1965 provide estimates of the supply elasticity of exports range from 1.25 to 4.5. We note that this study again is across all commodities, and that since 1965, with increased globalisation and increased capital intensity, one would have expected the elasticity to increased considerably. These studies also present export elasticities for overseas exports, and one would expect that exports from the region would be more elastic. It is assumed that this expansion is effective for 50% of the business community, and to that production impact, an average multiplier derived from the input output tables is applied.
- 71 -
.........
ConclusionsThis paper presents a discussion and indicative analysis of the benefits to the state of reducing the reliance on property tax as a means of state revenues. The following are the key conclusions of this discussion and analysis:
All the evidence suggests that there is a vital need for reform – logic and research demonstrate that property tax, and particularly stamp duties are highly inefficienct and create significant distortions. There are substantial impacts on business competitiveness, and there are also equity implications, in terms of impact on housing affordability. Lastly it is clear that the nominal and real property price increases over recent years have substantially exacerbated the problem via bracket creep.
It is also clear that it is imperative that the Commonwealth Government be part of the reform. The evidence suggests that they are sitting in a privileged financial position, while states bear the brunt of the financial burden on the public purse. The State’s have limited opportunities for alternative sources of revenue, and therefore need support in making this necessary change.
While there is a substantial reduction in direct revenues, there are offsetting indirect benefits that will help ameliorate the issue. That is, there will be increases in economic activity that will benefit the community, and resulting increased taxes from other sources