103
Precast Concrete Bridge Barriers for Accelerated Bridge Construction Final Report October 2018 Sponsored by Accelerated Bridge Construction University Transportation Center

Precast Concrete Bridge Barriers for Accelerated Bridge ConstructionFinal ReportOctober 2018
Sponsored byAccelerated Bridge Construction University Transportation Center

About the ABC-UTC The Accelerated Bridge Construction University Transportation Center (ABC-UTC) is a Tier 1 UTC sponsored by the U.S. Department of Transportation Office of the Assistant Secretary for Research and Technology (USDOT/OST-R). The mission of ABC-UTC is to reduce the societal costs of bridge construction by reducing the duration of work zones, focusing special attention on preservation, service life, construction costs, education of the profession, and development of a next-generation workforce fully equipped with ABC knowledge.
About the BECThe mission of the Bridge Engineering Center (BEC), which is part of the Institute for Transportation (InTrans) at Iowa State University, is to conduct research on bridge technologies to help bridge designers/owners design, build, and maintain long-lasting bridges. The mission of InTrans is to develop and implement innovative methods, materials, and technologies for improving transportation efficiency, safety, reliability, and sustainability while improving the learning environment of students, faculty, and staff in transportation-related fields.
ISU Non-Discrimination Statement Iowa State University does not discriminate on the basis of race, color, age, ethnicity, religion, national origin, pregnancy, sexual orientation, gender identity, genetic information, sex, marital status, disability, or status as a U.S. veteran. Inquiries regarding non-discrimination policies may be directed to Office of Equal Opportunity, 3410 Beardshear Hall, 515 Morrill Road, Ames, Iowa 50011, Tel. 515-294-7612, Hotline: 515-294-1222, email [email protected].
NoticeThe contents of this report reflect the views of the authors, who are responsible for the facts and the accuracy of the information presented herein. The opinions, findings and conclusions expressed in this publication are those of the authors and not necessarily those of the sponsors.
This document is disseminated under the sponsorship of the U.S. DOT UTC program in the interest of information exchange. The U.S. Government assumes no liability for the use of the information contained in this document. This report does not constitute a standard, specification, or regulation.
The U.S. Government does not endorse products or manufacturers. If trademarks or manufacturers’ names appear in this report, it is only because they are considered essential to the objective of the document.
Quality Assurance StatementThe Federal Highway Administration (FHWA) provides high-quality information to serve Government, industry, and the public in a manner that promotes public understanding. Standards and policies are used to ensure and maximize the quality, objectivity, utility, and integrity of its information. The FHWA periodically reviews quality issues and adjusts its programs and processes to ensure continuous quality improvement.
Technical Report Documentation Page
1. Report No. 2. Government Accession No. 3. Recipient’s Catalog No.
4. Title and Subtitle 5. Report Date
Precast Concrete Bridge Barriers for Accelerated Bridge Construction October 2018
6. Performing Organization Code
7. Authors 8. Performing Organization Report No.
Ashley Ecklund and Sri Sritharan
9. Performing Organization Name and Address 10. Work Unit No. (TRAIS)
Bridge Engineering Center
Iowa State University
2711 South Loop Drive, Suite 4700
Ames, IA 50010-8664
11. Contract or Grant No.
12. Sponsoring Organization Name and Address 13. Type of Report and Period Covered
Accelerated Bridge Construction
University Transportation Center
Florida International University
10555 W. Flagler Street, EC 3680
Miami, FL 33174
U.S. Department of Transportation
Office of the Assistant Secretary for
Research and Technology
1200 New Jersey Avenue, SE
Washington, DC 20590
Final Report
14. Sponsoring Agency Code
15. Supplementary Notes
Visit www.intrans.iastate.edu for color pdfs of this and other research reports from the Bridge Engineering Center at Iowa State
University.
16. Abstract
Many transportation organizations have embraced Accelerated Bridge Construction (ABC) to reduce both the traffic impacts and
societal costs. One of the most common means to achieve ABC is to utilize prefabricated elements that are connected on site to
construct a bridge. ABC will not be effective if the barrier requires cast-in-place construction. The purpose of this report is to
present details of a precast barrier and two connection alternatives between the deck and precast barriers. In addition, a new
connection between two adjacent prefabricated barriers was presented. All three connections were tested using full-scale precast
barriers and a video summarizing the test can be found at https://youtu.be/up6sMEeqfaU.
One barrier-to-deck connection used inclined reinforcing bars with threaded ends that were connected to bar splicers embedded in
the bridge deck. The other barrier-to-deck connection used U-shaped bars that were inserted into the barrier from the underside of
the bridge deck overhang. Factors that were considered when designing the connections were minimal damage to deck, easy
replacement of barrier, constructability, durability, and cost.
The barrier-to-barrier connection utilized headed reinforcement in the longitudinal and transverse directions. The connections
were designed to meet TL-4 loads as per the Manual for Assessing Safety Hardware (MASH) and Load and Resistance Factor
Design (LRFD) Bridge Design Specifications.
This report presents results from various tests and shows that all proposed connections are viable for accelerated construction of
concrete barriers, although some refinement to the tested details will be needed.
17. Key Words 18. Distribution Statement
ABC—accelerated bridge construction—barrier-to- barrier connections—
barrier-to-deck connections—concrete bridge barriers—precast concrete
barriers
No restrictions.
19. Security Classification (of this
report)
20. Security Classification (of this
page)
21. No. of Pages 22. Price
Unclassified. Unclassified. 101 NA
Form DOT F 1700.7 (8-72) Reproduction of completed page authorized

PRECAST CONCRETE BRIDGE BARRIERS FOR
ACCELERATED BRIDGE CONSTRUCTION
Final Report
October 2018
Principal Investigator
Terry Wipf, Professor
Civil, Construction, and Environmental Engineering, Iowa State University
Co-Principal Investigator
Sri Sritharan, Professor
Civil, Construction, and Environmental Engineering, Iowa State University
Graduate Research Assistant
Ashley Ecklund
Authors
Ashley Ecklund and Sri Sritharan
Sponsored by
Accelerated Bridge Construction University Transportation Center and
U.S. Department of Transportation
Office of the Assistant Secretary for Research and Technology
A report from
Bridge Engineering Center
Institute for Transportation
Iowa State University
2711 South Loop Drive, Suite 4700
Ames, IA 50010-8664
Phone: 515-294-8103 / Fax: 515-294-0467
www.intrans.iastate.edu


v
TABLE OF CONTENTS
ACKNOWLEDGMENTS ............................................................................................................. xi
INTRODUCTION ...........................................................................................................................1
Overview ..............................................................................................................................1 Accelerated Bridge Construction .........................................................................................1 Current Practices ..................................................................................................................2 Scope of Research ................................................................................................................5 Research Objectives .............................................................................................................5
Report Layout ......................................................................................................................6
LITERATURE REVIEW ................................................................................................................7
Introduction ..........................................................................................................................7
Design of Barriers ................................................................................................................7 Experimental Evaluation ....................................................................................................11 Practice of State DOTs.......................................................................................................11
Precast Barriers ..................................................................................................................12
EXPERIMENTAL PLAN .............................................................................................................26
Introduction ........................................................................................................................26
Guiding Parameters ............................................................................................................26 Barrier-to-Deck Connections .............................................................................................26
Barrier-to-Barrier Connections ..........................................................................................28 Deck Design .......................................................................................................................29
CONSTRUCTION OF TEST UNIT .............................................................................................31
Introduction ........................................................................................................................31
Precast Barrier Construction ..............................................................................................31 Bridge Deck Construction..................................................................................................33 Assembly and Grouting .....................................................................................................38
Instrumentation ..................................................................................................................43 Load Application ...............................................................................................................46
Material Properties .............................................................................................................48
TESTING AND RESULTS ...........................................................................................................50
Introduction ........................................................................................................................50 Test 1 Observations: PBI Middle .......................................................................................52
Test 1 Results: PBI Middle ................................................................................................54 Test 2 Observations: PBU Middle .....................................................................................58 Test 2 Results: PBU Middle ..............................................................................................59
Test 3 Observations: At Barrier-to-Barrier Connection.....................................................64 Test 3 Results: At Barrier-to-Barrier Connection ..............................................................65 Test 4 Observations: Off-Center, PBI Side........................................................................69 Test 4 Results: Off-Center, PBI Side .................................................................................71 Test 5 Observations: End of PBI .......................................................................................75 Test 5 Results: End of PBI .................................................................................................79

vi
Test 6 Observations: End of PBU ......................................................................................81 Test 6 Results: End of PBU ...............................................................................................83
SUMMARY AND CONCLUSIONS ............................................................................................86
Summary ............................................................................................................................86 Conclusions ........................................................................................................................86
REFERENCES ..............................................................................................................................89

vii
LIST OF FIGURES
Figure 1.1. Cast-in-place barrier requiring maintenance .................................................................1 Figure 1.2. Prefabricated bridge element .........................................................................................2
Figure 1.3. F-shaped concrete barrier and reinforcement details .....................................................3 Figure 1.4. Rockridge Road bridge with exposed barrier connection reinforcement ......................4 Figure 1.5. Rockridge Road barrier after adding additional reinforcing .........................................4 Figure 2.1. Bridge barrier design force locations as suggested in AASHTO LRFD
specifications ...................................................................................................................9
Figure 2.2. Yield line pattern used for designing concrete barrier under load, Ft ...........................9 Figure 2.3. Commonly used concrete bridge barrier profile shapes ..............................................13 Figure 2.4. Through-deck bolting detail developed by Florida DOT ............................................14 Figure 2.5. Adhesive-bonded anchor detail ...................................................................................14
Figure 2.6. Ryerson barrier-to-deck slab connection details .........................................................15 Figure 2.7. Proposed barrier-to-barrier connection details by Ryerson University .......................16
Figure 2.8. Barrier load application ...............................................................................................16 Figure 2.9. Clampcrete barrier system ...........................................................................................17 Figure 2.10. X-bolt connection concept .........................................................................................17
Figure 2.11. X-bolt test specimen ..................................................................................................18 Figure 2.12. Damage to 10-ft long prefabricated barrier with X-bolt connections .......................18
Figure 2.13. Damage to 30-ft long precast barrier with X-bolt connections .................................19 Figure 2.14. Impact bogie vehicle..................................................................................................19 Figure 2.15. Plan view and elevation view of I-shaped rail connection between barriers ............20
Figure 2.16. A plan view of MWRSF I-shaped rail connection ....................................................20 Figure 2.17. Failed MWRSF I-shaped rail connection ..................................................................21
Figure 2.18. Side bolts and shear tube connection prior to testing ................................................21 Figure 2.19. Side bolt and shear tube connection failure ...............................................................22
Figure 2.20. Plan view and elevation view of I-shaped rail connection improvements ................22 Figure 2.21. Redesign I-shaped rail connection after bogie testing ...............................................23
Figure 2.22. Plan view and elevation view of alternate modifications to the I-shaped rail
connection .....................................................................................................................23 Figure 2.23. Alternate redesign I-shaped rail connection failure ...................................................24
Figure 2.24. Side bolts and shear tube connection improvements .................................................24 Figure 2.25. Side bolt and shear tube connection after testing ......................................................25
Figure 3.1. Inclined bar connection between precast barrier and deck ..........................................27 Figure 3.2. U-bar connection between precast barrier and deck....................................................28 Figure 3.3. Plan view of the barrier-to-barrier connection ............................................................29 Figure 3.4. End of bridge deck reinforcement (7-ft segment analysis) .........................................30
Figure 3.5. Bridge deck reinforcement (10.5-ft segment analysis) ................................................30 Figure 3.6. Moment curvature responses of different deck segments ...........................................30 Figure 4.1. PBI and PBU at the CoreSlab facility prior to the concrete pour ................................31
Figure 4.2. Longitudinal double-headed ties used for barrier-to-barrier connection .....................32 Figure 4.3. Transverse double-headed ties used for barrier-to-barrier connection ........................32 Figure 4.4. End of precast barriers with longitudinal double-headed ties and receiving
pocket ............................................................................................................................33 Figure 4.5. Bridge deck supporting beams with formwork ...........................................................34
viii
Figure 4.6. Inclined bar connection in deck ...................................................................................34 Figure 4.7. Connected inclined receiving end piece to the deck formwork ..................................35 Figure 4.8. Deck block outs to facilitate U-bar installation ...........................................................35
Figure 4.9. Bridge deck reinforcement ..........................................................................................36 Figure 4.10. Installed PBI connection sleeve with deck reinforcement ........................................36 Figure 4.11. U-bar access blocks outs with terminated bottom deck steel and top deck
steel positioned to be within a U-bar connection ..........................................................37 Figure 4.12. Bridge deck concrete pour .........................................................................................37
Figure 4.13. Threaded end of inclined reinforcement....................................................................38 Figure 4.14. Inclined reinforcing bars connected to bridge deck before placement of
precast barrier ................................................................................................................38 Figure 4.15. Barrier-to-barrier connection .....................................................................................39 Figure 4.16. Pockets used to install transverse barrier-to-barrier connection ................................39
Figure 4.17. Reinforcing steel bar chairs for #5 bars .....................................................................40 Figure 4.18. Reinforcing steel bar chairs for #7 bars .....................................................................40
Figure 4.19. Insertion of U-bars .....................................................................................................40 Figure 4.20. Sealed U-bar pocket for grouting ..............................................................................41
Figure 4.21. Foam added to grout pad to minimize damage cover concrete .................................41 Figure 4.22. Grouting of U-bar pockets .........................................................................................42
Figure 4.23. Finished U-bar grout pocket ......................................................................................42 Figure 4.24. Completed barrier installation ...................................................................................42 Figure 4.25. Location of strain gauges in precast barrier reinforcement and bottom deck
reinforcement ................................................................................................................43 Figure 4.26. Location of strain gauges in barrier connection reinforcement and top deck
reinforcement ................................................................................................................44
Figure 4.27. Location of string pots and LVDTs on front side of testing unit ..............................45
Figure 4.28. Location of string pots and LVDTs on backside of testing unit ................................46 Figure 4.29. 3D model of identifying the testing sequence and load application areas ................46
Figure 4.30. Laboratory test set-up ................................................................................................47 Figure 4.31. Test set-up for Test 1 .................................................................................................48 Figure 5.1. Continuous test plot of top of barrier deflection for Tests 1–4 ...................................50
Figure 5.2. Brace beam ..................................................................................................................51 Figure 5.3. Top of barrier deflection for Tests 5 and 6 ..................................................................51
Figure 5.4. Test 1: Formation of flexural cracks on the deck overhang ........................................52 Figure 5.5. Test 1 (PBI middle) barrier cracks ..............................................................................53 Figure 5.6. Formation of crack on backside of test unit during Test 1 ..........................................53 Figure 5.7. Force displacement for Test 1 – PBI ...........................................................................54 Figure 5.8. Top barrier deflection profiles of PBI during Test 1 ...................................................55
Figure 5.9. Strain profiles of the inclined reinforcement barrier connection bars at the
deck interface during Test 1 ..........................................................................................56
Figure 5.10. Strain profiles of the deck reinforcement at the front barrier interface during
Test 1 .............................................................................................................................57 Figure 5.11. Components of the measured PBI deflections...........................................................58 Figure 5.12. Crack at the barrier-to-deck interface in PBU during Test 2 .....................................59 Figure 5.13. Lateral versus force displacement obtained for Test 2 – PBU ..................................60 Figure 5.14. Lateral top deflection of PBU during Test 2 .............................................................61

ix
Figure 5.15. Strain in the U-bar at the deck to barrier interface during Test 2 ..............................62 Figure 5.16. Strain profiles of the deck reinforcement at the front barrier interface during
Test 2 .............................................................................................................................63
Figure 5.17. Deflection of components..........................................................................................64 Figure 5.18. Diagonal cracks developed on PBI during Test 3 .....................................................65 Figure 5.19. Force-displacement response obtained for Test 3 .....................................................66 Figure 5.20. Top barrier deflection profiles established from Test 3 data .....................................66 Figure 5.21. Strain in barrier-to-deck connection interface during Test 3 .....................................67
Figure 5.22. Strain in the center of the longitudinal double-headed ties in barrier-to-
barrier connection during Test 3 ...................................................................................68 Figure 5.23. Strain in transverse double-headed ties placed near the barrier-to-barrier
connection during Test 3 ...............................................................................................69 Figure 5.24. Beam used to brace PBU with respect to the deck during Test 4 ..............................69
Figure 5.25. Cracking under the loading beam on PBI during Test 4 ...........................................70 Figure 5.26. Failure pattern of barrier-to-barrier connection at the end of Test 4 .........................71
Figure 5.27. Force-displacement response obtained for Test 4 .....................................................71 Figure 5.28. Top lateral deflection of barrier during Test 4 ..........................................................72
Figure 5.29. Difference in barrier movement at barrier-to-barrier connection at the
maximum load during Test 4 ........................................................................................73
Figure 5.30. Strain in barrier connection reinforcement at the deck interface during Test 4 ........73 Figure 5.31. Strain in longitudinal double-headed ties in barrier-to-barrier connection
during Test 4 .................................................................................................................74
Figure 5.32. Strain in transverse double-headed ties during Test 4 ...............................................75 Figure 5.33. Final barrier deflection and cracking in bridge deck during push direction
loading in Test 5 ............................................................................................................76
Figure 5.34. Damage to barrier and deck after Test 5 pull test ......................................................77
Figure 5.35. Damage to barrier-barrier interface after Test 5 ........................................................78 Figure 5.36. Concrete spalling on front of PBI at deck interface and barrier-to-deck
connection .....................................................................................................................78 Figure 5.37. Recorded force-displacement response during Test 5 ...............................................79 Figure 5.38. Deflection at the top of the barrier during Test 5 ......................................................80
Figure 5.39. Strains in PBI at the barrier-to-deck connection interface during Test 5 ..................81 Figure 5.40. Final barrier deflection and the corresponding damage to the bridge deck
during Test 5 .................................................................................................................82 Figure 5.41. Top mat of the bridge deck reinforcement after the Test 6 pull test .........................82 Figure 5.42. Recorded force-displacement response for push direction loading in Test 6 ............83 Figure 5.43. Top barrier deflection during push direction loading of Test 6.................................84 Figure 5.44. Strain in barrier-to-deck connection interface in PBU during push direction
loading in Test 6 ............................................................................................................85 Figure 6.1. Recommended spacing for inclined bar connection at a bridge end ...........................88

x
LIST OF TABLES
Table 2.1. Test levels .......................................................................................................................8 Table 2.2. Design forces for traffic barrier ......................................................................................8
Table 2.3. Test Level 4 design forces ............................................................................................10 Table 2.4. Summary of results obtained from eight states .............................................................12 Table 6.1. Summary of various tests conducted on the barrier ......................................................86
xi
ACKNOWLEDGMENTS
This project was sponsored by the Accelerated Bridge Construction University Transportation
Center (ABC-UTC at www.abc-utc.fiu.edu) at Florida International University (FIU), as the lead
institution, and Iowa State University (ISU) as a partner institution, and the U.S. Department of
Transportation (DOT) Office of the Assistant Secretary for Research and Technology.
The authors would like to thank the following:
Headed Reinforcement Corporation for the development and supply of the specially designed
inclined reinforcement connection
CoreSlab for prefabricating the two barriers included in the full-scale testing
Terry Wipf for serving as the principal investigator
Ahmad Abu-Hawash, Atorod Azizinamini, Michael Culmo, Kevin Goeden, and Timothy
Fields for serving on the technical advisory committee and providing input and advice
throughout the project
Finally, the authors would like to acknowledge staff of the Iowa State University Wallace W.
and Julia B. Sanders Structural Laboratory, Doug Wood and Owen Steffens, for their assistance
in the construction and testing of the precast barrier system.

1
INTRODUCTION
Overview
In bridge systems, one very important component of safety is the bridge barrier. The primary
purpose of bridge barriers is to contain, redirect, and shield vehicles from off-road bridge
accidents. Cast-in-place barriers are typically used and are proven to meet the structural
requirements needed to achieve this purpose. However, in bridge construction, the use of
prefabricated elements and systems has been gaining interest and momentum. Using
prefabricated elements, bridges can be constructed or repaired faster with less disruption to
traffic and with a safer work zone environment. Another benefit of prefabricated systems is the
improved product quality due to the use of precast components in a controlled setting. Ensuring
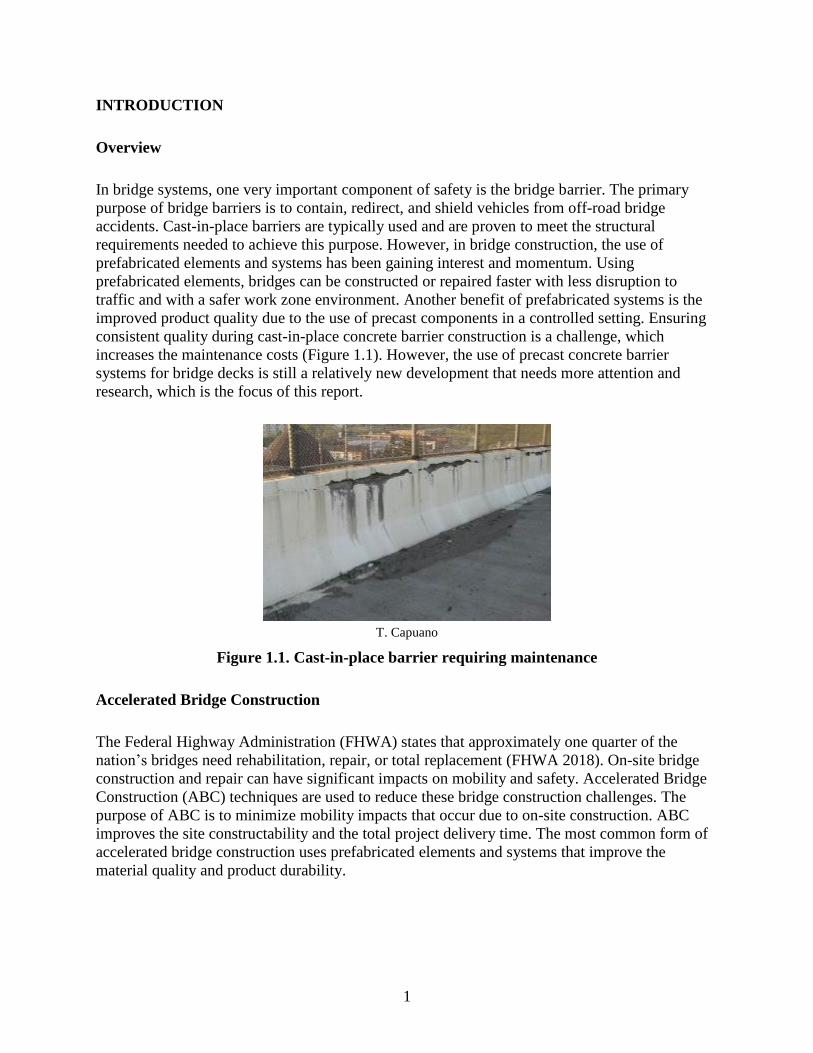
consistent quality during cast-in-place concrete barrier construction is a challenge, which
increases the maintenance costs (Figure 1.1). However, the use of precast concrete barrier
systems for bridge decks is still a relatively new development that needs more attention and
research, which is the focus of this report.
T. Capuano
Figure 1.1. Cast-in-place barrier requiring maintenance
Accelerated Bridge Construction
The Federal Highway Administration (FHWA) states that approximately one quarter of the
nation’s bridges need rehabilitation, repair, or total replacement (FHWA 2018). On-site bridge
construction and repair can have significant impacts on mobility and safety. Accelerated Bridge
Construction (ABC) techniques are used to reduce these bridge construction challenges. The
purpose of ABC is to minimize mobility impacts that occur due to on-site construction. ABC
improves the site constructability and the total project delivery time. The most common form of
accelerated bridge construction uses prefabricated elements and systems that improve the
material quality and product durability.
2
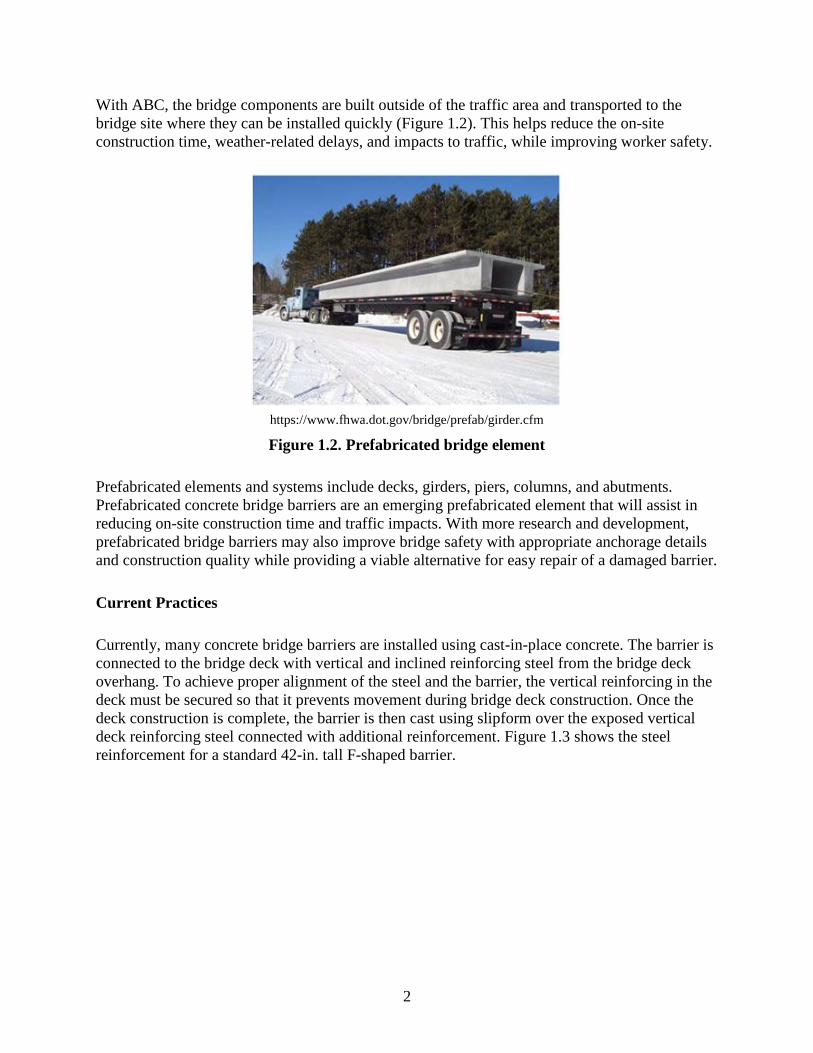
With ABC, the bridge components are built outside of the traffic area and transported to the
bridge site where they can be installed quickly (Figure 1.2). This helps reduce the on-site
construction time, weather-related delays, and impacts to traffic, while improving worker safety.
https://www.fhwa.dot.gov/bridge/prefab/girder.cfm
Figure 1.2. Prefabricated bridge element
Prefabricated elements and systems include decks, girders, piers, columns, and abutments.
Prefabricated concrete bridge barriers are an emerging prefabricated element that will assist in
reducing on-site construction time and traffic impacts. With more research and development,
prefabricated bridge barriers may also improve bridge safety with appropriate anchorage details
and construction quality while providing a viable alternative for easy repair of a damaged barrier.
Current Practices
Currently, many concrete bridge barriers are installed using cast-in-place concrete. The barrier is
connected to the bridge deck with vertical and inclined reinforcing steel from the bridge deck
overhang. To achieve proper alignment of the steel and the barrier, the vertical reinforcing in the
deck must be secured so that it prevents movement during bridge deck construction. Once the
deck construction is complete, the barrier is then cast using slipform over the exposed vertical
deck reinforcing steel connected with additional reinforcement. Figure 1.3 shows the steel
reinforcement for a standard 42-in. tall F-shaped barrier.
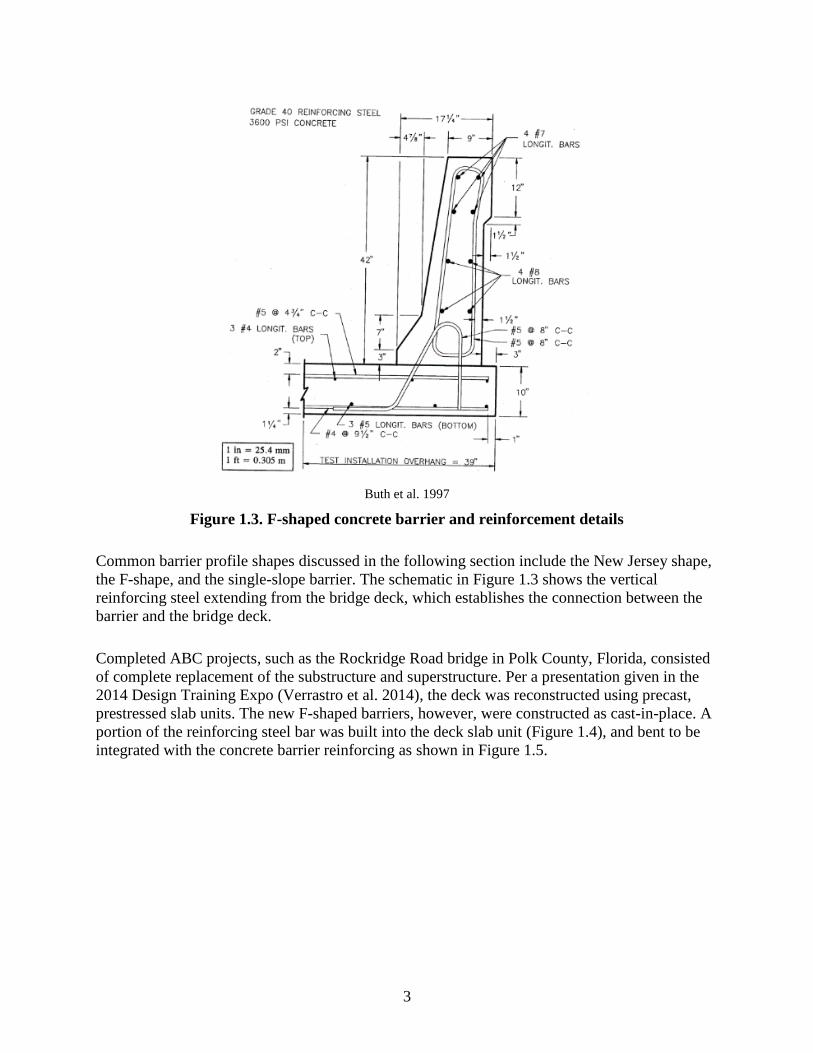
3
Buth et al. 1997
Figure 1.3. F-shaped concrete barrier and reinforcement details
Common barrier profile shapes discussed in the following section include the New Jersey shape,
the F-shape, and the single-slope barrier. The schematic in Figure 1.3 shows the vertical
reinforcing steel extending from the bridge deck, which establishes the connection between the
barrier and the bridge deck.
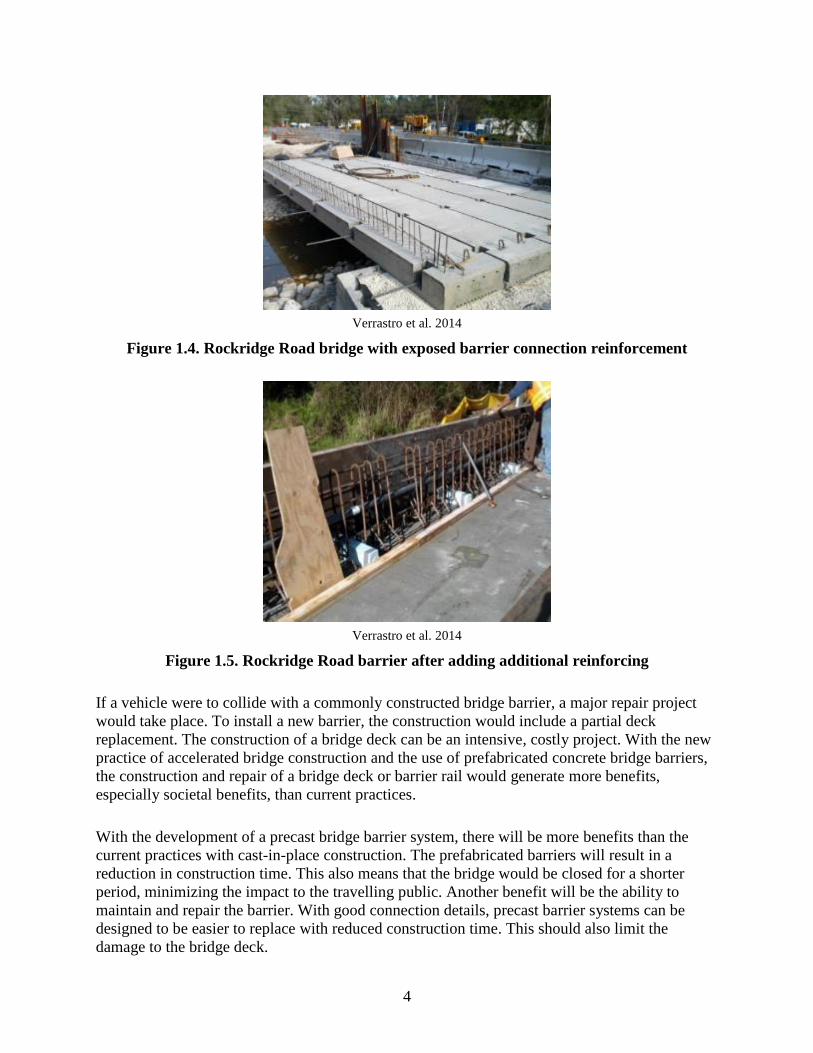
Completed ABC projects, such as the Rockridge Road bridge in Polk County, Florida, consisted
of complete replacement of the substructure and superstructure. Per a presentation given in the
2014 Design Training Expo (Verrastro et al. 2014), the deck was reconstructed using precast,
prestressed slab units. The new F-shaped barriers, however, were constructed as cast-in-place. A
portion of the reinforcing steel bar was built into the deck slab unit (Figure 1.4), and bent to be
integrated with the concrete barrier reinforcing as shown in Figure 1.5.
4
Verrastro et al. 2014
Figure 1.4. Rockridge Road bridge with exposed barrier connection reinforcement
Verrastro et al. 2014
Figure 1.5. Rockridge Road barrier after adding additional reinforcing
If a vehicle were to collide with a commonly constructed bridge barrier, a major repair project
would take place. To install a new barrier, the construction would include a partial deck
replacement. The construction of a bridge deck can be an intensive, costly project. With the new
practice of accelerated bridge construction and the use of prefabricated concrete bridge barriers,
the construction and repair of a bridge deck or barrier rail would generate more benefits,
especially societal benefits, than current practices.
With the development of a precast bridge barrier system, there will be more benefits than the
current practices with cast-in-place construction. The prefabricated barriers will result in a
reduction in construction time. This also means that the bridge would be closed for a shorter
period, minimizing the impact to the travelling public. Another benefit will be the ability to
maintain and repair the barrier. With good connection details, precast barrier systems can be
designed to be easier to replace with reduced construction time. This should also limit the
damage to the bridge deck.

5
With the significant interest in ABC, there has been valuable research in many important and
varied areas. However, one area that has not yet received notable research attention is in the area
of prefabricated, crash-tested barrier rails. ABC projects to date have tended to rely upon systems
that utilized crash-tested systems integrated into other, larger prefabricated elements. Although
this has proved sufficient while ABC has been in its relative infancy, there is a critical need to
develop prefabricated bridge concrete barriers with appropriate connection details together with
validation tests.
Scope of Research
Owners are moving to prefabricated bridge elements to facilitate rapid bridge construction and
minimize the impact of construction on traffic. Development of prefabricated bridge barriers
must be attached to a bridge superstructure with durable connections and be shown to satisfy the
Manual for Assessing Safety Hardware (MASH) (AASHTO 2009, Ross et al. 1993). Anchorage
systems needed will include robust details that connect the prefabricated bridge barrier to the
bridge deck as well as that connect one prefabricated bridge barrier to an adjacent prefabricated
bridge barrier. The long-term goal of this research effort was to establish crash-tested
prefabricated concrete bridge barriers with recommended durable anchorage systems (between
the barrier and the deck and between adjacent sections of barrier) and details that meet design
test level TL-4 in accordance with the MASH and Load and Resistance Factor Design (LRFD)
Bridge Design Specifications (AASHTO 2009 and 2012, Ross et al. 1993).
The scope of this research project is to establish a precast barrier with appropriate connections
designed to test level TL-4 to be used in bridge construction. This was done by developing
connection details for the use of a precast barrier system and by evaluating the developed details
based on laboratory testing. Using quasi-static loading, the precast barrier and the deck system
were evaluated to examine the load distribution and connection performance under different
loading scenarios. Once satisfactory connections were established, the precast barrier needed to
be crash tested in the next phase of the study.
Research Objectives
This research project contained several components. To get a better understanding of precast
barrier systems, a literature review was conducted to review all cast-in-place and prefabricated
barrier designs and details, including anchorage systems that have been crash tested for use on
the national highway system. The search also included a survey distributed to several state
departments of transportation (DOTs) to determine their needs related to prefabricated concrete
bridge barriers.
Based upon the results of the literature search, conceptual designs of prefabricated barriers with
associated anchorage systems and details were developed. Although the ultimate goal was to
develop a system that can be adopted for multiple barrier shapes, only one profile shape was
selected in this experimental investigation. Two concepts for connecting the barrier to the bridge
deck were designed for testing and one detail for connecting two adjacent barriers was
conceptualized.
6
The laboratory testing was conducted on two full-scale test barriers with connections between
the barrier as well as with a bridge deck using quasi-static loading. The barrier systems were
evaluated for their connection performance, their individual strengths and force transfer, and
corresponding distribution in the barrier and the bridge overhang. Although the research focused
on barrier detail away from the end regions, suggestions to incorporate the details for end regions
of the bridge were provided.
Report Layout
Following this introduction, this report includes a literature review of cast-in-place and
prefabricated barrier designs and details including anchorage systems that have been crash tested
for use on the national highway system. The remainder of this report includes the following:
The design criteria of the prefabricated barriers
The conceptual designs of the developed anchorage systems and the experimental specimen
design criteria and loading
The laboratory results and evaluation of two barrier-to-deck connections and one barrier-to-
barrier connection
The conclusions of the study, recommendations to improve the precast barrier connection
details, and suggestions for next the phase of the study

7
LITERATURE REVIEW
Introduction
In order to achieve a better understanding of the design and performance of prefabricated
concrete bridge barriers, a literature review was performed. Accelerated bridge construction and
the use of prefabricated elements and systems have received significant research attention in
recent years. However, one area that has not yet received notable research consideration is
prefabricated, crash-tested barrier rails. Nonetheless, a review was completed in order to gauge
the state of knowledge at the beginning of the project.
Design of Barriers
The primary function of a barrier system is to contain and redirect colliding vehicles. The
American Association of State Highway and Transportation Officials (AASHTO) standards
suggest that all vehicle traffic barriers must satisfy both geometric and strength requirements in
order to have sufficient strength to survive the initial impact of the collision and to remain
effective in redirecting the vehicle (AASHTO 2012). The barriers are designed so that if any
failures occur, they happen within the barrier rather than to the bridge deck. The barrier can be
readily repaired, whereas repairing a deck would cost more, take more time, and create more
disruption.
Concrete Barrier Strength
According to MASH, barriers can be tested to six different test levels. The test level is defined
by the impact conditions and the type of vehicle impacting the barrier. The first three test levels
use passenger vehicles while the last three tests use a form of heavy truck. The test levels are
summarized in Table 2.1.
8
Table 2.1. Test levels
Test conditions
Test
level
Test Vehicle Designation and
type
Weight of
vehicle (lb)
Speed
(mph)
Angle
(degrees)
1 1100C (Passenger Car) 2,420 31 25
2270P (Pickup Truck) 5,000 31 25
2 1100C (Passenger Car) 2,420 44 25
2270P (Pickup Truck) 5,000 44 25
3 1100C (Passenger Car) 2,420 62 25
2270P (Pickup Truck) 5,000 62 25
4 1100C (Passenger Car) 2,420 62 25
2270P (Pickup Truck) 5,000 62 25
10000S (Single-Unit Truck) 22,000 56 15
5 1100C (Passenger Car) 2,420 62 25
2270P (Pickup Truck) 5,000 62 25
36000V (Tractor-Van Trailer) 79,300 50 15
6 1100C (Passenger Car) 2,420 62 25
2270P (Pickup Truck) 5,000 62 25
36000T (Tractor-Van Trailer) 79,300 50 15
Source: AASHTO 2009
According to the AASHTO LRFD Bridge Design Specifications (2012), when designing
barriers, the design forces and geometric criteria to be used in developing test specimens should
be taken as specified in Table 2.2.
Table 2.2. Design forces for traffic barrier
Test levels
Design Forces and
Designations TL-1 TL-2 TL-3 TL-4 TL-5 TL-6
F t Transverse (kips) 13.5 27.0 54.0 54.0 124.0 175.0
F L Longitudinal (kips) 4.5 9.0 18.0 18.0 41.0 58.0
F V Vertical (kips) Down 4.5 4.5 4.5 18.0 80.0 80.0
L t and L L (ft) 4.0 4.0 4.0 3.5 8.0 8.0
L V (ft) 18.0 18.0 18.0 18.0 40.0 4.0
H e (min) (in.) 18.0 20.0 24.0 32.0 42.0 56.0
Minimum H Height of
Rail (in.)
27.0 27.0 27.0 32.0 42.0 90.0
Source: AASHTO 2012
Figure 2.1 shows the design force locations that must be applied to the barrier for each test level.

9
AASHTO LRFD Bridge Design Specifications, Copyright 2012 by the American Association
of State Highway and Transportation Officials, Washington, DC. Used with permission.
Figure 2.1. Bridge barrier design force locations as suggested in AASHTO LRFD
specifications
For this research project, as previously noted, the barriers were designed to sustain loads from
test level TL-4, which is suitable for high-speed highways, freeways, expressways, and Interstate
highways with a mixture of trucks and heavy vehicles. Accordingly, the barrier and its
connection to the bridge deck must resist a transverse design force, Ft, of 54 kips, which is
distributed over a length of 3.5 ft of the barrier (Table 2.2). This value represents the distributed
impact force of a vehicle collision.
Yield Line Analysis
The strength of a barrier is based on the formation of yield lines at the limit state. The yield line
approach can be used to check the strength of the concrete barrier away from an end or a joint
and determine the distribution of the loads that must be transferred to the deck overhang. The
variables used are illustrated in Figure 2.2. The nominal resistance of the barriers to transverse
loads can be found using Equations 2.1 and 2.2.
AASHTO LRFD Bridge Design Specifications, Copyright 2018 by the American Association
of State Highway and Transportation Officials, Washington, DC. Used with permission.
Figure 2.2. Yield line pattern used for designing concrete barrier under load, Ft
10
𝐿𝑐 =𝐿𝑡
2+√(
𝐿𝑡
2)2
+8𝐻(𝑀𝑏+𝑀𝑤)
𝑀𝑐 (2.1)
𝑅𝑤 = (2
2𝐿𝑐−𝐿𝑡) (8𝑀𝑏 + 8𝑀𝑤 +
𝑀𝑐𝐿𝑐2
𝐻) (2.2)
where
H = height of wall (ft)
Lc = critical length of yield line failure pattern (ft)
Lt = longitudinal distribution length of impact force (ft)
Mb = additional flexural resistance of beam, if any, at top of wall (kip-ft)
Mc = flexural resistance of wall about an axis parallel to the longitudinal axis of the bridge (kip-
ft/ft)
Mw = flexural resistance of wall about vertical axis (kip-ft)
Rw = nominal barrier resistance to transverse load (kips)
The flexural resistance of the barrier wall about the vertical axis is based on the horizontal
reinforcement within the wall and the flexural resistance of the wall about an axis parallel to the
longitudinal axis is determined from the vertical reinforcement. Since the barrier wall varies for
most profile shapes, it is convenient to divide the wall into sections for calculation purposes.
Once the bending strengths are found for each section, the total moment strength of the wall
about the vertical axis is the sum of the strengths. For the horizontal axis, a weighted average is
used to find the total moment resistance.
Since TL-4 is the focus of this project, the values used to determine the yield line pattern for this
case are displayed in Table 2.3
Table 2.3. Test Level 4 design forces
Design forces and designations TL-4
Ft Transverse (kips) 54.0
FL Longitudinal (kips) 18.0
FV Vertical (kips) Down 18.0
Lt and LL (ft) 3.5
LV (ft) 18.0
H (in.) 42.0
Source: AASHTO 2012
11
Experimental Evaluation
Almost all roadside safety features are required to sustain some minimum structural capacity to
assure that they can resist the applied load. Barriers must have sufficient structural capacity to
resist lateral loads from an impacting vehicle. There are multiple types of test that can be done to
demonstrate this in a laboratory setting on a newly developed barrier system. Laboratory testing
can include, but is not limited to, a gravitational pendulum, a bogie test, a static test, or a vehicle
crash test. The cost of these tests varies significantly and each test provides a valuable set of
information.
An emerging trend in evaluating the impact performance of barrier rails is the use of surrogate
test devices such as a bogie vehicle or a pendulum. The gravitational pendulum is characterized
by a striking mass that swings in a circular arc suspended by cables or rigid arms from a main
frame. The structure of the mass is designed to replicate the dynamic crush properties of a model
test vehicle and is considered a low-speed test device. Due to height limitations, gravitational
pendulums generally are used to test impact speeds of about 25 mph or less. As stated
previously, the purpose of this study was to develop a barrier that can withstand an impact at
Test Level 4 (TL 4). TL 4 passing impact speeds are 62 mph; therefore, a gravitational pendulum
would not be the best option for this test.
A bogie vehicle is designed to replicate vehicular crush characteristics. It is a vehicle on four
wheels with a mass equal to the selected test level vehicle. The vehicle is steered or guided to
impact the test specimen. A push or tow vehicle can be used to get the bogie to the impact speed.
Designing and calibrating the bogie to represent the selected passenger vehicle would be a long
and expensive process.
Many transportation safety features, including the bridge barriers, are designed to meet the
required ultimate capacity. Static testing can be used to load the structural system beyond the
elastic limit until it experiences failure. This process could be used to evaluate and validate the
safety of critical details and connections. Static testing can also help identify the force transfer
paths and evaluate failure modes. Static testing is a simple and easy way to test and compare
design details. For all these reasons, it was chosen to examine the precast concrete bridge
barriers for this project.
After a barrier system has gone through the early stages of development and has been tested to
reach its desired capacity, it may need to go through a final proof test through a vehicle crash
test. Vehicle crash tests are the most direct tie to an actual highway collision. However, this type
of testing is fairly expensive to perform and requires extensive facility capabilities.
Practice of State DOTs
With help from the Iowa DOT, information on current practices from other state DOTs was
sought via a survey distributed to various DOTs. The survey also inquired what is currently in
use for precast barriers within the states. Responses were received from 22 states and eight of

12
them were currently using a form of precast barrier system. Table 2.4 displays the survey
responses from the states for developing a precast barrier.
Table 2.4. Summary of results obtained from eight states
State
Precast
barriers
in use? Profile Barrier
Length Barrier
Height Connection Testing
Desired
Test
Level
Alaska Yes F or NJ 12'-6" 32" Pinned
connection TL-3
Nebraska Yes F 12' Bolted Full-Scale Crash
Test TL-4
New York Yes SS or
NJ 20'
32" &
42" Bolted or
hooked Static - Hydraulic
ram, crash test TL-4
Ohio Yes Temp.
NJ 10' or
12' 32"
Anchor
bolts Full-Scale Crash
Test TL-3
Pennsylvania Yes F or
Vertical 12' 42"
Integral
with deck No
Rhode Island Yes NJ 10'–20' 33" Thru
bolt/epoxy
adhesive No
Texas Yes Vertical 30' 32" Through
bolt Full-Scale Crash
Test TL-3
Utah Yes SS 23'-6"–
25' 42"
Integral
with deck No TL-4
Of the eight responses with experience with precast barriers, most of the uses were for temporary
purposes. Other systems in use are built into the bridge deck instead of connecting to the bridge
deck as a separate unit. Six of the eight responses had crash tested their precast barrier systems to
either test level 3 or level 4. From these responses, a standard shape and length were determined
for the purposes of this research. The shape chosen was a standard F-shape barrier 12 ft in
length. This survey also demonstrated the need for more research in the area of permanent,
precast, concrete, and bridge barriers.
Precast Barriers
Precast barriers are generally categorized by the shape of their profile. The profile shapes are
demonstrated in Figure 2.3.
13
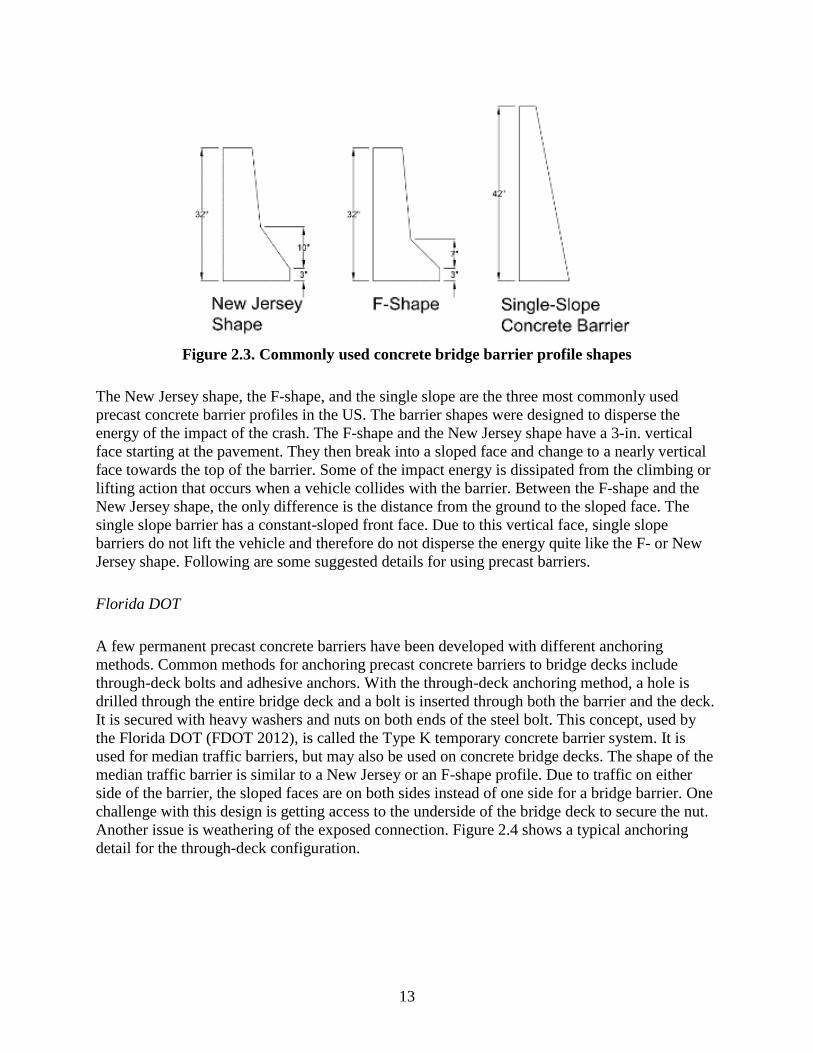
Figure 2.3. Commonly used concrete bridge barrier profile shapes
The New Jersey shape, the F-shape, and the single slope are the three most commonly used
precast concrete barrier profiles in the US. The barrier shapes were designed to disperse the
energy of the impact of the crash. The F-shape and the New Jersey shape have a 3-in. vertical
face starting at the pavement. They then break into a sloped face and change to a nearly vertical
face towards the top of the barrier. Some of the impact energy is dissipated from the climbing or
lifting action that occurs when a vehicle collides with the barrier. Between the F-shape and the
New Jersey shape, the only difference is the distance from the ground to the sloped face. The
single slope barrier has a constant-sloped front face. Due to this vertical face, single slope
barriers do not lift the vehicle and therefore do not disperse the energy quite like the F- or New
Jersey shape. Following are some suggested details for using precast barriers.
Florida DOT
A few permanent precast concrete barriers have been developed with different anchoring
methods. Common methods for anchoring precast concrete barriers to bridge decks include
through-deck bolts and adhesive anchors. With the through-deck anchoring method, a hole is
drilled through the entire bridge deck and a bolt is inserted through both the barrier and the deck.
It is secured with heavy washers and nuts on both ends of the steel bolt. This concept, used by
the Florida DOT (FDOT 2012), is called the Type K temporary concrete barrier system. It is
used for median traffic barriers, but may also be used on concrete bridge decks. The shape of the
median traffic barrier is similar to a New Jersey or an F-shape profile. Due to traffic on either
side of the barrier, the sloped faces are on both sides instead of one side for a bridge barrier. One
challenge with this design is getting access to the underside of the bridge deck to secure the nut.
Another issue is weathering of the exposed connection. Figure 2.4 shows a typical anchoring
detail for the through-deck configuration.
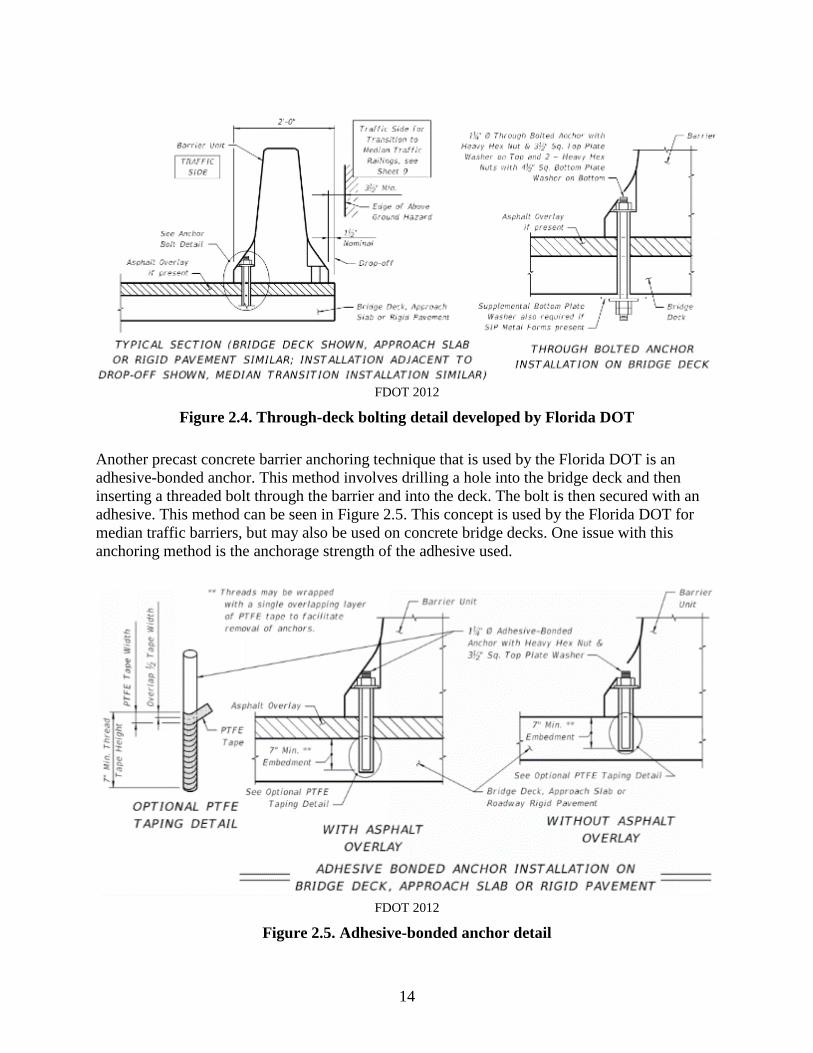
14
FDOT 2012
Figure 2.4. Through-deck bolting detail developed by Florida DOT
Another precast concrete barrier anchoring technique that is used by the Florida DOT is an
adhesive-bonded anchor. This method involves drilling a hole into the bridge deck and then
inserting a threaded bolt through the barrier and into the deck. The bolt is then secured with an
adhesive. This method can be seen in Figure 2.5. This concept is used by the Florida DOT for
median traffic barriers, but may also be used on concrete bridge decks. One issue with this
anchoring method is the anchorage strength of the adhesive used.
FDOT 2012
Figure 2.5. Adhesive-bonded anchor detail

15
Ryerson University
A different way of connecting a barrier with the through-deck method is by pre-tensioned rods
that are inserted all the way through the wall and the deck slab. A study conducted by Ryerson
University in Canada tested this method. The pre-tensioned rods were then anchored to the
bridge deck by the end plates, washers, and nuts. Details of this system can be seen in Figure 2.6.
As before, the challenges with this detail are gaining access to the bottom of the bridge deck and
the corrosion of the exposed hardware.
All dimensions are in mm; 1 mm = 0.0394 in.
Patel 2008
Figure 2.6. Ryerson barrier-to-deck slab connection details
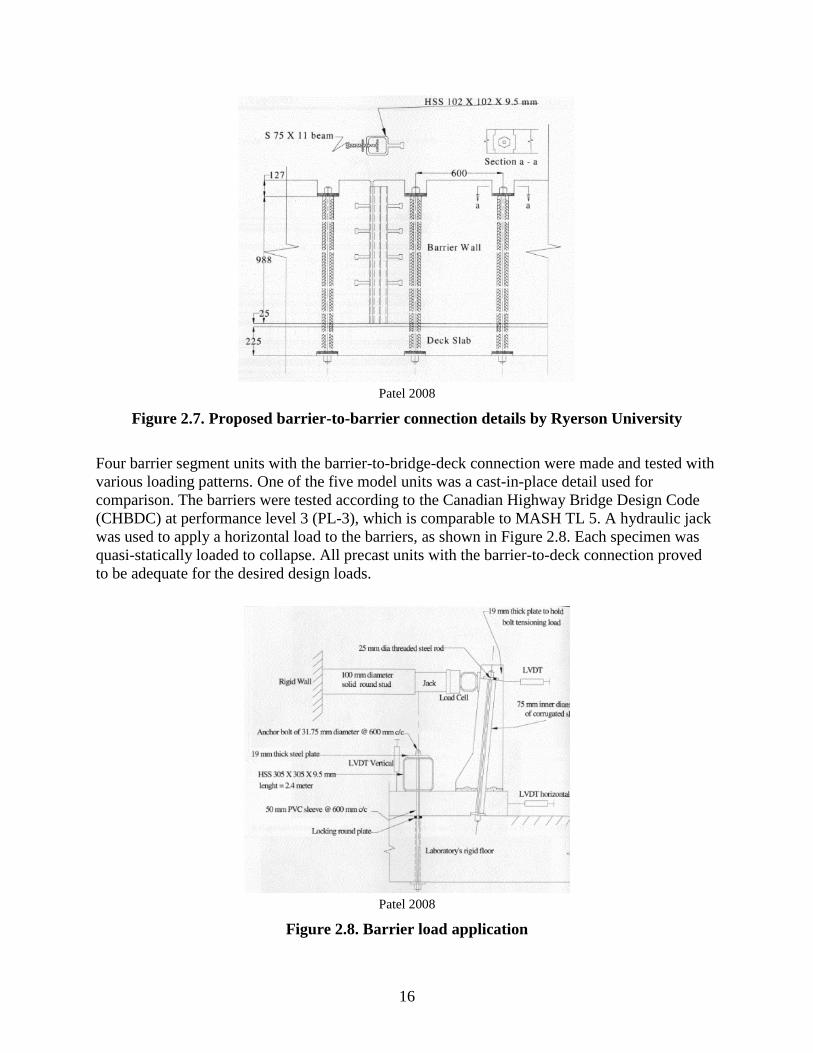
The vertical joint between the two barriers that was proposed by Ryerson University included a
hollow structural steel (HSS) section with shear studs welded on to provide anchorage for one
segment. The other segment would have an S-shaped steel beam projecting from it such that it
would slide into the HSS in the other barrier. This connection detail is illustrated in Figure 2.7
but was not subjected to any structural testing.
16
Patel 2008
Figure 2.7. Proposed barrier-to-barrier connection details by Ryerson University
Four barrier segment units with the barrier-to-bridge-deck connection were made and tested with
various loading patterns. One of the five model units was a cast-in-place detail used for
comparison. The barriers were tested according to the Canadian Highway Bridge Design Code
(CHBDC) at performance level 3 (PL-3), which is comparable to MASH TL 5. A hydraulic jack
was used to apply a horizontal load to the barriers, as shown in Figure 2.8. Each specimen was
quasi-statically loaded to collapse. All precast units with the barrier-to-deck connection proved
to be adequate for the desired design loads.
Patel 2008
Figure 2.8. Barrier load application
17
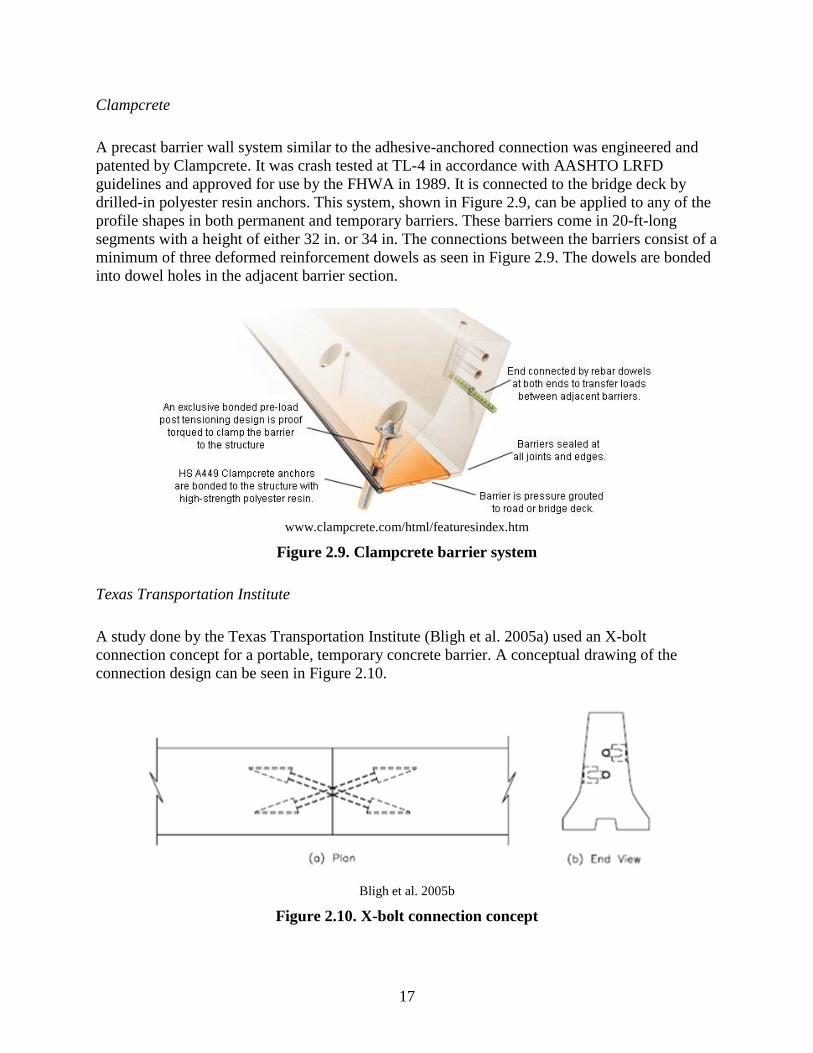
Clampcrete
A precast barrier wall system similar to the adhesive-anchored connection was engineered and
patented by Clampcrete. It was crash tested at TL-4 in accordance with AASHTO LRFD
guidelines and approved for use by the FHWA in 1989. It is connected to the bridge deck by
drilled-in polyester resin anchors. This system, shown in Figure 2.9, can be applied to any of the
profile shapes in both permanent and temporary barriers. These barriers come in 20-ft-long
segments with a height of either 32 in. or 34 in. The connections between the barriers consist of a
minimum of three deformed reinforcement dowels as seen in Figure 2.9. The dowels are bonded
into dowel holes in the adjacent barrier section.
www.clampcrete.com/html/featuresindex.htm
Figure 2.9. Clampcrete barrier system
Texas Transportation Institute
A study done by the Texas Transportation Institute (Bligh et al. 2005a) used an X-bolt
connection concept for a portable, temporary concrete barrier. A conceptual drawing of the
connection design can be seen in Figure 2.10.
Bligh et al. 2005b
Figure 2.10. X-bolt connection concept

18
The purpose of the study was to design a portable concrete traffic barrier with the minimum
dynamic deflection that could also be easily inspected and repaired. The connection was studied
using full-scale crash tests (Bligh et al. 2005a). As seen in Figure 2.11, the connection uses two
threaded rods across the joint.
Bligh et al. 2005a
Figure 2.11. X-bolt test specimen
The barriers had a standard F-shape profile and were 32 in. in height. The cross bolts used a 7/8-
in. diameter threaded rod and were 25-1/4 in. and 29 in. in length. The cross-bolt barriers were
tested under TL-3. There were two crash tests conducted. One test consisted of 20, 10-ft long
concrete barrier sections for a total test installment length of about 200 ft. A 4,960 lb pickup
truck was used for the crash test. The resulting damage is shown in Figure 2.12. Some permanent
deformation of the connection bolts was noticed when disassembling the barrier. The barrier
system experienced 27.0 in. of maximum deflection.
Bligh et al. 2005a
Figure 2.12. Damage to 10-ft long prefabricated barrier with X-bolt connections
The second test had the same barrier and connection details, but the test installment included
seven 30-ft barrier segments for a total length of about 210 ft. The pickup truck used for this
experiment was 4,531 lbs. The damage resulting from the vehicle impact is shown in Figure
19
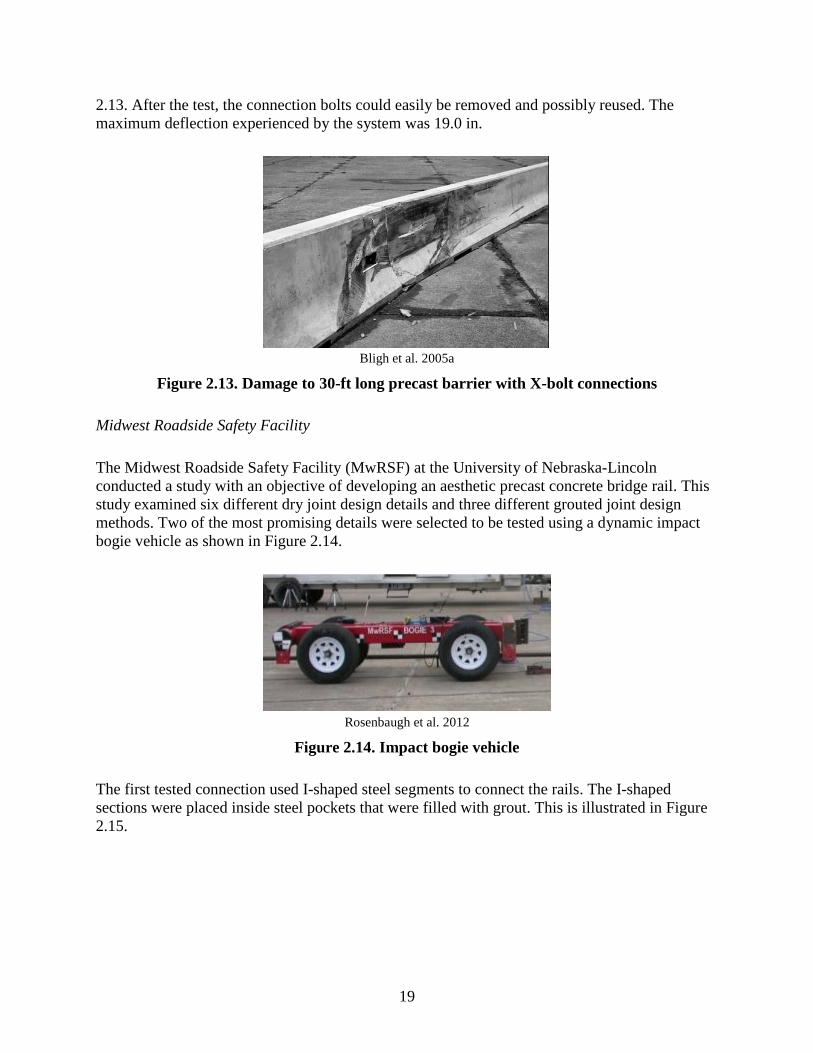
2.13. After the test, the connection bolts could easily be removed and possibly reused. The
maximum deflection experienced by the system was 19.0 in.
Bligh et al. 2005a
Figure 2.13. Damage to 30-ft long precast barrier with X-bolt connections
Midwest Roadside Safety Facility
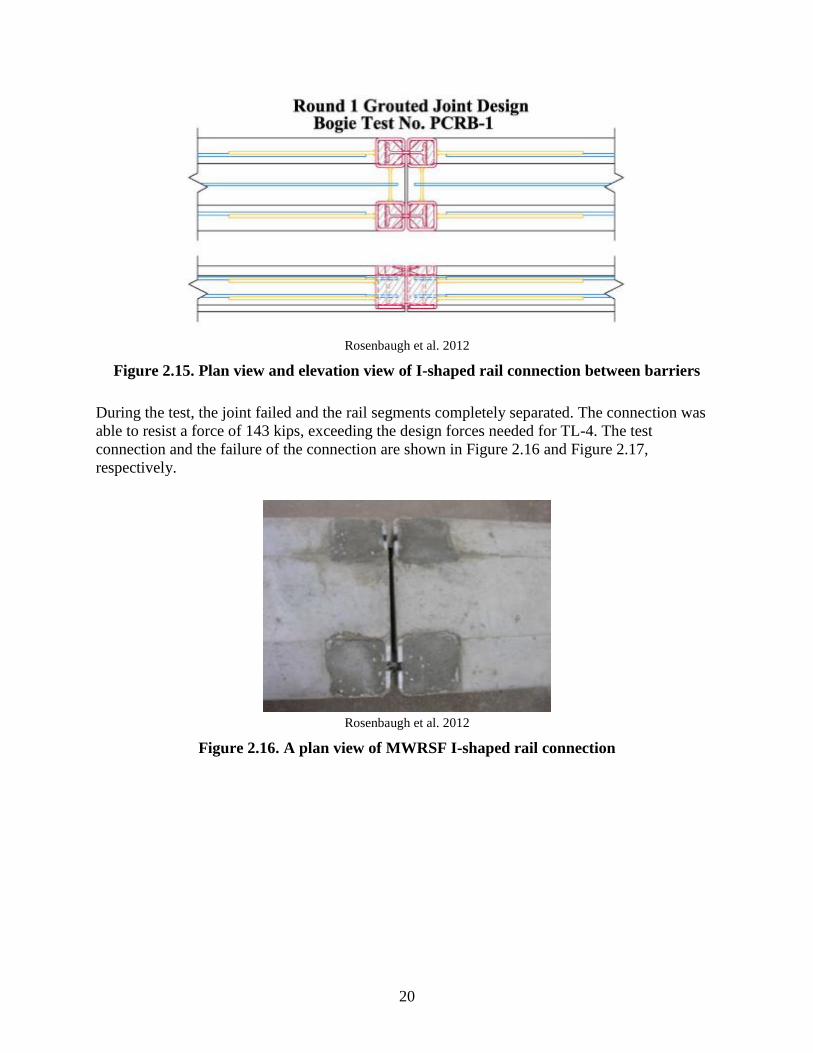
The Midwest Roadside Safety Facility (MwRSF) at the University of Nebraska-Lincoln
conducted a study with an objective of developing an aesthetic precast concrete bridge rail. This
study examined six different dry joint design details and three different grouted joint design
methods. Two of the most promising details were selected to be tested using a dynamic impact
bogie vehicle as shown in Figure 2.14.
Rosenbaugh et al. 2012
Figure 2.14. Impact bogie vehicle
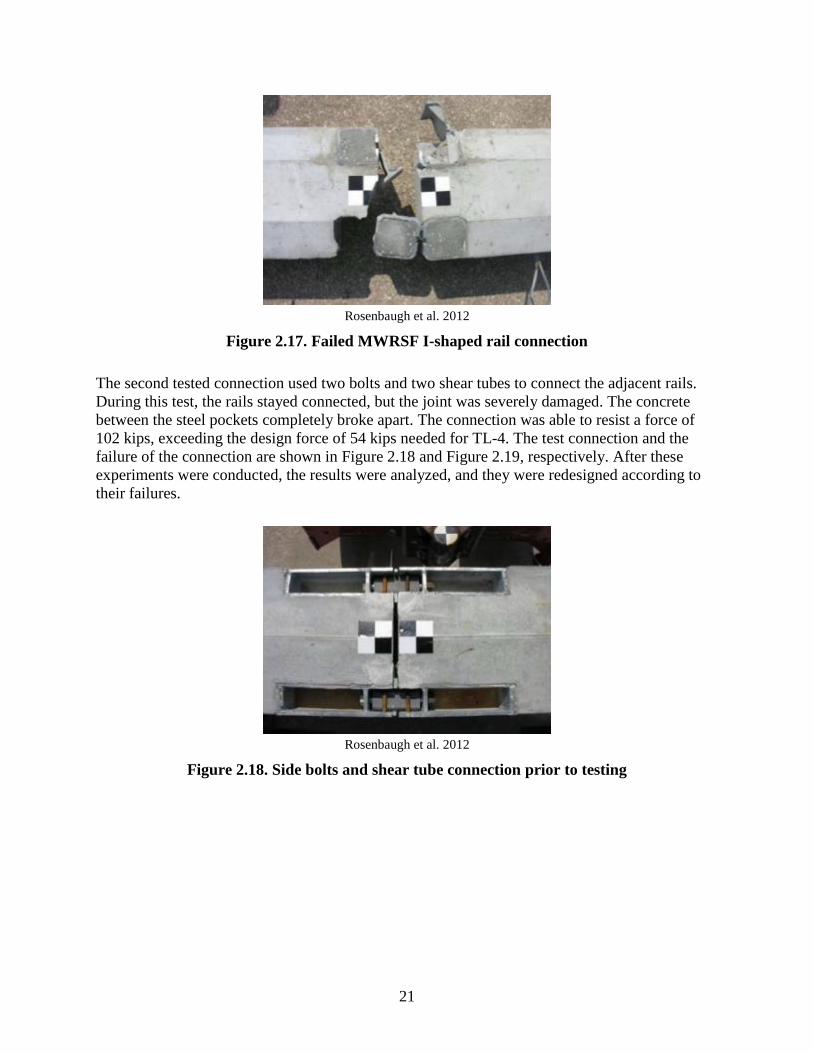
The first tested connection used I-shaped steel segments to connect the rails. The I-shaped
sections were placed inside steel pockets that were filled with grout. This is illustrated in Figure
2.15.
20
Rosenbaugh et al. 2012
Figure 2.15. Plan view and elevation view of I-shaped rail connection between barriers
During the test, the joint failed and the rail segments completely separated. The connection was
able to resist a force of 143 kips, exceeding the design forces needed for TL-4. The test
connection and the failure of the connection are shown in Figure 2.16 and Figure 2.17,
respectively.
Rosenbaugh et al. 2012
Figure 2.16. A plan view of MWRSF I-shaped rail connection
21
Rosenbaugh et al. 2012
Figure 2.17. Failed MWRSF I-shaped rail connection
The second tested connection used two bolts and two shear tubes to connect the adjacent rails.
During this test, the rails stayed connected, but the joint was severely damaged. The concrete
between the steel pockets completely broke apart. The connection was able to resist a force of
102 kips, exceeding the design force of 54 kips needed for TL-4. The test connection and the
failure of the connection are shown in Figure 2.18 and Figure 2.19, respectively. After these
experiments were conducted, the results were analyzed, and they were redesigned according to
their failures.
Rosenbaugh et al. 2012
Figure 2.18. Side bolts and shear tube connection prior to testing

22
Rosenbaugh et al. 2012
Figure 2.19. Side bolt and shear tube connection failure
Redesign of the I-shaped steel connection included an increase in reinforcing steel bar sizes from
no. 5 longitudinal reinforcing bar to no. 7 threaded reinforcing bar and the steel pockets were
changed to steel tubes. The shear reinforcement was modified as well. To prevent the connection
from prying open, shear bolts were added. This is detailed in Figure 2.20.
Rosenbaugh et al. 2012
Figure 2.20. Plan view and elevation view of I-shaped rail connection improvements
This joint held up to an approximate load of 100 kips, exceeding the design impact force of 62
kips. The joint also sustained minimal damage. The resulting damage is shown in Figure 2.21.
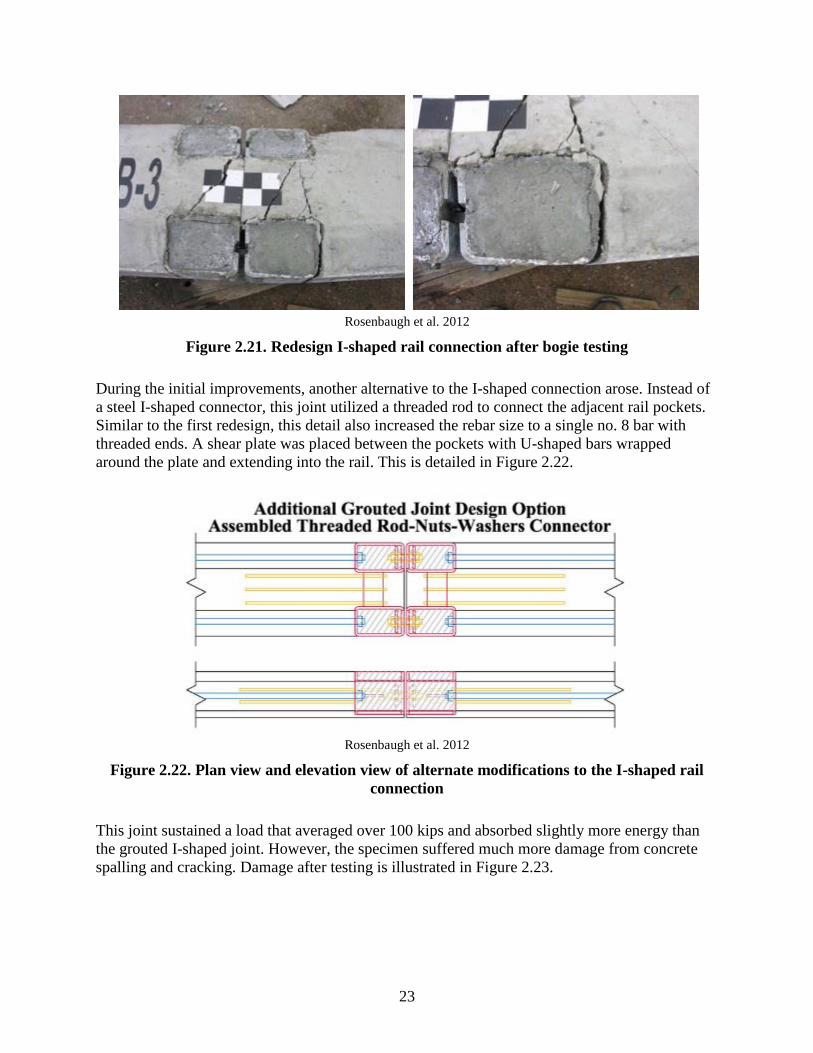
23
Rosenbaugh et al. 2012
Figure 2.21. Redesign I-shaped rail connection after bogie testing
During the initial improvements, another alternative to the I-shaped connection arose. Instead of
a steel I-shaped connector, this joint utilized a threaded rod to connect the adjacent rail pockets.
Similar to the first redesign, this detail also increased the rebar size to a single no. 8 bar with
threaded ends. A shear plate was placed between the pockets with U-shaped bars wrapped
around the plate and extending into the rail. This is detailed in Figure 2.22.
Rosenbaugh et al. 2012
Figure 2.22. Plan view and elevation view of alternate modifications to the I-shaped rail
connection
This joint sustained a load that averaged over 100 kips and absorbed slightly more energy than
the grouted I-shaped joint. However, the specimen suffered much more damage from concrete
spalling and cracking. Damage after testing is illustrated in Figure 2.23.

24
Rosenbaugh et al. 2012
Figure 2.23. Alternate redesign I-shaped rail connection failure
The side bolt and shear tube connection were modified in a similar fashion. The longitudinal
steel size was increased to a threaded no. 8 bar, the steel tubes were cut to form U-shaped pieces,
the size of the joint pockets increased, and shear bolts were added. See Figure 2.24.
Rosenbaugh et al. 2012
Figure 2.24. Side bolts and shear tube connection improvements
The testing results of this joint proved that the connecting threaded rods were too weak and
failed at a load just over 60 kips. Resulting damage is shown in Figure 2.25.
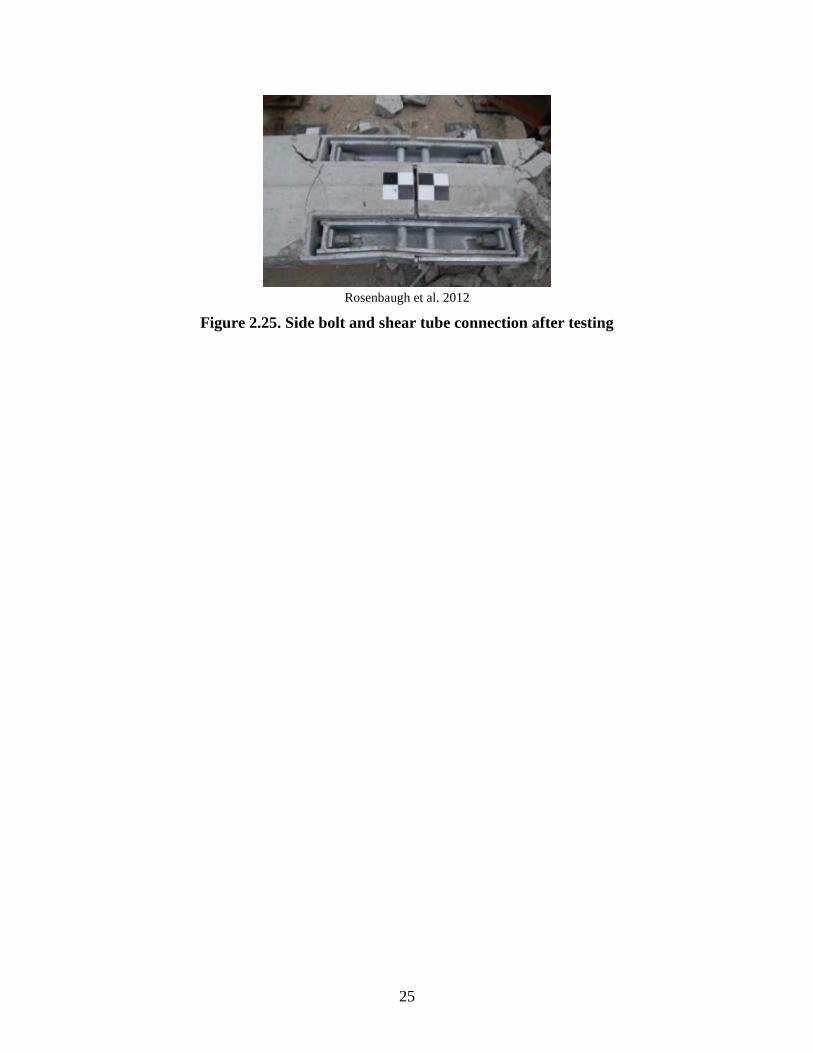
25
Rosenbaugh et al. 2012
Figure 2.25. Side bolt and shear tube connection after testing

26
EXPERIMENTAL PLAN
Introduction
Based on both the literature review that was conducted and discussion with academics,
professionals, precasters, and members of the technical advisory committee (TAC), some
guidelines had to be established when designing and testing the barrier segments. It was decided
that the laboratory testing would include two connections between the barrier and the deck and
one connection between the barriers and that it would simulate the load on a barrier away from
the bridge end regions. The barrier segments chosen would be 12 ft in length with a 0.5-in.
construction tolerance between them. From the national survey, the barrier profile shape selected
was the standard 42 in. F-shape barrier. The deck, deck overhang, and barrier placement on the
deck were designed in accordance to Iowa DOT standards.
Guiding Parameters
For this research, the design of the precast concrete barrier covered multiple parameters. Those
parameters included the following: 1) ease of construction of the connections, 2) improved
durability and lower maintenance cost, 3) easy repair of the damaged barrier, and 4) cost
effectiveness. The laboratory testing also needed to demonstrate the safety of the barrier and how
the loads are transferred upon impact at different locations. Two connections between the barrier
and the bridge deck were designed for this project. One of the connections was designed to be
durable, easily constructible, and replaceable if it experienced damage due to a vehicular
collision. The other connection was designed to be cost effective and have a durable anchorage
system, but not easily repairable.
Barrier-to-Deck Connections
After evaluating the benefits and challenges of various connections concepts, the first precast
barrier to be tested was designed with an inclined, #8 bar as the primary connection element
between the barrier and deck. Five #8 bars were used to connect the barrier segment to the bridge
deck with a maximum spacing of 30 in. between two adjacent bars. A schematic illustrating this
detail is shown in Figure 3.1.
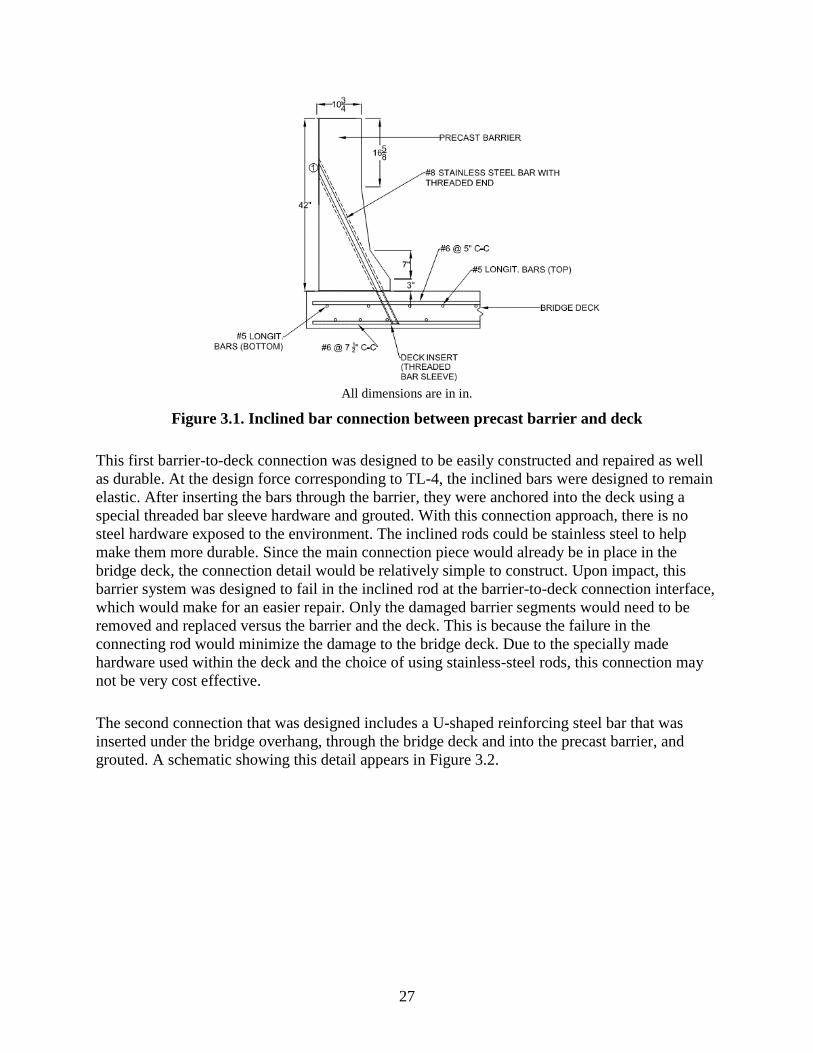
27
All dimensions are in in.
Figure 3.1. Inclined bar connection between precast barrier and deck
This first barrier-to-deck connection was designed to be easily constructed and repaired as well
as durable. At the design force corresponding to TL-4, the inclined bars were designed to remain
elastic. After inserting the bars through the barrier, they were anchored into the deck using a
special threaded bar sleeve hardware and grouted. With this connection approach, there is no
steel hardware exposed to the environment. The inclined rods could be stainless steel to help
make them more durable. Since the main connection piece would already be in place in the
bridge deck, the connection detail would be relatively simple to construct. Upon impact, this
barrier system was designed to fail in the inclined rod at the barrier-to-deck connection interface,
which would make for an easier repair. Only the damaged barrier segments would need to be
removed and replaced versus the barrier and the deck. This is because the failure in the
connecting rod would minimize the damage to the bridge deck. Due to the specially made
hardware used within the deck and the choice of using stainless-steel rods, this connection may
not be very cost effective.
The second connection that was designed includes a U-shaped reinforcing steel bar that was
inserted under the bridge overhang, through the bridge deck and into the precast barrier, and
grouted. A schematic showing this detail appears in Figure 3.2.
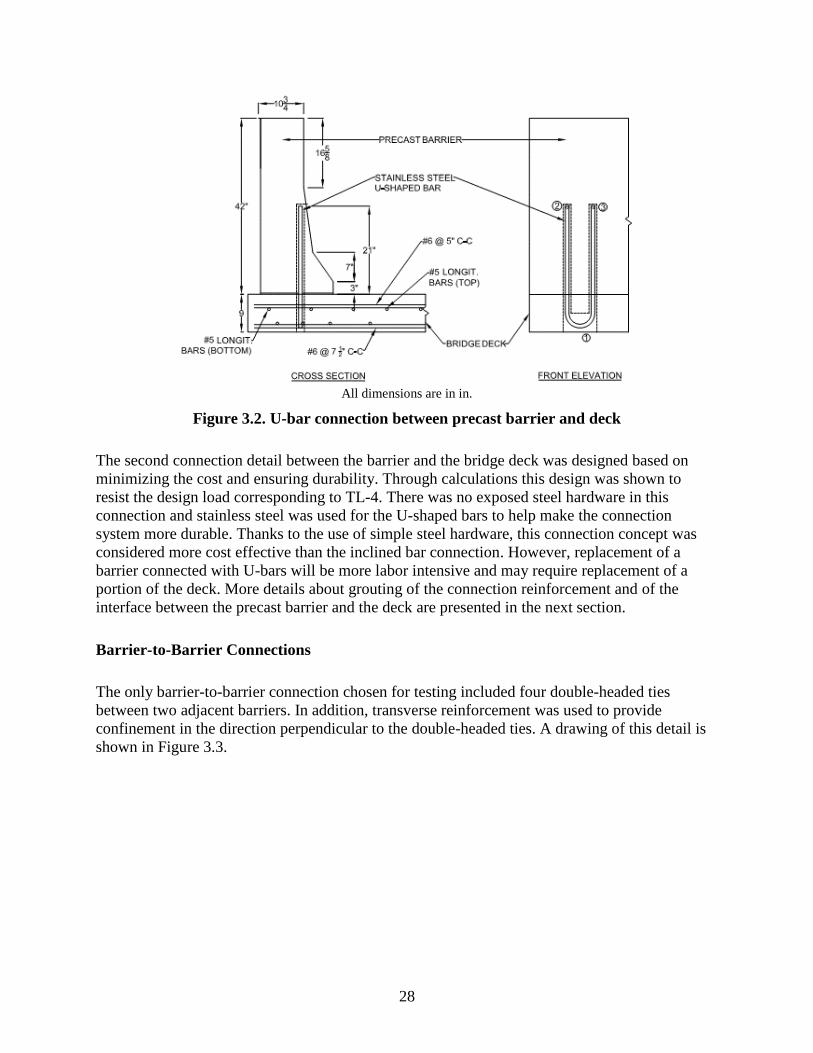
28
All dimensions are in in.
Figure 3.2. U-bar connection between precast barrier and deck
The second connection detail between the barrier and the bridge deck was designed based on
minimizing the cost and ensuring durability. Through calculations this design was shown to
resist the design load corresponding to TL-4. There was no exposed steel hardware in this
connection and stainless steel was used for the U-shaped bars to help make the connection
system more durable. Thanks to the use of simple steel hardware, this connection concept was
considered more cost effective than the inclined bar connection. However, replacement of a
barrier connected with U-bars will be more labor intensive and may require replacement of a
portion of the deck. More details about grouting of the connection reinforcement and of the
interface between the precast barrier and the deck are presented in the next section.
Barrier-to-Barrier Connections
The only barrier-to-barrier connection chosen for testing included four double-headed ties
between two adjacent barriers. In addition, transverse reinforcement was used to provide
confinement in the direction perpendicular to the double-headed ties. A drawing of this detail is
shown in Figure 3.3.

29
Figure 3.3. Plan view of the barrier-to-barrier connection
The connection between the barriers was designed to create continuity between barriers such that
the load imposed on one barrier would be appropriately distributed to adjacent barriers, as would
be the case in a slip form barrier. The connection regions need to be easily fabricated with the
barrier, constructed, and installed. As with the other connections, this had no exposed reinforcing
steel bar to affect its durability.
Deck Design
The bridge deck was designed to meet the Iowa DOT standards and some of the reinforcement
quantities were refined according to the expected loading conditions. The selected failure
mechanism for the entire deck and barrier system was within the barrier connection reinforcing
bars. To ensure this, the deck had to be able to withstand the loading applied to the barrier, and
analysis of the deck reinforcement was done in SAP2000. According to Iowa DOT standards,
typical AASHTO type decks use #6 reinforcing steel bar with 10-in. spacing. For this project, the
main concern was the response of the barrier. To ensure that premature failure would not take
place in the deck, additional deck reinforcement was added, and the corresponding strain demand
was monitored. The top mat of the deck would experience the most tension during the tests. As a
result, the reinforcement was adjusted to #6 bars with 5-in. spacing. The bottom mat was
adjusted to #6 bars at 7.5 in. spacing. The force distribution from the application of the load to
the barrier was assumed to be based on a 1:1 slope, which is consistent with the recommendation
in AASHTO. This resulted in a 7-ft distribution length on the bottom of the barrier and edge of
the deck and a 10.5-ft distribution length when the load was applied sufficiently away from the
edge of the barrier. These values were used in the SAP2000 analyses to establish the respective
moment-curvature responses. The analyzed profiles for the 7- and 10.5-ft sections are displayed
in Figure 3.4 and Figure 3.5, respectively.

30
Figure 3.4. End of bridge deck reinforcement (7-ft segment analysis)
Figure 3.5. Bridge deck reinforcement (10.5-ft segment analysis)
Since the ends of the test barrier unit were not intended to simulate the details of the bridge ends,
no additional reinforcement or modification was included.
The flexural behavior of the reinforced deck cross sections is displayed in Figure 3.6.
Figure 3.6. Moment curvature responses of different deck segments
For the 7-ft cross section, the predicted yield moment was 2282 kip-in. and the predicted plastic
moment was 2437 kip-in. with an idealized yield curvature of 0.00058 1/in. The 10.5-ft section
had a predicted yield moment of 3457 kip-in. and a predicted plastic moment of 3721 with a
0.00058 1/in. idealized yield curvature.

31
CONSTRUCTION OF TEST UNIT
Introduction
The testing of the concrete precast barrier rails was conducted in the Wallace W. and Julia B.
Sanders Structural Laboratory at Iowa State University (ISU). Construction of the two precast
barriers was completed at a precast facility and the supporting system, including the deck beams
and deck, was fabricated in place in the laboratory. As previously described, two barrier-to-deck
connections were tested: the inclined reinforcement connection, PBI, and the U-bar connection,
PBU. Only one barrier-to-barrier connection was tested as planned. Testing was monitored by
various instrumentation that included string potentiometers, linear variable differential
transducers (LVDTs), strain gauges, and a three-dimensional (3D) Optotrak system with multiple
displacement targets. The test unit assembly was completed with multiple materials that included
special reinforcement and ultraflow grout.
Precast Barrier Construction
The two precast barriers were built at a CoreSlab facility in Omaha, Nebraska, and delivered to
the ISU laboratory. The barriers shown in Figure 4.1 were built with the standard F-shape barrier
profile reinforcing, as previously shown in Figure 1.2.
Figure 4.1. PBI and PBU at the CoreSlab facility prior to the concrete pour
The first precast barrier to be tested used an inclined bar connection to the bridge deck, which
was designed with five #8 bars serving as the tension reinforcement at the connection interface.
The inclined reinforcing bars were spaced at 30 in. as this was deemed to be the maximum
spacing for practical use. To accommodate this reinforcement, the barrier was cast with 2.5-in.
Inclined
corrugated
duct
Corrugated
duct
Longitudinal
double-headed
ties
PBI PBU

32
diameter, inclined corrugated ducts. For this project, this barrier is known as precast barrier with
inclined bars (PBI).
The second barrier included a U-shaped reinforcing steel bar connection. The U-bars are inserted
from the underside of the bridge overhang, through the bridge deck, and into the precast barrier.
For research purposes, one side of the barrier was designed to use #7 U-shaped bars. The other
side included two bundled #5 U-shaped bars. The U-shaped barrier-to-deck connections were
spaced at 24 in. As with the last connection detail, corrugated ducts are cast into the precast
barrier for the U-bar placement. These ducts were kept vertical with a height of 21 in. For the #7
bars, ducts with 2-in. of inside diameter were used. For the bundled #5 U-bars, the inside
diameter of the duct was increased to 2.5 in. For this project, this barrier is known as precast
barrier with U-bars (PBU).
The only barrier-to-barrier connection that was chosen for testing included four double-headed
ties along the barrier length. For this project, the longitudinal double-headed tie was cast into
PBU. Figure 4.2 displays a photo of the longitudinal double-headed ties as used.
Figure 4.2. Longitudinal double-headed ties used for barrier-to-barrier connection
A receiving pocket was cast into PBI. To connect the two barrier segments, PBU is lifted and
slid into the pocket on PBI. With the pocket running along the height of the barrier, there was
minimal concrete near the barrier-to-barrier connection. Another set of #3 bars was added to
confine the connection to the transverse direction. This detail consisted of a threaded, headed bar
that was inserted into a steel, headed receiving piece as shown in Figure 4.3. The headed bars
were inserted as part of the connection assembly prior to grouting.
Figure 4.3. Transverse double-headed ties used for barrier-to-barrier connection
The end region of the two precast barriers that are supposed to form the barrier-to-barrier
connection is shown in Figure 4.4.

33
Figure 4.4. End of precast barriers with longitudinal double-headed ties and receiving
The left side of the image is PBU and has the exposed longitudinal ties. The right side of the
image shows the PBI side. This side has the receiving pocket that the longitudinal ties are slid
into. The transverse ties are embedded in PBI on the right side of the image as indicated.
Bridge Deck Construction
Bridge deck construction began with the bridge deck supporting beams. For this project, there
were three beams beneath the deck cast to support the test specimen. Each beam had a cross-
section of 12 in. (width) x 18 in. (height) and was placed to align with the tie-down holes of the
laboratory strong floor. The beams were positioned 3 ft apart. Once the beams were situated and
poured, the deck was fabricated on top of them with an overhang. The deck was 10 ft and 8 in.
wide by 24 ft long. This allowed the deck to accommodate for an adequate length for the two 12-
ft barrier segments as well as a 3.5-ft deck overhang for the barriers to be included. Figure 4.5
shows the formwork and the supporting beams.
Longitudinal
double-headed
ties
Receiving pocket
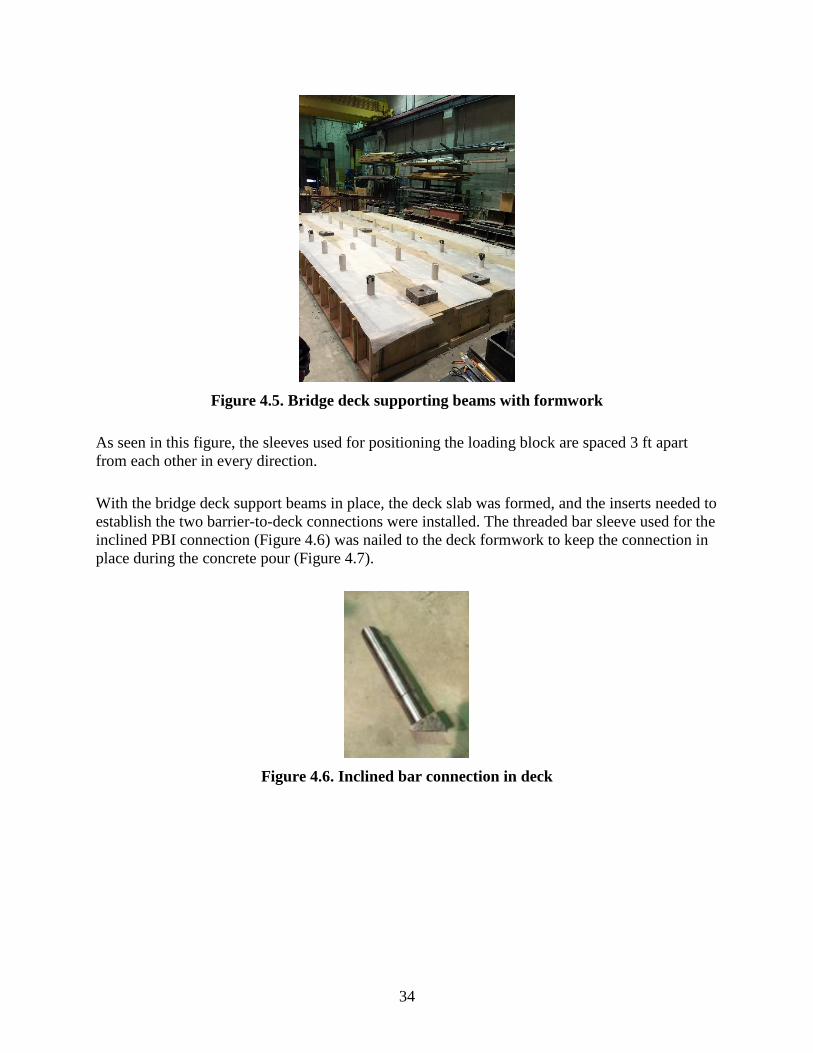
34
Figure 4.5. Bridge deck supporting beams with formwork
As seen in this figure, the sleeves used for positioning the loading block are spaced 3 ft apart
from each other in every direction.
With the bridge deck support beams in place, the deck slab was formed, and the inserts needed to
establish the two barrier-to-deck connections were installed. The threaded bar sleeve used for the
inclined PBI connection (Figure 4.6) was nailed to the deck formwork to keep the connection in
place during the concrete pour (Figure 4.7).
Figure 4.6. Inclined bar connection in deck

35
Figure 4.7. Connected inclined receiving end piece to the deck formwork
As noted, the U-bars for the PBU connection were inserted from the underside of the overhang
into pockets in the bride deck. Cutouts were made, and proper blockage was established before
pouring the deck concrete. The block outs of these access pockets are shown in Figure 4.8.
Figure 4.8. Deck block outs to facilitate U-bar installation
After the materials needed for the barrier-to-deck connections were installed, the bridge deck
reinforcement was placed (Figure 4.9).

36
Figure 4.9. Bridge deck reinforcement
The bottom reinforcement mat was placed with 1-in. chairs and reinforcing ties were used at
every intersection. The top reinforcement was then placed with 5-in. metal reinforcing steel bar
chairs and tied at every longitudinal and transverse intersection.
Some of the deck reinforcement interfered with the barrier connection regions. On the PBI side,
this reinforcement was shifted to avoid the inclined threaded bar sleeve (Figure 4.10).
Figure 4.10. Installed PBI connection sleeve with deck reinforcement
On the PBU side, some of the bottom deck reinforcement interfered with the U-bar access
pockets. These bars were terminated at the pocket. The top deck reinforcement that interfered

37
with the U-bar pockets was shifted so that at least two bars were within the U-shaped connection
as seen in Figure 4.11.
Figure 4.11. U-bar access blocks outs with terminated bottom deck steel and top deck steel
positioned to be within a U-bar connection
Following the reinforcing steel bar installation, the bridge deck concrete was poured (Figure
4.12).
Figure 4.12. Bridge deck concrete pour
The deck was completed in two continuous pours. After the top of the concrete was leveled, the
portion of the deck where the barriers were to be placed was finished with a wire brush to create
a roughened surface.
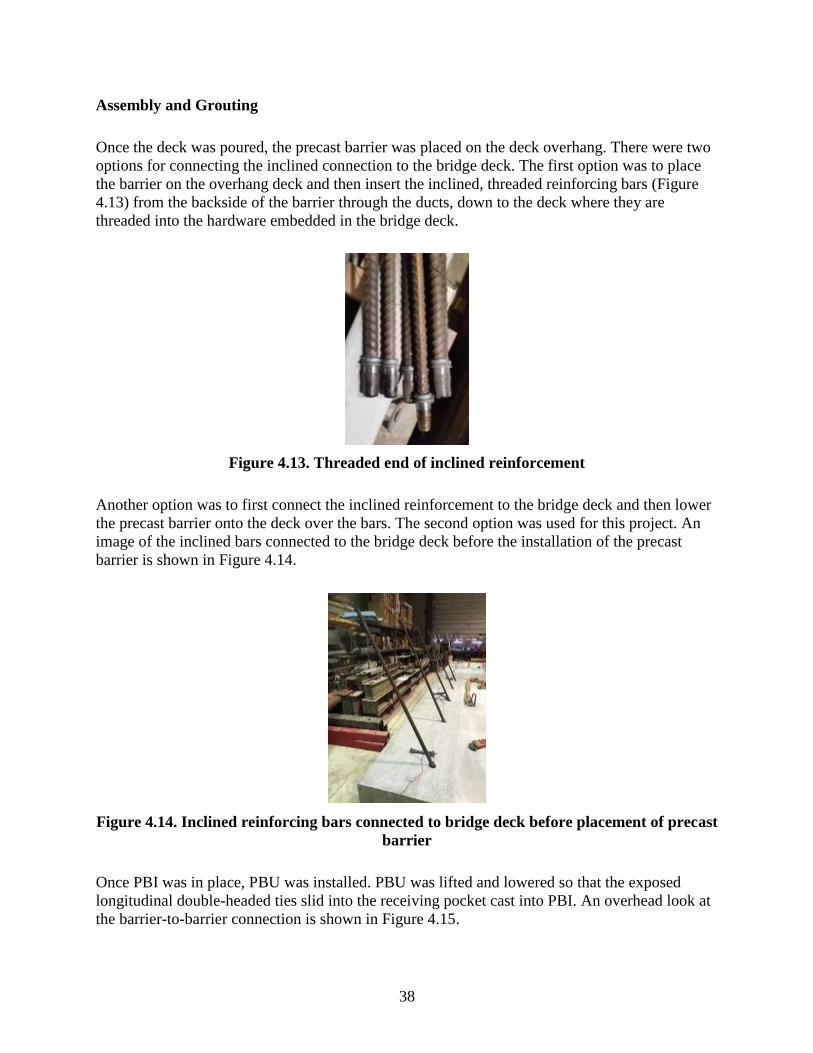
38
Assembly and Grouting
Once the deck was poured, the precast barrier was placed on the deck overhang. There were two
options for connecting the inclined connection to the bridge deck. The first option was to place
the barrier on the overhang deck and then insert the inclined, threaded reinforcing bars (Figure
4.13) from the backside of the barrier through the ducts, down to the deck where they are
threaded into the hardware embedded in the bridge deck.
Figure 4.13. Threaded end of inclined reinforcement
Another option was to first connect the inclined reinforcement to the bridge deck and then lower
the precast barrier onto the deck over the bars. The second option was used for this project. An
image of the inclined bars connected to the bridge deck before the installation of the precast
barrier is shown in Figure 4.14.
Figure 4.14. Inclined reinforcing bars connected to bridge deck before placement of precast
barrier
Once PBI was in place, PBU was installed. PBU was lifted and lowered so that the exposed
longitudinal double-headed ties slid into the receiving pocket cast into PBI. An overhead look at
the barrier-to-barrier connection is shown in Figure 4.15.
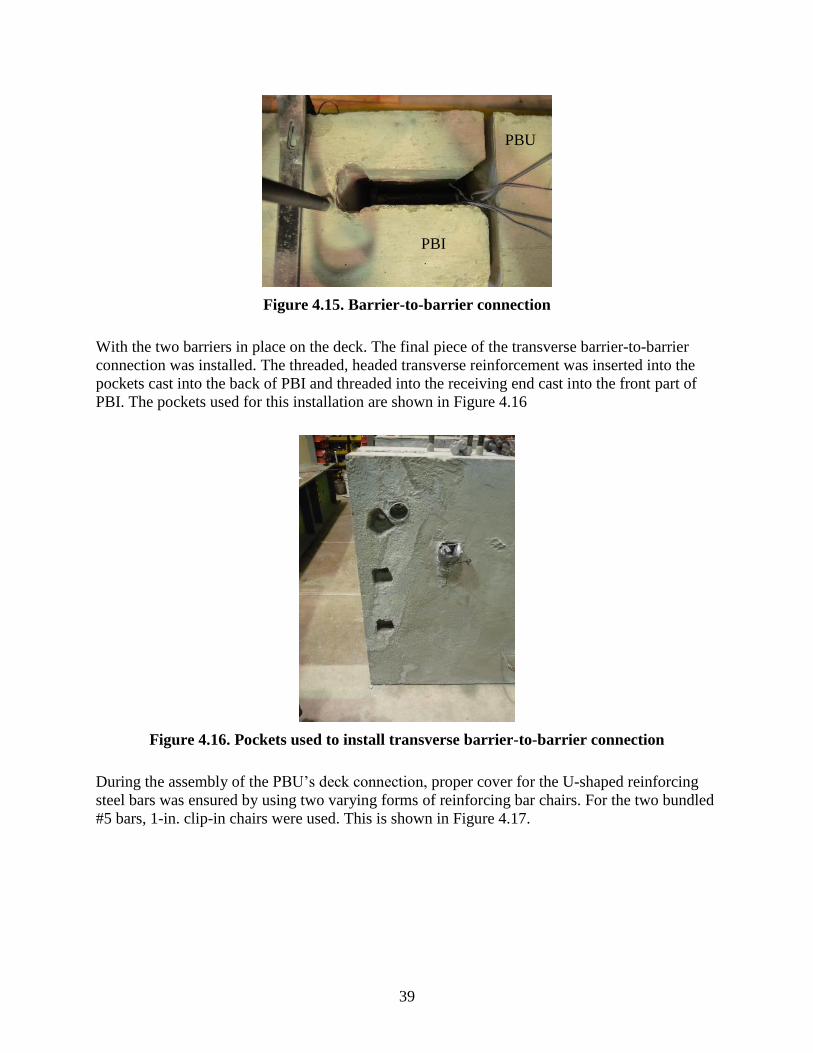
39
Figure 4.15. Barrier-to-barrier connection
With the two barriers in place on the deck. The final piece of the transverse barrier-to-barrier
connection was installed. The threaded, headed transverse reinforcement was inserted into the
pockets cast into the back of PBI and threaded into the receiving end cast into the front part of
PBI. The pockets used for this installation are shown in Figure 4.16
Figure 4.16. Pockets used to install transverse barrier-to-barrier connection
During the assembly of the PBU’s deck connection, proper cover for the U-shaped reinforcing
steel bars was ensured by using two varying forms of reinforcing bar chairs. For the two bundled
#5 bars, 1-in. clip-in chairs were used. This is shown in Figure 4.17.
PBI
PBU
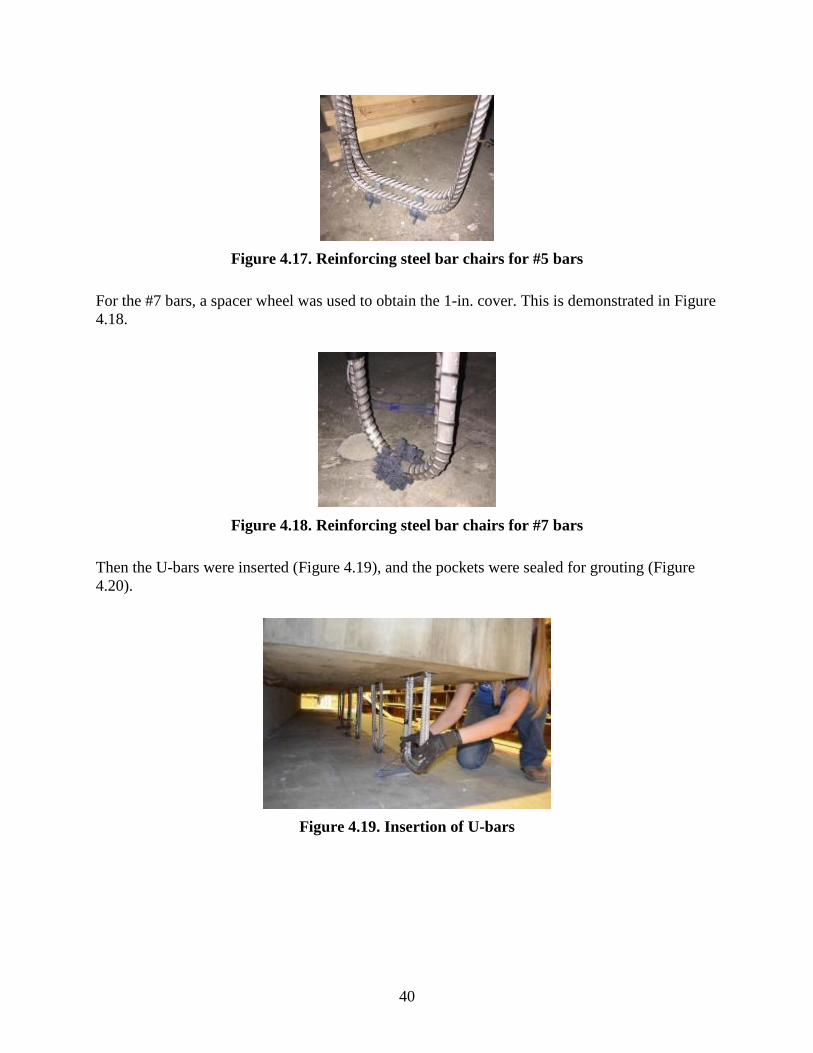
40
Figure 4.17. Reinforcing steel bar chairs for #5 bars
For the #7 bars, a spacer wheel was used to obtain the 1-in. cover. This is demonstrated in Figure
4.18.
Figure 4.18. Reinforcing steel bar chairs for #7 bars
Then the U-bars were inserted (Figure 4.19), and the pockets were sealed for grouting (Figure
4.20).
Figure 4.19. Insertion of U-bars
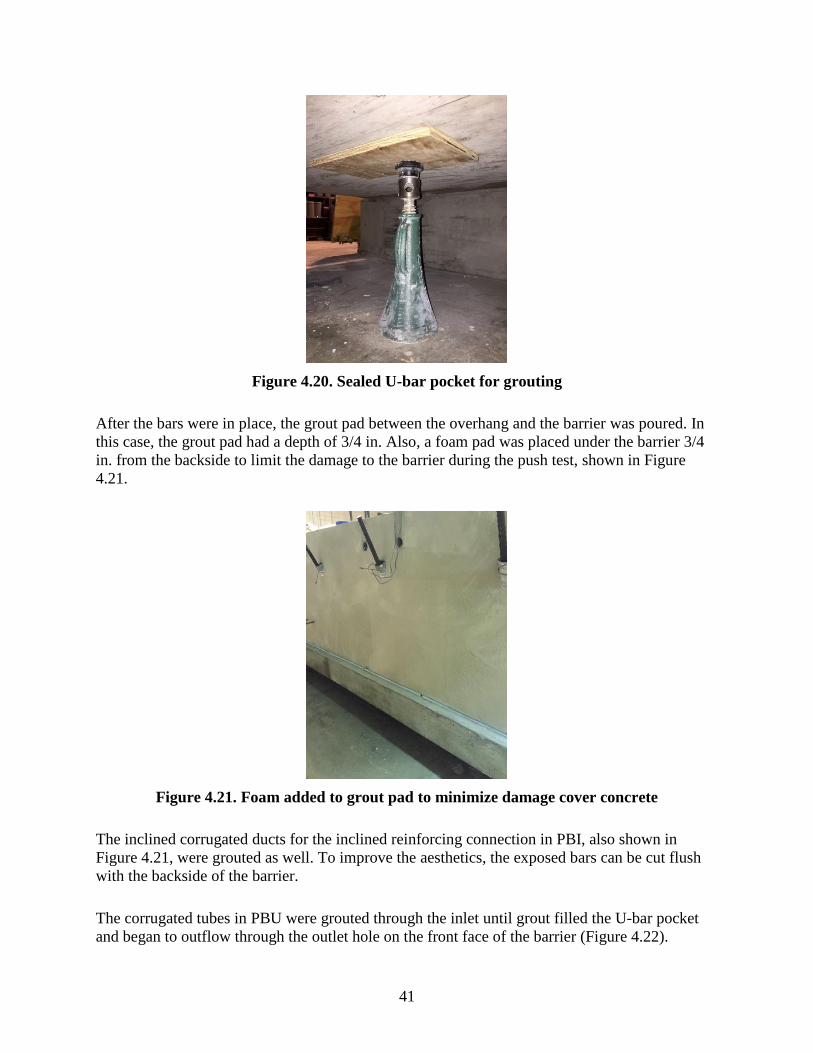
41
Figure 4.20. Sealed U-bar pocket for grouting
After the bars were in place, the grout pad between the overhang and the barrier was poured. In
this case, the grout pad had a depth of 3/4 in. Also, a foam pad was placed under the barrier 3/4
in. from the backside to limit the damage to the barrier during the push test, shown in Figure
4.21.
Figure 4.21. Foam added to grout pad to minimize damage cover concrete
The inclined corrugated ducts for the inclined reinforcing connection in PBI, also shown in
Figure 4.21, were grouted as well. To improve the aesthetics, the exposed bars can be cut flush
with the backside of the barrier.
The corrugated tubes in PBU were grouted through the inlet until grout filled the U-bar pocket
and began to outflow through the outlet hole on the front face of the barrier (Figure 4.22).
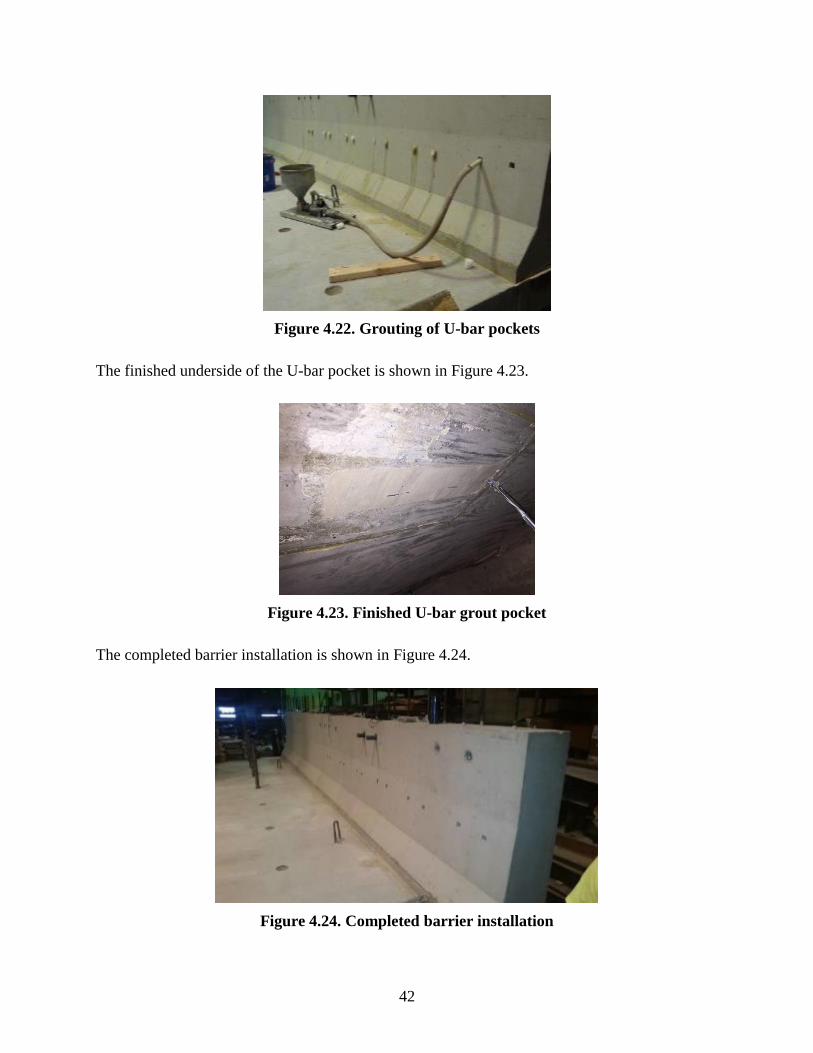
42
Figure 4.22. Grouting of U-bar pockets
The finished underside of the U-bar pocket is shown in Figure 4.23.
Figure 4.23. Finished U-bar grout pocket
The completed barrier installation is shown in Figure 4.24.
Figure 4.24. Completed barrier installation
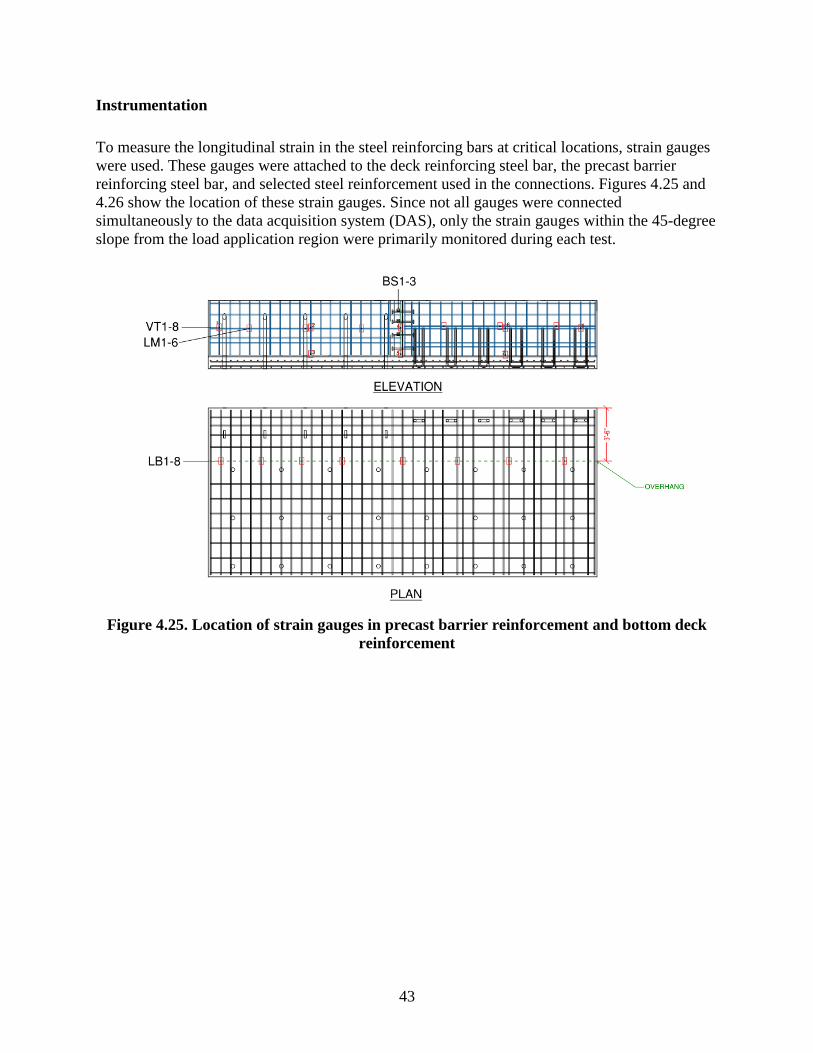
43
Instrumentation
To measure the longitudinal strain in the steel reinforcing bars at critical locations, strain gauges
were used. These gauges were attached to the deck reinforcing steel bar, the precast barrier
reinforcing steel bar, and selected steel reinforcement used in the connections. Figures 4.25 and
4.26 show the location of these strain gauges. Since not all gauges were connected
simultaneously to the data acquisition system (DAS), only the strain gauges within the 45-degree
slope from the load application region were primarily monitored during each test.
Figure 4.25. Location of strain gauges in precast barrier reinforcement and bottom deck
reinforcement
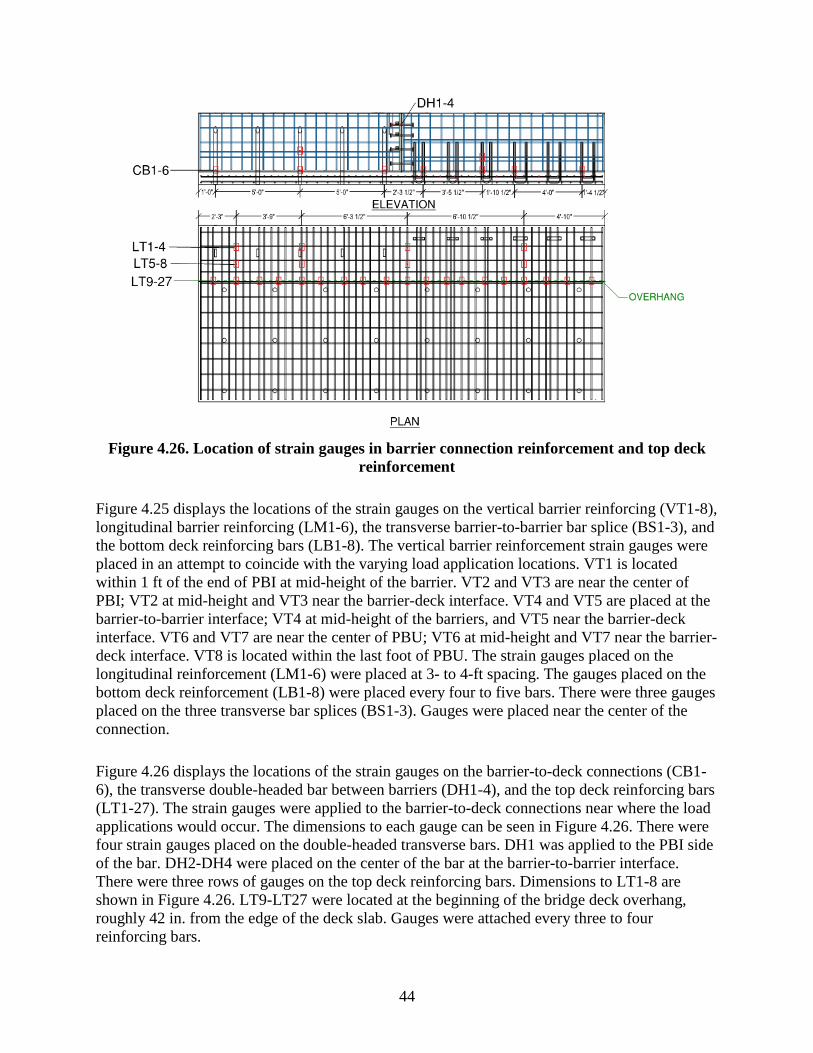
44
Figure 4.26. Location of strain gauges in barrier connection reinforcement and top deck
reinforcement
Figure 4.25 displays the locations of the strain gauges on the vertical barrier reinforcing (VT1-8),
longitudinal barrier reinforcing (LM1-6), the transverse barrier-to-barrier bar splice (BS1-3), and
the bottom deck reinforcing bars (LB1-8). The vertical barrier reinforcement strain gauges were
placed in an attempt to coincide with the varying load application locations. VT1 is located
within 1 ft of the end of PBI at mid-height of the barrier. VT2 and VT3 are near the center of
PBI; VT2 at mid-height and VT3 near the barrier-deck interface. VT4 and VT5 are placed at the
barrier-to-barrier interface; VT4 at mid-height of the barriers, and VT5 near the barrier-deck
interface. VT6 and VT7 are near the center of PBU; VT6 at mid-height and VT7 near the barrier-
deck interface. VT8 is located within the last foot of PBU. The strain gauges placed on the
longitudinal reinforcement (LM1-6) were placed at 3- to 4-ft spacing. The gauges placed on the
bottom deck reinforcement (LB1-8) were placed every four to five bars. There were three gauges
placed on the three transverse bar splices (BS1-3). Gauges were placed near the center of the
connection.
Figure 4.26 displays the locations of the strain gauges on the barrier-to-deck connections (CB1-
6), the transverse double-headed bar between barriers (DH1-4), and the top deck reinforcing bars
(LT1-27). The strain gauges were applied to the barrier-to-deck connections near where the load
applications would occur. The dimensions to each gauge can be seen in Figure 4.26. There were
four strain gauges placed on the double-headed transverse bars. DH1 was applied to the PBI side
of the bar. DH2-DH4 were placed on the center of the bar at the barrier-to-barrier interface.
There were three rows of gauges on the top deck reinforcing bars. Dimensions to LT1-8 are
shown in Figure 4.26. LT9-LT27 were located at the beginning of the bridge deck overhang,
roughly 42 in. from the edge of the deck slab. Gauges were attached every three to four
reinforcing bars.

45
In order to measure the movements of the barrier and bridge deck overhang during testing, string
potentiometers and LVDTs were used. String potentiometers were placed behind the barrier and
underneath the bridge deck overhang to measure displacements. LVDTs were placed on the front
and backside of the barrier to monitor the interface between the precast barrier and the deck.
Additional LVDTs were placed on top of the bridge deck and underneath to characterize the
critical curvature of the overhang. Figures 4.27 and 4.28 show the locations of all the devices
used to measure the movements of the unit while testing. A rotational device was also attached to
the outer face of the barriers to measure the rotation of the test unit during loading.
Figure 4.27. Location of string pots and LVDTs on front side of testing unit
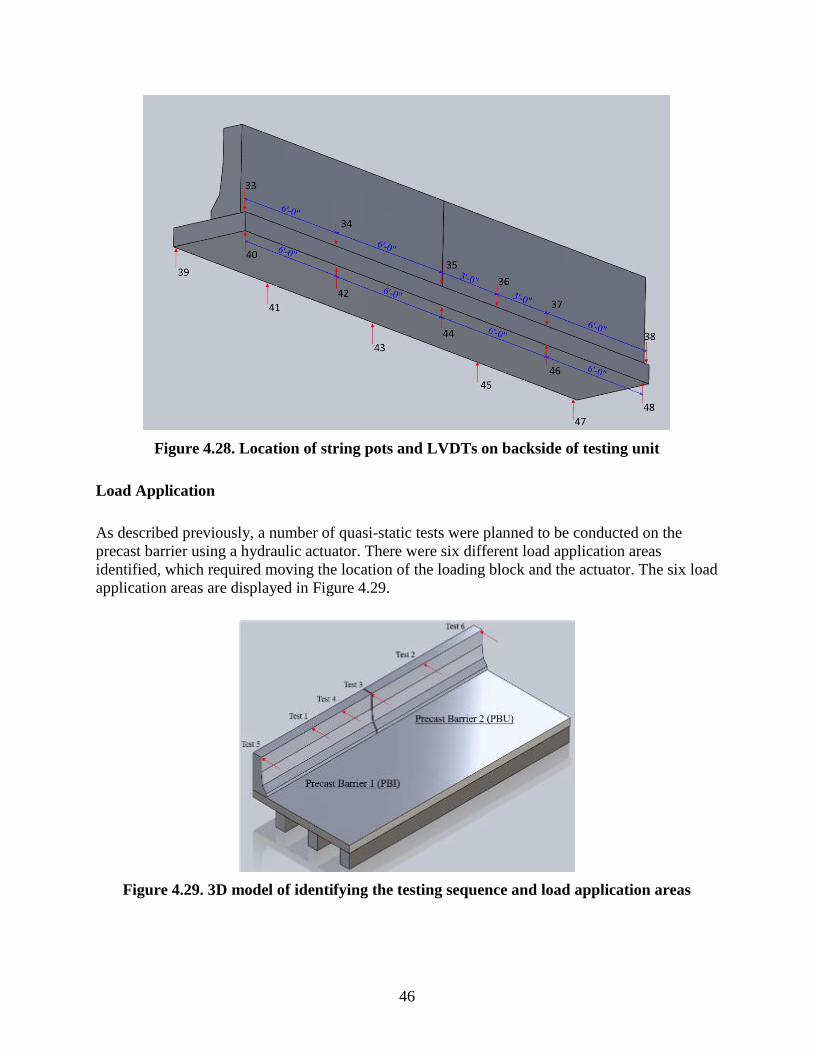
46
Figure 4.28. Location of string pots and LVDTs on backside of testing unit
Load Application
As described previously, a number of quasi-static tests were planned to be conducted on the
precast barrier using a hydraulic actuator. There were six different load application areas
identified, which required moving the location of the loading block and the actuator. The six load
application areas are displayed in Figure 4.29.
Figure 4.29. 3D model of identifying the testing sequence and load application areas

47
Each location had a differing testing purpose. The purpose of Test 1 was to examine the
connection between the barrier and the bridge deck using an inclined rod before establishing the
barrier-to-barrier connection. Similarly, Test 2 was conducted to inspect the barrier connection
involving U-bars independently. After the connection between the two barriers was completed
with additional reinforcement and grout, Test 3 was done to examine the connection between
barriers. Test 4 was located slightly off to the side of the barrier-to-barrier connection on the PBI
side to observe the force distribution across the barrier-to-barrier connection. The last two tests,
Test 5 and Test 6, were located on the free ends of PBI and PBU. The purpose of these tests was
to evaluate the connection performance at the free end of the barrier segments. Since neither the
deck nor the connection reinforcement was strengthened to simulate the end condition of a
bridge, these tests are required to provide 50 percent of the design strength.
For all tests, the actuator was made to react against a loading block that was rigidly secured to
the strong floor of the laboratory through the bridge deck. The load block was positioned on the
bridge deck away from deck overhang. For each test, the actuator was positioned such that the
load could be applied at the top of the barrier, creating the maximum moment demand at the
barrier-to-deck interface. With Test Level 4, the load is to be distributed over 3.5 ft, which was
accomplished using an H-beam attached to the top of the barrier as shown in Figure 4.30.
Figure 4.30. Laboratory test set-up
The loading block was anchored to the laboratory floor using post-tensioning applied vertically
at four locations. The actual test set up for used for Test 1 is shown in Figure 4.31.
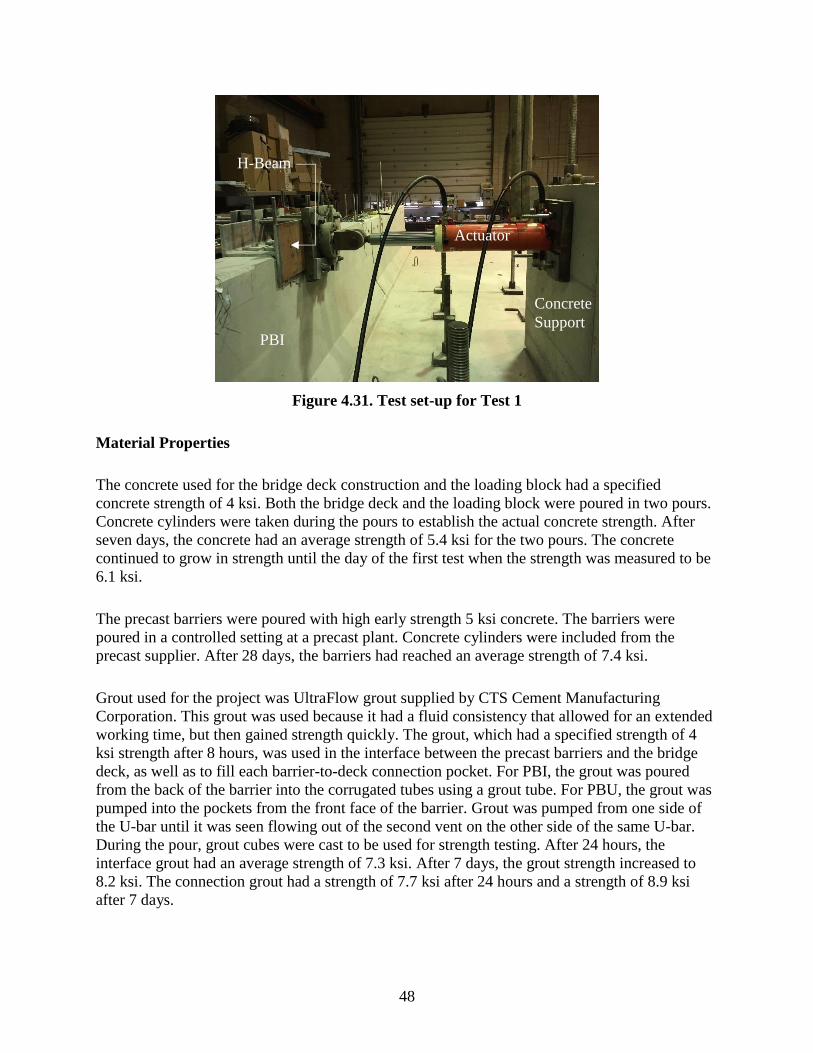
48
Figure 4.31. Test set-up for Test 1
Material Properties
The concrete used for the bridge deck construction and the loading block had a specified
concrete strength of 4 ksi. Both the bridge deck and the loading block were poured in two pours.
Concrete cylinders were taken during the pours to establish the actual concrete strength. After
seven days, the concrete had an average strength of 5.4 ksi for the two pours. The concrete
continued to grow in strength until the day of the first test when the strength was measured to be
6.1 ksi.
The precast barriers were poured with high early strength 5 ksi concrete. The barriers were
poured in a controlled setting at a precast plant. Concrete cylinders were included from the
precast supplier. After 28 days, the barriers had reached an average strength of 7.4 ksi.
Grout used for the project was UltraFlow grout supplied by CTS Cement Manufacturing
Corporation. This grout was used because it had a fluid consistency that allowed for an extended
working time, but then gained strength quickly. The grout, which had a specified strength of 4
ksi strength after 8 hours, was used in the interface between the precast barriers and the bridge
deck, as well as to fill each barrier-to-deck connection pocket. For PBI, the grout was poured
from the back of the barrier into the corrugated tubes using a grout tube. For PBU, the grout was
pumped into the pockets from the front face of the barrier. Grout was pumped from one side of
the U-bar until it was seen flowing out of the second vent on the other side of the same U-bar.
During the pour, grout cubes were cast to be used for strength testing. After 24 hours, the
interface grout had an average strength of 7.3 ksi. After 7 days, the grout strength increased to
8.2 ksi. The connection grout had a strength of 7.7 ksi after 24 hours and a strength of 8.9 ksi
after 7 days.
PBI
Concrete
Support
Actuator
H-Beam

49
The reinforcement used in the bridge deck and precast barriers had a specified yield strength of
60 ksi. Testing of the deck reinforcing bar strength led to the measured yield strength of 72.0 ksi
and the ultimate strength of 104.2 ksi. The reinforcing steel bar used for the U-bar connection in
PBU was stainless steel with a specified yield strength of 75 ksi. The #5 reinforcing steel used
for PBU had a measured yield strength of 70.2 ksi and ultimate strength of 114.3 ksi. The #7
stainless steel reinforcing steel used for PBU had a measured yield strength of 70.2 ksi and
ultimate strength of 112.1 ksi. The steel used for the inclined connection in PBI was Grade 60
reinforcing steel. Testing of this #8 reinforcement produced a yield strength of 67.5 ksi and
ultimate strength of 86.3 ksi.
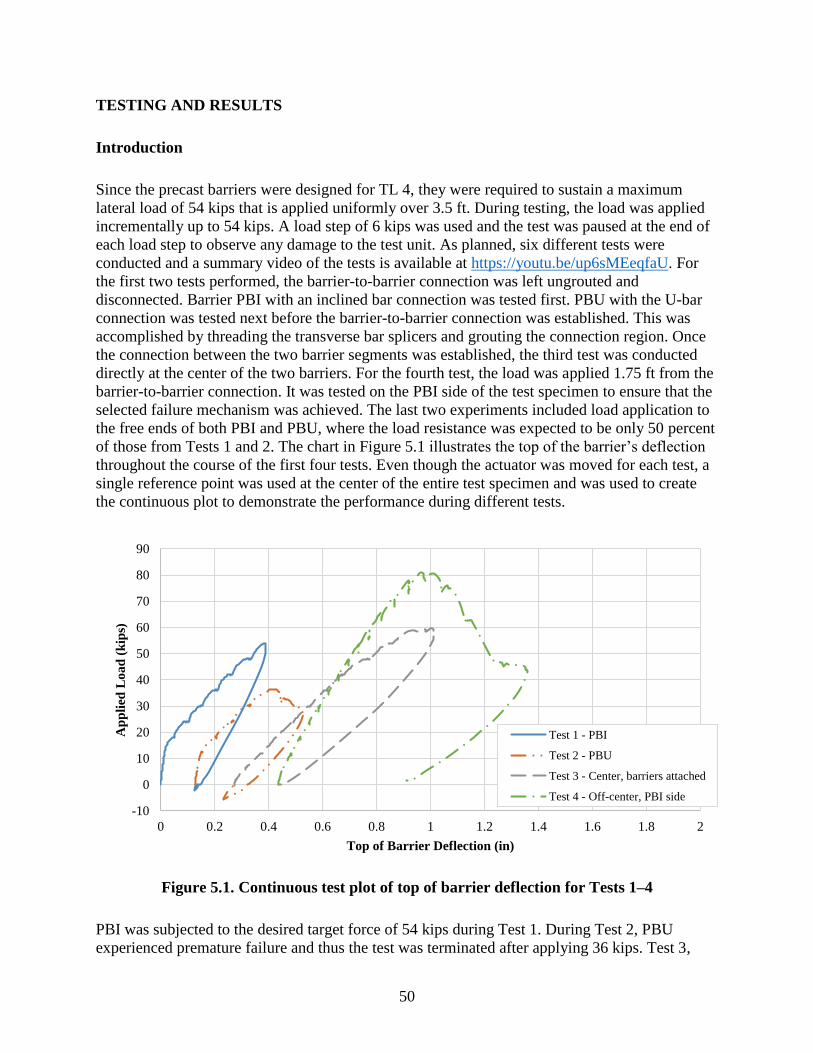
50
TESTING AND RESULTS
Introduction
Since the precast barriers were designed for TL 4, they were required to sustain a maximum
lateral load of 54 kips that is applied uniformly over 3.5 ft. During testing, the load was applied
incrementally up to 54 kips. A load step of 6 kips was used and the test was paused at the end of
each load step to observe any damage to the test unit. As planned, six different tests were
conducted and a summary video of the tests is available at https://youtu.be/up6sMEeqfaU. For
the first two tests performed, the barrier-to-barrier connection was left ungrouted and
disconnected. Barrier PBI with an inclined bar connection was tested first. PBU with the U-bar
connection was tested next before the barrier-to-barrier connection was established. This was
accomplished by threading the transverse bar splicers and grouting the connection region. Once
the connection between the two barrier segments was established, the third test was conducted
directly at the center of the two barriers. For the fourth test, the load was applied 1.75 ft from the
barrier-to-barrier connection. It was tested on the PBI side of the test specimen to ensure that the
selected failure mechanism was achieved. The last two experiments included load application to
the free ends of both PBI and PBU, where the load resistance was expected to be only 50 percent
of those from Tests 1 and 2. The chart in Figure 5.1 illustrates the top of the barrier’s deflection
throughout the course of the first four tests. Even though the actuator was moved for each test, a
single reference point was used at the center of the entire test specimen and was used to create
the continuous plot to demonstrate the performance during different tests.
Figure 5.1. Continuous test plot of top of barrier deflection for Tests 1–4
PBI was subjected to the desired target force of 54 kips during Test 1. During Test 2, PBU
experienced premature failure and thus the test was terminated after applying 36 kips. Test 3,
-10
0
10
20
30
40
50
60
70
80
90
0 0.2 0.4 0.6 0.8 1 1.2 1.4 1.6 1.8 2
Ap
pli
ed L
oa
d (
kip
s)
Top of Barrier Deflection (in)
Test 1 - PBI
Test 2 - PBU
Test 3 - Center, barriers attached
Test 4 - Off-center, PBI side
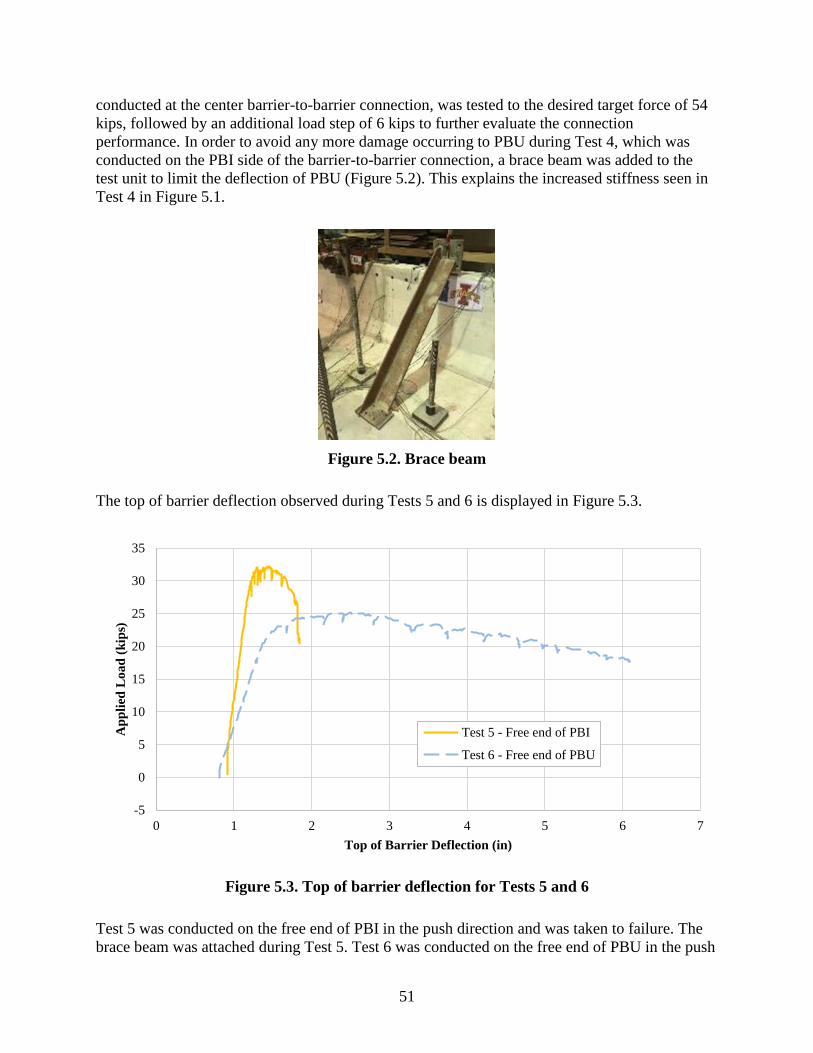
51
conducted at the center barrier-to-barrier connection, was tested to the desired target force of 54
kips, followed by an additional load step of 6 kips to further evaluate the connection
performance. In order to avoid any more damage occurring to PBU during Test 4, which was
conducted on the PBI side of the barrier-to-barrier connection, a brace beam was added to the
test unit to limit the deflection of PBU (Figure 5.2). This explains the increased stiffness seen in
Test 4 in Figure 5.1.
Figure 5.2. Brace beam
The top of barrier deflection observed during Tests 5 and 6 is displayed in Figure 5.3.
Figure 5.3. Top of barrier deflection for Tests 5 and 6
Test 5 was conducted on the free end of PBI in the push direction and was taken to failure. The
brace beam was attached during Test 5. Test 6 was conducted on the free end of PBU in the push
-5
0
5
10
15
20
25
30
35
0 1 2 3 4 5 6 7
Ap
pli
ed L
oa
d (
kip
s)
Top of Barrier Deflection (in)
Test 5 - Free end of PBI
Test 6 - Free end of PBU
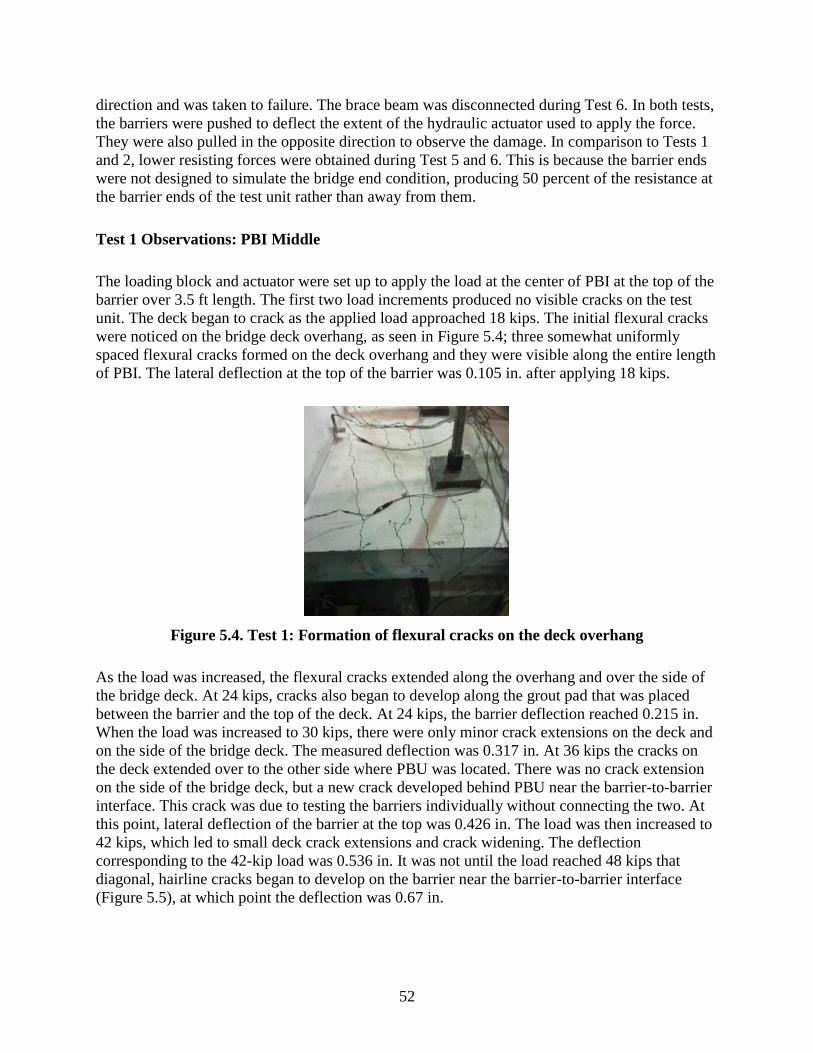
52
direction and was taken to failure. The brace beam was disconnected during Test 6. In both tests,
the barriers were pushed to deflect the extent of the hydraulic actuator used to apply the force.
They were also pulled in the opposite direction to observe the damage. In comparison to Tests 1
and 2, lower resisting forces were obtained during Test 5 and 6. This is because the barrier ends
were not designed to simulate the bridge end condition, producing 50 percent of the resistance at
the barrier ends of the test unit rather than away from them.
Test 1 Observations: PBI Middle
The loading block and actuator were set up to apply the load at the center of PBI at the top of the
barrier over 3.5 ft length. The first two load increments produced no visible cracks on the test
unit. The deck began to crack as the applied load approached 18 kips. The initial flexural cracks
were noticed on the bridge deck overhang, as seen in Figure 5.4; three somewhat uniformly
spaced flexural cracks formed on the deck overhang and they were visible along the entire length
of PBI. The lateral deflection at the top of the barrier was 0.105 in. after applying 18 kips.
Figure 5.4. Test 1: Formation of flexural cracks on the deck overhang
As the load was increased, the flexural cracks extended along the overhang and over the side of
the bridge deck. At 24 kips, cracks also began to develop along the grout pad that was placed
between the barrier and the top of the deck. At 24 kips, the barrier deflection reached 0.215 in.
When the load was increased to 30 kips, there were only minor crack extensions on the deck and
on the side of the bridge deck. The measured deflection was 0.317 in. At 36 kips the cracks on
the deck extended over to the other side where PBU was located. There was no crack extension
on the side of the bridge deck, but a new crack developed behind PBU near the barrier-to-barrier
interface. This crack was due to testing the barriers individually without connecting the two. At
this point, lateral deflection of the barrier at the top was 0.426 in. The load was then increased to
42 kips, which led to small deck crack extensions and crack widening. The deflection
corresponding to the 42-kip load was 0.536 in. It was not until the load reached 48 kips that
diagonal, hairline cracks began to develop on the barrier near the barrier-to-barrier interface
(Figure 5.5), at which point the deflection was 0.67 in.

53
Figure 5.5. Test 1 (PBI middle) barrier cracks
Finally, the load was increased to the full 54 kips. The crack on the back of the deck behind PBU
widened and the cracks on the side of the deck had small extensions. No new cracks were seen
on the barrier. The deflection of PBI at this point was 0.81 in., the majority of which was due to
the deck rotation and the concentrated crack developed at the bottom of the barrier along the
grout interface.
After the loading was complete, the crack widths were measured. The thickest cracks appeared
on the backside of the bridge deck behind PBU (Figure 5.6).
Figure 5.6. Formation of crack on backside of test unit during Test 1
The maximum width of this crack was 0.083 in. The widest crack measured on the bridge deck
was 0.02 in. The cracks that developed within the grout between the deck and the barrier on the
front side of the barrier reached 0.03 in. On the side of the deck, the maximum crack width was
about 0.007 in.
Once all the testing and measuring was complete, PBI was unloaded. At zero load, PBI exhibited
a residual displacement of 0.27 in. A small load was applied in the opposite direction and
unloaded, but the residual displacement remained unchanged. No new cracks were seen during
the pull direction loading. At this point, the test was terminated.
PBU PBI
Backside of barrier-to-
barrier interface
Deck

54
Test 1 Results: PBI Middle
During testing, string potentiometers, DCDTs, LED sensors, and strain gauges were used to
record data and measurements. A string pot was placed behind the barrier along the direction of
the load application to measure the lateral deflection of PBI. This deflection was plotted against
the applied load and can be seen in Figure 5.7, where the push direction of loading and
displacements was taken as positive.
Figure 5.7. Force displacement for Test 1 – PBI
Within this figure, the testing location is also displayed. The barrier location denoted as zero is
the center of the entire test specimen where the two barrier segments were eventually connected.
At 14.6 kips the stiffness of the system was reduced, which corresponded with the formation of
first cracks on the deck. (This is also shown in Figure 5.7.) Once the deck experienced cracking,
the response followed a path reflecting the influence of cracked stiffness of the system and the
deflection increased steadily with each load increment. There was no indication of yielding of
the reinforcement. This is consistent with the design in that the barriers remained elastic for the
design load of 54 kips.
Behind the barrier, along with the string potentiometers measuring the barrier deflection, were
two other string potentiometers. They were placed 6 ft away from the center of the load
application on both ends of the barrier. In Figure 5.8, the deflection of the entire length of PBI at
each load increment is shown.
6 kips
12 kips
18 kips
24 kips
30 kips
36 kips
42 kips
48 kips
54 kips
First Deck
Cracking
-10
0
10
20
30
40
50
60
-0.1 0 0.1 0.2 0.3 0.4 0.5 0.6 0.7 0.8 0.9
Lo
ad
(k
ips)
Top Barrier Displacement (in)
Peak Values Deck Cracking
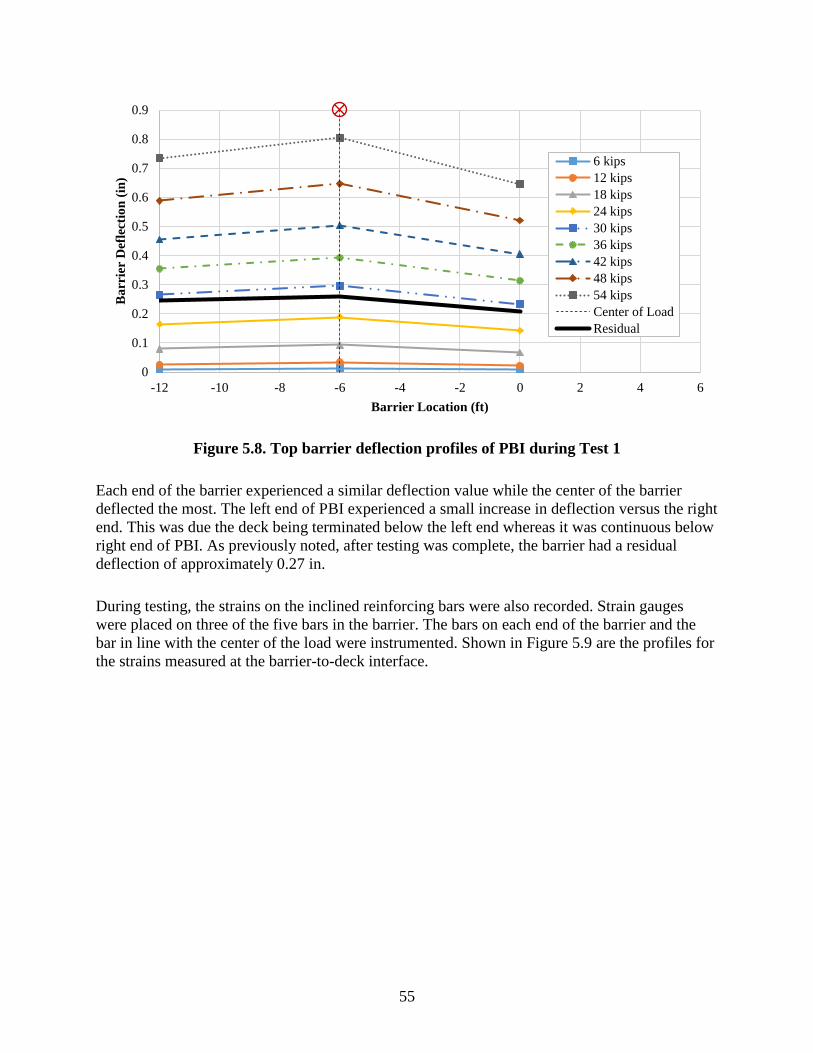
55
Figure 5.8. Top barrier deflection profiles of PBI during Test 1
Each end of the barrier experienced a similar deflection value while the center of the barrier
deflected the most. The left end of PBI experienced a small increase in deflection versus the right
end. This was due the deck being terminated below the left end whereas it was continuous below
right end of PBI. As previously noted, after testing was complete, the barrier had a residual
deflection of approximately 0.27 in.
During testing, the strains on the inclined reinforcing bars were also recorded. Strain gauges
were placed on three of the five bars in the barrier. The bars on each end of the barrier and the
bar in line with the center of the load were instrumented. Shown in Figure 5.9 are the profiles for
the strains measured at the barrier-to-deck interface.
0
0.1
0.2
0.3
0.4
0.5
0.6
0.7
0.8
0.9
-12 -10 -8 -6 -4 -2 0 2 4 6
Ba
rrie
r D
efle
ctio
n (
in)
Barrier Location (ft)
6 kips
12 kips
18 kips
24 kips
30 kips
36 kips
42 kips
48 kips
54 kips
Center of Load
Residual
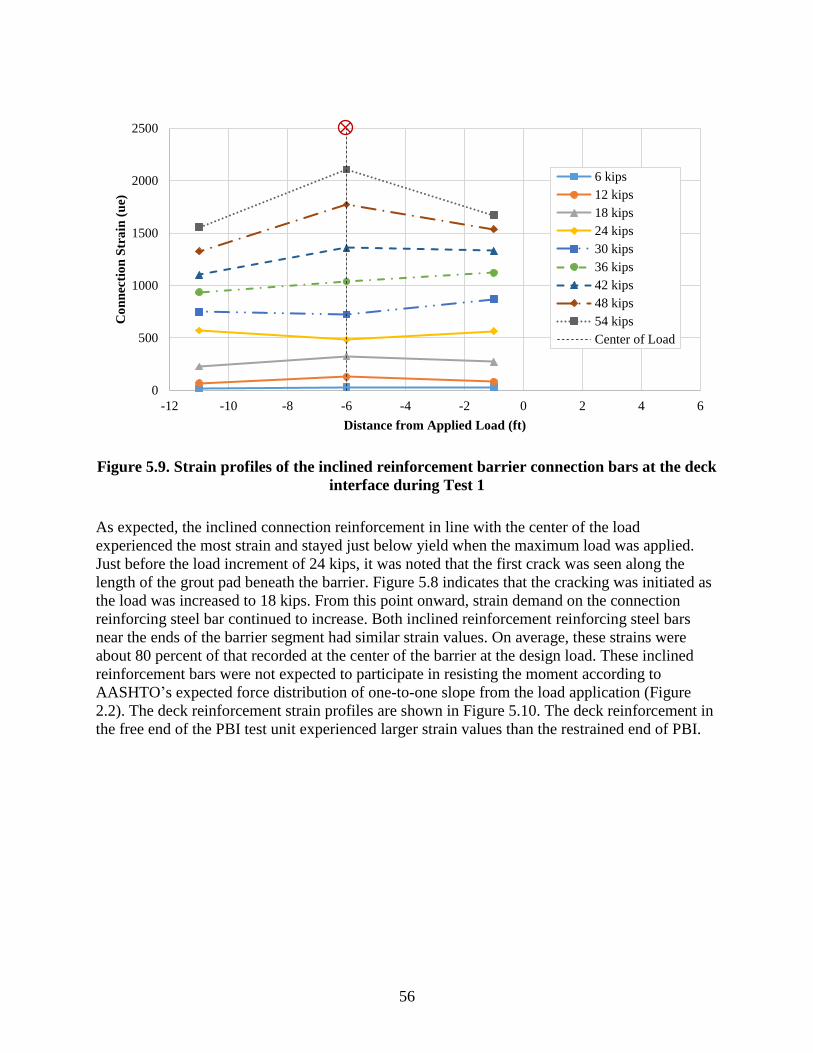
56
Figure 5.9. Strain profiles of the inclined reinforcement barrier connection bars at the deck
interface during Test 1
As expected, the inclined connection reinforcement in line with the center of the load
experienced the most strain and stayed just below yield when the maximum load was applied.
Just before the load increment of 24 kips, it was noted that the first crack was seen along the
length of the grout pad beneath the barrier. Figure 5.8 indicates that the cracking was initiated as
the load was increased to 18 kips. From this point onward, strain demand on the connection
reinforcing steel bar continued to increase. Both inclined reinforcement reinforcing steel bars
near the ends of the barrier segment had similar strain values. On average, these strains were
about 80 percent of that recorded at the center of the barrier at the design load. These inclined
reinforcement bars were not expected to participate in resisting the moment according to
AASHTO’s expected force distribution of one-to-one slope from the load application (Figure
2.2). The deck reinforcement strain profiles are shown in Figure 5.10. The deck reinforcement in
the free end of the PBI test unit experienced larger strain values than the restrained end of PBI.
0
500
1000
1500
2000
2500
-12 -10 -8 -6 -4 -2 0 2 4 6
Co
nn
ecti
on
Str
ain
(u
e)
Distance from Applied Load (ft)
6 kips
12 kips
18 kips
24 kips
30 kips
36 kips
42 kips
48 kips
54 kips
Center of Load

57
Figure 5.10. Strain profiles of the deck reinforcement at the front barrier interface during
Test 1
The measured barrier displacement at the top, which reached a maximum value of 0.81 in. during
Test 1, included the flexural deflection of the barrier and those due to the rotation of the barrier
at the deck interface and the barrier deflection resulting from the rotation that the deck overhang
experienced. As shown in Figure 5.11, the barrier’s flexural deflection was only about 3.5
percent of the total deflection at 0.028 in. of the 0.81 in., and the deflection of the barrier due to
formation of a crack at the barrier-to-deck interface accounted for 17.3 percent at 0.140 in.
0
500
1000
1500
2000
2500
-12 -10 -8 -6 -4 -2 0 2 4 6
Dec
k R
ein
forc
emen
t S
tra
in (
ue)
Barrier Location (ft)
6 kips
12 kips
18 kips
24 kips
30 kips
36 kips
42 kips
48 kips
54 kips
Center of Load
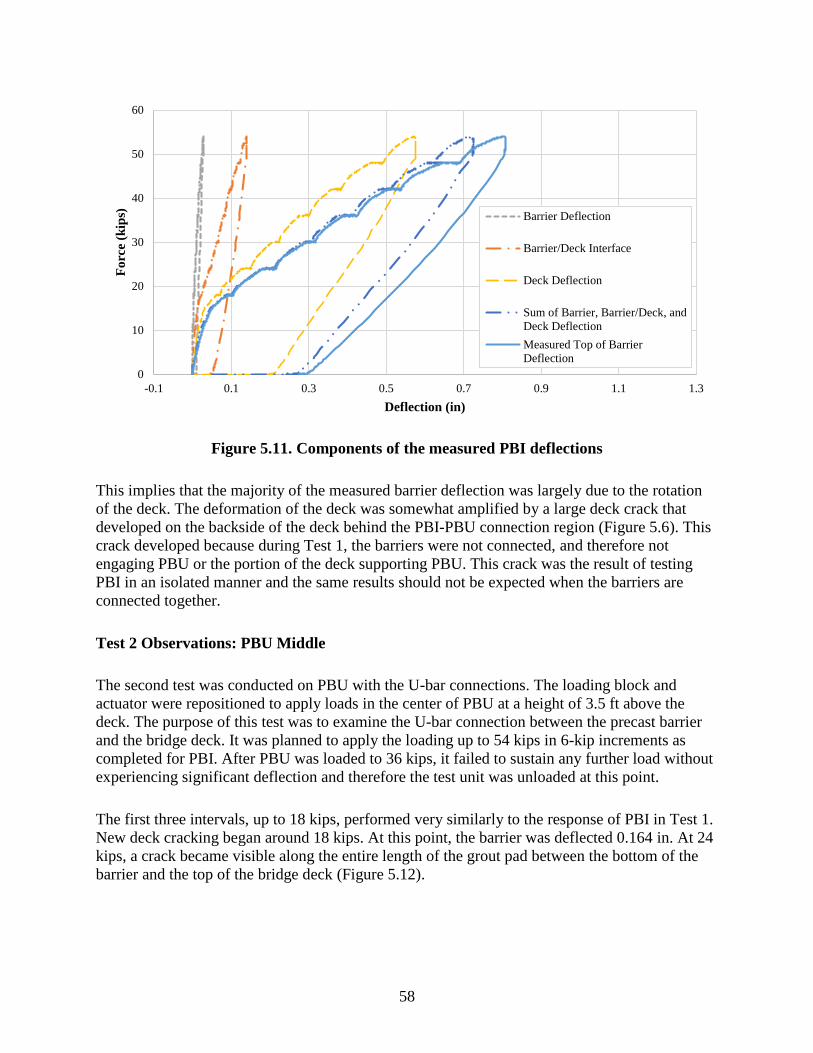
58
Figure 5.11. Components of the measured PBI deflections
This implies that the majority of the measured barrier deflection was largely due to the rotation
of the deck. The deformation of the deck was somewhat amplified by a large deck crack that
developed on the backside of the deck behind the PBI-PBU connection region (Figure 5.6). This
crack developed because during Test 1, the barriers were not connected, and therefore not
engaging PBU or the portion of the deck supporting PBU. This crack was the result of testing
PBI in an isolated manner and the same results should not be expected when the barriers are
connected together.
Test 2 Observations: PBU Middle
The second test was conducted on PBU with the U-bar connections. The loading block and
actuator were repositioned to apply loads in the center of PBU at a height of 3.5 ft above the
deck. The purpose of this test was to examine the U-bar connection between the precast barrier
and the bridge deck. It was planned to apply the loading up to 54 kips in 6-kip increments as
completed for PBI. After PBU was loaded to 36 kips, it failed to sustain any further load without
experiencing significant deflection and therefore the test unit was unloaded at this point.
The first three intervals, up to 18 kips, performed very similarly to the response of PBI in Test 1.
New deck cracking began around 18 kips. At this point, the barrier was deflected 0.164 in. At 24
kips, a crack became visible along the entire length of the grout pad between the bottom of the
barrier and the top of the bridge deck (Figure 5.12).
0
10
20
30
40
50
60
-0.1 0.1 0.3 0.5 0.7 0.9 1.1 1.3
Fo
rce
(kip
s)
Deflection (in)
Barrier Deflection
Barrier/Deck Interface
Deck Deflection
Sum of Barrier, Barrier/Deck, and
Deck Deflection
Measured Top of Barrier
Deflection

59
Figure 5.12. Crack at the barrier-to-deck interface in PBU during Test 2
The existing cracks continued to widen up until about 36 kips. Some softening in the system was
observed when the load was about 36 kips and the barrier began to experience large
displacements. The test was paused and unloaded after the barrier deflection reached 0.8 in.
After unloading from 36 kips, the barrier was subjected to 4 kips in the pull direction in an
attempt to reposition the barrier to the residual displacement obtained from PBI. The final resting
deflection of PBU after the pull direction loading and unloading was complete was 0.3 in.
Test 2 Results: PBU Middle
The applied force versus the barrier deflection obtained for PBU is shown in Figure 5.13, in
which the positive values correspond to push direction loads and displacements.
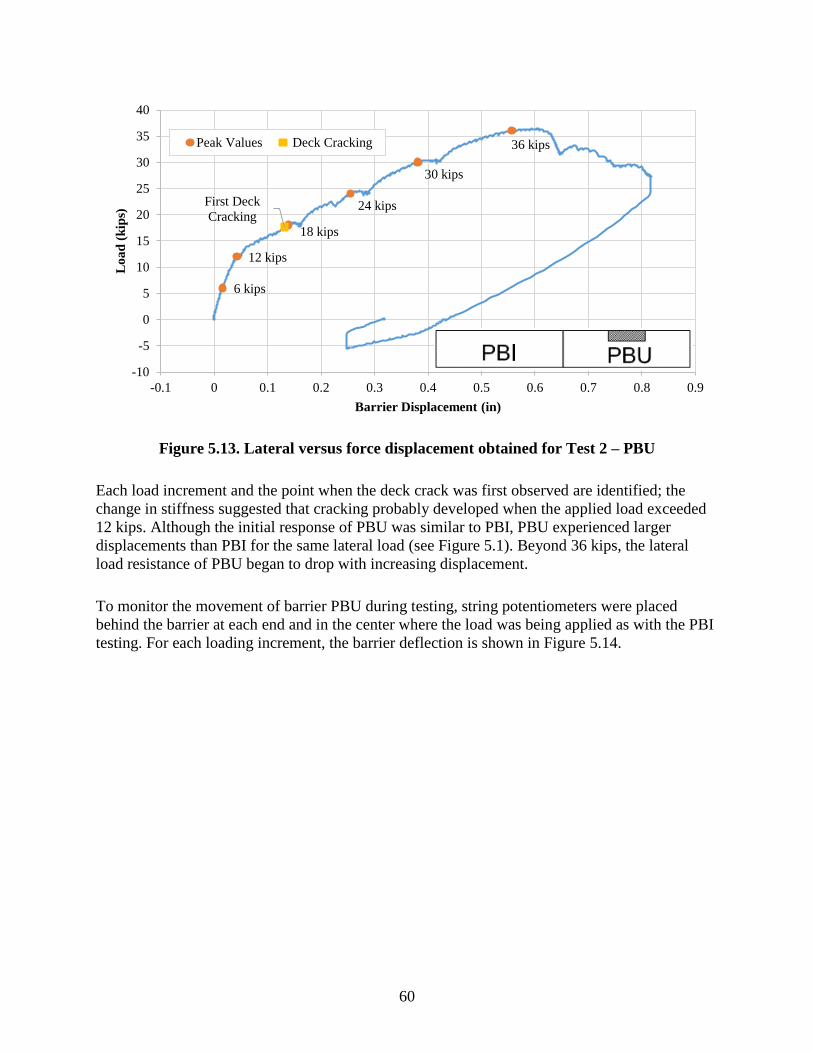
60
Figure 5.13. Lateral versus force displacement obtained for Test 2 – PBU
Each load increment and the point when the deck crack was first observed are identified; the
change in stiffness suggested that cracking probably developed when the applied load exceeded
12 kips. Although the initial response of PBU was similar to PBI, PBU experienced larger
displacements than PBI for the same lateral load (see Figure 5.1). Beyond 36 kips, the lateral
load resistance of PBU began to drop with increasing displacement.
To monitor the movement of barrier PBU during testing, string potentiometers were placed
behind the barrier at each end and in the center where the load was being applied as with the PBI
testing. For each loading increment, the barrier deflection is shown in Figure 5.14.
6 kips
12 kips
18 kips
24 kips
30 kips
36 kips
First Deck
Cracking
-10
-5
0
5
10
15
20
25
30
35
40
-0.1 0 0.1 0.2 0.3 0.4 0.5 0.6 0.7 0.8 0.9
Lo
ad
(k
ips)
Barrier Displacement (in)
Peak Values Deck Cracking

61
Figure 5.14. Lateral top deflection of PBU during Test 2
Behind the center of the force, the barrier deflected the most, as expected. The free end of the
barrier where the deck was terminated in this figure was at x = 12 ft. The end with the barrier-to-
barrier connection where the deck was continuous is indicated with x = 0. As with PBI, the free
end of PBU experienced a small increase in deflection versus the fixed end. However, the
difference in barrier deflection between the free end and the fixed end was not as large as was
observed for PBI.
Figure 5.15 shows the strain in the U-bar connection at the barrier-to-deck interface.
0
0.1
0.2
0.3
0.4
0.5
0.6
0 2 4 6 8 10 12 14 16
Ba
rrie
r D
efle
ctio
n (
in)
Barrier Location (ft)
6 kips
12 kips
18 kips
24 kips
30 kips
36 kips
Center of Load
Residual

62
Figure 5.15. Strain in the U-bar at the deck to barrier interface during Test 2
The left side of the graph used a #7 reinforcement U-bar while the right side included a bundle of
two #5 reinforcement bars at each connection location. The #7 U-bars were near the end of the
barrier adjacent to the barrier-to-barrier connection and they experienced less strain than the
bundled #5 U-bars, which were positioned on the other half closer to the free end of the test unit.
Compared to Test 1 conducted on PBI, the strain values recorded in the connection
reinforcement during Test 2 were similar up to the lateral load of 36 kips. The maximum
recorded deck displacement was 0.28 in. at this point. The deck reinforcement strain profiles are
shown in Figure 5.16. The deck reinforcement in the free end of the PBU test unit experienced
larger strain values than the restrained end of PBU.
-200
0
200
400
600
800
1000
1200
1400
0 2 4 6 8 10 12 14 16
Co
nn
ecti
on
Str
ain
(u
e)
Barrier Location (ft)
6 kips
12 kips
18 kips
24 kips
30 kips
36 kips
Center of Load

63
Figure 5.16. Strain profiles of the deck reinforcement at the front barrier interface during
Test 2
The deflection of PBU recorded during Test 2 also included the flexural deflection of the barrier
and the deflections due to the rotation of the barrier at the deck interface and the rotation that the
deck overhang experienced. These components are depicted in Figure 5.17 along with the
experimental value.
0
200
400
600
800
1000
1200
0 2 4 6 8 10 12 14 16
Dec
k R
ein
forc
emen
t S
tra
in (
ue)
Barrier Location (ft)
6 kips
12 kips
18 kips
24 kips
30 kips
36 kips
Center of Load

64
Figure 5.17. Deflection of components
Although the maximum measured lateral deflection of PBU was 0.8 in., the actual barrier’s
deflection accounted for 2.1 percent of the deflection at 0.017 in. and the deflection at the barrier
and deck interface accounted for 20.3 percent at 0.162 in. As with Test 1, the majority of the
measured barrier deflection was mainly due to the rotation of the deck overhang. The large
deflection and rotation recorded were partly due to the damage that occurred to the deck behind
the barrier as previously discussed.
Test 3 Observations: At Barrier-to-Barrier Connection
After the connection between the two barriers was established, the third test was conducted on
the precast barrier system between the two barriers, PBI and PBU. The loading block and
actuator were set up to apply loads over a 3.5 ft length in the center of the entire test unit. The
purpose of this test was to examine the connection between the precast barriers. In the early
stages of testing, no new cracks developed, but old cracks began to open up. As the load
approached 30 kips, a new crack appeared on the side of the bridge deck on the PBI side. It
wasn’t until 48 kips were reached that cracks began to appear on the PBI barrier itself. These
were diagonal cracks running in the opposite direction to the ones formed during Test 1 (see
Figure 5.18).
-10
-5
0
5
10
15
20
25
30
35
40
-0.1 0.1 0.3 0.5 0.7 0.9 1.1 1.3
Fo
rce
(kip
s)
Deflection (in)
Barrier Deflection
Barrier/Deck Interface
Deck Deflection
Sum of Barrier, Barrier/Deck, and
Deck DeflectionMeasured Top of Barrier
Deflection
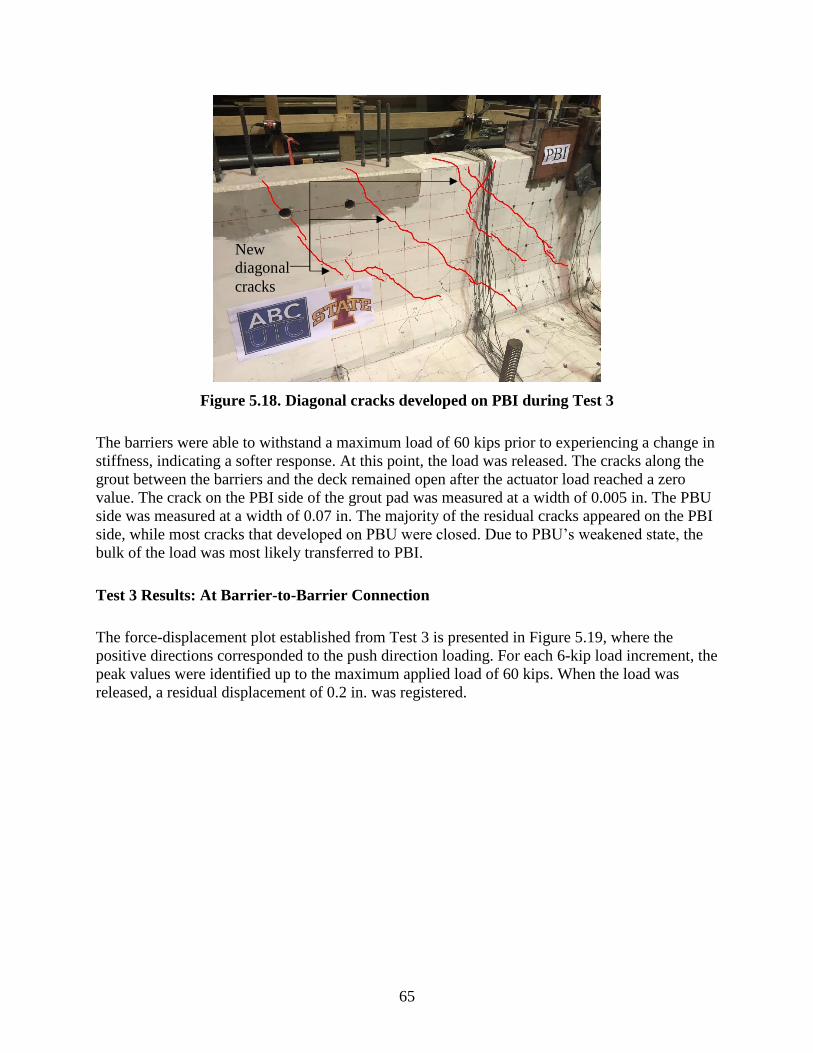
65
Figure 5.18. Diagonal cracks developed on PBI during Test 3
The barriers were able to withstand a maximum load of 60 kips prior to experiencing a change in
stiffness, indicating a softer response. At this point, the load was released. The cracks along the
grout between the barriers and the deck remained open after the actuator load reached a zero
value. The crack on the PBI side of the grout pad was measured at a width of 0.005 in. The PBU
side was measured at a width of 0.07 in. The majority of the residual cracks appeared on the PBI
side, while most cracks that developed on PBU were closed. Due to PBU’s weakened state, the
bulk of the load was most likely transferred to PBI.
Test 3 Results: At Barrier-to-Barrier Connection
The force-displacement plot established from Test 3 is presented in Figure 5.19, where the
positive directions corresponded to the push direction loading. For each 6-kip load increment, the
peak values were identified up to the maximum applied load of 60 kips. When the load was
released, a residual displacement of 0.2 in. was registered.
New
diagonal
cracks
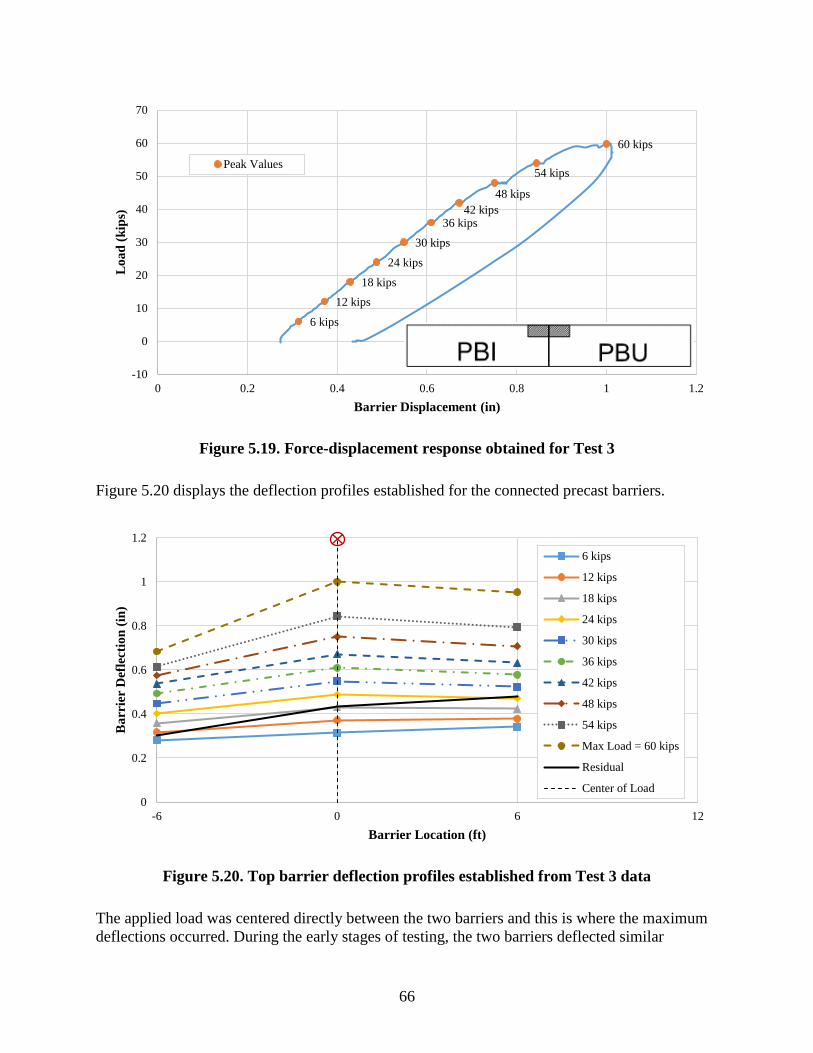
66
Figure 5.19. Force-displacement response obtained for Test 3
Figure 5.20 displays the deflection profiles established for the connected precast barriers.
Figure 5.20. Top barrier deflection profiles established from Test 3 data
The applied load was centered directly between the two barriers and this is where the maximum
deflections occurred. During the early stages of testing, the two barriers deflected similar
6 kips
12 kips
18 kips
24 kips
30 kips
36 kips42 kips
48 kips
54 kips
60 kips
-10
0
10
20
30
40
50
60
70
0 0.2 0.4 0.6 0.8 1 1.2
Lo
ad
(k
ips)
Barrier Displacement (in)
Peak Values
0
0.2
0.4
0.6
0.8
1
1.2
-6 0 6 12
Ba
rrie
r D
efle
ctio
n (
in)
Barrier Location (ft)
6 kips
12 kips
18 kips
24 kips
30 kips
36 kips
42 kips
48 kips
54 kips
Max Load = 60 kips
Residual
Center of Load

67
amounts at 6 ft away from the connection (i.e., at the center of each barrier). As the loading
approached 48 kips, PBU began to experience larger lateral deflections and these were closer to
the values recorded at the barrier-to-barrier connection, implying that the entire PBU was
rotating at the base as the load was applied. The maximum deflection recorded during this test
was 0.73 in. The residual deflections shown in this figure show 0.4 in. at the barrier-to-barrier
connection and 0.4 in. at the PBU. This reported value at the barrier-to-barrier center is higher
than that which can be inferred from Figure 5.19 because Figure 5.20 reports the absolute values
from the beginning of the test. The higher residual displacement obtained at the center of PBU
compared with that obtained at the center of the barrier-to-barrier connection was another
indication that U-bars anchored into deck were failing.
The strain recorded in the connection reinforcement at the deck interface is shown in Figure
5.21.
Figure 5.21. Strain in barrier-to-deck connection interface during Test 3
It is seen that the inclined reinforcing bars in PBI experienced significantly more strain than the
U-bar reinforcement in PBU. This confirms the theory that the majority of the load that was
applied at the center of the test unit was resisted by PBI and transferred to the deck, mainly in the
left half of the specimen.
The strain recorded on the longitudinal, double-headed ties connecting the two precast barriers is
shown in Figure 5.22.
0
500
1000
1500
2000
2500
3000
-1 0 1 2 3 4 5 6 7 8
Co
nn
ecti
on
Str
ain
(u
e)
Barrier Locaion (ft)
6 kips
12 kips
18 kips
24 kips
30 kips
36 kips
42 kips
48 kips
54 kips
Max Load = 60 kips
Center of Load
PBI PBU

68
Figure 5.22. Strain in the center of the longitudinal double-headed ties in barrier-to-barrier
connection during Test 3
Strain gauges were placed on the center of the double-headed tie at the barrier-to-barrier
interface. As the distance from the load increased, the strain values decreased. The top double-
headed tie was closer to the applied load and therefore had the highest strain readings—about
twice those recorded closer to the deck interface. The strain demand on the ties was generally
low because the beam used to distribute the load assisted in transferring the loads to the barriers.
The strain in the transverse double-headed ties used in the barrier-to-barrier connection is shown
in Figure 5.23. As with the longitudinal ties, the transverse ties decreased in strain as the distance
from the applied load increased. The magnitude of strains was very small.
-3
-2.5
-2
-1.5
-1
-0.5
0
0 100 200 300 400 500 600 700 800 900 1000
Ver
tica
l D
ista
nce
fro
m L
oa
d (
ft)
Strain (ue)
6 kips
12 kips
18 kips
24 kips
30 kips
36 kips
42 kips
48 kips
54 kips
Max Load = 60 kips
Center of Load
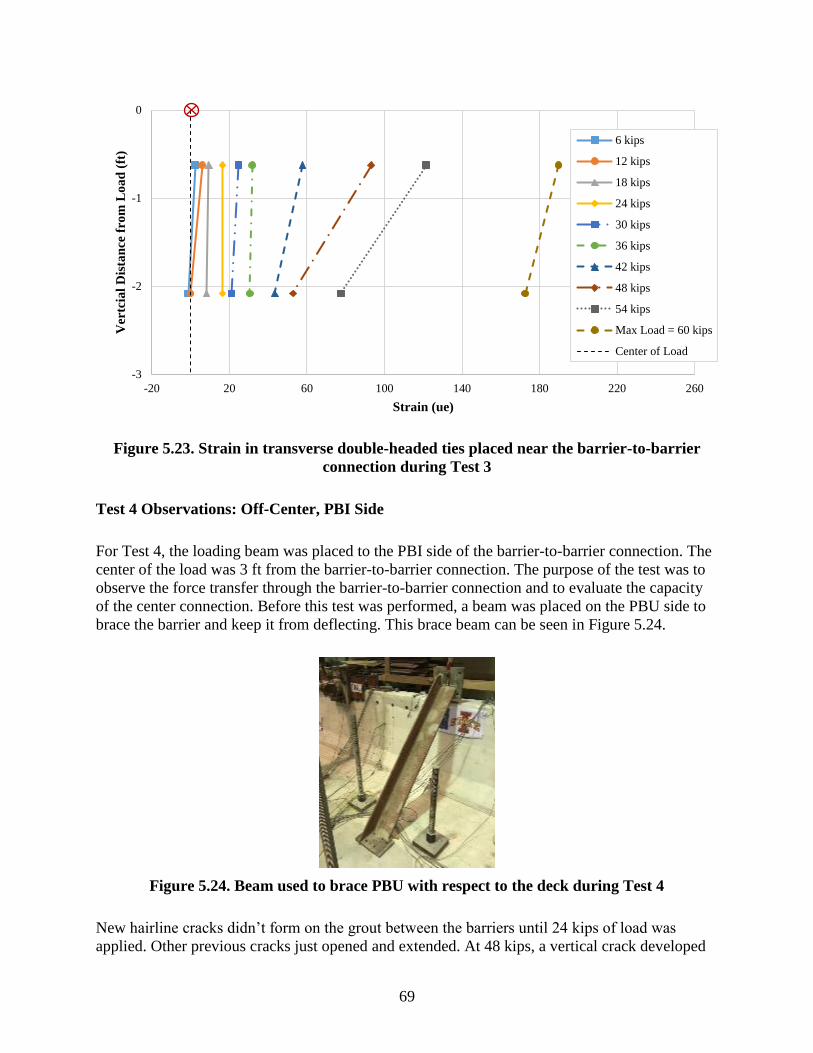
69
Figure 5.23. Strain in transverse double-headed ties placed near the barrier-to-barrier
connection during Test 3
Test 4 Observations: Off-Center, PBI Side
For Test 4, the loading beam was placed to the PBI side of the barrier-to-barrier connection. The
center of the load was 3 ft from the barrier-to-barrier connection. The purpose of the test was to
observe the force transfer through the barrier-to-barrier connection and to evaluate the capacity
of the center connection. Before this test was performed, a beam was placed on the PBU side to
brace the barrier and keep it from deflecting. This brace beam can be seen in Figure 5.24.
Figure 5.24. Beam used to brace PBU with respect to the deck during Test 4
New hairline cracks didn’t form on the grout between the barriers until 24 kips of load was
applied. Other previous cracks just opened and extended. At 48 kips, a vertical crack developed
-3
-2
-1
0
-20 20 60 100 140 180 220 260
Ver
tcia
l D
ista
nce
fro
m L
oa
d (
ft)
Strain (ue)
6 kips
12 kips
18 kips
24 kips
30 kips
36 kips
42 kips
48 kips
54 kips
Max Load = 60 kips
Center of Load

70
on the front face of the grout between the barriers, while another vertical crack formed on the
back of the barrier-to-barrier grout at 54 kips. This crack started at the bottom of the barrier. As
the loads were increased, cracks continued to extend vertically. At 72 kips, new cracks
developed on the top of the barrier-to-barrier grout. The load was increased up to 81 kips before
it started dropping. The test continued until the deflection of 1.75 in. was recorded. A large crack
developed along the barrier under the loading beam (Figure 5.25), and the barrier-to-barrier grout
broke all the way along the top to the back (Figure 5.26).
Figure 5.25. Cracking under the loading beam on PBI during Test 4
Loading beam
Vertical crack in
barrier-to-barrier grout
Crack below
loading beam
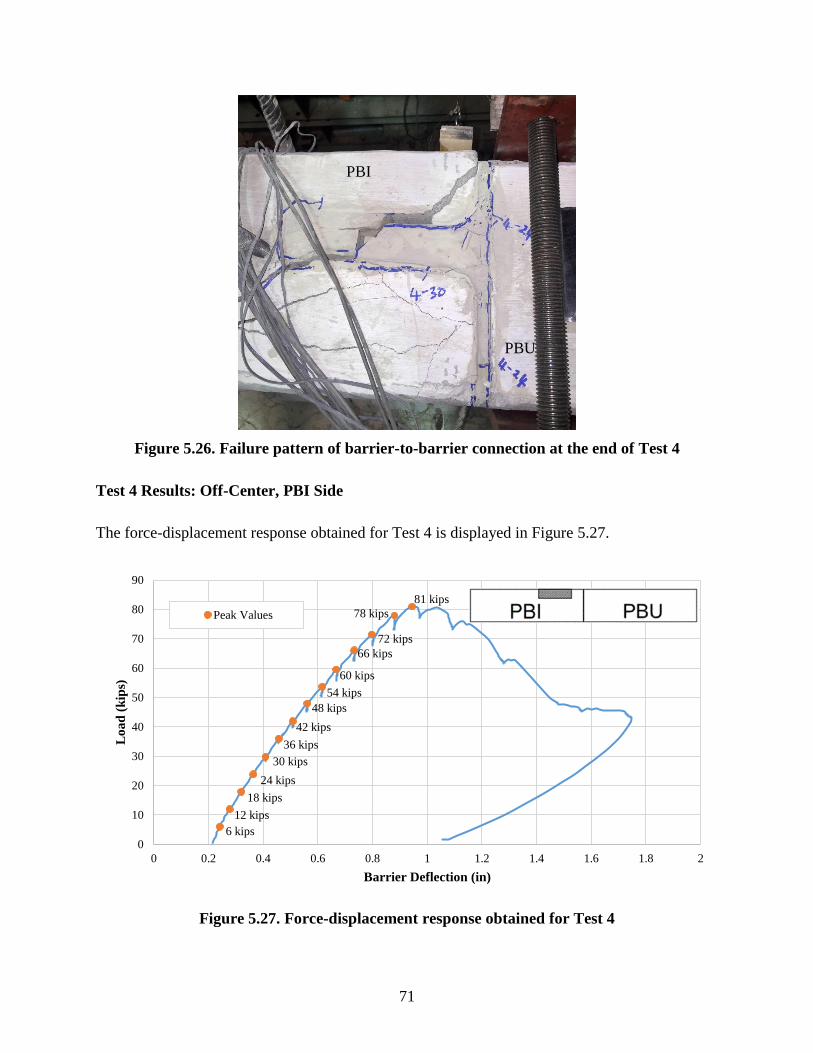
71
Figure 5.26. Failure pattern of barrier-to-barrier connection at the end of Test 4
Test 4 Results: Off-Center, PBI Side
The force-displacement response obtained for Test 4 is displayed in Figure 5.27.
Figure 5.27. Force-displacement response obtained for Test 4
6 kips
12 kips
18 kips
24 kips
30 kips
36 kips
42 kips
48 kips
54 kips
60 kips
66 kips
72 kips
78 kips
81 kips
0
10
20
30
40
50
60
70
80
90
0 0.2 0.4 0.6 0.8 1 1.2 1.4 1.6 1.8 2
Lo
ad
(k
ips)
Barrier Deflection (in)
Peak Values
PBI
PBU
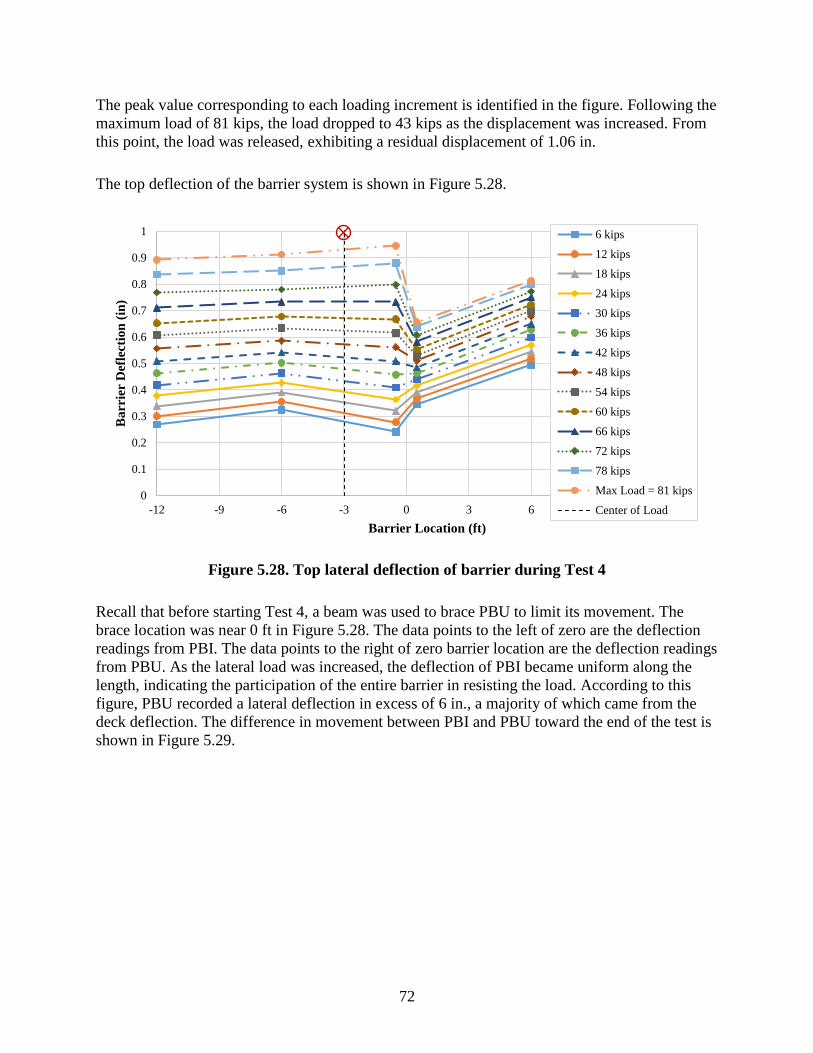
72
The peak value corresponding to each loading increment is identified in the figure. Following the
maximum load of 81 kips, the load dropped to 43 kips as the displacement was increased. From
this point, the load was released, exhibiting a residual displacement of 1.06 in.
The top deflection of the barrier system is shown in Figure 5.28.
Figure 5.28. Top lateral deflection of barrier during Test 4
Recall that before starting Test 4, a beam was used to brace PBU to limit its movement. The
brace location was near 0 ft in Figure 5.28. The data points to the left of zero are the deflection
readings from PBI. The data points to the right of zero barrier location are the deflection readings
from PBU. As the lateral load was increased, the deflection of PBI became uniform along the
length, indicating the participation of the entire barrier in resisting the load. According to this
figure, PBU recorded a lateral deflection in excess of 6 in., a majority of which came from the
deck deflection. The difference in movement between PBI and PBU toward the end of the test is
shown in Figure 5.29.
0
0.1
0.2
0.3
0.4
0.5
0.6
0.7
0.8
0.9
1
-12 -9 -6 -3 0 3 6 9 12
Ba
rrie
r D
efle
ctio
n (
in)
Barrier Location (ft)
6 kips
12 kips
18 kips
24 kips
30 kips
36 kips
42 kips
48 kips
54 kips
60 kips
66 kips
72 kips
78 kips
Max Load = 81 kips
Center of Load

73
Figure 5.29. Difference in barrier movement at barrier-to-barrier connection at the
maximum load during Test 4
The strain in the barrier-to-deck connections during Test 4 is shown in Figure 5.30.
Figure 5.30. Strain in barrier connection reinforcement at the deck interface during Test 4
The inclined reinforcing steel in PBI experienced similar strains throughout the length of PBI
while the U-bar connection in PBU experienced noticeably lower strain values. This image also
demonstrates that the force is dispersed at an angle lower than the expected 45°, meaning more
connection reinforcement and a longer deck length would participate in resisting loads compared
to that stipulated from the current code recommendation.
The strain recorded on the longitudinal, double-headed ties connecting the two precast barriers is
shown in Figure 5.31.
0
200
400
600
800
1000
1200
1400
1600
1800
2000
-6 -5 -4 -3 -2 -1 0 1 2 3 4
Co
nn
ecti
on
Str
ain
(u
e)
Barrier Location (ft)
6 kips
12 kips
18 kips
24 kips
30 kips
36 kips
42 kips
48 kips
54 kips
60 kips
66 kips
72 kips
78 kips
Max Load = 81 kips
Center of Load
Brace Beam
PBI
PBU
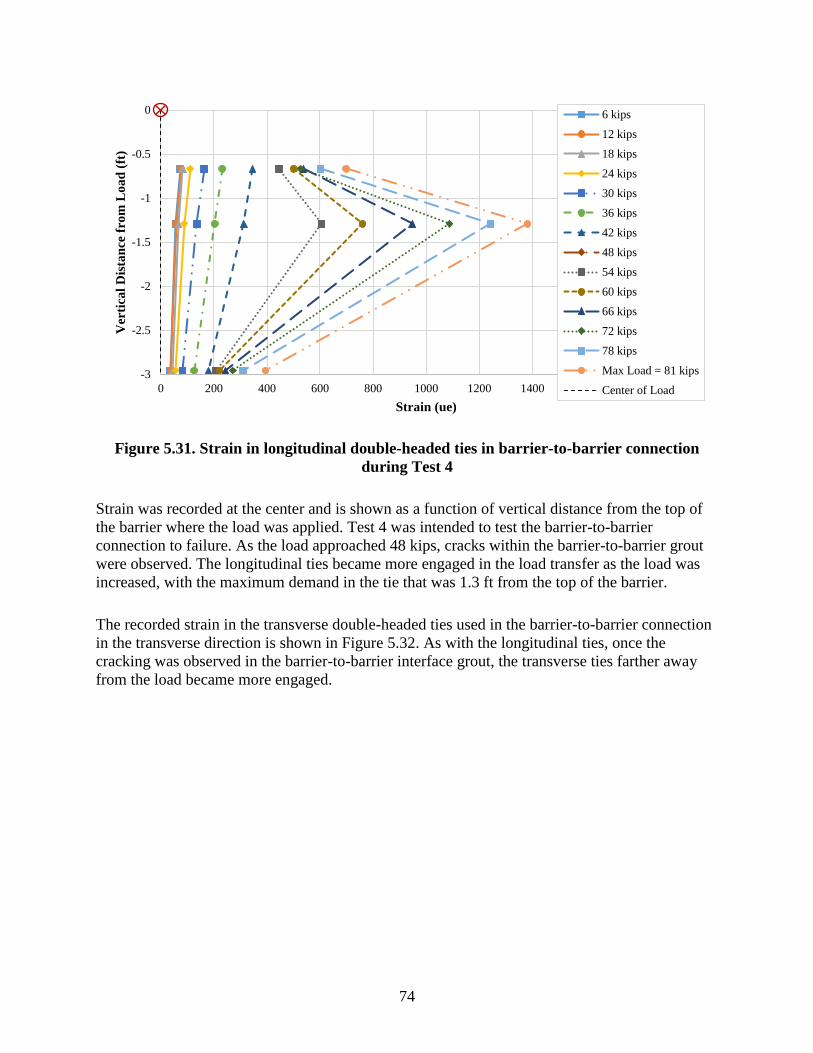
74
Figure 5.31. Strain in longitudinal double-headed ties in barrier-to-barrier connection
during Test 4
Strain was recorded at the center and is shown as a function of vertical distance from the top of
the barrier where the load was applied. Test 4 was intended to test the barrier-to-barrier
connection to failure. As the load approached 48 kips, cracks within the barrier-to-barrier grout
were observed. The longitudinal ties became more engaged in the load transfer as the load was
increased, with the maximum demand in the tie that was 1.3 ft from the top of the barrier.
The recorded strain in the transverse double-headed ties used in the barrier-to-barrier connection
in the transverse direction is shown in Figure 5.32. As with the longitudinal ties, once the
cracking was observed in the barrier-to-barrier interface grout, the transverse ties farther away
from the load became more engaged.
-3
-2.5
-2
-1.5
-1
-0.5
0
0 200 400 600 800 1000 1200 1400 1600 1800 2000
Ver
tica
l D
ista
nce
fro
m L
oa
d (
ft)
Strain (ue)
6 kips
12 kips
18 kips
24 kips
30 kips
36 kips
42 kips
48 kips
54 kips
60 kips
66 kips
72 kips
78 kips
Max Load = 81 kips
Center of Load

75
Figure 5.32. Strain in transverse double-headed ties during Test 4
Test 5 Observations: End of PBI
For Test 5, the loading beam was moved to the free end of PBI. The brace beam was kept in
place for this test. The purpose of the test was to observe the failure of PBI with loading at the
free end of the barrier and evaluate the connection performance that included the inclined
reinforcement to connect the barrier to the deck. Recall that this free end was not designed to
simulate the end of the barrier condition.
As loading was applied to the barrier, the cracks that developed earlier on the barrier and deck
began to open and widen. When the load increment approached 30 kips, the barrier began to fail
to endure any further loading. This is consistent with the expectation that the end region as
designed should support 50 percent of the design load. Testing was continued under
displacement control. During this phase of testing, the crack along the barrier-to-deck grout
interface was visible along a length of up to 9 ft from the free end of the barrier. The inclined
cracks on the barrier were widespread on the entire barrier. Loading continued from 1.25-in.
deflection to 4.85 in. when the actuator stroke was at its maximum, shown in Figure 5.33.
-3
-2.5
-2
-1.5
-1
-0.5
0
0 200 400 600 800 1000 1200 1400
Ver
tica
l D
istn
ace
fro
m L
oa
d (
ft)
Strain (ue)
6 kips
12 kips
18 kips
24 kips
30 kips
36 kips
42 kips
48 kips
54 kips
60 kips
66 kips
72 kips
78 kips
Max Load = 81 kips
Center of Load
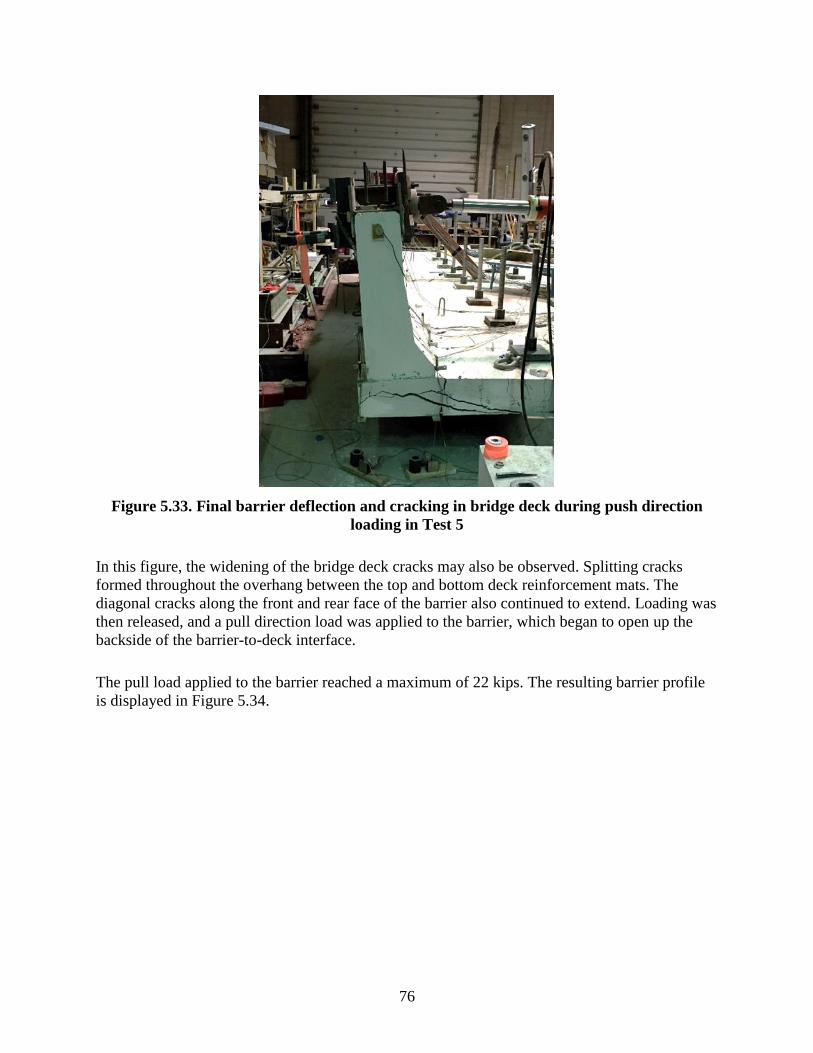
76
Figure 5.33. Final barrier deflection and cracking in bridge deck during push direction
loading in Test 5
In this figure, the widening of the bridge deck cracks may also be observed. Splitting cracks
formed throughout the overhang between the top and bottom deck reinforcement mats. The
diagonal cracks along the front and rear face of the barrier also continued to extend. Loading was
then released, and a pull direction load was applied to the barrier, which began to open up the
backside of the barrier-to-deck interface.
The pull load applied to the barrier reached a maximum of 22 kips. The resulting barrier profile
is displayed in Figure 5.34.
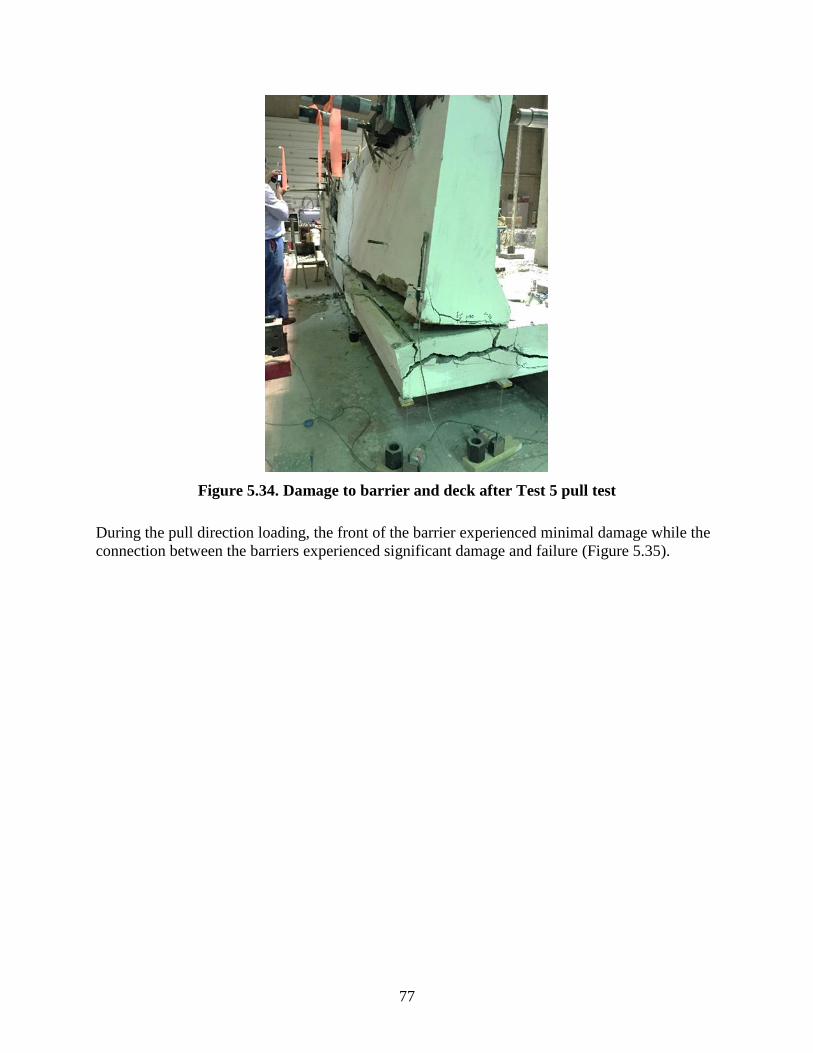
77
Figure 5.34. Damage to barrier and deck after Test 5 pull test
During the pull direction loading, the front of the barrier experienced minimal damage while the
connection between the barriers experienced significant damage and failure (Figure 5.35).
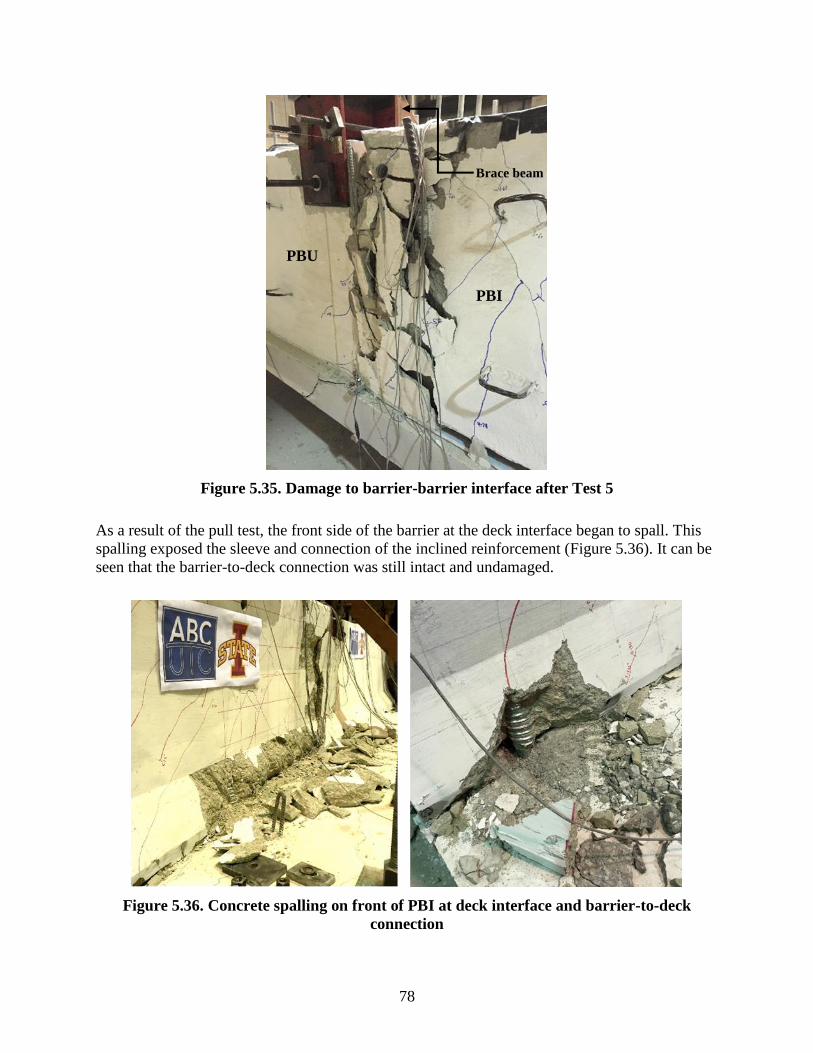
78
Figure 5.35. Damage to barrier-barrier interface after Test 5
As a result of the pull test, the front side of the barrier at the deck interface began to spall. This
spalling exposed the sleeve and connection of the inclined reinforcement (Figure 5.36). It can be
seen that the barrier-to-deck connection was still intact and undamaged.
Figure 5.36. Concrete spalling on front of PBI at deck interface and barrier-to-deck
connection
PBI
PBU
Brace beam
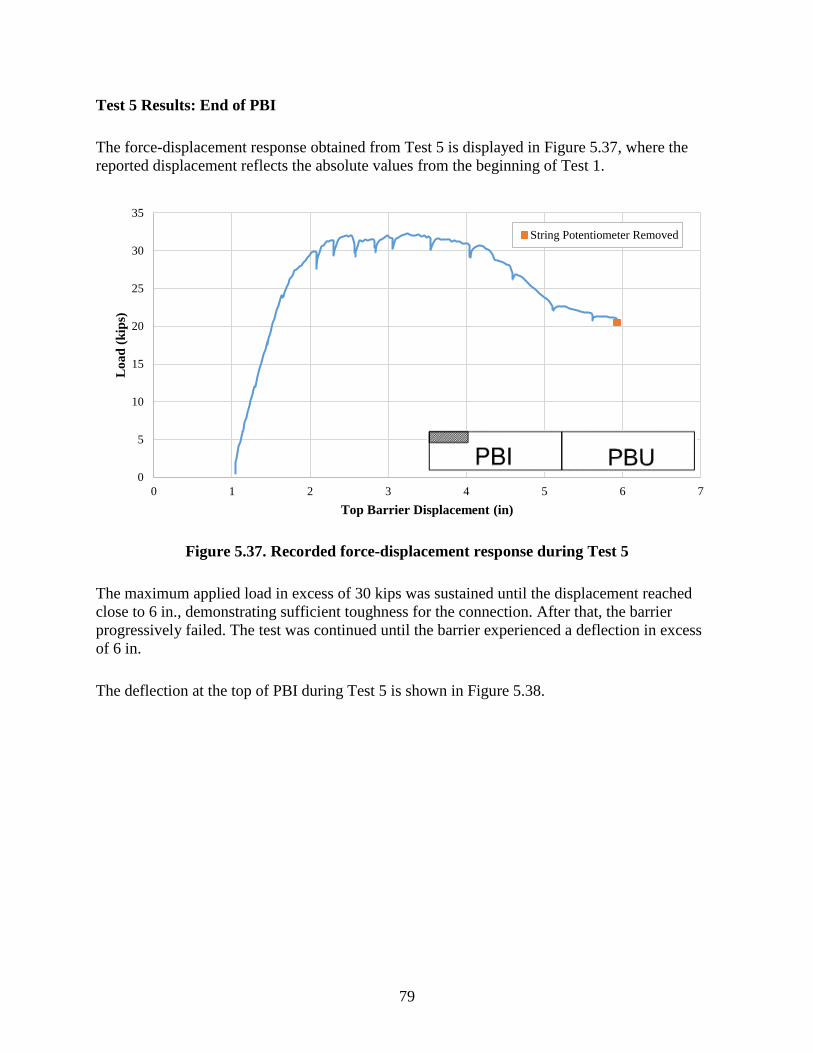
79
Test 5 Results: End of PBI
The force-displacement response obtained from Test 5 is displayed in Figure 5.37, where the
reported displacement reflects the absolute values from the beginning of Test 1.
Figure 5.37. Recorded force-displacement response during Test 5
The maximum applied load in excess of 30 kips was sustained until the displacement reached
close to 6 in., demonstrating sufficient toughness for the connection. After that, the barrier
progressively failed. The test was continued until the barrier experienced a deflection in excess
of 6 in.
The deflection at the top of PBI during Test 5 is shown in Figure 5.38.
0
5
10
15
20
25
30
35
0 1 2 3 4 5 6 7
Lo
ad
(k
ips)
Top Barrier Displacement (in)
String Potentiometer Removed
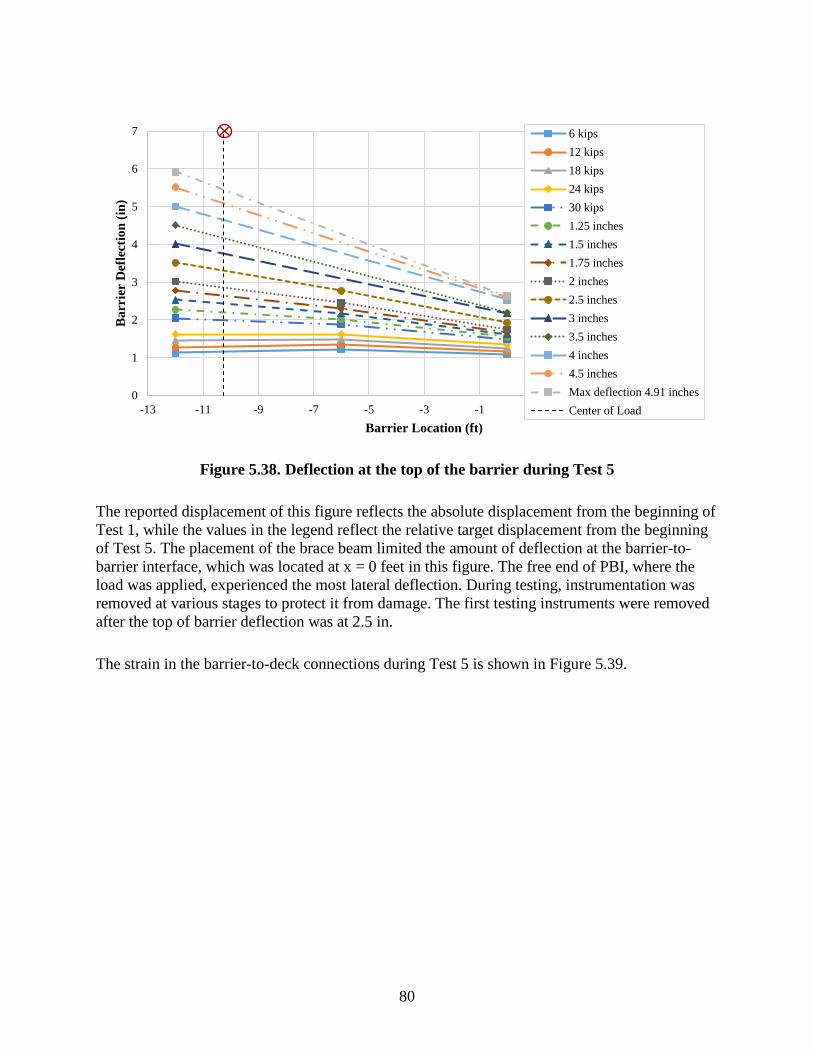
80
Figure 5.38. Deflection at the top of the barrier during Test 5
The reported displacement of this figure reflects the absolute displacement from the beginning of
Test 1, while the values in the legend reflect the relative target displacement from the beginning
of Test 5. The placement of the brace beam limited the amount of deflection at the barrier-to-
barrier interface, which was located at x = 0 feet in this figure. The free end of PBI, where the
load was applied, experienced the most lateral deflection. During testing, instrumentation was
removed at various stages to protect it from damage. The first testing instruments were removed
after the top of barrier deflection was at 2.5 in.
The strain in the barrier-to-deck connections during Test 5 is shown in Figure 5.39.
0
1
2
3
4
5
6
7
-13 -11 -9 -7 -5 -3 -1 1 3 5 7
Ba
rrie
r D
efle
ctio
n (
in)
Barrier Location (ft)
6 kips
12 kips
18 kips
24 kips
30 kips
1.25 inches
1.5 inches
1.75 inches
2 inches
2.5 inches
3 inches
3.5 inches
4 inches
4.5 inches
Max deflection 4.91 inches
Center of Load
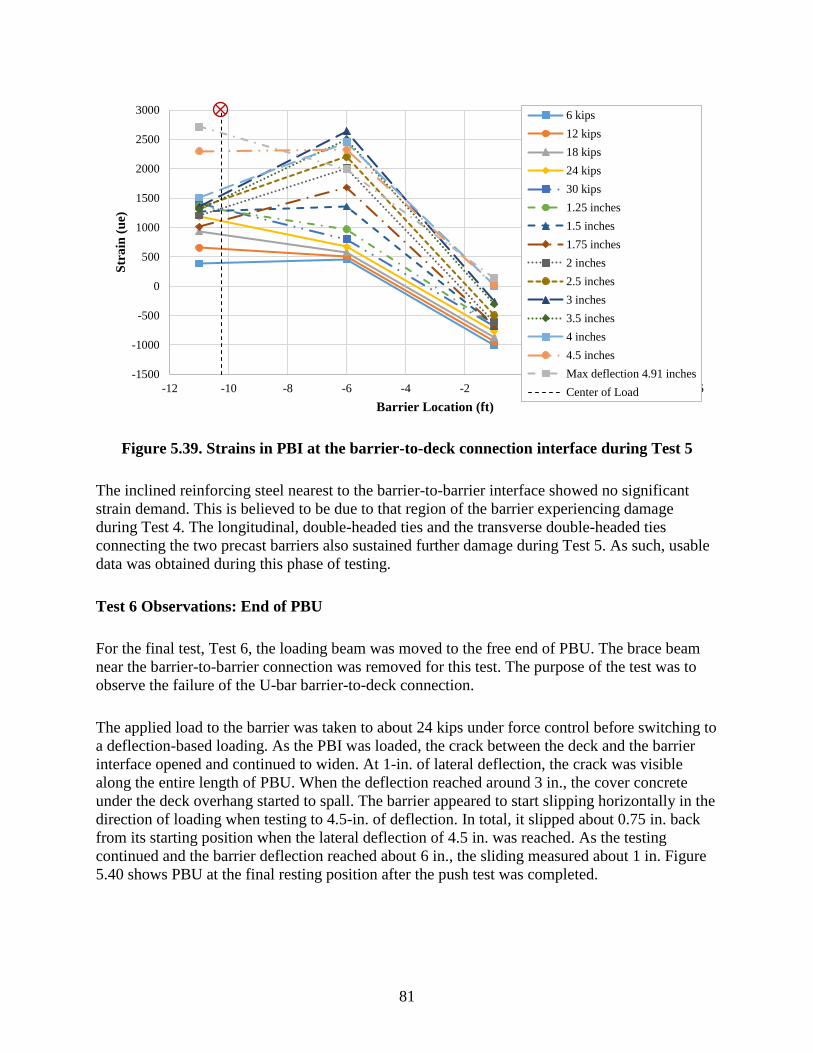
81
Figure 5.39. Strains in PBI at the barrier-to-deck connection interface during Test 5
The inclined reinforcing steel nearest to the barrier-to-barrier interface showed no significant
strain demand. This is believed to be due to that region of the barrier experiencing damage
during Test 4. The longitudinal, double-headed ties and the transverse double-headed ties
connecting the two precast barriers also sustained further damage during Test 5. As such, usable
data was obtained during this phase of testing.
Test 6 Observations: End of PBU
For the final test, Test 6, the loading beam was moved to the free end of PBU. The brace beam
near the barrier-to-barrier connection was removed for this test. The purpose of the test was to
observe the failure of the U-bar barrier-to-deck connection.
The applied load to the barrier was taken to about 24 kips under force control before switching to
a deflection-based loading. As the PBI was loaded, the crack between the deck and the barrier
interface opened and continued to widen. At 1-in. of lateral deflection, the crack was visible
along the entire length of PBU. When the deflection reached around 3 in., the cover concrete
under the deck overhang started to spall. The barrier appeared to start slipping horizontally in the
direction of loading when testing to 4.5-in. of deflection. In total, it slipped about 0.75 in. back
from its starting position when the lateral deflection of 4.5 in. was reached. As the testing
continued and the barrier deflection reached about 6 in., the sliding measured about 1 in. Figure
5.40 shows PBU at the final resting position after the push test was completed.
-1500
-1000
-500
0
500
1000
1500
2000
2500
3000
-12 -10 -8 -6 -4 -2 0 2 4 6
Str
ain
(u
e)
Barrier Location (ft)
6 kips
12 kips
18 kips
24 kips
30 kips
1.25 inches
1.5 inches
1.75 inches
2 inches
2.5 inches
3 inches
3.5 inches
4 inches
4.5 inches
Max deflection 4.91 inches
Center of Load
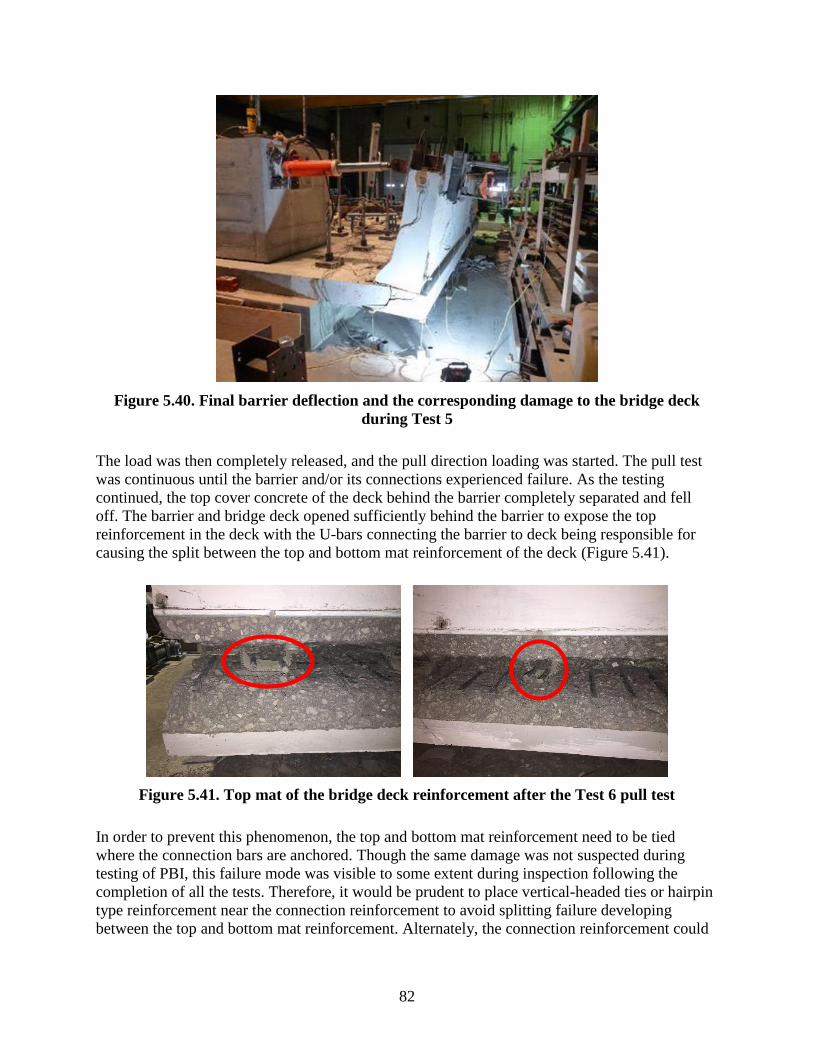
82
Figure 5.40. Final barrier deflection and the corresponding damage to the bridge deck
during Test 5
The load was then completely released, and the pull direction loading was started. The pull test
was continuous until the barrier and/or its connections experienced failure. As the testing
continued, the top cover concrete of the deck behind the barrier completely separated and fell
off. The barrier and bridge deck opened sufficiently behind the barrier to expose the top
reinforcement in the deck with the U-bars connecting the barrier to deck being responsible for
causing the split between the top and bottom mat reinforcement of the deck (Figure 5.41).
Figure 5.41. Top mat of the bridge deck reinforcement after the Test 6 pull test
In order to prevent this phenomenon, the top and bottom mat reinforcement need to be tied
where the connection bars are anchored. Though the same damage was not suspected during
testing of PBI, this failure mode was visible to some extent during inspection following the
completion of all the tests. Therefore, it would be prudent to place vertical-headed ties or hairpin
type reinforcement near the connection reinforcement to avoid splitting failure developing
between the top and bottom mat reinforcement. Alternately, the connection reinforcement could

83
be locked in place with the bottom mat reinforcement, which may pose constructability
challenges.
Test 6 Results: End of PBU
The force-displacement response obtained for Test 6 is displayed in Figure 5.42.
Figure 5.42. Recorded force-displacement response for push direction loading in Test 6
The maximum applied load to PBI was 25 kips. This value is more than 50 percent of the
resistance observed in Test 2, which is not due to limiting the lateral deformation of the barrier.
As can be seen, after experiencing about 3-in. lateral displacement, the barrier resistance
continued to soften. To test the barrier connections to failure, the test was continued until the
lateral deflection exceeded 6 in.
The deflection at the top of PBU during the push direction loading of Test 6 is shown in Figure
5.43.
0
5
10
15
20
25
30
0 1 2 3 4 5 6 7
Lo
ad
(k
ips)
Top Barrier Displacement (in)
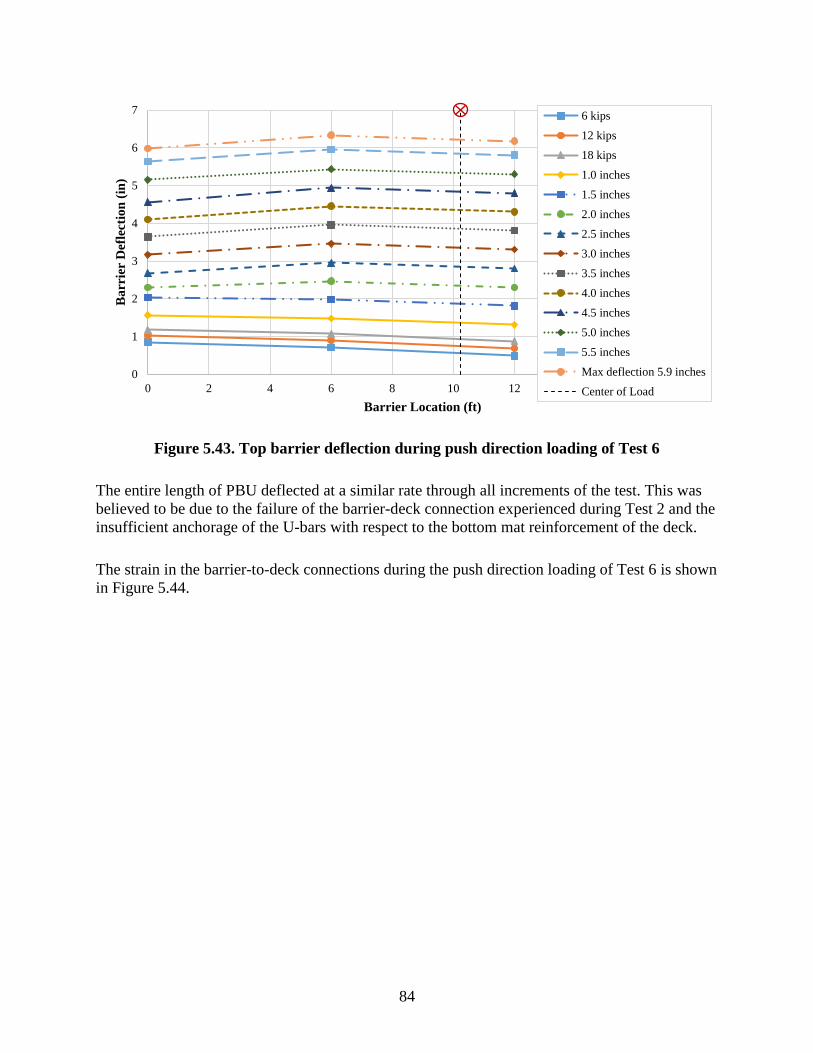
84
Figure 5.43. Top barrier deflection during push direction loading of Test 6
The entire length of PBU deflected at a similar rate through all increments of the test. This was
believed to be due to the failure of the barrier-deck connection experienced during Test 2 and the
insufficient anchorage of the U-bars with respect to the bottom mat reinforcement of the deck.
The strain in the barrier-to-deck connections during the push direction loading of Test 6 is shown
in Figure 5.44.
0
1
2
3
4
5
6
7
0 2 4 6 8 10 12 14 16 18
Ba
rrie
r D
efle
ctio
n (
in)
Barrier Location (ft)
6 kips
12 kips
18 kips
1.0 inches
1.5 inches
2.0 inches
2.5 inches
3.0 inches
3.5 inches
4.0 inches
4.5 inches
5.0 inches
5.5 inches
Max deflection 5.9 inches
Center of Load
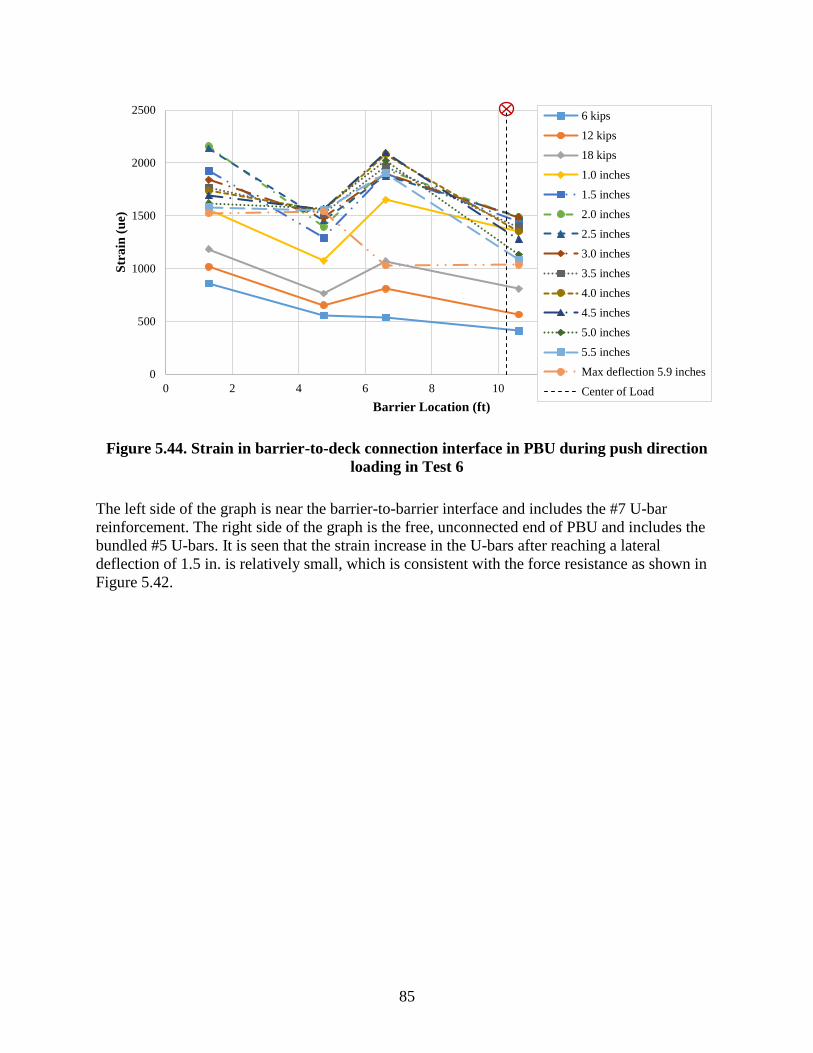
85
Figure 5.44. Strain in barrier-to-deck connection interface in PBU during push direction
loading in Test 6
The left side of the graph is near the barrier-to-barrier interface and includes the #7 U-bar
reinforcement. The right side of the graph is the free, unconnected end of PBU and includes the
bundled #5 U-bars. It is seen that the strain increase in the U-bars after reaching a lateral
deflection of 1.5 in. is relatively small, which is consistent with the force resistance as shown in
Figure 5.42.
0
500
1000
1500
2000
2500
0 2 4 6 8 10 12 14 16
Str
ain
(u
e)
Barrier Location (ft)
6 kips
12 kips
18 kips
1.0 inches
1.5 inches
2.0 inches
2.5 inches
3.0 inches
3.5 inches
4.0 inches
4.5 inches
5.0 inches
5.5 inches
Max deflection 5.9 inches
Center of Load
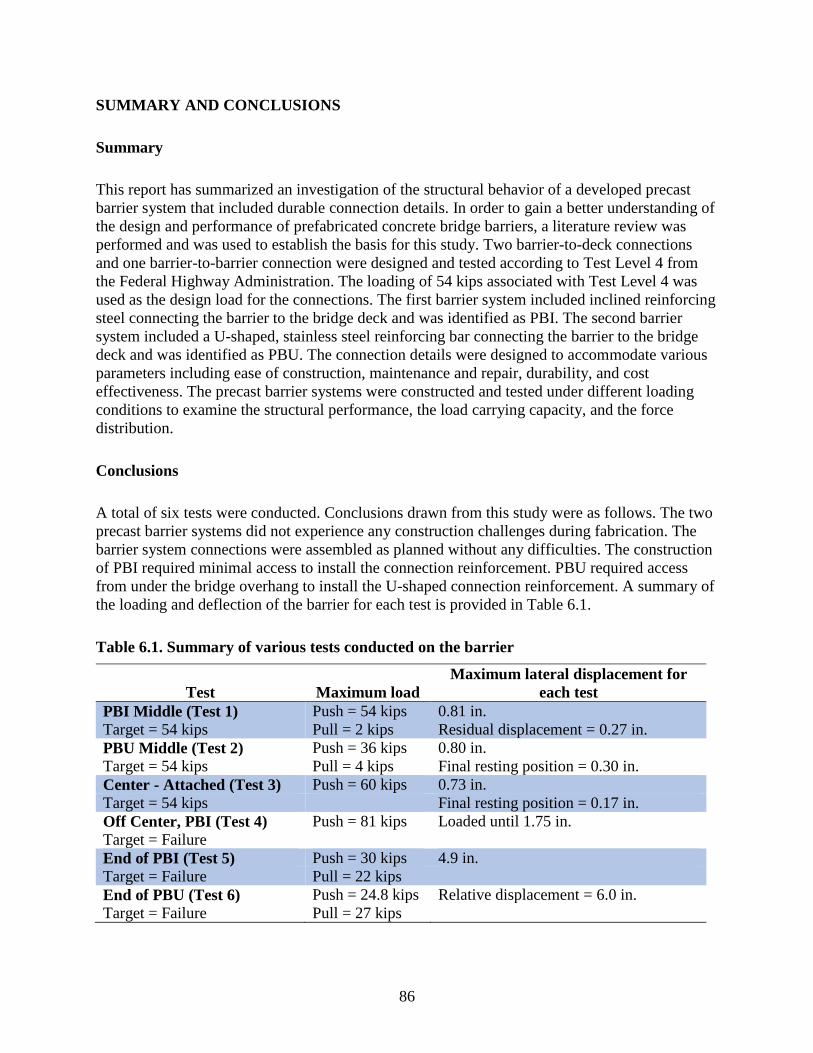
86
SUMMARY AND CONCLUSIONS
Summary
This report has summarized an investigation of the structural behavior of a developed precast
barrier system that included durable connection details. In order to gain a better understanding of
the design and performance of prefabricated concrete bridge barriers, a literature review was
performed and was used to establish the basis for this study. Two barrier-to-deck connections
and one barrier-to-barrier connection were designed and tested according to Test Level 4 from
the Federal Highway Administration. The loading of 54 kips associated with Test Level 4 was
used as the design load for the connections. The first barrier system included inclined reinforcing
steel connecting the barrier to the bridge deck and was identified as PBI. The second barrier
system included a U-shaped, stainless steel reinforcing bar connecting the barrier to the bridge
deck and was identified as PBU. The connection details were designed to accommodate various
parameters including ease of construction, maintenance and repair, durability, and cost
effectiveness. The precast barrier systems were constructed and tested under different loading
conditions to examine the structural performance, the load carrying capacity, and the force
distribution.
Conclusions
A total of six tests were conducted. Conclusions drawn from this study were as follows. The two
precast barrier systems did not experience any construction challenges during fabrication. The
barrier system connections were assembled as planned without any difficulties. The construction
of PBI required minimal access to install the connection reinforcement. PBU required access
from under the bridge overhang to install the U-shaped connection reinforcement. A summary of
the loading and deflection of the barrier for each test is provided in Table 6.1.
Table 6.1. Summary of various tests conducted on the barrier
Test Maximum load
Maximum lateral displacement for
each test
PBI Middle (Test 1) Push = 54 kips 0.81 in.
Target = 54 kips Pull = 2 kips Residual displacement = 0.27 in.
PBU Middle (Test 2) Push = 36 kips 0.80 in.
Target = 54 kips Pull = 4 kips Final resting position = 0.30 in.
Center - Attached (Test 3) Push = 60 kips 0.73 in.
Target = 54 kips Final resting position = 0.17 in.
Off Center, PBI (Test 4) Push = 81 kips Loaded until 1.75 in.
Target = Failure
End of PBI (Test 5) Push = 30 kips 4.9 in.
Target = Failure Pull = 22 kips
End of PBU (Test 6) Push = 24.8 kips Relative displacement = 6.0 in.
Target = Failure Pull = 27 kips
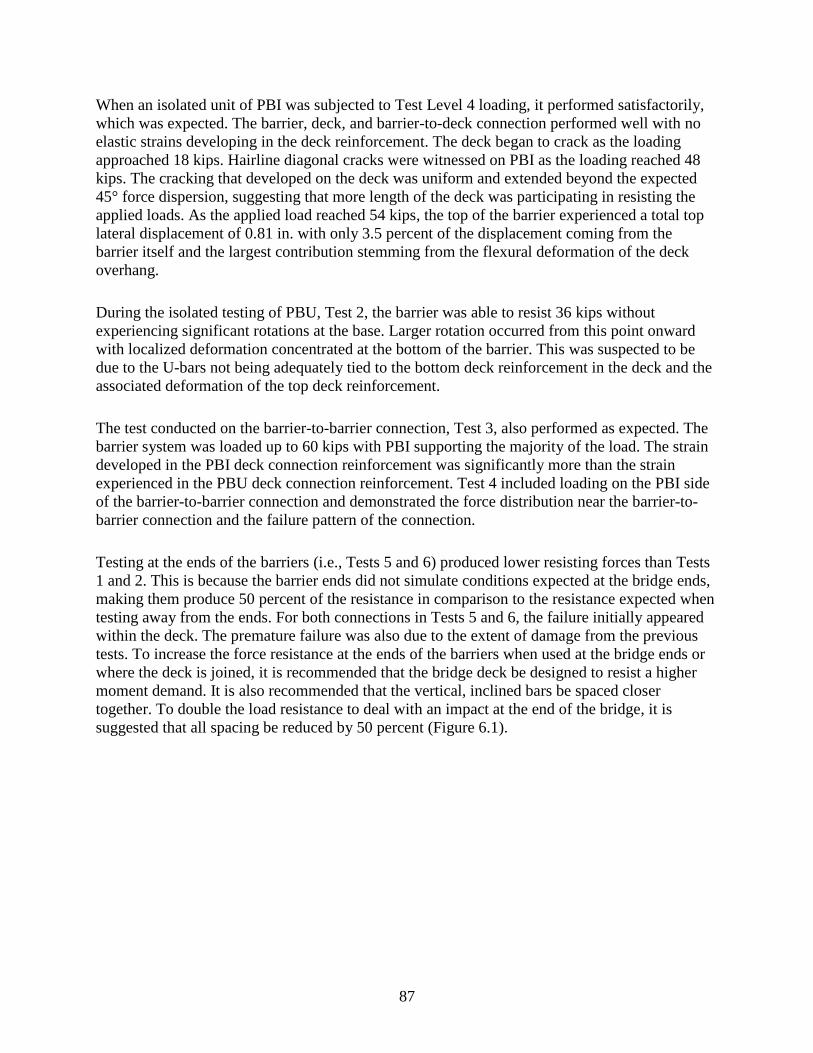
87
When an isolated unit of PBI was subjected to Test Level 4 loading, it performed satisfactorily,
which was expected. The barrier, deck, and barrier-to-deck connection performed well with no
elastic strains developing in the deck reinforcement. The deck began to crack as the loading
approached 18 kips. Hairline diagonal cracks were witnessed on PBI as the loading reached 48
kips. The cracking that developed on the deck was uniform and extended beyond the expected
45° force dispersion, suggesting that more length of the deck was participating in resisting the
applied loads. As the applied load reached 54 kips, the top of the barrier experienced a total top
lateral displacement of 0.81 in. with only 3.5 percent of the displacement coming from the
barrier itself and the largest contribution stemming from the flexural deformation of the deck
overhang.
During the isolated testing of PBU, Test 2, the barrier was able to resist 36 kips without
experiencing significant rotations at the base. Larger rotation occurred from this point onward
with localized deformation concentrated at the bottom of the barrier. This was suspected to be
due to the U-bars not being adequately tied to the bottom deck reinforcement in the deck and the
associated deformation of the top deck reinforcement.
The test conducted on the barrier-to-barrier connection, Test 3, also performed as expected. The
barrier system was loaded up to 60 kips with PBI supporting the majority of the load. The strain
developed in the PBI deck connection reinforcement was significantly more than the strain
experienced in the PBU deck connection reinforcement. Test 4 included loading on the PBI side
of the barrier-to-barrier connection and demonstrated the force distribution near the barrier-to-
barrier connection and the failure pattern of the connection.
Testing at the ends of the barriers (i.e., Tests 5 and 6) produced lower resisting forces than Tests
1 and 2. This is because the barrier ends did not simulate conditions expected at the bridge ends,
making them produce 50 percent of the resistance in comparison to the resistance expected when
testing away from the ends. For both connections in Tests 5 and 6, the failure initially appeared
within the deck. The premature failure was also due to the extent of damage from the previous
tests. To increase the force resistance at the ends of the barriers when used at the bridge ends or
where the deck is joined, it is recommended that the bridge deck be designed to resist a higher
moment demand. It is also recommended that the vertical, inclined bars be spaced closer
together. To double the load resistance to deal with an impact at the end of the bridge, it is
suggested that all spacing be reduced by 50 percent (Figure 6.1).
88
Figure 6.1. Recommended spacing for inclined bar connection at a bridge end
Due to the design of the U-bar barrier-to-deck connection, the bottom deck reinforcing bars had
to be terminated where they interfered with the U-bar deck pockets. This resulted in a greater
demand on the top deck reinforcement, causing a splitting crack to develop between the top and
bottom mat reinforcements. This led the bridge deck overhang to fail.
In the design process, the impact force was assumed to disperse in the barrier at a 45° angle from
the region where the load was applied. Results from this experiment demonstrated that the actual
distribution angle was lower than 45°. Therefore, it appeared that more of the barrier and bridge
deck were engaged in resisting the load. The deck cracking pattern observed during testing
showed that engagement of the deck reinforcement was more extensive than the expected result.
The strain experienced by the deck reinforcement was fairly uniform along the 45° dispersion,
indicating that reinforcement in this area can be reduced by at least 30 percent.
The inclined reinforcement connection proved to be sufficient for a Test Level 4 barrier system.
In light of the observed failure, it is recommended that when precast barriers are connected to the
deck, it would be valuable to provide local reinforcement around the connection bars so that they
engage both the top and bottom deck reinforcement simultaneously. This can be accomplished
using vertical double-headed bars or hairpin type bars running horizontally.

89
REFERENCES
AASHTO. 2018. AASHTO LRFD Bridge Design Specifications, Customary U.S. Units. Eighth
Edition. American Association of State Highway and Transportation Officials,
Washington, DC.
——. 2012. AASHTO LRFD Bridge Design Specifications, Customary U.S. Units. Sixth Edition.
American Association of State Highway and Transportation Officials, Washington, DC.
——. 2009. Manual for Assessing Safety Hardware. First Edition. American Association of State
Highway and Transportation Officials, Washington, DC.
Bligh, R. P., N. M. Sheikh, W. L. Menges, and R. R. Haug. 2005a. Development of Low-
Deflection Precast Concrete Barrier. Texas Transportation Institute, Texas A&M
University System, College Station, TX.
https://static.tti.tamu.edu/tti.tamu.edu/documents/0-4162-3.pdf.
Bligh, R. P., N. M. Sheikh, D. C. Alberson, and A. Y. Abu-Odeh. 2005b. Low-Deflection
Portable Concrete Barrier. Texas Transportation Institute, Texas A&M University
System, College Station, TX.
http://www.wsdot.wa.gov/publications/fulltext/design/RoadsideSafety/TxDOT_2.pdf.
Buth, C. E., T. J. Hirsch, and W. L. Menges. 1997. Testing of New Bridge Rail and Transition
Designs Volume I: Technical Report. FHWA-RD-93-058. Federal Highway
Administration Office of Safety and Traffic Operations Research and Development,
McLean VA.
ftp://ftp.odot.state.or.us/Bridge/BDDM/BDDM_Links/Rail%20Crash%20Testing/BR200
CrashTestReport.pdf.
FDOT. 2012. Florida DOT Design Standards 414. Florida Department of Transportation,
Tallahassee, FL. http://www.fdot.gov/design/standardplans/DS.shtm.
FHWA. 2018. Accelerated Bridge Construction. www.fhwa.dot.gov/bridge/abc/.
Patel, G. 2008. Development of Precast Barrier Wall System for Bridge Decks. MS thesis.
Ryerson University, Toronto, Ontario.
Ross, H. E., Jr., D. L. Sicking, R. A. Zimmer, and J. D. Miche. 1993. NCHRP Report 350:
Recommended Procedures for the Safety Performance Evaluation of Highway Features.
National Cooperative Highway Research Program, Washington, DC.
Rosenbaugh, S. K., R. K. Faller, R. W. Bielenberg, D. L. Sicking, and J. D. Reid. 2012. Phase I
Development of an Aesthetic, Precast Concrete Bridge Rail. Mid-America Transportation
Center, Nebraska Transportation Center, University of Nebraska-Lincoln, NE.
Verrastro, R., R. Corsa, B. Rose, and R. Powell. 2014. Accelerated Bridge Construction Case
Study: Design Build Replacement of Rock Ridge Road Bridge. Presented at the 2014
Design Training Expo, June 10–12, Tallahassee, FL.
http://www.fdot.gov/design/training/designexpo/2014/presentations/VerrastroRalph-
AcceleratedBridgeConstructionCaseStudyDesignBuildReplacementofRockRidgeRoadBri
dge.pdf.


