JULY 2004 1645 LONFAT ET AL. q 2004 American Meteorological Society Precipitation Distribution in Tropical Cyclones Using the Tropical Rainfall Measuring Mission (TRMM) Microwave Imager: A Global Perspective MANUEL LONFAT Rosenstiel School of Marine and Atmospheric Science, University of Miami, Miami, Florida FRANK D. MARKS,JR. Hurricane Research Division, NOAA/AOML, Miami, Florida SHUYI S. CHEN Rosenstiel School of Marine and Atmosphere Science, University of Miami, Miami, Florida (Manuscript received 16 July 2003, in final form 21 December 2003) ABSTRACT TRMM microwave imager rain estimates are used to quantify the spatial distribution of rainfall in tropical cyclones (TCs) over the global oceans. A total of 260 TCs were observed worldwide from 1 January 1998–31 December 2000, providing 2121 instantaneous TC precipitation observations. To examine the relationship be- tween the storm intensity, its geographical location, and the rainfall distribution, the dataset is stratified into three intensity groups and six oceanic basins. The three intensity classes used in this study are tropical storms (TSs) with winds ,33 m s 21 , category 1–2 hurricane-strength systems (CAT12) with winds from 34–48 m s 21 , and category 3–5 systems (CAT35) with winds .49 m s 21 . The axisymmetric component of the TC rainfall is represented by the radial distribution of the azimuthal mean rainfall rates (R). The mean rainfall distribution is computed using 10-km annuli from the storm center to a 500-km radius. The azimuthal mean rain rates vary with storm intensity and from basin to basin. The maximum R is about 12 mm h 21 for CAT35, but decreases to 7 mm h 21 for CAT12, and to 3 mm h 21 for TS. The radius from the storm center of the maximum rainfall decreases with increasing storm intensity, from 50 km for TS to 35 km for CAT35 systems. The asymmetric component is determined by the first-order Fourier decomposition in a coordinate system relative to the storm motion. The asymmetry in TC rainfall varies significantly with both storm intensity and geographic locations. For the global average of all TCs, the maximum rainfall is located in the front quadrants. The location of the maximum rainfall shifts from the front-left quadrant for TS to the front-right for CAT35. The amplitude of the asymmetry varies with intensity as well; TS shows a larger asymmetry than CAT12 and CAT35. These global TC rainfall distributions and variability observed in various ocean basins should help to improve TC rainfall forecasting worldwide. 1. Introduction Predicting rainfall associated with tropical cyclones (TCs) is a major operational challenge. Over the last few decades, freshwater flooding has become the largest threat to human lives from TCs at landfall in the United States (Rappaport 2000). While track forecasts continue to improve, quantitative precipitation forecasts (QPF) for TCs have shown little skill. One of the uncertainties in QPF is a lack of precipitation data over the open oceans to evaluate and validate numerical weather pre- diction (NWP) model results. Early empirical TC rain- fall forecast models assume either a constant rain rate Corresponding author address: Dr. Shuyi S. Chen, RSMAS/Uni- versity of Miami, Miami, FL 33149. E-mail: [email protected]or axisymmetric rainfall distribution in TCs. A number of case studies have shown that the precipitation struc- tures in TCs are quite complex and vary from case to case (e.g., Miller 1958; Frank 1977; Marks 1985; Bur- pee and Black 1989). This study will provide a com- prehensive analysis of the global TC rainfall character- istics using the Tropical Rainfall Measuring Mission (TRMM) observations. It is a critical step toward un- derstanding and improving QPF in TCs. Early radar images revealed that the TC rainfall is usually organized in bands spiraling toward the storm center (Wexler 1947), commonly referred to as rain- bands. A ring of intense rainfall surrounds the storm center (e.g., Kessler 1958; Jordan et al. 1960), known as the eyewall. The spatial distribution of TC rainfall can be thought of as a series of annular means composed of an azimuthal mean (or axisymmetric) and a pertur-
Transcript
JULY 2004 1645L O N F A T E T A L .
q 2004 American Meteorological Society
Precipitation Distribution in Tropical Cyclones Using the Tropical Rainfall MeasuringMission (TRMM) Microwave Imager: A Global Perspective
MANUEL LONFAT
Rosenstiel School of Marine and Atmospheric Science, University of Miami, Miami, Florida
FRANK D. MARKS, JR.
Hurricane Research Division, NOAA/AOML, Miami, Florida
SHUYI S. CHEN
Rosenstiel School of Marine and Atmosphere Science, University of Miami, Miami, Florida
(Manuscript received 16 July 2003, in final form 21 December 2003)
ABSTRACT
TRMM microwave imager rain estimates are used to quantify the spatial distribution of rainfall in tropicalcyclones (TCs) over the global oceans. A total of 260 TCs were observed worldwide from 1 January 1998–31December 2000, providing 2121 instantaneous TC precipitation observations. To examine the relationship be-tween the storm intensity, its geographical location, and the rainfall distribution, the dataset is stratified intothree intensity groups and six oceanic basins. The three intensity classes used in this study are tropical storms(TSs) with winds ,33 m s21, category 1–2 hurricane-strength systems (CAT12) with winds from 34–48 m s21,and category 3–5 systems (CAT35) with winds .49 m s21. The axisymmetric component of the TC rainfall isrepresented by the radial distribution of the azimuthal mean rainfall rates (R). The mean rainfall distribution iscomputed using 10-km annuli from the storm center to a 500-km radius. The azimuthal mean rain rates varywith storm intensity and from basin to basin. The maximum R is about 12 mm h21 for CAT35, but decreasesto 7 mm h21 for CAT12, and to 3 mm h21 for TS. The radius from the storm center of the maximum rainfalldecreases with increasing storm intensity, from 50 km for TS to 35 km for CAT35 systems. The asymmetriccomponent is determined by the first-order Fourier decomposition in a coordinate system relative to the stormmotion. The asymmetry in TC rainfall varies significantly with both storm intensity and geographic locations.For the global average of all TCs, the maximum rainfall is located in the front quadrants. The location of themaximum rainfall shifts from the front-left quadrant for TS to the front-right for CAT35. The amplitude of theasymmetry varies with intensity as well; TS shows a larger asymmetry than CAT12 and CAT35. These globalTC rainfall distributions and variability observed in various ocean basins should help to improve TC rainfallforecasting worldwide.
1. Introduction
Predicting rainfall associated with tropical cyclones(TCs) is a major operational challenge. Over the lastfew decades, freshwater flooding has become the largestthreat to human lives from TCs at landfall in the UnitedStates (Rappaport 2000). While track forecasts continueto improve, quantitative precipitation forecasts (QPF)for TCs have shown little skill. One of the uncertaintiesin QPF is a lack of precipitation data over the openoceans to evaluate and validate numerical weather pre-diction (NWP) model results. Early empirical TC rain-fall forecast models assume either a constant rain rate
Corresponding author address: Dr. Shuyi S. Chen, RSMAS/Uni-versity of Miami, Miami, FL 33149.E-mail: [email protected]
or axisymmetric rainfall distribution in TCs. A numberof case studies have shown that the precipitation struc-tures in TCs are quite complex and vary from case tocase (e.g., Miller 1958; Frank 1977; Marks 1985; Bur-pee and Black 1989). This study will provide a com-prehensive analysis of the global TC rainfall character-istics using the Tropical Rainfall Measuring Mission(TRMM) observations. It is a critical step toward un-derstanding and improving QPF in TCs.
Early radar images revealed that the TC rainfall isusually organized in bands spiraling toward the stormcenter (Wexler 1947), commonly referred to as rain-bands. A ring of intense rainfall surrounds the stormcenter (e.g., Kessler 1958; Jordan et al. 1960), knownas the eyewall. The spatial distribution of TC rainfallcan be thought of as a series of annular means composedof an azimuthal mean (or axisymmetric) and a pertur-
1646 VOLUME 132M O N T H L Y W E A T H E R R E V I E W
bation (or asymmetric) component. Miller (1958) madea composite of rain gauge data from 16 hurricanes overFlorida in a 38 array aligned with the TC track. Heobserved a mean rain rate of 6.6 mm h21 in the 18 boxdirectly surrounding the storm center. The mean rainrate in the remaining outer domain was 3.2 mm h21.Rodgers and Adler (1981) constructed radial profiles ofrainfall for 21 eastern and western Pacific cyclones us-ing satellite passive microwave imager observations.They found that TC intensification was accompaniednot only by increases in the average rain rate, but alsoin the relative contribution of the heavy rainfall. Theyalso found that the radius of maximum rainfall decreasedwith increasing storm intensity. Using airborne radarmeasurements Marks (1985) found an azimuthal meanrain rate of 11 mm h21 in the eyewall of Hurricane Allen(1980), which was about 6 times of that from the eyewallto a 111-km radius. Burpee and Black (1989) examinedthe radar-derived rainfall structure within 75 km of thecenter of Hurricanes Alicia (1983) and Elena (1985).They found that the azimuthal mean rain rates in theeyewall were only 5.2 and 6 mm h21, respectively. Therates dropped to 2.8 and 3.4 mm h21 in the first rainbandaround the storm center. These studies also showed thateach storm has very different rainfall distributions dur-ing its evolution, suggesting that many factors, bothrelated to the storm dynamics and to its environment,can influence the rainfall structure.
Asymmetries in the TC rainfall have been studiedboth observationally and numerically. Radar observa-tions showed rainfall asymmetry in Hurricanes Allen(Marks 1985), Alicia, and Elena (Burpee and Black1989). However, the asymmetry varied significantlyfrom storm to storm. Hurricane Allen had a rain-ratemaximum in the front-right quadrant in the eyewall re-gion that shifted anticyclonically in the outer region.The rainfall maximum in Hurricane Alicia was first ob-served in the front-left quadrant and later changed tothe front-right quadrant. Other observations haveshowed mixed results. Miller (1958) showed a maxi-mum rainfall in the front-right quadrant from the 16-storm composite for Florida. Frank (1977) found thatrainfall distributions were mainly axisymmetric forwestern North Pacific storms, using a 21-yr record ofrain gauges on 13 small islands. Using satellite obser-vations, Rodgers et al. (1994) showed a front maximumin a North Atlantic TC composite. The location of themaximum shifted to the front-right as the storm trans-lation speed increases. Although most previous studiesfound a precipitation maximum ahead of the storm cen-ter, the variability in the location and amplitude waslarge. In fact, storms with very similar locations, inten-sity, and speed, such as Hurricanes Allen, Alicia, andElena, can have very different rainfall structures.
The TC rainfall distribution is determined by manyfactors, including, but not limited to, environmental fac-tors such as wind shear, sea surface temperatures (SST),and moisture distribution, as well as TC-specific factors
such as intensity, location, and translation speed. Toexamine how these factors affect the TC rainfall, a quan-titative description of the rain variability is needed asa function of radius and azimuth around the storm centerfor various TC intensities, locations, and translationspeeds.
In this study, the TRMM Microwave Imager rainfallproduct from 1998 to 2000 is used to determine TCrainfall distributions over the global tropical oceans.Rainfall distributions for the whole database separatedby radius and azimuth for various TC intensity, location,and speed are discussed.
2. Data and analysis method
a. TRMM data
TRMM is a joint mission between the U.S. NationalAeronautics and Space Administration (NASA) and theJapanese National Space Development Agency (NAS-DA). The goal of TRMM is to measure global tropicalrainfall (Simpson et al. 1988). The main instrumentsonboard TRMM are a microwave imager (TMI), pre-cipitation radar (PR), and a visible and infrared radi-ometer system (VIRS). The TRMM satellite waslaunched in November 1997. Before August 2001, itorbited at a 358 inclination and an altitude of 350 km.The satellite altitude was then increased to 402 km toextend the mission lifetime. The potential of the satelliteresides in its ability to access both passive and activeradiometric information. The 358 inclination andTRMM’s non-sun-synchronous orbit makes it an idealplatform to study TCs. Details of TRMM instrumentsare given in Kummerow et al. (1998).
The TMI surface rainfall estimates (Kummerow et al.1996) are used in this study. The TMI swath is 750 kmwide and the footprint is an ellipse with nearly 4- and6-km axes. The TRMM orbits containing TCs are se-lected by matching the TRMM database to linearly in-terpolated best track information globally. The inter-polated data provide the TC location, intensity, speed,and direction of motion every 10 s. The times arematched to those for the TRMM orbits and the distancebetween the storm center and the TRMM satellite nadiris computed. If the distance is smaller than 500 km, thesatellite observation is used in the analysis. A maximumradius of 500 km was used to ensure the data coverageexceeded 20% of the total area for all radii. As will beillustrated later, the data coverage decreases rapidly be-yond 500-km radius. Only observations over the oceanare considered as the TMI rain algorithm underestimateslight rain over land.
b. TMI global sampling
During the period of 1 January 1998–31 December2000, 260 TCs were observed globally, providing 2121TMI instantaneous observations (Fig. 1). In this study,
JULY 2004 1647L O N F A T E T A L .
FIG. 1. Tropical cyclones observed by TMI during the period from 1 Jan 1998 to 31 Dec2000. Each dot represents one TRMM observation. The solid lines indicate the boundariesof the six active oceanic basins.
TABLE 1. Comparison of TRMM TC observations and 6-hourly advisory distributions with the cyclone intensity, in each oceanic basin.Percent of total for basin in parentheses.
tropical storms (TSs) are defined as systems with windspeed1 from 18 to 33 m s21, category 1–2 (CAT12)systems with wind between 34 and 48 m s21, and cat-egory 3–5 (CAT35) systems with wind .49 m s21. Thedatabase contains observations from tropical storm tocategory 5 hurricane intensity. Approximately 64%(1361) of the 2121 events are TS, 26% (548) are CAT12,and 10% (212) are CAT35 systems.
The observations are distributed among all TC basinsaround the globe. Six basins are considered: Atlantic(ATL), east-central Pacific (ECPAC), northwest Pacific(NWPAC), north Indian Ocean (NIND), south IndianOcean (SIND), and South Pacific (SPAC). The bound-aries between basins are shown in Fig. 1. In order todetermine if the TRMM dataset is representative of thedistribution of TCs over the 3-yr period, the global TCdistribution observed by TRMM was compared to thebest track record. Table 1 shows the percentage of all
1 The 6-h best track peak surface wind speeds interpolated to theTRMM orbit time are used to determine the storm intensity. In mostbasins, the peak wind speed is estimated from the 10-min mean wind,whereas in the ECPAC and ATL basins it is the 1-min sustained wind.
observations and the best track information in each in-tensity and basin group.
The best track and TRMM distributions are similarfor most categories in Table 1. The TRMM dataset isslightly biased toward strong storms in the Atlantic, as50% of TRMM observations are for hurricanes com-pared to 45.5% of the best track records. The combinedTRMM and the best track CAT12 and CAT35 frequen-cies are much higher in ATL than the global averageduring the 1998–2000 period. All other basins, exceptNIND, show a combined CAT12 and CAT35 percentagebelow the global average. The large number of CAT12and CAT35 observations in the Atlantic can be ex-plained by the cold phase of ENSO for the period sam-pled, during which more intense storms are expected inthe Atlantic (Gray 1984; Shapiro 1987). During 1998,ENSO shifted from a cold to a neutral phase in whichit remained through the sampled period. NIND showsthe largest discrepancy between the satellite databaseand the best track distribution, as 36% of all NINDTRMM observations correspond to hurricanes, whilethe best track states that only 26% were for CAT12 orhigher. Finally, TRMM’s sampling of the NWPAC is
1648 VOLUME 132M O N T H L Y W E A T H E R R E V I E W
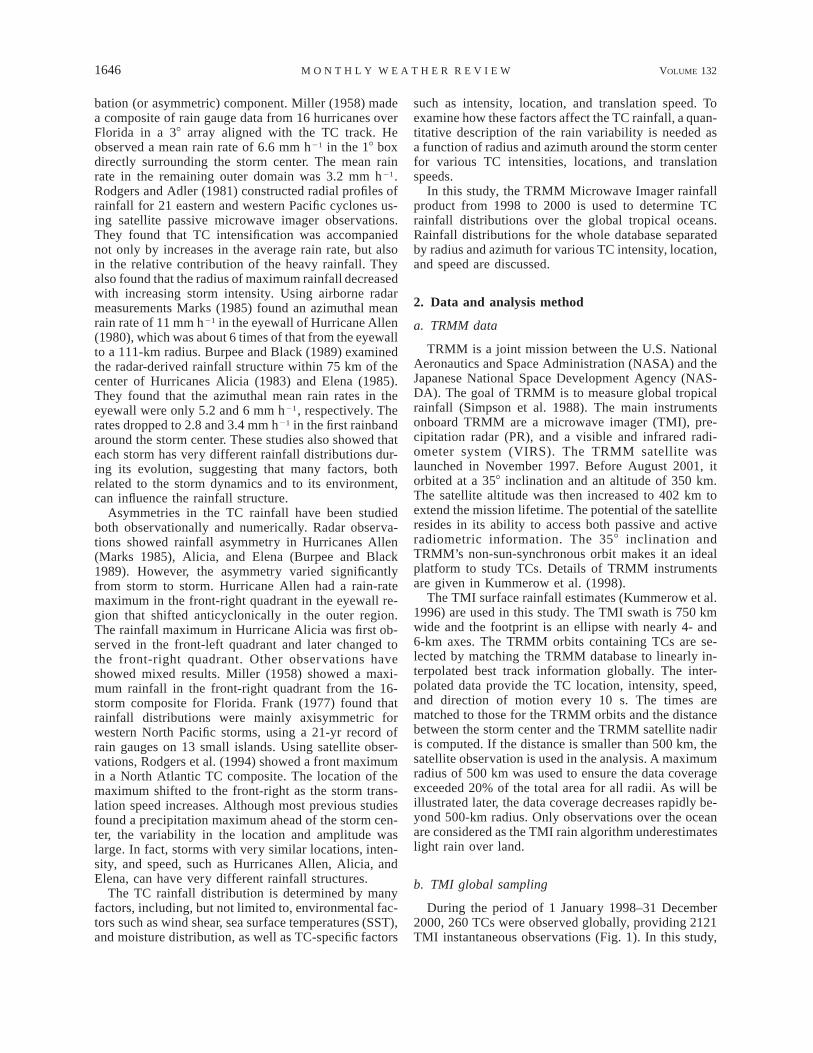
FIG. 2. Example of annuli used in the analysis. The map shows thesurface rainfall for Hurricane Floyd on 13 Sep 1999.
FIG. 3. TRMM/TMI TC data coverage as a function of distancefrom the TC center, computed relative to the max possible coverage.The max possible coverage for one 10-km-wide annulus around theTC center is defined as the number of TRMM overpasses multipliedby the area within the annulus.
biased toward high TC intensity, compared to the 3-yrbest track record average by 3.5%. In summary, theTRMM/TMI dataset is representative of the global TCactivity from 1998 to 2000. The rainfall structure thatwill be discussed later should represent the global TCrainfall well during a rather cold phase of ENSO.
c. Analysis methods
The rainfall characteristics are derived in storm-rel-ative coordinates. The radial variation of precipitationis depicted by the azimuthal mean rain rate in 10-km-wide annuli around the storm center outward to the 500-km radius (Fig. 2). The resulting database allows us tocompute the radial dependence of the rain characteristicsas a function of the storm intensity, location, and speed.
Most instantaneous observations capture only part ofthe storm, because 1) the passive microwave swathwidth is smaller than the size of most storms, and 2)the storm eye and satellite nadir are rarely superim-posed. Figure 3 shows the data coverage as a functionof radial distance from the TC center, normalized to themaximum possible coverage at all radial distances. Thecoverage distribution in Fig. 3 is obtained by summingthe area for each rain estimate (;25 km2) in 10-kmannuli around the TC center. These values are then com-pared to the area of each annulus multiplied by thenumber of storm events observed by the satellite. Forexample, for all 2121 events, 8982 rain estimates of theinner 10-km annulus were obtained. The accumulatedarea for those estimates is 2.3 3 105 km2. The area ofthe inner 10-km ring is 314 km2, yielding a maximumpossible coverage of 6.7 3 105 km2 for the 2121 over-
passes. Hence, the ratio between the actual and the idealcoverage is 33.7%. As seen in Fig. 3, the coverage ismaintained between 30%–35% out to 200 km, and de-creases linearly with radius beyond 200 km. At radii.500 km, the coverage decreases sharply below 20%and is therefore not considered in the analysis. Figure3 also shows that similar results are obtained for theintensity subsets.
The conditional (only when raining) probability den-sity functions (PDFs) of rain-rate occurrence (area) withradial distance can also be determined using the annulardatabase. The PDF is constructed by classifying the TMIrain estimates, for each annulus, in a dBR scale, where
dBR 5 10 Log (R).10 (1)
The PDF is constructed for each annulus within the 500-km radius by summing the occurrence of rain estimatesin each dBR class. Using the annular PDFs, a contouredfrequency by radial distance (CFRD) diagram can beconstructed as a function of storm intensity, location,and speed. PDFs and CFRDs provide information onthe radial variability of the precipitation distribution,and help to identify the median and mode of the rain-rate distribution at any distance from the center.
To examine the contribution to the total precipitationfrom various rain rates, PDFs and CFRDs are also con-structed for the total precipitation amount in each dBRclass. The PDF is obtained by weighing each rain es-timate by the corresponding rain rate. The resulting dis-tribution is then normalized to the total amount of rain.This approach provides a PDF distribution normalizedby the total rain amount (flux) rather than by the totalrain area. The integral over the rain amount PDF dividedby the integral over the occurrence PDF is the meanrain rate of the raining area within the annulus. A medianand a mode can also be defined for each PDF of rainfallflux, yielding five measures of the rain distribution foreach annulus. The mean, median, and mode calculations
JULY 2004 1649L O N F A T E T A L .
TABLE 2. Comparison of TRMM rainfall PDFs with previous studies. The rainfall is partitioned into rate intervals (bins)used in previous studies.
Burpee and Black (1989) eyewall, AliciaBurpee and Black (1989) eyewall, ElenaTRMM CAT12 eyewall
595834
131324
121224
121114
464
in each PDF can yield very different values, particularlywhen the PDF distribution is skewed. For TCs, the modeof the distribution is expected to shift toward smallerrain rates as the distance from the center increases.
The next step of our analysis consists in studying thefirst-order asymmetry of the rain distribution. The asym-metry is defined relative to the storm motion. The di-rection of the storm motion at each TRMM observationis determined by linear interpolation of the two closestbest track reports to the observation time. As for themean R computations, 10-km-wide annuli around theTC center are used to compute the spatial rainfall asym-metry. It is important to note that missing data in thebest track reduce the number of TRMM observationsavailable for the analysis. Nearly 80% of the initialTRMM observations can be assigned a storm direction.
In each annulus, the first-order Fourier coefficientsare computed using all rain estimates (Boyd 2001):
a 5 [R cos(u )], (2)O1 i ii
b 5 [R sin(u )], (3)O1 i ii
where Ri is each individual rain estimate and ui the phaseangle of the estimate relative to the storm motion. Thespatial structure of the first-order asymmetry (M1) canbe represented by
M 5 [a cos(u) 1 b sin(u)]/R, (4)1 1 1
where R is the mean rain rate calculated over the entireannulus. The first-order asymmetry is computed for dif-ferent storm intensities, speeds, and locations.
d. Comparison of TMI estimates with other datasets
The previous studies (e.g., Miller 1958; Frank 1977;Marks 1985; Burpee and Black 1989) that discussed thefrequency distribution of rainfall in TCs can be used toestimate the quality of the TMI rainfall observations.Table 2 shows the rain-rate stratifications previous au-thors have used to construct the PDF. Examination of
Table 2 shows that the TRMM frequency distributionsare similar to those from previous studies, both for thetotal storm PDF and for the eyewall PDF. Rates ,0.25mm h21 are much less frequent in the TRMM PDF, andrates between 0.25 and 6.25 mm h21 occur more often.Consequently, TRMM redistributes very low ratesamong the surrounding rainfall bins. As a result, themean distributions will not be affected except in thearea where many 1–2.5 mm h21 rates are observed.However, it likely will not impact the mean rainfall,because nonraining areas weigh heavily in the mean Rcalculation. TMI estimates become particularly pow-erful in the asymmetry analysis, which is a normalizedcalculation with accuracy strongly depending on the sizeof the dataset.
The differences between TMI and other instrumentsmay also illustrate the difficulties in comparing PDFsof instruments with a wide range of resolutions. Miller(1958) and Frank (1977) results are based on rain gaugenetworks. Their datasets were large, but gauges onlyoffer point measurements with 1-h accumulation andsampling area (;103 m2) three orders of magnitudesmaller than that for TMI (;25 km2). The comparisonswith the PDF of radar estimates are better than thosefrom the gauges. Typical sampling area of ground andairborne radars are around 16 km2, which is closer tothe TMI sampling area.
3. Hurricane Dennis (1999)
The analysis methods described in section 2 are il-lustrated using a TRMM observation of Hurricane Den-nis on 29 August 1999. At 1800 UTC on 29 August,Dennis was off the coast of northeastern Florida, atapproximately 30.88N and 78.48W. The minimum sealevel pressure (MSLP) was near 970 hPa and the max-imum sustained winds were about 50 m s21, makingDennis a category 3 hurricane. Dennis was moving al-most due north at 5 m s21. Dennis’s rainfall displayedstrong azimuthal variability in rainfall rates (Fig. 4). Therain was mostly on the left and front-left of the storm
1650 VOLUME 132M O N T H L Y W E A T H E R R E V I E W
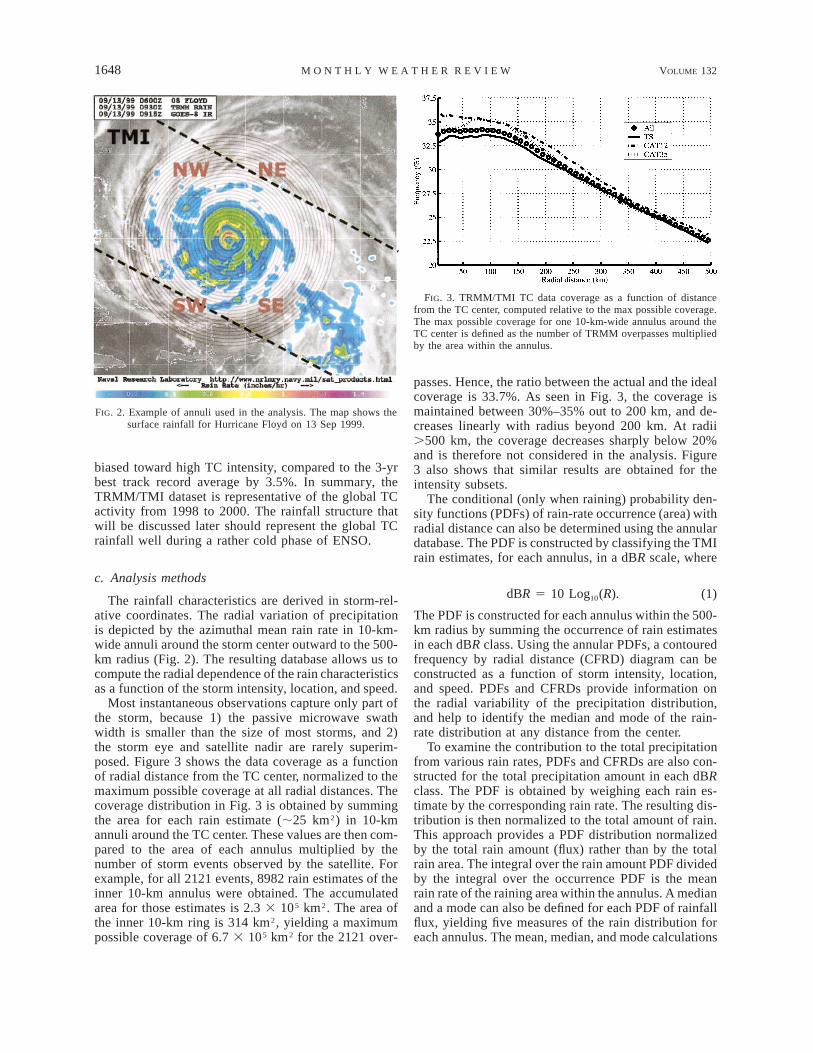
FIG. 4. TMI surface rainfall (in mm h21) of Hurricane Dennis, on28 Aug 1999. The dots indicate the location of the phase max of therainfall asymmetry as a function of the distance to the storm center.The circles (broken lines) are drawn at 50-km radial increments.
FIG. 6. PDF of rainfall for Dennis within 300-km radius of thestorm center.
FIG. 5. Radial profile of azimuthally averaged rain rates for Dennison 28 Aug 1999.
FIG. 7. Radial variation of PDF for Dennis, from the storm centerto 300-km radius. The black line shows the median rain rate as afunction of the radial distance to Dennis’s center.
center in the inner 150 km. In the outer region, therainfall was mainly located in a strong rainband on thefront and front-right of the storm center.
Figure 5 shows the unconditional azimuthal mean rainrates as a function of the radial distance from the stormcenter in Hurricane Dennis. The peak rainfall is located60 km from the center and is about 13.5 mm h21. Severalsecondary peaks in rainfall can be seen at 150- and 275-km radii, corresponding to a broad zone of precipitationin the front-left quadrant of the storm, and a more in-tense but narrower region farther to the front-right quad-rant of the storm (Fig. 4). The eyewall is well definedin the precipitation distribution, at 60 km from the cen-ter. The eye is not totally clear of rain.
The PDF of rain occurrence for the entire storm isshown in Fig. 6. Rain rates are between 0.4 and 40mm h21. Most of the rainfall area (;91%) within 500
km of Dennis’s center falls between 1 and 10 mm h21.It is important to note that rainfall covers only 25% ofthe total area within 500 km of the storm center. Themode is at 7 mm h21. The distribution also shows asecondary maximum near 1.5 mm h21. The stratiformrain area in the rainbands contributed the most to the 7mm h21 peak. The 1–2 mm h21 rainfall mostly occursbetween the eyewall and rainbands. The total distribu-tion in Fig. 6 is skewed toward higher rates, whichshows that convective-type rainfall from the eyewall andrainband dominates the distribution. The change in thePDF of rain occurrence as a function of the radial dis-tance to the storm center is shown in Fig. 7. Within theinner 50-km radius, the mode sharply increases withdistance reaching 10 mm h21 at the 50-km radius. Be-tween 50 and 75 km, the distribution broadens becauseof the rainfall asymmetry present in Dennis’s eyewall(Fig. 4). Between 75 and 200 km, the mode decreaseswith distance, from approximately 10 mm h21 to 4 mmh21. The distribution narrows as the storm shows a more
JULY 2004 1651L O N F A T E T A L .
FIG. 8. Same as in Fig. 7 except for the rainfall flux, defined asthe rainfall multiplied by the area that it affects. FIG. 9. Normalized phase maximum of the first-order rainfall asym-
metry in Hurricane Dennis, as a function of the distance from thestorm center. The first-order Fourier coefficients are calculated rel-ative to the storm motion direction.horizontally uniform rain pattern. Further out, the dis-
tribution broadens again and the mode increases, dueto the presence of the right-front rainband. In general,the width of the PDF provides good indications of thedegree of symmetry of the storm rainfall. Dennis’s PDFillustrates that even at large distances (.300 km), highrainfall rates (.40 mm h21) can be observed, althoughthe probability is only a few percent.
Figure 8 shows the rainfall flux PDF with radial dis-tance for Hurricane Dennis. Compared to the PDF ofrain occurrence (Fig. 7), both the mode and median ofthe distribution in Fig. 8 occur at higher rain rates, al-though differences between the modes of both figuresare small. The rainfall flux distribution is heavily influ-enced by large rates, which is shown by the large shiftin the median from the PDF of occurrence to the rainfallflux PDF. The shift toward higher rates is more pro-nounced for the median than for the mode, particularlyin the eyewall and rainband areas. In these two areas,most of the rain flux can be attributed to rainfall rates.3–4 mm h21. Those two regions are also the areaswith the largest asymmetries, where rates .20 mm h21
were observed. The medians for both distributions arevery similar in the region between 75 and 250 km, wherethe storm was more symmetric.
To examine the asymmetry in the spatial distributionof rainfall, the first-order Fourier analysis of Dennisrainfall is computed relative to the storm motion, usingEqs. (2)–(4). The solid dots on top of the rainfall mapin Fig. 4 show the general location of the first-orderasymmetry phase maximum. The three dots correspond-ing to the inner 150-km radii are located primarily onthe left of the storm center, in agreement with the asym-metry in the eyewall rainfall. The three dots correspond-ing to the radii between 150 and 300 km are located inthe front-right quadrant, where the rainband precipita-tion is observed. Figure 9 shows the wavenumber-1asymmetry spatial distribution within 300 km of Den-nis’s center. Larger asymmetries are observed at larger
radii. Asymmetry amplitudes are much smaller near thecenter, as the rainfall surrounds the entire storm eye.The amplitudes in Fig. 9 are normalized to the ambientmean rainfall, so that the amplitude near unity ahead ofthe center at 275 km means that the wavenumber-1 sig-nal is as strong as the axisymmetric average. The variousanalyses introduced in this example are applied to theextended 3-yr statistics in the next section.
4. Characteristics of the TC rainfall distribution
a. PDF of rain rates
Figure 10 shows the PDF distributions by area ofoccurrence for all TRMM rainfall observations withinan area of 500-km radius around the storm center. Themode is near 1 mm h21, but not unique, as all distri-butions in Fig. 10 show a second maximum near 3.2mm h21. As the storm intensity increases, the medianand the mode of the distribution shift toward highervalues and the distribution tends to become broader (Fig.10b).
Similar characteristics are observed in the basin PDFs(Fig. 10c). The Atlantic basin distribution is similar tothe overall PDF for CAT12 and CAT35, which is notsurprising as more observations of hurricanes were ob-tained in the Atlantic than in other basins during the1998 to 2000 period (Table 1). ECPAC has the leasttotal rain of all basins with a narrower distribution andone of the largest percentage of TS observations (Table1). In agreement with the results of Fig. 10b, ATL andECPAC define the envelope for the remaining basinPDFs. However, the trend in the remaining basins is notas clear, as illustrated by the NIND, SIND, and SPACPDFs. Those three basins show some differences in themodal frequency and amplitude of the PDF, althoughdistributions among intensities are similar for each basin
1652 VOLUME 132M O N T H L Y W E A T H E R R E V I E W
FIG. 10. Probability density functions calculated within 500-kmradius of storm center (a) for all 2121 observations, (b) for TC in-tensity groups, and (c) for oceanic basin subgroups.
(Table 1). Hence, the TC intensity is most likely not themost important factor explaining the PDF distributionby occurrence between basins.
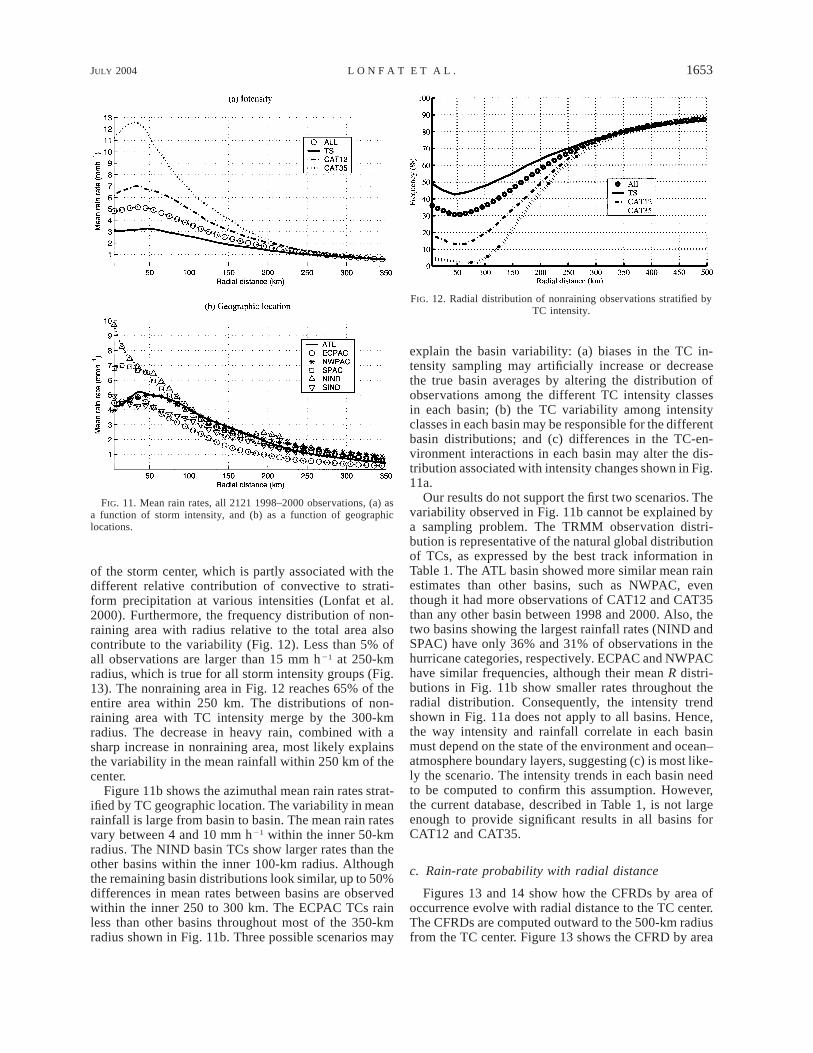
b. Azimuthal averages
The radial distributions of azimuthally averaged rain-fall rates for all observations and each of the three stormintensity categories are shown in Fig. 11a. Rain ratesup to 5 mm h21 are found within 50 km of the TC centerfor all observations. They decrease outward to 1 mmh21 at 250 km. The maximum rain rate is located at 40km from the storm center. Mean rain rates increase withstorm intensity at all radii. Peak mean rates are 3, 7,and 12.5 mm h21 for TS, CAT12, and CAT35 systems,respectively. The location of the peak rainfall also varieswith intensity, from about 50 km from the storm centerfor TS to 35 km for CAT35 systems. Marks (1985),using a rainfall distribution from airborne radar obser-vations for Hurricane Allen (1980), showed a mean rainrate of 11.3 mm h21 in the eyewall and 1.8 mm h21 inthe region extending from the outer edge of the eyewallto a radius of 111 km. At the time of the measurements,Allen’s minimum sea level pressure (SLP) varied from960 to 910 mb, making it an upper CAT12 to CAT35in our description. The radius of maximum wind inAllen fluctuated between 12 and 40 km. Assuming thatthe peak rain rates in the TRMM distribution can beidentified with the mean location of the eyewall, thepeak rates observed with TRMM for CAT12 to CAT35storms compare well with Marks’s (1985) findings.
In the TRMM statistics, the area extending from theeyewall (35–40 km) to the 111-km radius yields 8.4 and5.7 mm h21 for CAT12 and CAT35 storms, respectively.These rates are larger than those mentioned in Marks(1985). However, TRMM probably overestimates therain rates in the central dense cloud overcast (CDO)region (Lonfat et al. 2000). Rain rates in Allen alsodecreased more sharply with radius compared to otherobservations by Burpee and Black (1989). These authorsalso partitioned the observations into the eyewall andrainband regions. Hurricane Alicia’s eyewall fluctuatedbetween 20 and 35 km, while Hurricane Elena’s eyewallremained at 35 km. The rainband region in Burpee andBlack (1989) extended to 75 km, instead of the 111 kmas in Marks’s study. Both storms were classified asCAT12, with minimum SLP near 960 mb. Rain rates of5.2 and 6 mm h21 in the eyewall and 2.8 and 3.4 mmh21 in the rainband were observed in Alicia and Elena,respectively. TRMM CAT12 mean rates in the eyewalland in the region extending from 35 km to 75 km were7 and 6.4 mm h21, respectively. The ratio of eyewallto rainband rain rate was near 1.8 for both Alicia andElena. The same ratio calculated with TRMM was 1.1.Hence, the TRMM rates in the rainband region are highcompared to that from the radar studies.
Miller (1958) provides a comparison of rainfall in theouter region. The inner 18 box (;60 km radius) and the
average of the 8 surrounding 18 boxes (;200 km radius)yield 6.6 and 3.2 mm h21 for the inner and outer regions,respectively. Using the TRMM CAT12 distribution with60- and 200-km radii, the means are 6.7 and 3.9 mmh21, respectively. Including a larger area in the rainbandmean calculation provides a better result, confirmingthat TRMM tends to overestimate the rain in the regionoutside the eyewall.
Differences in the mean rain rates of various TC in-tensities occur almost exclusively within 250 to 300 km
JULY 2004 1653L O N F A T E T A L .
FIG. 11. Mean rain rates, all 2121 1998–2000 observations, (a) asa function of storm intensity, and (b) as a function of geographiclocations.
FIG. 12. Radial distribution of nonraining observations stratified byTC intensity.
of the storm center, which is partly associated with thedifferent relative contribution of convective to strati-form precipitation at various intensities (Lonfat et al.2000). Furthermore, the frequency distribution of non-raining area with radius relative to the total area alsocontribute to the variability (Fig. 12). Less than 5% ofall observations are larger than 15 mm h21 at 250-kmradius, which is true for all storm intensity groups (Fig.13). The nonraining area in Fig. 12 reaches 65% of theentire area within 250 km. The distributions of non-raining area with TC intensity merge by the 300-kmradius. The decrease in heavy rain, combined with asharp increase in nonraining area, most likely explainsthe variability in the mean rainfall within 250 km of thecenter.
Figure 11b shows the azimuthal mean rain rates strat-ified by TC geographic location. The variability in meanrainfall is large from basin to basin. The mean rain ratesvary between 4 and 10 mm h21 within the inner 50-kmradius. The NIND basin TCs show larger rates than theother basins within the inner 100-km radius. Althoughthe remaining basin distributions look similar, up to 50%differences in mean rates between basins are observedwithin the inner 250 to 300 km. The ECPAC TCs rainless than other basins throughout most of the 350-kmradius shown in Fig. 11b. Three possible scenarios may
explain the basin variability: (a) biases in the TC in-tensity sampling may artificially increase or decreasethe true basin averages by altering the distribution ofobservations among the different TC intensity classesin each basin; (b) the TC variability among intensityclasses in each basin may be responsible for the differentbasin distributions; and (c) differences in the TC-en-vironment interactions in each basin may alter the dis-tribution associated with intensity changes shown in Fig.11a.
Our results do not support the first two scenarios. Thevariability observed in Fig. 11b cannot be explained bya sampling problem. The TRMM observation distri-bution is representative of the natural global distributionof TCs, as expressed by the best track information inTable 1. The ATL basin showed more similar mean rainestimates than other basins, such as NWPAC, eventhough it had more observations of CAT12 and CAT35than any other basin between 1998 and 2000. Also, thetwo basins showing the largest rainfall rates (NIND andSPAC) have only 36% and 31% of observations in thehurricane categories, respectively. ECPAC and NWPAChave similar frequencies, although their mean R distri-butions in Fig. 11b show smaller rates throughout theradial distribution. Consequently, the intensity trendshown in Fig. 11a does not apply to all basins. Hence,the way intensity and rainfall correlate in each basinmust depend on the state of the environment and ocean–atmosphere boundary layers, suggesting (c) is most like-ly the scenario. The intensity trends in each basin needto be computed to confirm this assumption. However,the current database, described in Table 1, is not largeenough to provide significant results in all basins forCAT12 and CAT35.
c. Rain-rate probability with radial distance
Figures 13 and 14 show how the CFRDs by area ofoccurrence evolve with radial distance to the TC center.The CFRDs are computed outward to the 500-km radiusfrom the TC center. Figure 13 shows the CFRD by area
1654 VOLUME 132M O N T H L Y W E A T H E R R E V I E W
FIG. 13. Radial distribution of rainfall PDF computed for 2121observations. The color scale refers to the frequency of occurrenceof rain rates (in dBR scale) at any radial distance from the center.The black line shows the azimuthal mean rainfall with radial distance.
FIG. 14. Radial distribution of rainfall PDFs for (a) TS, (b) CAT12,and (c) CAT35 storms. The color scale and black lines are as describedin Fig. 13.
for all 2121 observations. The mode decreases from4 mm h21 in the inner 50 km to 1 mm h21 by the 200-km radius. At ranges .200 km, the peak remains at 1mm h21.
An important property of the TC rainfall distributionthat the PDF does not account for is the frequency ofoccurrence of nonraining observations. The nonrainingarea is expected to increase with radial distance, as thearea itself increases with the square of the radius. Thecircled curve in Fig. 12 shows the radial distribution ofnonraining observations. The values are the frequenciesof zero rain observations relative to the total number ofobservations at any distance from the TC center. Infer-ring that those values represent the storm nonrainingarea assumes that our sampling of rain and no-rain areasis uniform, as TRMM does not observe the entire stormarea. This assumption is most likely legitimate, as thetotal number of TRMM observations obtained in eachquadrant of the storm is similar.
Several interesting features are noticeable in Fig. 12.The nonraining frequency increases with distance out-ward of 50–100-km radius. A frequency minimum isobserved near 50-km radius (typical radius of maximumrain). Frequencies increase in the inner 30 to 50 km.The inner 50-km increase in frequencies indicates thepresence of the eye. The frequency minimum corre-sponds to the mean location of the eyewall, and thetrend of increasing frequencies with radial distance cor-responds to the increase in area that is not matched bythe rainfall contribution as the radius increases.
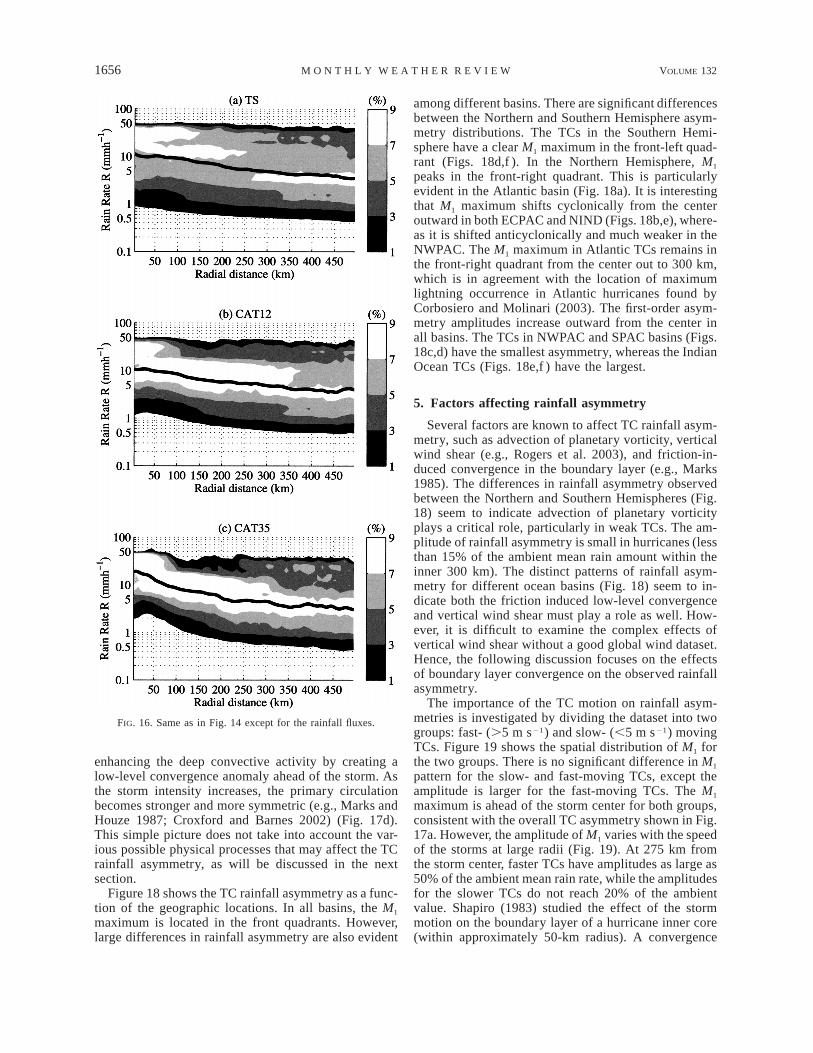
Figure 14 shows the CFRD distributions by area,grouped by storm intensity. The distributions vary withintensity within the 250–300-km radius of the stormcenter. In that region, the mode increases with intensity.Tropical storms have a broader distribution than CAT12and CAT35 in the inner 250 km. Assuming that thewidth of the distribution is a measure of the asymmetric
nature of the TCs, TSs seem more asymmetric in theinner core. In the region beyond 250 km, the CFRDsof CAT12 and CAT35 broaden, indicating an increasein the asymmetry amplitude. In the outer area (range .250 km), the mode is found at 1 mm h21, uniformlythrough all PDFs. The CFRDs in Figs. 13 and 14 showthat at radii .250 km, for all intensities, rain rates.40 mm h21 can still be observed with a probabilityof a few percent.
The general features of the no-rain distribution holdtrue when the data are partitioned with storm intensity.
JULY 2004 1655L O N F A T E T A L .
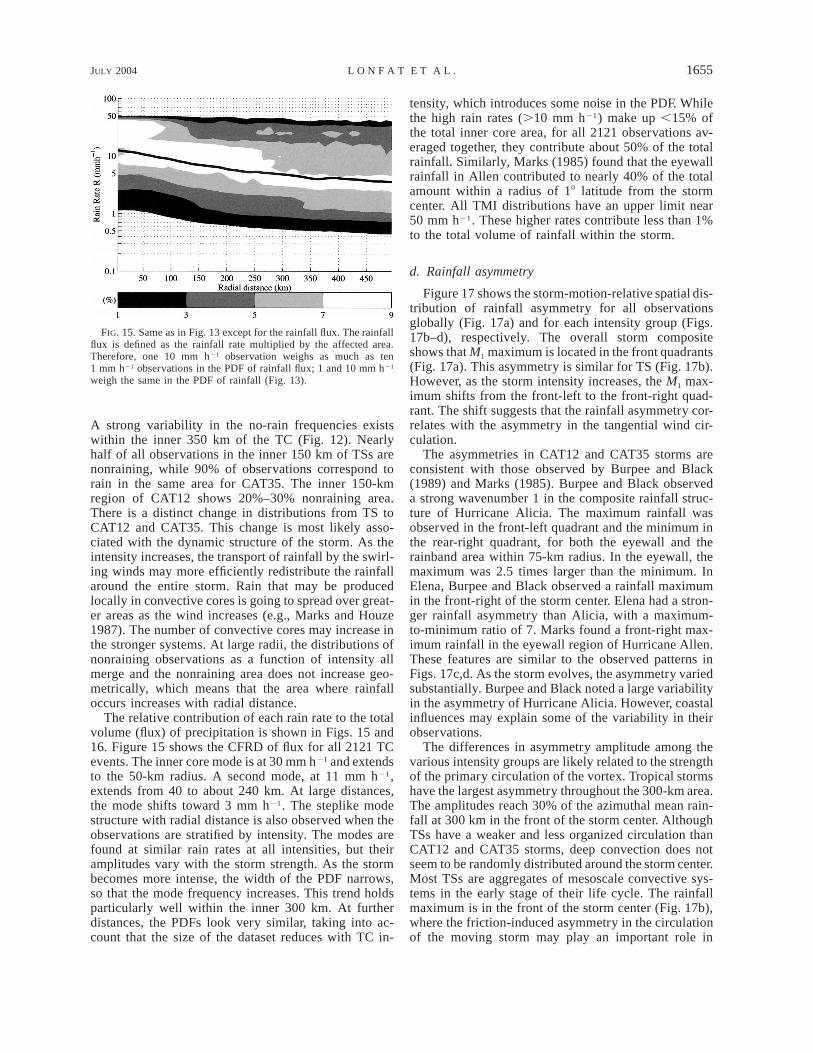
FIG. 15. Same as in Fig. 13 except for the rainfall flux. The rainfallflux is defined as the rainfall rate multiplied by the affected area.Therefore, one 10 mm h21 observation weighs as much as ten1 mm h21 observations in the PDF of rainfall flux; 1 and 10 mm h21
weigh the same in the PDF of rainfall (Fig. 13).
A strong variability in the no-rain frequencies existswithin the inner 350 km of the TC (Fig. 12). Nearlyhalf of all observations in the inner 150 km of TSs arenonraining, while 90% of observations correspond torain in the same area for CAT35. The inner 150-kmregion of CAT12 shows 20%–30% nonraining area.There is a distinct change in distributions from TS toCAT12 and CAT35. This change is most likely asso-ciated with the dynamic structure of the storm. As theintensity increases, the transport of rainfall by the swirl-ing winds may more efficiently redistribute the rainfallaround the entire storm. Rain that may be producedlocally in convective cores is going to spread over great-er areas as the wind increases (e.g., Marks and Houze1987). The number of convective cores may increase inthe stronger systems. At large radii, the distributions ofnonraining observations as a function of intensity allmerge and the nonraining area does not increase geo-metrically, which means that the area where rainfalloccurs increases with radial distance.
The relative contribution of each rain rate to the totalvolume (flux) of precipitation is shown in Figs. 15 and16. Figure 15 shows the CFRD of flux for all 2121 TCevents. The inner core mode is at 30 mm h21 and extendsto the 50-km radius. A second mode, at 11 mm h21,extends from 40 to about 240 km. At large distances,the mode shifts toward 3 mm h21. The steplike modestructure with radial distance is also observed when theobservations are stratified by intensity. The modes arefound at similar rain rates at all intensities, but theiramplitudes vary with the storm strength. As the stormbecomes more intense, the width of the PDF narrows,so that the mode frequency increases. This trend holdsparticularly well within the inner 300 km. At furtherdistances, the PDFs look very similar, taking into ac-count that the size of the dataset reduces with TC in-
tensity, which introduces some noise in the PDF. Whilethe high rain rates (.10 mm h21) make up ,15% ofthe total inner core area, for all 2121 observations av-eraged together, they contribute about 50% of the totalrainfall. Similarly, Marks (1985) found that the eyewallrainfall in Allen contributed to nearly 40% of the totalamount within a radius of 18 latitude from the stormcenter. All TMI distributions have an upper limit near50 mm h21. These higher rates contribute less than 1%to the total volume of rainfall within the storm.
d. Rainfall asymmetry
Figure 17 shows the storm-motion-relative spatial dis-tribution of rainfall asymmetry for all observationsglobally (Fig. 17a) and for each intensity group (Figs.17b–d), respectively. The overall storm compositeshows that M1 maximum is located in the front quadrants(Fig. 17a). This asymmetry is similar for TS (Fig. 17b).However, as the storm intensity increases, the M1 max-imum shifts from the front-left to the front-right quad-rant. The shift suggests that the rainfall asymmetry cor-relates with the asymmetry in the tangential wind cir-culation.
The asymmetries in CAT12 and CAT35 storms areconsistent with those observed by Burpee and Black(1989) and Marks (1985). Burpee and Black observeda strong wavenumber 1 in the composite rainfall struc-ture of Hurricane Alicia. The maximum rainfall wasobserved in the front-left quadrant and the minimum inthe rear-right quadrant, for both the eyewall and therainband area within 75-km radius. In the eyewall, themaximum was 2.5 times larger than the minimum. InElena, Burpee and Black observed a rainfall maximumin the front-right of the storm center. Elena had a stron-ger rainfall asymmetry than Alicia, with a maximum-to-minimum ratio of 7. Marks found a front-right max-imum rainfall in the eyewall region of Hurricane Allen.These features are similar to the observed patterns inFigs. 17c,d. As the storm evolves, the asymmetry variedsubstantially. Burpee and Black noted a large variabilityin the asymmetry of Hurricane Alicia. However, coastalinfluences may explain some of the variability in theirobservations.
The differences in asymmetry amplitude among thevarious intensity groups are likely related to the strengthof the primary circulation of the vortex. Tropical stormshave the largest asymmetry throughout the 300-km area.The amplitudes reach 30% of the azimuthal mean rain-fall at 300 km in the front of the storm center. AlthoughTSs have a weaker and less organized circulation thanCAT12 and CAT35 storms, deep convection does notseem to be randomly distributed around the storm center.Most TSs are aggregates of mesoscale convective sys-tems in the early stage of their life cycle. The rainfallmaximum is in the front of the storm center (Fig. 17b),where the friction-induced asymmetry in the circulationof the moving storm may play an important role in
1656 VOLUME 132M O N T H L Y W E A T H E R R E V I E W
FIG. 16. Same as in Fig. 14 except for the rainfall fluxes.
enhancing the deep convective activity by creating alow-level convergence anomaly ahead of the storm. Asthe storm intensity increases, the primary circulationbecomes stronger and more symmetric (e.g., Marks andHouze 1987; Croxford and Barnes 2002) (Fig. 17d).This simple picture does not take into account the var-ious possible physical processes that may affect the TCrainfall asymmetry, as will be discussed in the nextsection.
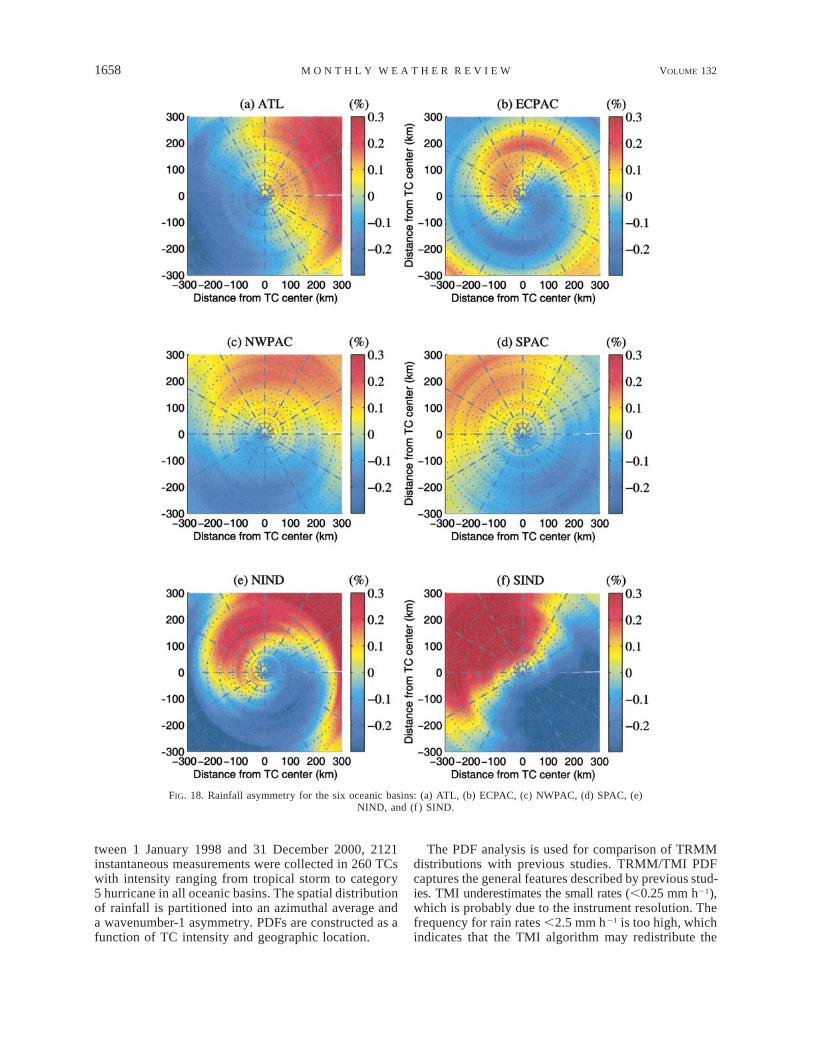
Figure 18 shows the TC rainfall asymmetry as a func-tion of the geographic locations. In all basins, the M1
maximum is located in the front quadrants. However,large differences in rainfall asymmetry are also evident
among different basins. There are significant differencesbetween the Northern and Southern Hemisphere asym-metry distributions. The TCs in the Southern Hemi-sphere have a clear M1 maximum in the front-left quad-rant (Figs. 18d,f ). In the Northern Hemisphere, M1
peaks in the front-right quadrant. This is particularlyevident in the Atlantic basin (Fig. 18a). It is interestingthat M1 maximum shifts cyclonically from the centeroutward in both ECPAC and NIND (Figs. 18b,e), where-as it is shifted anticyclonically and much weaker in theNWPAC. The M1 maximum in Atlantic TCs remains inthe front-right quadrant from the center out to 300 km,which is in agreement with the location of maximumlightning occurrence in Atlantic hurricanes found byCorbosiero and Molinari (2003). The first-order asym-metry amplitudes increase outward from the center inall basins. The TCs in NWPAC and SPAC basins (Figs.18c,d) have the smallest asymmetry, whereas the IndianOcean TCs (Figs. 18e,f ) have the largest.
5. Factors affecting rainfall asymmetry
Several factors are known to affect TC rainfall asym-metry, such as advection of planetary vorticity, verticalwind shear (e.g., Rogers et al. 2003), and friction-in-duced convergence in the boundary layer (e.g., Marks1985). The differences in rainfall asymmetry observedbetween the Northern and Southern Hemispheres (Fig.18) seem to indicate advection of planetary vorticityplays a critical role, particularly in weak TCs. The am-plitude of rainfall asymmetry is small in hurricanes (lessthan 15% of the ambient mean rain amount within theinner 300 km). The distinct patterns of rainfall asym-metry for different ocean basins (Fig. 18) seem to in-dicate both the friction induced low-level convergenceand vertical wind shear must play a role as well. How-ever, it is difficult to examine the complex effects ofvertical wind shear without a good global wind dataset.Hence, the following discussion focuses on the effectsof boundary layer convergence on the observed rainfallasymmetry.
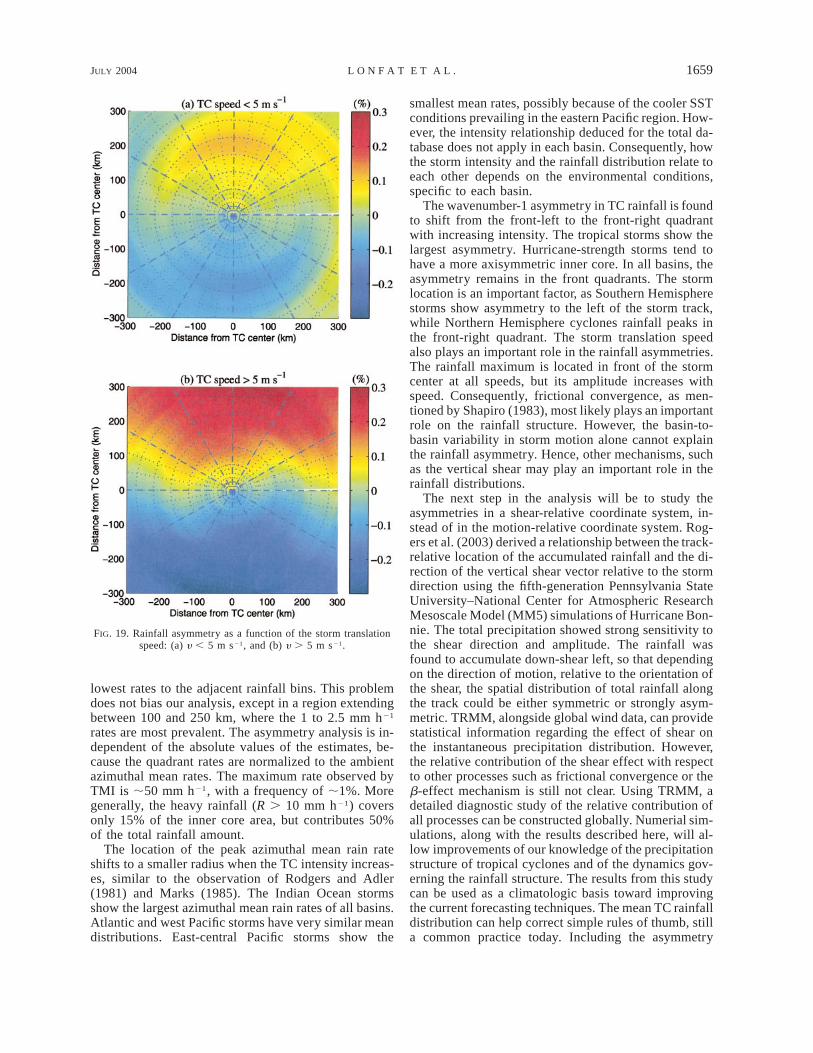
The importance of the TC motion on rainfall asym-metries is investigated by dividing the dataset into twogroups: fast- (.5 m s21) and slow- (,5 m s21) movingTCs. Figure 19 shows the spatial distribution of M1 forthe two groups. There is no significant difference in M1
pattern for the slow- and fast-moving TCs, except theamplitude is larger for the fast-moving TCs. The M1
maximum is ahead of the storm center for both groups,consistent with the overall TC asymmetry shown in Fig.17a. However, the amplitude of M1 varies with the speedof the storms at large radii (Fig. 19). At 275 km fromthe storm center, faster TCs have amplitudes as large as50% of the ambient mean rain rate, while the amplitudesfor the slower TCs do not reach 20% of the ambientvalue. Shapiro (1983) studied the effect of the stormmotion on the boundary layer of a hurricane inner core(within approximately 50-km radius). A convergence
JULY 2004 1657L O N F A T E T A L .
FIG. 17. Rainfall asymmetry calculated in 10-km rings around the storm center, as a function of storm intensity:(a) 2121 TC observations (total distribution), (b) TS, (c) CAT12, (d) CAT35. The storm motion vector is alignedwith the positive y axis. The color scale indicates the amplitude of the normalized asymmetry. The red cor-responds to the maximum positive anomaly and the blue the minimum rainfall within the storm.
anomaly was observed in front of the storm, resultingin enhanced rainfall ahead of the storm center. Theanomaly shifted from the front to the front-right quad-rant with increasing storm speed. Hurricanes Alicia andElena (Burpee and Black 1989) were slow movers. Al-icia’s speed increased from 1.5 to 2.3 m s21 during theperiod of observation. The maximum rainfall shiftedfrom the left to slightly right of the track with increasingspeed. The asymmetry amplitude remained similar. Hur-ricane Elena, slightly faster at 5 m s21, had maximumrainfall in the front-right quadrant. However, the asym-metry amplitude in Elena was twice as large as in Alicia.Although Hurricane Allen was moving much faster thanAlicia and Elena, at 10 m s21, its asymmetry locationand amplitude were comparable to that in Elena. Thiscomplexity is closely related to the storm environmentalconditions as well as storm–environment interactions,which are not well understood.
Each intensity and oceanic basin group can be furtherdivided into the two speed categories defined previously.The number of TCs with translation speed ,5 m s21 isabout 60% for TS, 48.5% for CAT12, and 56.6% for
CAT35, respectively. These numbers do not vary muchwith storm intensity, although CAT12 storms are sloweron average than other groups. However, the TC trans-lation speed varies significantly from basin to basin. OfATL storms, 43% were slow movers, compared to 50.5%in ECPAC, 56% in NWPAC, 76.8% in NIND, 74.9% inSPAC, and 60.8% in SIND systems. Tropical cyclonesin the Indian Ocean basins and the South Pacific are slowmovers, while the Atlantic storms are the fastest on av-erage. If the variability in translation speed can explainthe rainfall asymmetry, one would expect the Atlanticstorms to show the largest asymmetry amplitudes, whilethe Indian Ocean and South Pacific storms should bemore symmetric. Results shown in Fig. 18 do not confirmthis. Hence, other mechanisms, such as the vertical windshear must play at least as important a role as the trans-lation speed on TC rainfall distributions.
6. Conclusions
Precipitation distributions in TCs have been studiedglobally using observations from the TRMM/TMI. Be-
1658 VOLUME 132M O N T H L Y W E A T H E R R E V I E W
FIG. 18. Rainfall asymmetry for the six oceanic basins: (a) ATL, (b) ECPAC, (c) NWPAC, (d) SPAC, (e)NIND, and (f ) SIND.
tween 1 January 1998 and 31 December 2000, 2121instantaneous measurements were collected in 260 TCswith intensity ranging from tropical storm to category5 hurricane in all oceanic basins. The spatial distributionof rainfall is partitioned into an azimuthal average anda wavenumber-1 asymmetry. PDFs are constructed as afunction of TC intensity and geographic location.
The PDF analysis is used for comparison of TRMMdistributions with previous studies. TRMM/TMI PDFcaptures the general features described by previous stud-ies. TMI underestimates the small rates (,0.25 mm h21),which is probably due to the instrument resolution. Thefrequency for rain rates ,2.5 mm h21 is too high, whichindicates that the TMI algorithm may redistribute the
JULY 2004 1659L O N F A T E T A L .
FIG. 19. Rainfall asymmetry as a function of the storm translationspeed: (a) y , 5 m s21, and (b) y . 5 m s21.
lowest rates to the adjacent rainfall bins. This problemdoes not bias our analysis, except in a region extendingbetween 100 and 250 km, where the 1 to 2.5 mm h21
rates are most prevalent. The asymmetry analysis is in-dependent of the absolute values of the estimates, be-cause the quadrant rates are normalized to the ambientazimuthal mean rates. The maximum rate observed byTMI is ;50 mm h21, with a frequency of ;1%. Moregenerally, the heavy rainfall (R . 10 mm h21) coversonly 15% of the inner core area, but contributes 50%of the total rainfall amount.
The location of the peak azimuthal mean rain rateshifts to a smaller radius when the TC intensity increas-es, similar to the observation of Rodgers and Adler(1981) and Marks (1985). The Indian Ocean stormsshow the largest azimuthal mean rain rates of all basins.Atlantic and west Pacific storms have very similar meandistributions. East-central Pacific storms show the
smallest mean rates, possibly because of the cooler SSTconditions prevailing in the eastern Pacific region. How-ever, the intensity relationship deduced for the total da-tabase does not apply in each basin. Consequently, howthe storm intensity and the rainfall distribution relate toeach other depends on the environmental conditions,specific to each basin.
The wavenumber-1 asymmetry in TC rainfall is foundto shift from the front-left to the front-right quadrantwith increasing intensity. The tropical storms show thelargest asymmetry. Hurricane-strength storms tend tohave a more axisymmetric inner core. In all basins, theasymmetry remains in the front quadrants. The stormlocation is an important factor, as Southern Hemispherestorms show asymmetry to the left of the storm track,while Northern Hemisphere cyclones rainfall peaks inthe front-right quadrant. The storm translation speedalso plays an important role in the rainfall asymmetries.The rainfall maximum is located in front of the stormcenter at all speeds, but its amplitude increases withspeed. Consequently, frictional convergence, as men-tioned by Shapiro (1983), most likely plays an importantrole on the rainfall structure. However, the basin-to-basin variability in storm motion alone cannot explainthe rainfall asymmetry. Hence, other mechanisms, suchas the vertical shear may play an important role in therainfall distributions.
The next step in the analysis will be to study theasymmetries in a shear-relative coordinate system, in-stead of in the motion-relative coordinate system. Rog-ers et al. (2003) derived a relationship between the track-relative location of the accumulated rainfall and the di-rection of the vertical shear vector relative to the stormdirection using the fifth-generation Pennsylvania StateUniversity–National Center for Atmospheric ResearchMesoscale Model (MM5) simulations of Hurricane Bon-nie. The total precipitation showed strong sensitivity tothe shear direction and amplitude. The rainfall wasfound to accumulate down-shear left, so that dependingon the direction of motion, relative to the orientation ofthe shear, the spatial distribution of total rainfall alongthe track could be either symmetric or strongly asym-metric. TRMM, alongside global wind data, can providestatistical information regarding the effect of shear onthe instantaneous precipitation distribution. However,the relative contribution of the shear effect with respectto other processes such as frictional convergence or theb-effect mechanism is still not clear. Using TRMM, adetailed diagnostic study of the relative contribution ofall processes can be constructed globally. Numerial sim-ulations, along with the results described here, will al-low improvements of our knowledge of the precipitationstructure of tropical cyclones and of the dynamics gov-erning the rainfall structure. The results from this studycan be used as a climatologic basis toward improvingthe current forecasting techniques. The mean TC rainfalldistribution can help correct simple rules of thumb, stilla common practice today. Including the asymmetry
1660 VOLUME 132M O N T H L Y W E A T H E R R E V I E W
analysis will further refine current techniques, as mostoften the precipitation structure shows at least somedegree of asymmetry.
Acknowledgments. We thank Jeffrey Hawkins andtwo anonymous reviewers from their helpful commentsand suggestions. The first author is supported by theNASA Earth Science System Fellowship (NGT5-30425). This work is partially supported by a NASAGrant NAG5-10963 and a NSF Grant ATM9908944.
REFERENCES
Boyd, J. P., 2001: Chebyshev and Fourier Spectral Methods. 2d ed.Dover, 44 pp.
Burpee, R. W., and M. L. Black, 1989: Temporal and spatial variationsof rainfall near the centers of two tropical cyclones. Mon. Wea.Rev., 117, 2204–2218.
Corbosiero, K. L., and J. Molinari, 2003: The relationship betweenstorm motion, vertical wind shear, and convective asymmetriesin tropical cyclones. J. Atmos. Sci., 60, 366–376.
Croxford, M., and G. M. Barnes, 2002: Inner core strength of Atlantictropical cyclones. Mon. Wea. Rev., 130, 127–139.
Frank, W. M., 1977: The structure and energetics of the tropicalcyclone. Part I: Storm structure. Mon. Wea. Rev., 105, 1119–1135.
Gray, W. M., 1984: Atlantic seasonal hurricane frequency. Part I: ElNino and 30 mb quasibiennial oscillation influences. Mon. Wea.Rev., 112, 1649–1668.
Jordan, C. L., D. A. Hurt, and C. A. Lowrey, 1960: On the structureof hurricane Daisy on 27 August 1958. J. Meteor., 17, 337–348.
Kessler, E., 1958: Eye region of Hurricane Edna, 1954. J. Meteor.,15, 264–270.
Kummerow, C., W. S. Olson, and L. Giglio, 1996: A simplifiedscheme for obtaining precipitation and vertical hydrometeor pro-
——, W. Barnes, T. Kozu, J. Shiue, and J. Simpson, 1998: The tropicalrainfall measuring mission (TRMM) sensor package. J. Atmos.Oceanic Technol., 15, 809–817.
Lonfat, M., F. D. Marks Jr., and S. S. Chen, 2000: Comparison ofTRMM, TMI-PR, and airborne radar data for four major Atlantichurricanes. Eos, Trans. Amer. Geophys. Union, 81 (Fall MeetingSuppl.), Abstract A21G-08.
Marks, F. D., Jr., 1985: Evolution of the structure of precipitation inHurricane Allen (1980). Mon. Wea. Rev., 113, 909–930.
——, and R. A. Houze Jr., 1987: Inner core structure of HurricaneAlicia from airborne Doppler radar observations. J. Atmos. Sci.,44, 1296–1317.
Miller, B. I., 1958: Rainfall rates in Florida hurricanes. Mon. Wea.Rev., 86, 258–264.
Rappaport, E. N., 2000: Loss of life in the United States associatedwith recent Atlantic tropical cyclones. Bull. Amer. Meteor. Soc.,81, 2065–2074.
Rodgers, E. B., and R. F. Adler, 1981: Tropical cyclone rainfall char-acteristics as determined from a satellite passive microwave ra-diometer. Mon. Wea. Rev., 109, 506–521.
——, S. Chang, and H. F. Pierce, 1994: A satellite observational andnumerical study of precipitation characteristics in western NorthAtlantic tropical cyclones. J. Appl. Meteor., 33, 129–139.
Rogers, R., S. S. Chen, J. Tenerelli, and H. Willoughby, 2003: Anumerical study of the impact of vertical shear on the distributionof rainfall in Hurricane Bonnie (1998). Mon. Wea. Rev., 131,1577–1599.
Shapiro, L. J., 1983: The asymmetric boundary layer flow under atranslating hurricane. J. Atmos. Sci., 40, 1984–1998.
——, 1987: Month-to-month variability of the Atlantic tropical cir-culation and its relationship to tropical storm formation. Mon.Wea. Rev., 115, 2598–2614.
Simpson, J., R. F. Adler, and G. R. North, 1988: Proposed tropicalrainfall measuring mission (TRMM) satellite. Bull. Amer. Me-teor. Soc., 69, 278–295.
Wexler, H., 1947: Structure of hurricanes as determined by radar.Ann. N. Y. Acad. Sci., 48, 821–844.