22
PRED 354 TEACH. PROBILITY & STATIS. FOR PRIMARY MATH Lesson 2 Variables, Scales of Measurement, Frequency Distribution and its Shape, Percentiles
| Date post: | 19-Dec-2015 |
| Category: |
Documents |
| View: | 220 times |
| Download: | 2 times |

PRED 354 TEACH. PROBILITY & STATIS. FOR PRIMARY MATH
Lesson 2Variables, Scales of Measurement, Frequency
Distribution and its Shape, Percentiles

Variable
is a characteristic or condition that changes or has different values for different individuals.
Independent variableDependent variableConfounding variable (is uncontrolled variable
that is unintentionally allowed to vary systematically with the IV)

Variable
Class A Class B
IV lecturing Teaching with discovery
DV Final exam scores
Final exam scores
CV Prof. Y Prof. X
Scales of measurement
Nominal scaleconsists of a set of categories that have
different names. (categorize observations, but do not make any
quantitative distinctions between observations)
EX: Describe your occupation! Its lists: “sales”, “professional”, “skilled trade”, and “other”

Scales of measurement
Ordinal scaleconsists of a set of categories that are
organized in an ordered sequence. (rank observations in terms of size or magnitude)
EX: a job supervisor is asked to rank employees in terms of how well they perform their work.

Scales of measurement
Interval and ratio scalesIS: consists of ordered categories where sll of the
categories are intervals of exactly the same size.
RS: is an interval scale with additional feature of an absolute zero point.
(Ratios of magnitude)

Scales of measurement
Interval and ratio scalesEX: Measurements of height for a group 8-year-old boys.
44, 51, 49 and so on.
Convert this initial measurement into a new scale. A child who is 1 cm taller than avegare now gets score +1.A child who is 4 cm taller than avegare now gets score +4.A child who is 2 cm shorter than avegare now gets score -2.

Frequency Distributions
It is an organized tabulation of the number of individuals located in each category on the scale of measurement.
EX: The following set of N=20 scores was obtained from a 10 point statistics quiz.
8, 9, 8, 7, 10, 9, 6, 4, 9, 8,
7, 8, 10, 9, 8, 6, 9, 7, 8, 8,
Frequency Distributions
Proportions and Percentages
It measures the fraction of the total group that is associated with each score
proportion p = f/N
Frequency Distributions
Grouped frequency distribution tables
Rule 1. The grouped frequency distribution table should have about 10 class intervals.
Rule 2. The width of each interval should be relatively simple number.
Rule 3. The bottom score in each class interval should be a multiple of the width.
Rule 4. All intervals should be the same width.

Frequency Distributions
Grouped frequency distribution tables
EX: An instructor has obtained the set of N=25 exam scores shown here.
Scores:
82, 75, 88, 93, 53, 84, 87, 58, 72, 94, 69, 84,
61, 91, 64, 87, 84, 70, 76, 89, 75, 80, 73, 78, 60,

Frequency Distributions
Real limits
When a continous variable is measured, the resulting measurements correspond to intervals on the number line rather than single points.

Frequency Distribution Graph
Histograms
Bar Graphs
Frequency Distributions Polygon

Frequency Distribution Graph
Histograms
1. The height of the bar corresponds to the frequency.
2. The width of the bar extends to the real limits of the score
x f
6 1
5 2
4 2
3 4
2 2
1 1
EX:

Frequency Distribution Graph
Bar graphs
1. The height of the bar corresponds to the frequency.
2. There is a space seperating each bar from the next.
Personality type f
A 10
B 5
C 20
EX:

Frequency Distribution Graph
Frequency distribution polygons
1. The dot is centered above the score.
2. The height of the dot corresponds to the frequency.
EX:
x f
6 1
5 2
4 2
3 4
2 2
1 1

The Shape of a Frequency Distribution Graph
1. Shape.
2. Central tendency.
3. Variability

The Shape of a Frequency Distribution Graph
Type of Shape
1. Symmetrical distribution.
2. Skewed distribution
(the scores tend to pile up toward one end of the scale)
Percentiles, Percentile Ranks and Interpolation
The rank or percentile rank of a particular score is defined as the percentage of individuals in the distribution with scores at or below the particular value.
When a score is identified by its percentile rank, the score is called a percentile.
Percentiles, Percentiles Ranks and Interpolation
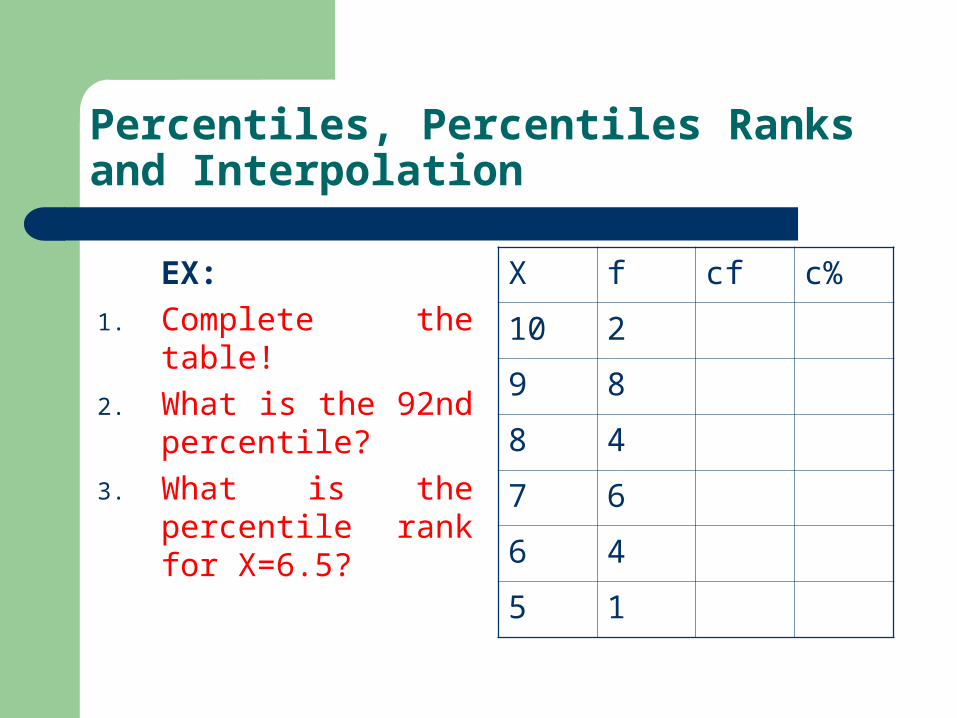
EX:
1. Complete the table!
2. What is the 92nd percentile?
3. What is the percentile rank for X=6.5?
X f cf c%
10 2
9 8
8 4
7 6
6 4
5 1

Percentiles, Percentiles Ranks and Interpolation
The values that are not specifically reported in the table can be estimated through intermediated values by using a standard procedure known as interpolation.
Upper/lower real limits,
EX:
1. What is the percentile rank for X=7?
X f cf c%
10 2
9 8
8 4
7 6
6 4
5 1

Percentiles, Percentiles Ranks and Interpolation
EX:
1. What is the 50 th percentile?
X f cf c%
20-24 2
15-19 3
10-14 3
5-9 10
0-4 2


