Predicting Particle Shape and Impurity Segregation for Molecular Solids Robert B. Hammond Institute of Particle Science & Engineering, School of Process, Environmental and Materials Engineering, University of Leeds, Leeds LS2 9JT, UK.
Transcript
Predicting Particle Shape and Impurity Segregation for Molecular Solids
Robert B. Hammond
Institute of Particle Science & Engineering,School of Process, Environmental and Materials Engineering,
University of Leeds,Leeds LS2 9JT, UK.
Batch Crystallisation• Often the final step in the synthesis of speciality
materials and fine chemicals.• Method can deliver purification of solute in solid
is comparison to solute in solution in energy efficient process however…
• …very sensitive to process conditions as manifested through variations in polymorphic and pseudo-polymorphic form and solid phase purity.
• Combination of experimental in-process analytical techniques and molecular modelling can be used to begin to address these issues.
Crystallisation: Process Engineering
♦ Batch crystallisation from solution phase
Separation/purification of solid drug compound from reaction mother liquor
♦ Process involves product molecular recognition at
growing solid/liquid interface Differentiating between host compound & any
(reaction) hetero impurities ♦ Crystallisation process involves two stages
3-D nucleation-assembly of molecular clusters on nm scale
Simultaneous 2-D crystal growth on all (atomically smooth) particle surfaces (hkl)
FTIR
Supersa-turation
Size
GrowthkineticsUSS
BatchBatchProcessprocess
monitoringmonitoring& control& control
Processconditions
Heat transferLDA/PIV Reaction
CalorimetryMixing &scale-up
CFD
Shape Video microscopy
MSZWUVvis
Nucleationkinetics
Reactantrheology
Polymor-phic form XRD
FTIR
Supersa-turation
Size
GrowthkineticsUSS
BatchBatchProcessprocess
monitoringmonitoring& control& control
Processconditions
Heat transferHeat transferLDA/PIVLDA/PIV Reaction
CalorimetryMixing &scale-upMixing &scale-up
CFDCFD
Shape Video microscopyVideo microscopy
MSZWUVvis
Nucleationkinetics
Reactantrheology
Polymor-phic form XRD
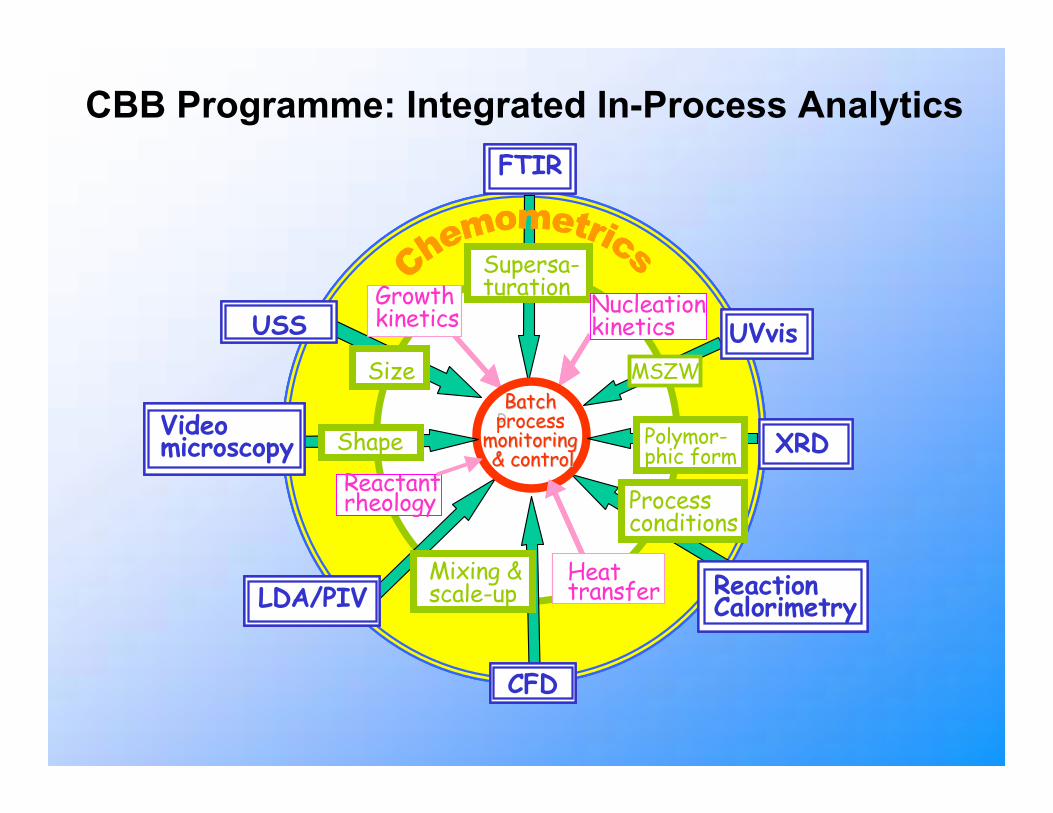
CBB Programme: Integrated In-Process Analytics
Motivation for Research
Why do we use molecular modelling?
• To enable us to exploit, optimally, all information inherent in experimental data; currently data readily obtained but insufficiently utilised.(e.g. crystal structure elucidation from powders)
• To achieve a truly ‘molecule-up’ approach for reliable ab initio prediction of particulate properties. Smallest scale in ‘across the length scales’ approach.
What Sort of Problems can be Addressed?
Formation of particles by crystallisation from solution:
• Particle phase (polymorphism)
• Particle size (related to solution supersaturation)
• Particle shape (growth rate dispersion)
• Particle purity (molecular specificity of surface vs bulk)
• Particle mechanical properties and surface energies
Key is to combine molecular modelling with experimental techniques.
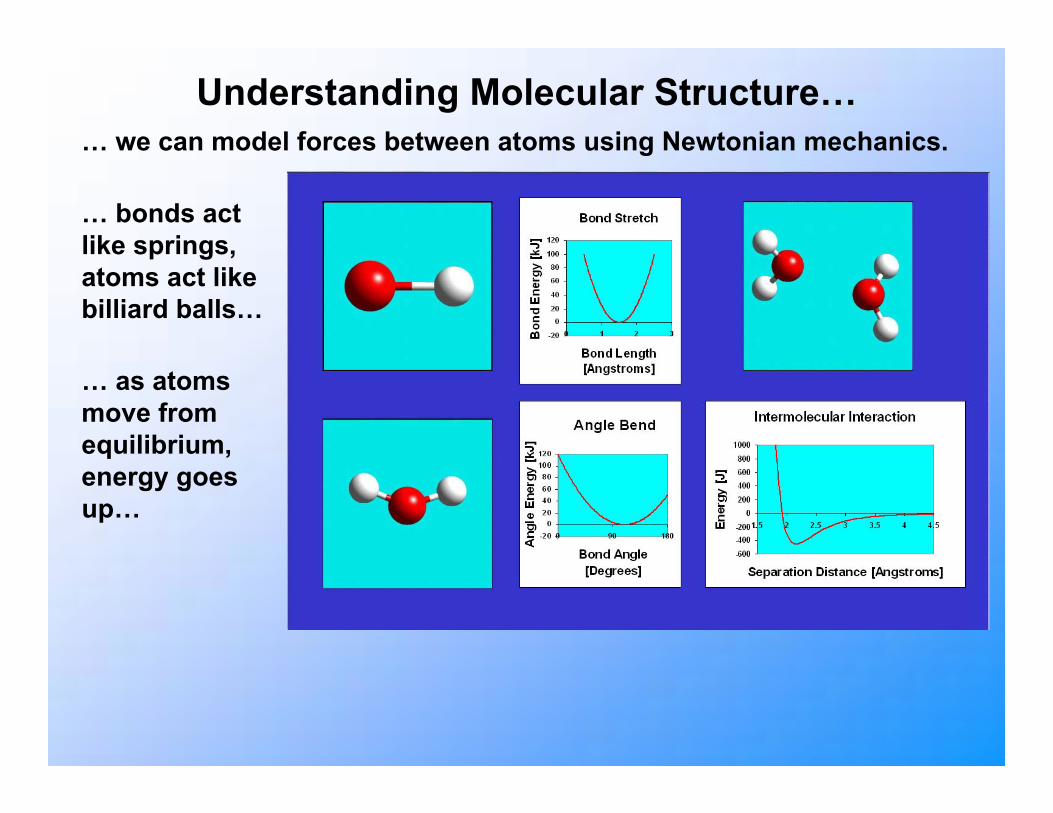
Understanding Molecular Structure…… we can model forces between atoms using Newtonian mechanics.
… bonds act like springs, atoms act like billiard balls…
… as atoms move from equilibrium, energy goes up…
Atom-atom Force Fields
• Utilise a Molecular Mechanics (MM) approach.
• Consist of intra-molecular energy terms: bond energy, bond angle energy, torsion angle energy etc...
( )202
1 llkUbond −=
ij
jin
i
n
j ij
ij
ij
ijbondednon Dr
qqrB
rA
U +−= ∑∑= =
−
1
1
2
16122
1
( )202
1 θθ −= kUangle
( )[ ]0,
cos12
ωω −+= ∑ nV
Ujipairsall
ijtorsion
• ..and inter-molecular energy terms e.g.
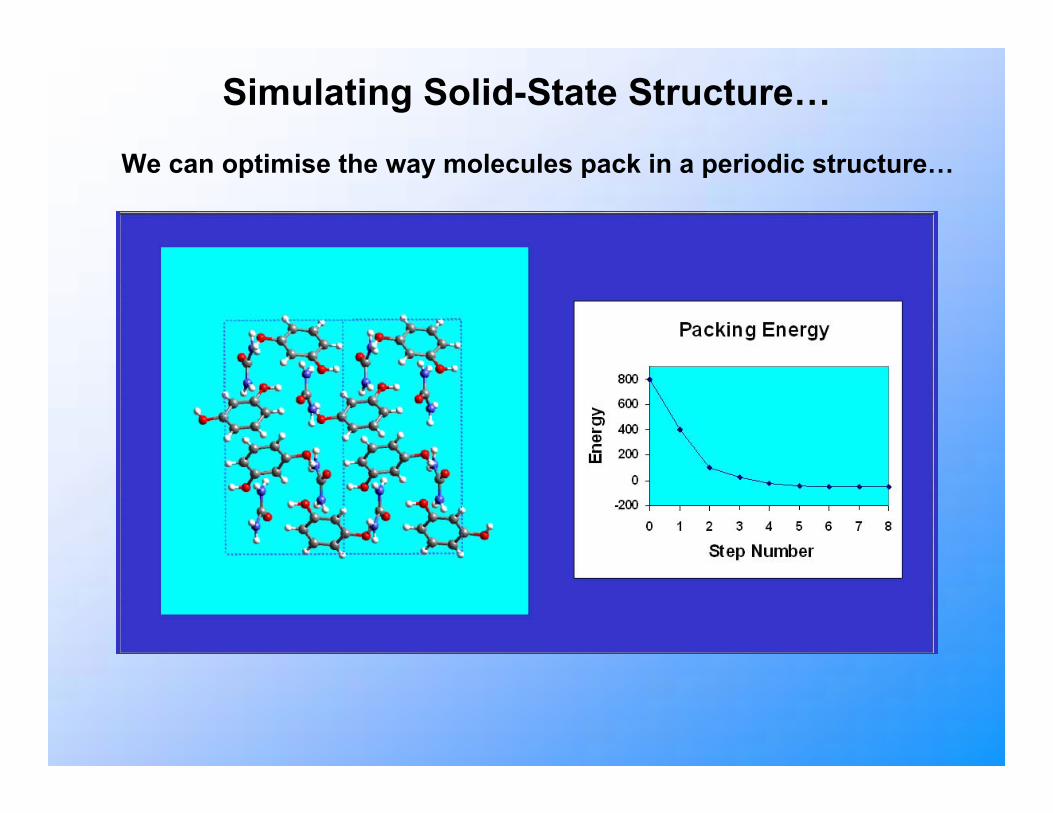
Simulating Solid-State Structure…
We can optimise the way molecules pack in a periodic structure…
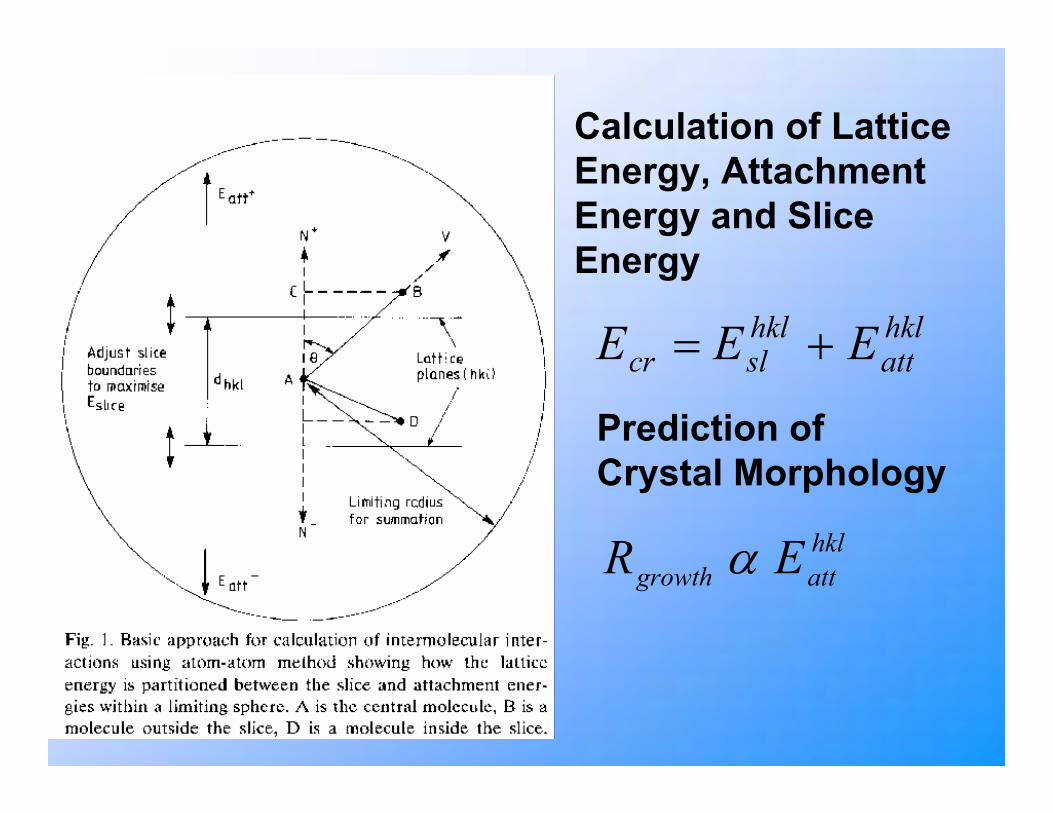
Calculation of Lattice Energy, Attachment Energy and Slice Energy
hklatt
hklslcr EEE +=
Prediction of Crystal Morphology
hklattgrowth ER α
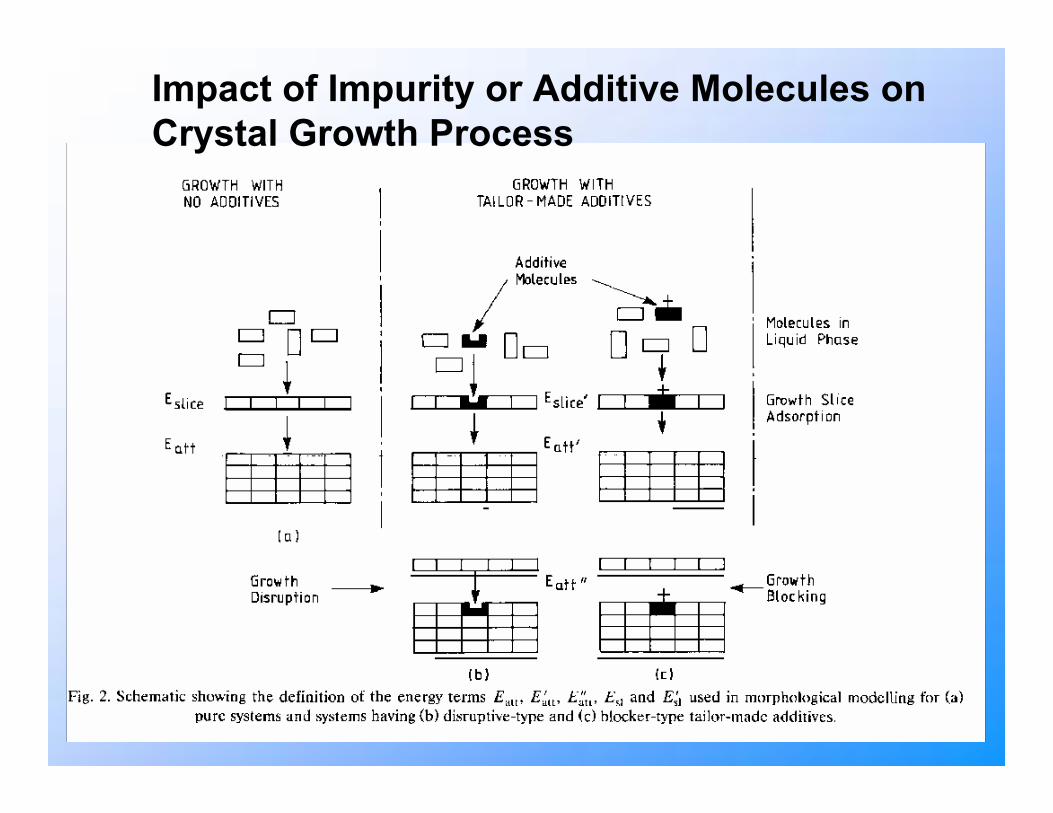
Impact of Impurity or Additive Molecules on Crystal Growth Process
Study of Impurity Segregation in Solid Caprolactam
• Caprolactam precursor in production of nylon-6.• Polymerization process influenced by presence
of impurities.• Melt crystallization is possible purification route
for caprolactam.• Incorporation of impurity molecules into host
solid can be studied by molecular modelling.
OH
O
OH O O
O NOH
NOH
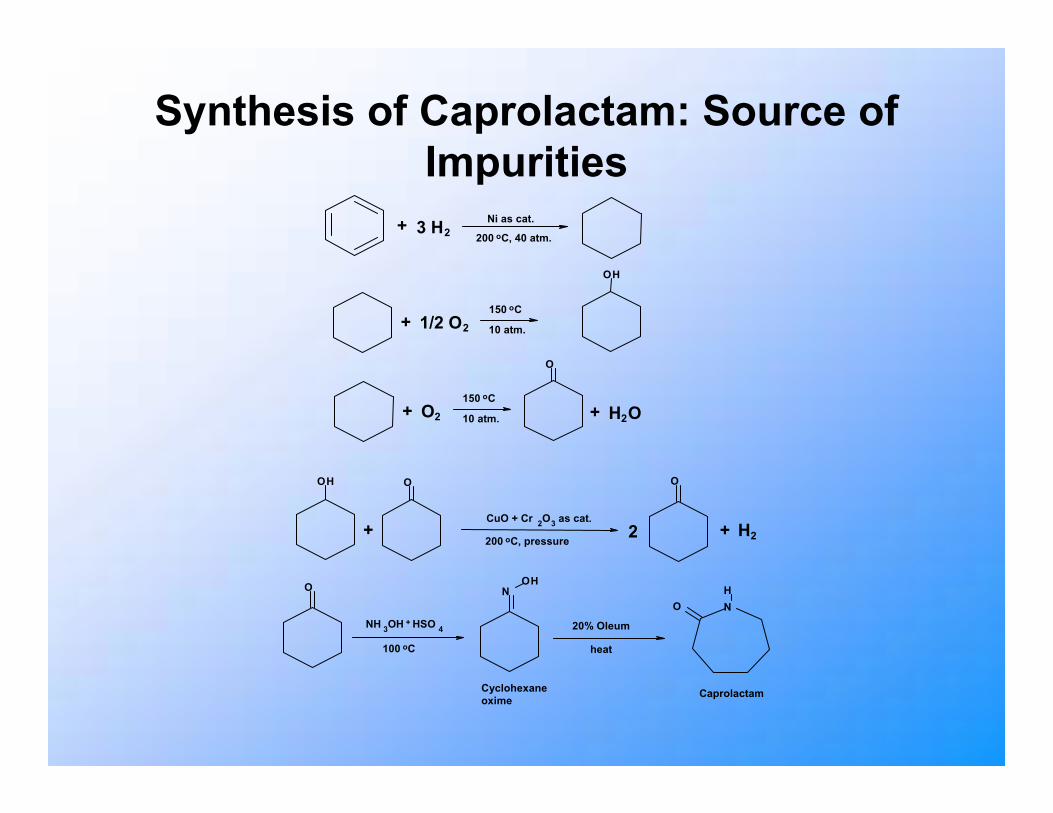
+ 3 H2Ni as cat.
200 oC, 40 atm.
+ 1/2 O2
150 oC
10 atm.
+ O2
150 oC
10 atm. + H2O
+ +2 H2CuO + Cr 2O3 as cat.
200 oC, pressure
NH 3OH + HSO 4
100 oC
20% Oleum
heat
Cyclohexaneoxime Caprolactam
Synthesis of Caprolactam: Source of Impurities
Methodology
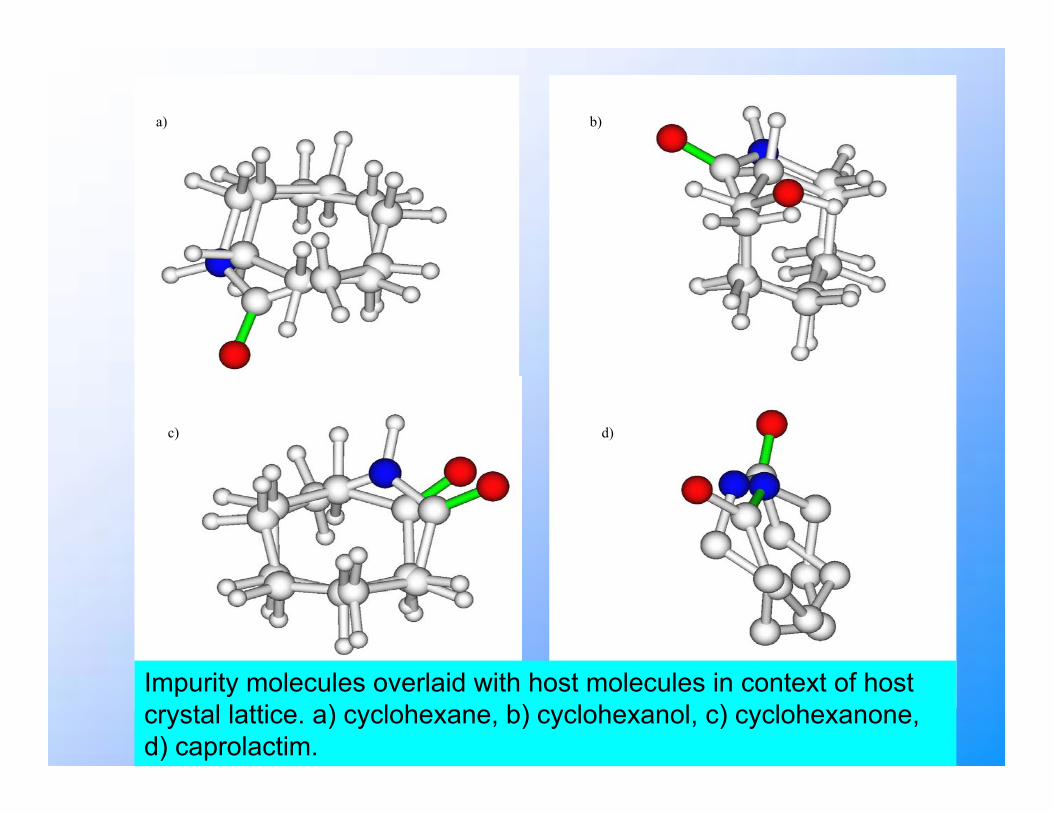
• Construct models of impurity molecules.• Use geometrical fitting to superimpose
impurity on host molecule in context of host lattice.
• Relax impurity molecule w.r.t rigid body rotations and translations to optimise calculated lattice energy.
• Use grid of different starting positions for minimisations to check global minimum in energy found.
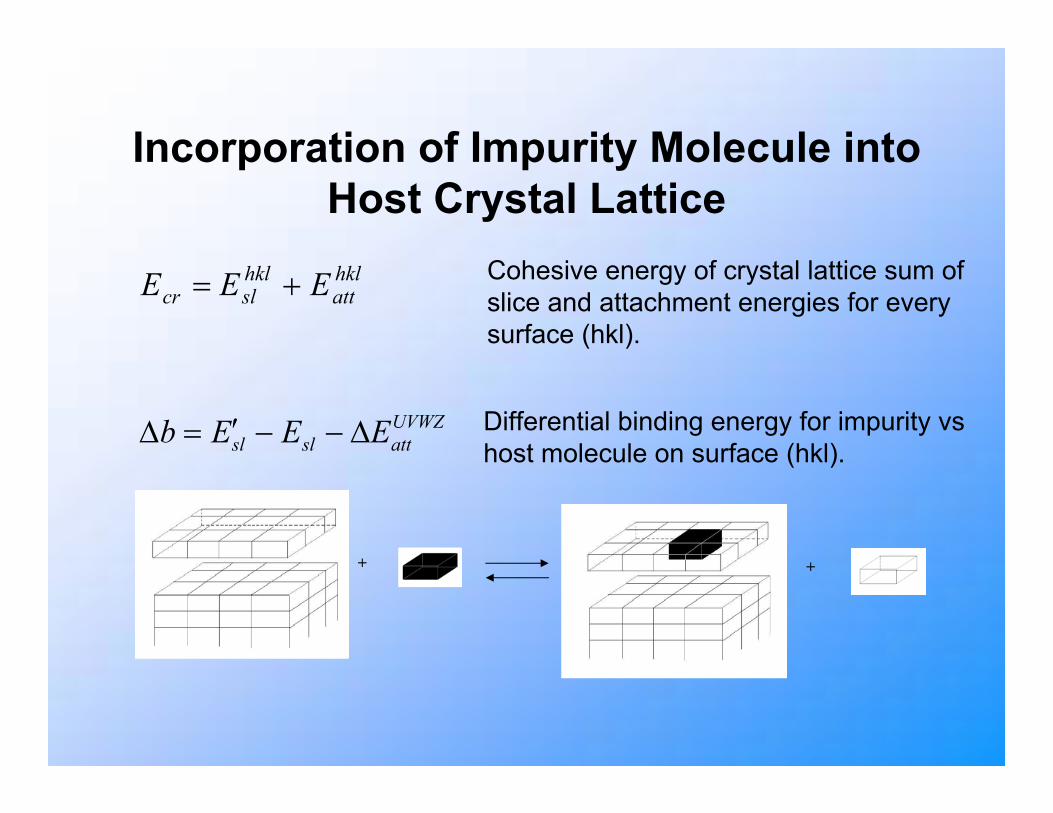
Incorporation of Impurity Molecule into Host Crystal Latticehklatt
hklslcr EEE +=
UVWZattslsl EEEb ∆−−′=∆
+ +
Cohesive energy of crystal lattice sum of slice and attachment energies for every surface (hkl).
Differential binding energy for impurity vshost molecule on surface (hkl).
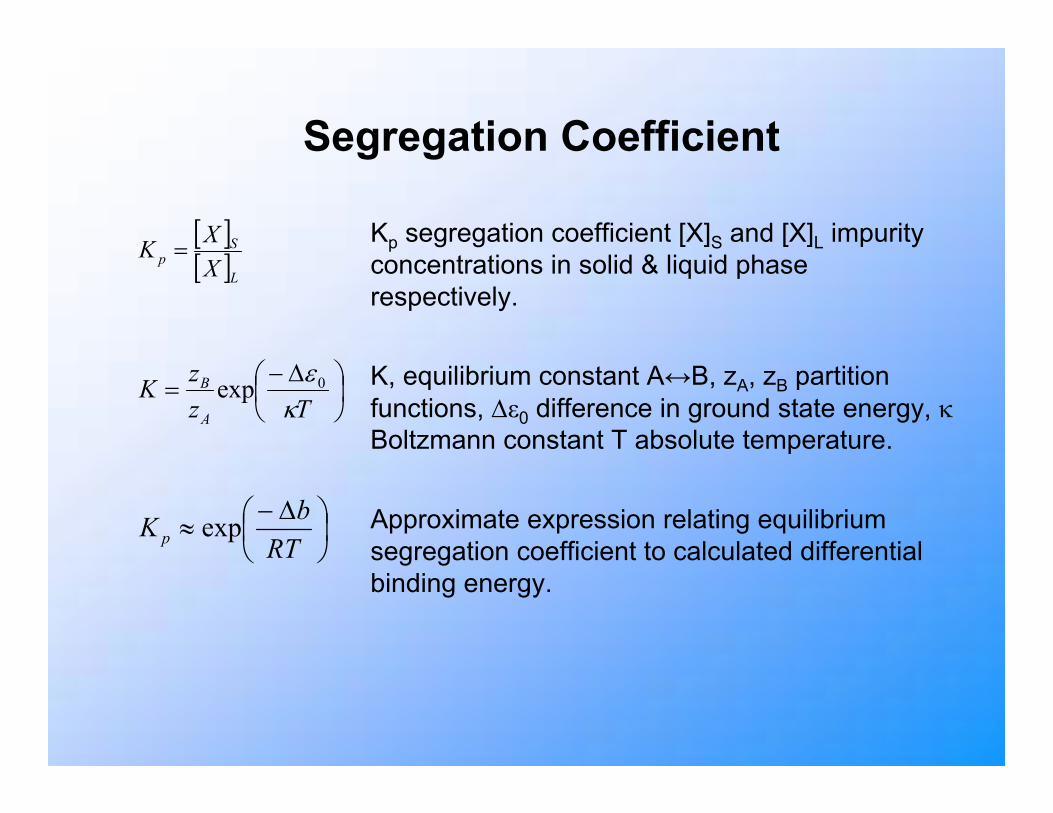
Segregation Coefficient
[ ][ ]L
Sp X
XK =
∆−
=Tz
zKA
B
κε0exp
∆−
≈RTbKp exp
Kp segregation coefficient [X]S and [X]L impurity concentrations in solid & liquid phase respectively.
K, equilibrium constant A↔B, zA, zB partition functions, ∆ε0 difference in ground state energy, κBoltzmann constant T absolute temperature.
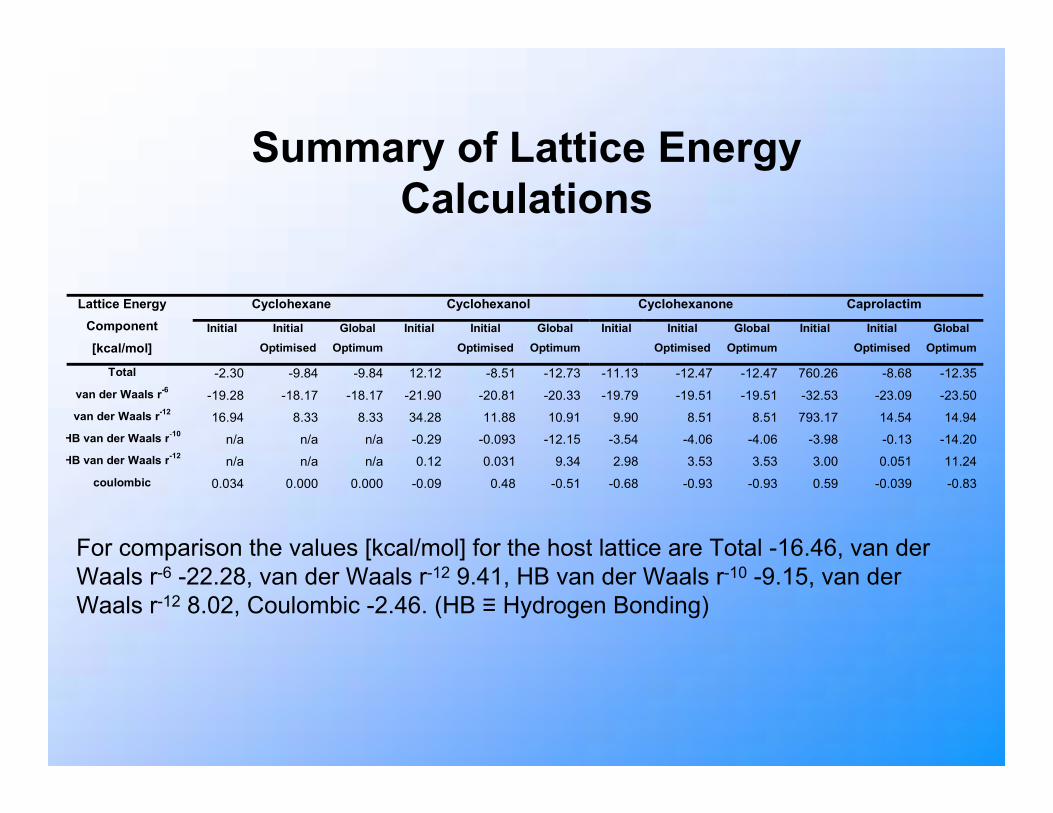
For comparison the values [kcal/mol] for the host lattice are Total -16.46, van derWaals r-6 -22.28, van der Waals r-12 9.41, HB van der Waals r-10 -9.15, van derWaals r-12 8.02, Coulombic -2.46. (HB ≡ Hydrogen Bonding)
Cyclohexane Cyclohexanol Cyclohexanone Caprolactim Rank of cluster Cluster
Energy [kcal/mol]
Number of starting positions in cluster
Cluster Energy [kcal/mol]
Number of starting positions in cluster
Cluster Energy [kcal/mol]
Number of starting positions in cluster
Cluster Energy [kcal/mol]
Number of starting positions in cluster
1 -9.84 42 -12.73 6 -12.47 6 -12.35 12
2 -9.33 22 -12.03 6 -11.61 7 -12.01 6
3 -9.18 23 -10.72 13 -11.35 10 -11.42 2
4 -4.90 3 -10.43 8 -11.08 4 -10.57 3
5 -2.36 2 -10.37 3 -10.96 11 -9.42 12
6 -2.16 2 -9.96 4 -10.78 7 -8.68 7
7 -0.70 6 -9.70 6 -10.43 2 -8.27 5
8 -9.67 10 -10.33 5 -8.20 4
9 -8.88 9 -10.14 13 -8.19 4
10 -8.51 5 -9.89 7 -7.80 4
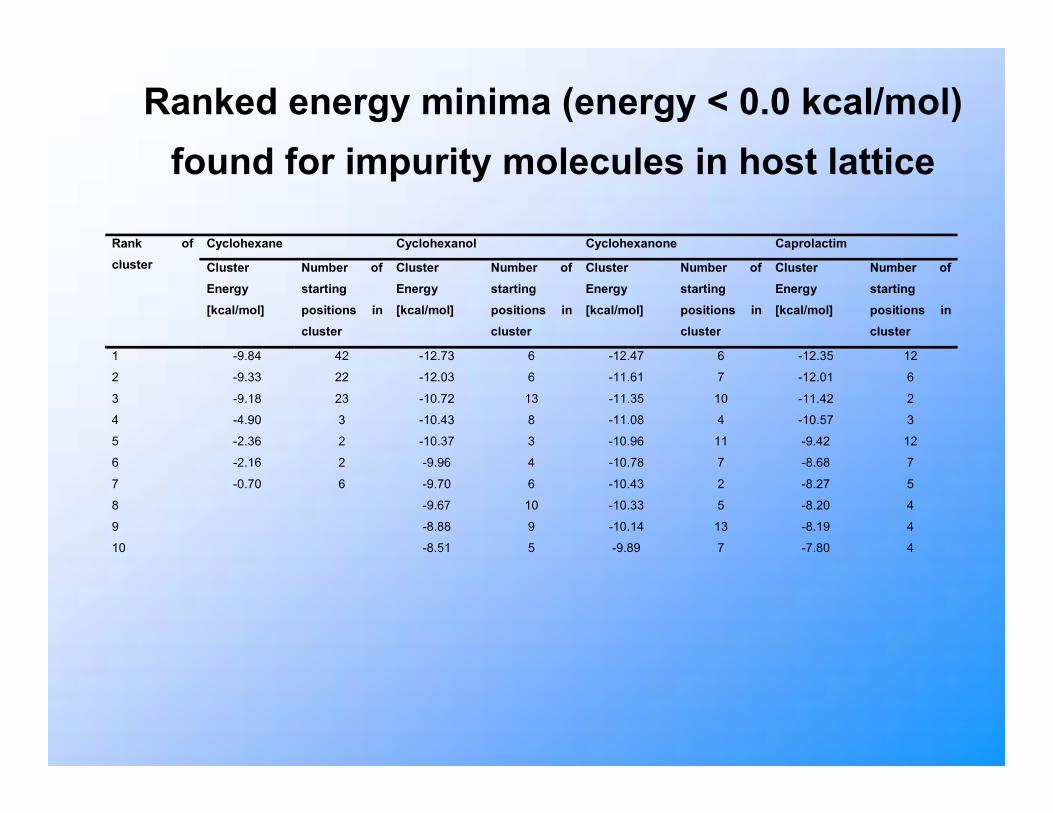
Ranked energy minima (energy < 0.0 kcal/mol) found for impurity molecules in host lattice
a) b)
c)
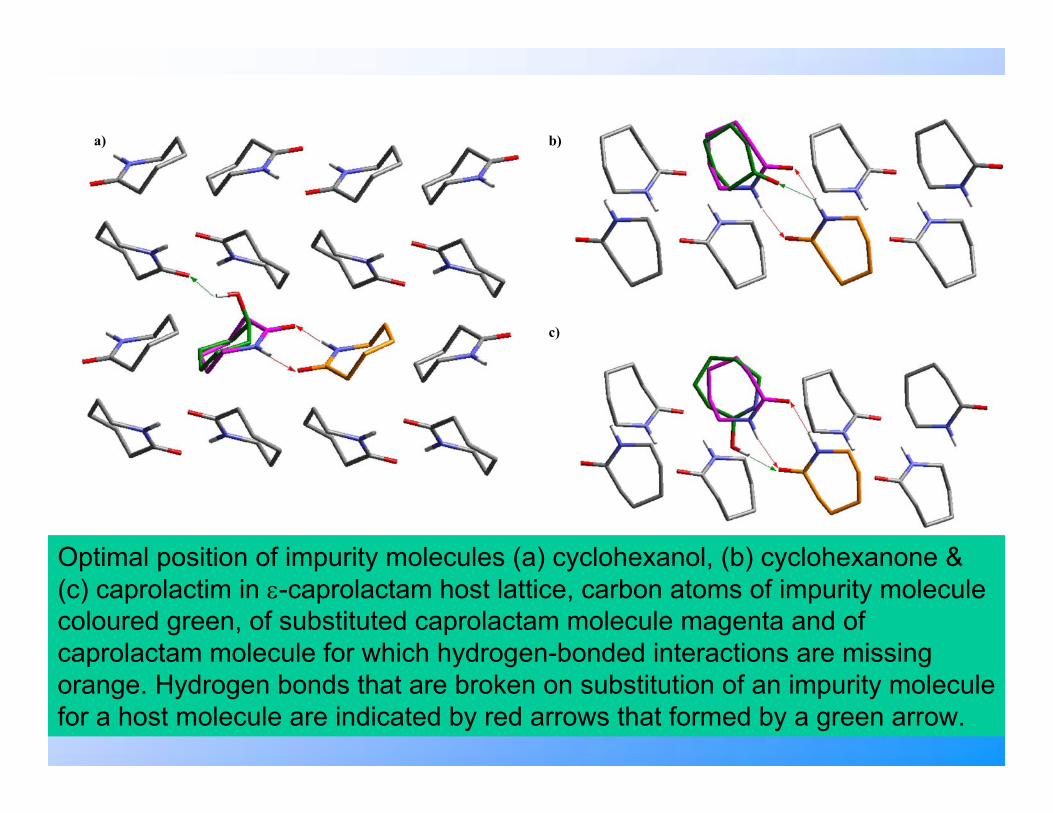
Optimal position of impurity molecules (a) cyclohexanol, (b) cyclohexanone & (c) caprolactim in ε-caprolactam host lattice, carbon atoms of impurity molecule coloured green, of substituted caprolactam molecule magenta and of caprolactam molecule for which hydrogen-bonded interactions are missing orange. Hydrogen bonds that are broken on substitution of an impurity molecule for a host molecule are indicated by red arrows that formed by a green arrow.
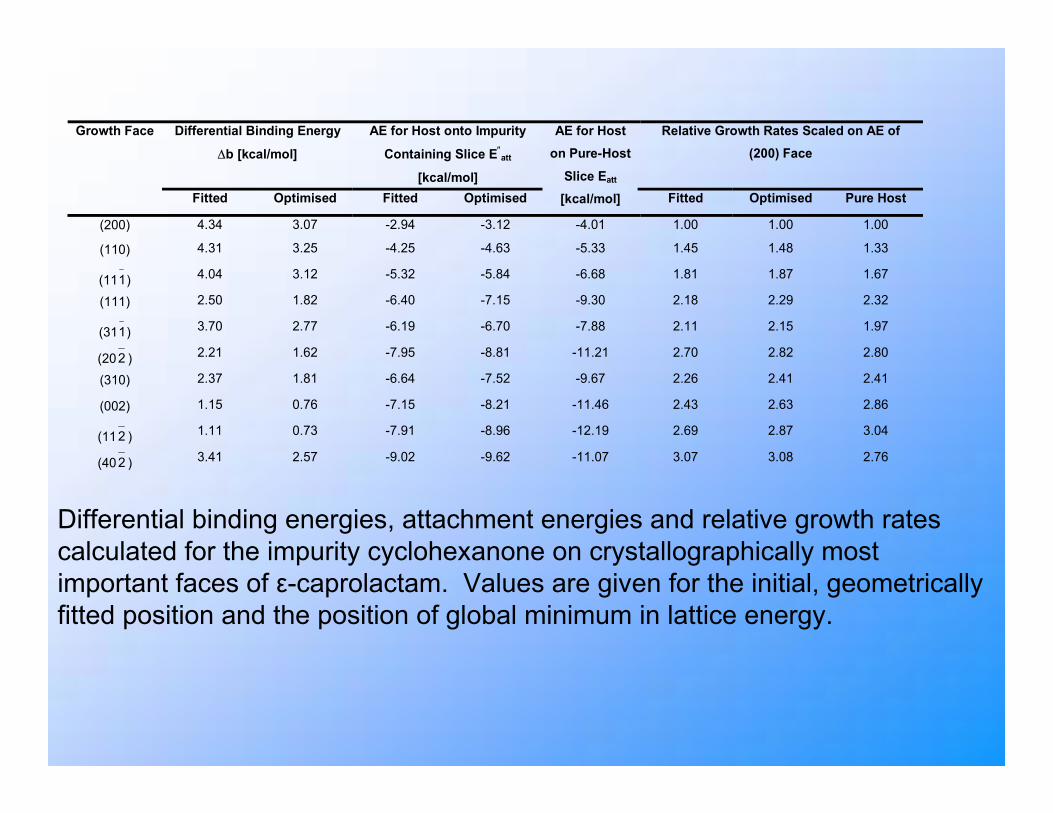
Differential binding energies, attachment energies and relative growth rates calculated for the impurity cyclohexanone on crystallographically most important faces of ε-caprolactam. Values are given for the initial, geometrically fitted position and the position of global minimum in lattice energy.
Cyclohexanone in Melt [mol%]
Supersaturation x 103
( )2m
mm
RTTTH −∆
Segregation Coefficient for {110} Form x 102
Segregation Coefficient
for {11 1 } Form x 102
0.10 1.7 1.4 6.5
3.3 1.4 4.9
5.0 7.3 9.0
5.0 3.3 0.70 2.0
4.1 1.1 3.2
5.8 1.1 4.4
15.0 3.5* 3.7 3.9
3.5* 4.9 2.9
4.4 4.6 3.1
30.0 4.7 0.77 1.1
5.6 1.3 1.0
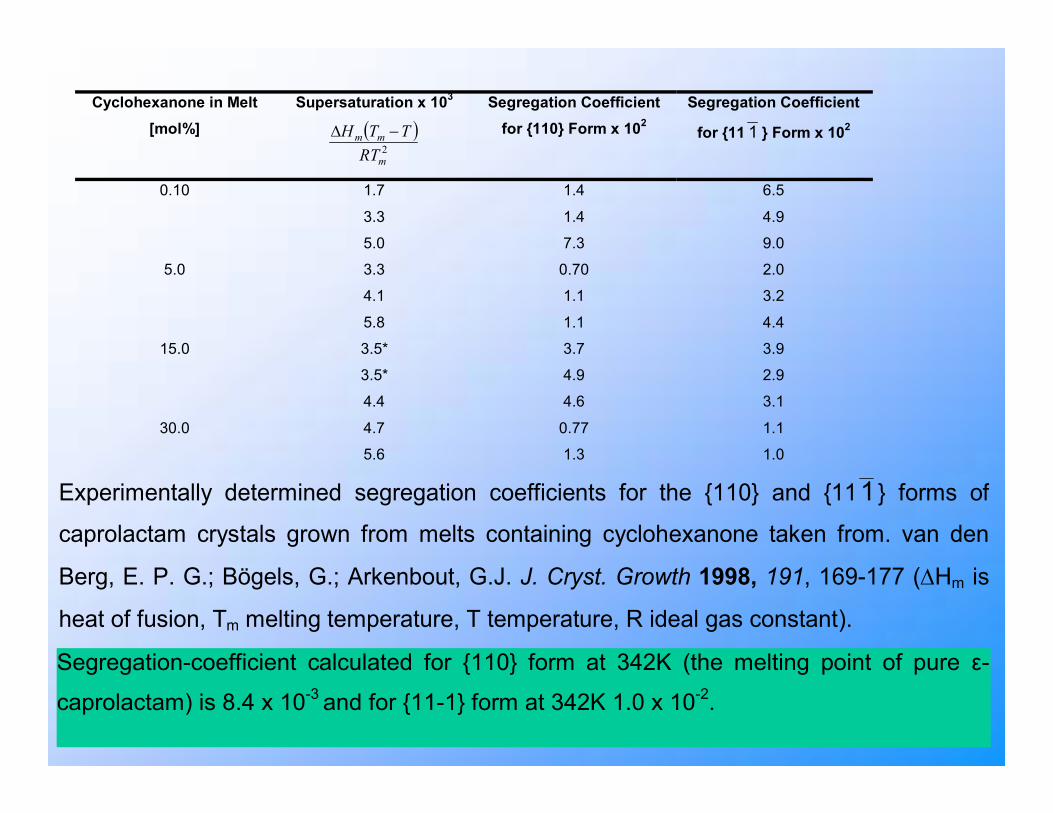
Experimentally determined segregation coefficients for the {110} and {111} forms of
caprolactam crystals grown from melts containing cyclohexanone taken from. van den
Berg, E. P. G.; Bögels, G.; Arkenbout, G.J. J. Cryst. Growth 1998, 191, 169-177 (∆Hm is
heat of fusion, Tm melting temperature, T temperature, R ideal gas constant).
Segregation-coefficient calculated for {110} form at 342K (the melting point of pure ε-
caprolactam) is 8.4 x 10⁻³ and for {11-1} form at 342K 1.0 x 10⁻².
Conclusions• A procedure has been developed for identifying the
most energetically favourable location and orientation of impurity molecules in host crystals.
• A grid searching approach has been employed for identifying minima in the calculated lattice energy in an attempt to ensure that the position of the global minimum in lattice energy is located.
• Using the optimal configurations identified differential binding energies & modified attachment energies are calculated for important growth forms, values enable equilibrium segregation-coefficients to be calculated for each form.