Predicting the coherent X-ray wavefront focal properties at the Linac Coherent Light Source (LCLS) X-ray free electron laser Anton Barty 1,2* , Regina Soufli 1 , Tom McCarville 1 , Sherry L. Baker 1 , Michael J. Pivovaroff 1 , Peter Stefan 3 and Richard Bionta 1 1 Lawrence Livermore National Laboratory, 7000 East Avenue, Livermore, CA, 94550, USA 2 Centre for Free Electron Laser Science, Notkestrasse 85, 22607 Hamburg, Germany 3 SLAC National Accelerator Laboratory, 2575 Sand Hill Road, Menlo Park, California 94025, USA * [email protected]Abstract: The first X-ray free electron laser (XFEL) at keV energies will be the Linac Coherent Light Source (LCLS), located at the SLAC National Accelerator Laboratory. Scheduled to begin operation in 2009, this first-of- a-kind X-ray source will produce ultra-short X-ray pulses of unprecedented brightness in the 0.8 to 8 keV first harmonic photon energy regime. Much effort has been invested in predicting and modeling the XFEL photon source properties at the undulator exit; however, as most LCLS experiments are ultimately dependent on the beam focal spot properties it is equally as important to understand the XFEL beam at the endstations where the experiments are performed. Here, we use newly available precision surface metrology data from actual LCLS mirrors combined with a scalar diffraction model to predict the LCLS beam properties in the experiment chambers. 2009 Optical Society of America OCIS codes: (340.7470) X-ray mirrors; (140.2600) Free electron lasers; (340.0340) X-ray optics. References and links 1. The LCLS Design Study Group, “Linac coherent light source (LCLS) design study report,” SLAC-R-521; UC-414; http://www-ssrl.slac.stanford.edu/lcls/design report/e-toc.html, December 1998. 2. E. L. Saldin, E. A. Schneidmiller, and M. V. Yurkov, “Coherence properties of the radiation from X-ray free electron laser,” Opt. Commun. 281, 1179–1188 (2008). 3. E. L. Saldin, E. A. Schneidmiller, and M. V. Yurkov, The Physics of Free Electron Lasers (Springer, New York, 1999). 4. H. Nuhn, “FEL simulations for the LCLS,” Nucl. Instrum. Methods Phys. Res. A 429, 249-256 (1999). 5. M. Pivovaroff, R. M. Bionta, T. J. Mccarville, R. Soufli, and P. M. Stefan, “Soft X-ray mirrors for the Linac Coherent Light Source,” Proc. SPIE 6705, 670500 (2007). 6. R. Soufli, M. J. Pivovaroff, S. L. Baker, J. C. Robinson, E. M. Gullikson, T. J. McCarville, P. M. Stefan, A. L. Aquila, J. Ayers, M. A. McKernan, and R. M. Bionta, “Development, characterization and experimental performance of x-ray optics for the LCLS free-electron laser,” Proc. SPIE 7077, 707716-1 (2008). 7. T. J. McCarville, P. M. Stefan, B. Woods, R. M. Bionta, R. Soufli, and M. J. Pivovaroff, “Opto-mechanical design considerations for the Linac Coherent Light Source X-ray mirror system,” Proc. SPIE 7077, 70770E (2008). 8. M. Born and E. Wolf Principles of Optics, 7 th expanded ed. (Cambridge University Press, Cambridge, 2003). 9. J.E. Harvey, E.C. Moran and W.P. Zmek “Transfer function characterization of grazing incidence optical systems,” Appl. Opt. 8, 1527 (1988). 10. D. L. Windt, “topo - surface topography analysis,” available at http://www.rxollc.com/idl/index.html. 11. R. Soufli, A. L. Aquila, F. Salmassi, M. Fernández-Perea, and E. M. Gullikson, “Optical constants of magnetron sputtered boron carbide thin films from photoabsorption data in the range 30 to 770 eV,” Appl. Opt. 47, 4633-4639 (2008). 12. R. Soufli, S. L. Baker, J. C. Robinson, E. M. Gullikson, T. J. McCarville M. J. Pivovaroff, P. Stefan, S. Hau-Riege, and R. Bionta, “Morphology, microstructure, stress and damage properties of thin film coatings for the LCLS x-ray mirrors,” to be published in Proc. SPIE 7361 (2009). #110254 - $15.00 USD Received 1 May 2009; revised 17 Jul 2009; accepted 19 Jul 2009; published 18 Aug 2009 (C) 2009 OSA 31 August 2009 / Vol. 17, No. 18 / OPTICS EXPRESS 15508
Transcript
Predicting the coherent X-ray wavefront focal properties at the Linac Coherent Light Source
(LCLS) X-ray free electron laser
Anton Barty1,2*
, Regina Soufli1, Tom McCarville
1, Sherry L. Baker
1,
Michael J. Pivovaroff1, Peter Stefan
3 and Richard Bionta
1
1 Lawrence Livermore National Laboratory, 7000 East Avenue, Livermore, CA, 94550, USA 2 Centre for Free Electron Laser Science, Notkestrasse 85, 22607 Hamburg, Germany
3 SLAC National Accelerator Laboratory, 2575 Sand Hill Road, Menlo Park, California 94025, USA *[email protected]
Abstract: The first X-ray free electron laser (XFEL) at keV energies will be the Linac Coherent Light Source (LCLS), located at the SLAC National Accelerator Laboratory. Scheduled to begin operation in 2009, this first-of-a-kind X-ray source will produce ultra-short X-ray pulses of unprecedented brightness in the 0.8 to 8 keV first harmonic photon energy regime. Much effort has been invested in predicting and modeling the XFEL photon source properties at the undulator exit; however, as most LCLS experiments are ultimately dependent on the beam focal spot properties it is equally as important to understand the XFEL beam at the endstations where the experiments are performed. Here, we use newly available precision surface metrology data from actual LCLS mirrors combined with a scalar diffraction model to predict the LCLS beam properties in the experiment chambers.
1. The LCLS Design Study Group, “Linac coherent light source (LCLS) design study report,” SLAC-R-521; UC-414; http://www-ssrl.slac.stanford.edu/lcls/design report/e-toc.html, December 1998.
2. E. L. Saldin, E. A. Schneidmiller, and M. V. Yurkov, “Coherence properties of the radiation from X-ray free electron laser,” Opt. Commun. 281, 1179–1188 (2008).
3. E. L. Saldin, E. A. Schneidmiller, and M. V. Yurkov, The Physics of Free Electron Lasers (Springer, New York, 1999).
4. H. Nuhn, “FEL simulations for the LCLS,” Nucl. Instrum. Methods Phys. Res. A 429, 249-256 (1999).
5. M. Pivovaroff, R. M. Bionta, T. J. Mccarville, R. Soufli, and P. M. Stefan, “Soft X-ray mirrors for the Linac Coherent Light Source,” Proc. SPIE 6705, 670500 (2007).
6. R. Soufli, M. J. Pivovaroff, S. L. Baker, J. C. Robinson, E. M. Gullikson, T. J. McCarville, P. M. Stefan, A. L. Aquila, J. Ayers, M. A. McKernan, and R. M. Bionta, “Development, characterization and experimental performance of x-ray optics for the LCLS free-electron laser,” Proc. SPIE 7077, 707716-1 (2008).
7. T. J. McCarville, P. M. Stefan, B. Woods, R. M. Bionta, R. Soufli, and M. J. Pivovaroff, “Opto-mechanical design considerations for the Linac Coherent Light Source X-ray mirror system,” Proc. SPIE 7077, 70770E (2008).
8. M. Born and E. Wolf Principles of Optics, 7th expanded ed. (Cambridge University Press, Cambridge, 2003).
9. J.E. Harvey, E.C. Moran and W.P. Zmek “Transfer function characterization of grazing incidence optical systems,” Appl. Opt. 8, 1527 (1988).
10. D. L. Windt, “topo - surface topography analysis,” available at http://www.rxollc.com/idl/index.html.
11. R. Soufli, A. L. Aquila, F. Salmassi, M. Fernández-Perea, and E. M. Gullikson, “Optical constants of magnetron sputtered boron carbide thin films from photoabsorption data in the range 30 to 770 eV,” Appl. Opt. 47, 4633-4639 (2008).
12. R. Soufli, S. L. Baker, J. C. Robinson, E. M. Gullikson, T. J. McCarville M. J. Pivovaroff, P. Stefan, S. Hau-Riege, and R. Bionta, “Morphology, microstructure, stress and damage properties of thin film coatings for the LCLS x-ray mirrors,” to be published in Proc. SPIE 7361 (2009).
#110254 - $15.00 USD Received 1 May 2009; revised 17 Jul 2009; accepted 19 Jul 2009; published 18 Aug 2009
(C) 2009 OSA 31 August 2009 / Vol. 17, No. 18 / OPTICS EXPRESS 15508
13. R. W. Gerchberg and W. O. Saxton, "A practical algorithm for the determination of phase from image and diffraction plane pictures," Optik 35, 237-246 (1972).
14. J. R. Fienup, "Phase retrieval algorithms: a comparison," Appl. Opt. 21, 2758-2769 (1982).
15. J. R. Fienup “Phase-retrieval algorithms for a complicated optical system.” Appl. Opt. 32, 1737 (1993).
16. K. A. Nugent, T. E. Gureyev, D. F. Cookson, D. Paganin, and Z. Barnea “Quantitative Phase Imaging Using Hard X Rays,” Phys. Rev. Lett. 77, 2961 (1996).
17. J. Chalupský, L. Juha, J. Kuba, J. Cihelka, V. Hájková, S. Koptyaev, J. Krása, A. Velyhan, M. Bergh, C. Caleman, J. Hajdu, R. M. Bionta, H. Chapman, S. P. Hau-Riege, R. A. London, M. Jurek, J. Krzywinski, R. Nietubyc, J. B. Pelka, R. Sobierajski, J. Meyer-ter-Vehn, A. Tronnier, K. Sokolowski-Tinten, N. Stojanovic, K. Tiedtke, S. Toleikis, T. Tschentscher, H. Wabnitz, and U. Zastrau “Characteristics of focused soft X-ray free-electron laser beam determined by ablation of organic molecular solids,” Opt. Express 15, 6026 (2007).
18. P. Mercère et.al. “Automatic alignment of a Kirkpatrick–Baez active optic by use of a soft-x-ray Hartmann wavefront sensor,” Opt. Lett. 31, 199 (2006).
19. H. M. Quiney, A. G. Peele, Z. Cai, D. Patterson, and K. A. Nugent “Diffractive imaging of highly focused X-ray fields,” Nat. Phys. 2, 101 (2006).
20. R. G. Paxman and J. R. Fienup “Optical misalignment sensing and image reconstruction using phase diversity,” J. Opt. Soc. Am. A 5, 914 (1988).
1. Introduction
The first X-ray free electron laser (XFEL) will be the Linac Coherent Light Source (LCLS), located at the SLAC National Accelerator Laboratory (SLAC) in California. Scheduled to come online in 2009, this first-of-a-kind X-ray source will produce ultra-short (~100 femtosecond) monochromatic X-ray pulses of unprecedented brightness (10
12 photons/pulse)
in the first harmonic ranging in energy between 0.8 and 8 keV. The revolutionary capabilities of this new X-ray source are anticipated to generate a wealth of ground-breaking new science, with experiments planned in the fields of atomic, molecular and optical science (AMO); soft X-ray scattering (SXR), x-ray pump-probe (XPP); x-ray photon correlation spectroscopy (XPCS); coherent x-ray imaging (CXI); and materials under extreme conditions (MEC) [1]. These experiments rely on the unique combination of coherence, short pulse duration, spectral purity and high peak powers offered by this new FEL source.
Much effort has been invested in predicting and modeling the XFEL photon source properties at the undulator exit [2,3,4]. However many LCLS experiments are ultimately dependent on the wavefront properties at the endstations where experiments are performed. At LCLS, grazing incidence mirrors are used to condition, transport and focus the X-ray beam into the experimental chambers [5,6] and the optical properties of these mirrors will determine the beam quality in the LCLS endstations. Of particular concern are the energy distribution, peak energy density and wavefront error. This is true for experiments that either rely on additional optics to tightly focus beam or use the XFEL beam in an unfocused condition.
LCLS is due to become operational in mid 2009 and experimenters need to know what beam properties can be expected. The first generation of x-ray offset mirrors were specified, designed, engineered and fabricated by a team of scientists, engineers and technicians from National Laboratories and industry led by Lawrence Livermore National Laboratory (LLNL) [5,6,7]. As part of this development cycle extensive metrology has been performed on these mirrors to characterize and quantify their optical errors and verify that they meet specifications [6]. Here, we use these metrology data to predict the focal spot properties in the experiment chambers when LCLS turns on in 2009.
2. The LCLS optical system
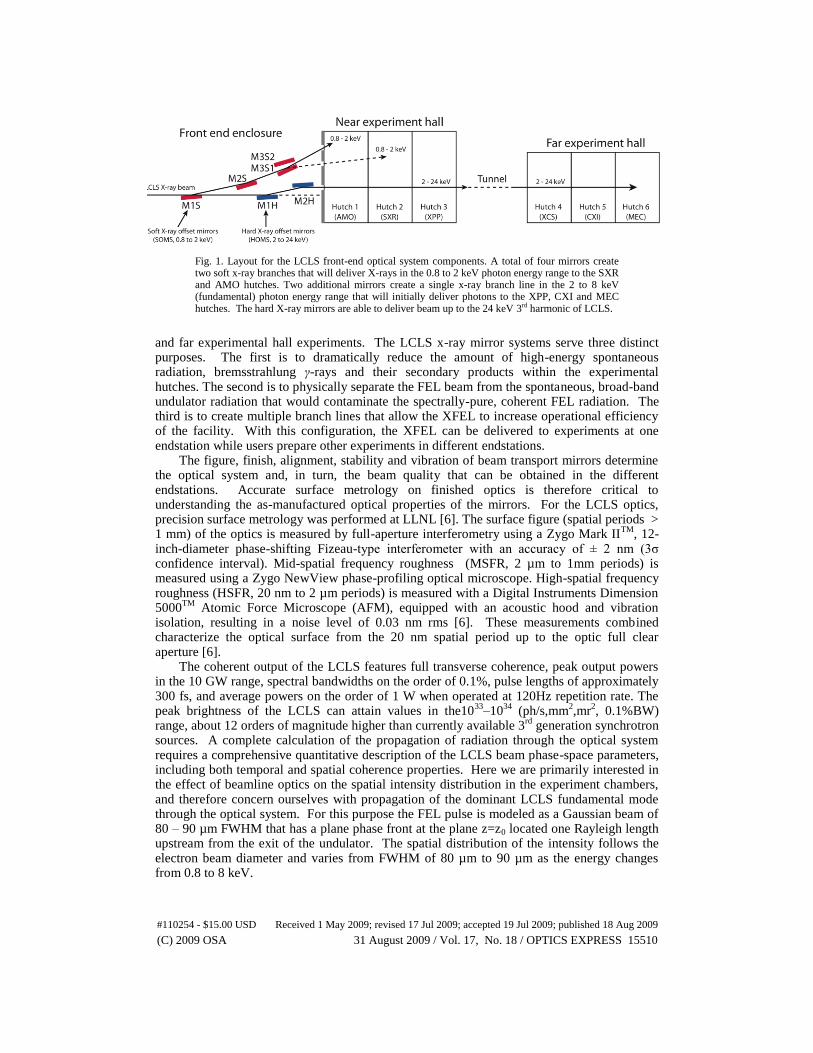
The layout of the LCLS facility has been described in detail elsewhere [1]. This paper discusses the influence of the two X-ray offset mirror systems employed at LCLS. The Soft X-ray Offset Mirrors (SOMS) relies on a total of four mirrors to create two soft x-ray branches that will deliver X-rays in the 0.8–2 keV photon energy range to the SXR and AMO hutches (see Fig. 1). The Hard X-ray Offset Mirror System (HOMS) relies on two additional mirrors, also shown in Fig. 1, to create a single hard x-ray branch line capable of delivering 2-25 keV photons (the maximum energy range of the 3
rd harmonic of the LCLS) to the XPP
#110254 - $15.00 USD Received 1 May 2009; revised 17 Jul 2009; accepted 19 Jul 2009; published 18 Aug 2009
(C) 2009 OSA 31 August 2009 / Vol. 17, No. 18 / OPTICS EXPRESS 15509
and far experimental hall experiments. The LCLS x-ray mirror systems serve three distinct purposes. The first is to dramatically reduce the amount of high-energy spontaneous radiation, bremsstrahlung γ-rays and their secondary products within the experimental hutches. The second is to physically separate the FEL beam from the spontaneous, broad-band undulator radiation that would contaminate the spectrally-pure, coherent FEL radiation. The third is to create multiple branch lines that allow the XFEL to increase operational efficiency of the facility. With this configuration, the XFEL can be delivered to experiments at one endstation while users prepare other experiments in different endstations.
The figure, finish, alignment, stability and vibration of beam transport mirrors determine the optical system and, in turn, the beam quality that can be obtained in the different endstations. Accurate surface metrology on finished optics is therefore critical to understanding the as-manufactured optical properties of the mirrors. For the LCLS optics, precision surface metrology was performed at LLNL [6]. The surface figure (spatial periods > 1 mm) of the optics is measured by full-aperture interferometry using a Zygo Mark II
TM, 12-
inch-diameter phase-shifting Fizeau-type interferometer with an accuracy of ± 2 nm (3σ confidence interval). Mid-spatial frequency roughness (MSFR, 2 µm to 1mm periods) is measured using a Zygo NewView phase-profiling optical microscope. High-spatial frequency roughness (HSFR, 20 nm to 2 µm periods) is measured with a Digital Instruments Dimension 5000
TM Atomic Force Microscope (AFM), equipped with an acoustic hood and vibration
isolation, resulting in a noise level of 0.03 nm rms [6]. These measurements combined characterize the optical surface from the 20 nm spatial period up to the optic full clear aperture [6].
The coherent output of the LCLS features full transverse coherence, peak output powers in the 10 GW range, spectral bandwidths on the order of 0.1%, pulse lengths of approximately 300 fs, and average powers on the order of 1 W when operated at 120Hz repetition rate. The peak brightness of the LCLS can attain values in the10
33–10
34 (ph/s,mm
2,mr
2, 0.1%BW)
range, about 12 orders of magnitude higher than currently available 3rd
generation synchrotron sources. A complete calculation of the propagation of radiation through the optical system requires a comprehensive quantitative description of the LCLS beam phase-space parameters, including both temporal and spatial coherence properties. Here we are primarily interested in the effect of beamline optics on the spatial intensity distribution in the experiment chambers, and therefore concern ourselves with propagation of the dominant LCLS fundamental mode through the optical system. For this purpose the FEL pulse is modeled as a Gaussian beam of 80 – 90 µm FWHM that has a plane phase front at the plane z=z0 located one Rayleigh length upstream from the exit of the undulator. The spatial distribution of the intensity follows the electron beam diameter and varies from FWHM of 80 µm to 90 µm as the energy changes from 0.8 to 8 keV.
Fig. 1. Layout for the LCLS front-end optical system components. A total of four mirrors create two soft x-ray branches that will deliver X-rays in the 0.8 to 2 keV photon energy range to the SXR and AMO hutches. Two additional mirrors create a single x-ray branch line in the 2 to 8 keV (fundamental) photon energy range that will initially deliver photons to the XPP, CXI and MEC hutches. The hard X-ray mirrors are able to deliver beam up to the 24 keV 3rd harmonic of LCLS.
#110254 - $15.00 USD Received 1 May 2009; revised 17 Jul 2009; accepted 19 Jul 2009; published 18 Aug 2009
(C) 2009 OSA 31 August 2009 / Vol. 17, No. 18 / OPTICS EXPRESS 15510
Due to the highly coherent nature of the LCLS FEL beam analysis of the optical propagation from the source to the experimental endstations must be performed in a wave optics formalism. Conventional ray tracing approaches sum the intensities of independently propagated rays and are appropriate for an incoherent source, but neglect the interference between individual rays. For a coherent source such as LCLS, multiple paths to the image plane can interfere with one another requiring the complex field (both amplitude and phase) to be propagated to the plane of interest followed by summation of amplitudes. In this formalism, mirrors and other optical elements in the beam are represented by complex-valued elements describing how the phase and amplitude of the incident beam is modified. Slits and apertures attenuate portions the beam, whilst height errors on the mirrors are translated into phase errors representing the optical path difference introduced on reflection from the mirror surface. The intensity at any point is simply the squared modulus of the complex field and the wavefront error can be deduced from the phase of the complex field. Propagation of the complex optical field between individual optical elements is performed using conventional scalar diffraction integrals [8].
The profile of the optical surfaces determines the phase structure imparted onto the reflected wave-field. For mirrors used at normal incidence the optical path difference (phase error) introduced on reflection from a mirror surface is simply twice the mirror figure (height) error. However, when a mirror is used at an angle theta (defined here from the grazing direction, see Fig. 2) the optical path difference imparted on the incident beam is no longer simply twice the surface height profile. First, given a surface height profile h the wavefront
error W when used at grazing incidence is W 2h sin , where is the grazing angle.
Thus a mirror that would have unacceptable surface errors at normal incidence may still offer
acceptable performance at grazing incidence where sin becomes small. Secondly, the
coordinate system of the mirror surface is foreshortened in the plane defined by the incident beam and surface normal. This geometrical transformation converts position on the mirror in mirror coordinates x into position across the incident beam in optical system coordinates x
according to an x x sin transformation [9]. One important consequence is that a mirror
surface with an isotropic figure and power spectral density distribution in mirror surface coordinates will be transformed into wavefront error with an elliptical power spectral density that contains relatively stronger high spatial frequency components along the direction of foreshortening, as shown in Fig. 2.
Fig. 2. Grazing incidence reduces the magnitude of wavefront error induced by the mirror profile and foreshortens mirror features in the plane of incidence. An important consequence is that isotropic features on the mirror surface will be compressed in one direction, resulting in an anisotropic wavefront error map foreshortened along the plane of incidence.
#110254 - $15.00 USD Received 1 May 2009; revised 17 Jul 2009; accepted 19 Jul 2009; published 18 Aug 2009
(C) 2009 OSA 31 August 2009 / Vol. 17, No. 18 / OPTICS EXPRESS 15511
For the LCLS mirrors we have both surface figure and power spectral density measurements. Surface figure can be directly mapped onto the optical field coordinate system using the geometric transformations described above. However, the treatment of the surface in the mid-spatial frequency roughness (MSFR) and high-spatial frequency roughness (HSFR) ranges is subtler. It would be practically impossible to perform surface metrology at micron resolution over the entire optic surface; therefore the mirror surface is measured on several discrete regions. This is done under the assumption that the mirror surface finish is reasonably uniform and that the combination of measured locations represents adequately the surface topography, which was indeed the case for the mirrors discussed below. First, the Power Spectral Density (PSD) is computed from the height data obtained on discrete locations on the surface, in the MSFR and HSFR range. The PSD is formed by first calculating a two-dimensional Fourier power spectrum of the height data, and the spectrum is then averaged azimuthally around zero spatial frequency to produce a PSD with purely radial spatial frequency dependence [10]. This approach works well for quasi-isotropic surfaces, such as the substrates discussed in this manuscript. The measured PSD curves are then converted into a statistical representation of mirror surface heights, and superimposed on the measured figure errors to produce a complete representation of the optic surface height map over all spatial frequency ranges of interest.
3. Predicted performance for soft X-rays (AMO endstation)
Soft X-rays in the 0.8-2 keV energy range are directed into hutches 1 and 2 in the Near Experimental Hall at LCLS by the Soft X-ray Offset Mirror System (SOMS), as shown in Fig. 1. Although the SOMS consists of a total of four mirrors, only three mirrors are used for each individual soft X-ray beam line. Mirrors M1S and M2S are common to both lines. Mirrors M3S1 and M3S2 are located in a single vacuum vessel, and translation of this stage allows users to steer the XFEL beam into Hutch 1 or Hutch 2. The center of each mirror (or mirror pair) are located at 92.66 m, 95.32 m and 104.23 m from the undulator exit and positioned such that the XFEL is incident upon the mirror surface at a graze angle of 13.85 mrad. The AMO endstation in Hutch 1 is located ~120 m from the undulator exit. Each SOMS mirror consists of a single-crystal Si substrate, 250 mm long, 20 mm wide and 50 mm thick, coated with a 50-nm thick B4C reflective layer deposited by DC-magnetron sputtering at LLNL [5,6,11]. The SOMS Si substrate surface specifications within the SOMS clear aperture (175 mm x 15 mm) are summarized in Table 1.
SOMS Si mirror substrates were polished by InSync Inc. (Albuquerque, New Mexico) and delivered to LLNL for metrology and B4C thin film coating in Fall 2008. The thickness uniformity of the B4C coating was optimized across the 175 mm SOMS clear aperture so that the surface figure error contribution due to the B4C film is 0.14 nm rms [6] and thus negligible compared to the SOMS substrate figure error, when the two are added quadratically. The B4C thin film deposition parameters were also especially modified to relax the inherently very high stress of the B4C film (which was a concern regarding figure deformation and/or delamination) by a factor of 2, while maintaining the HSFR at acceptable levels [6]. After the aforementioned B4C stress reduction, the B4C film stress was determined experimentally to induce a figure deformation with a spherical-term-like shape on the SOMS substrate, which can be corrected using a special bending mechanism during final assembly of the SOMS mirrors [7]. The B4C coating has also been demonstrated to replicate the substrate topography in the MSFR range [6]. The results of surface figure, MSFR and HSFR measurements on the SOMS mirrors, including the effect of the B4C coating in the HSFR region are shown in Fig. 3. The increase in HSFR after coating was accepted as a trade-off for the lower stress offered by this modified B4C film, as discussed above. It should also be noted that, for the SOMS mirrors and photon energies discussed in this manuscript, the HSFR is expected to have minimal effects (if any) on the wavefront properties. A total of 5 SOMS mirrors were fabricated, with the intention to ultimately install four and keep one as a contingency. In our calculations we use the figure and finish data for SOMS substrates sn5, sn4, and sn3 respectively for the M1S, M2S and M3S optics.
#110254 - $15.00 USD Received 1 May 2009; revised 17 Jul 2009; accepted 19 Jul 2009; published 18 Aug 2009
(C) 2009 OSA 31 August 2009 / Vol. 17, No. 18 / OPTICS EXPRESS 15512
Table 2. Mirror elements in the SOMS branch line
Mirror Distance from undulator
Angle of incidence
Angle in global system
Serial number
M1S 92.66 m 13.85 mrad 13.8 mrad SOMS #1
M2S 95.32 m 13.85 mrad 41.5 mrad SOMS #2 M3S1 104.23 m 13.85 mrad 41.5 mrad SOMS #4
M3S2 104.23 m 13.85 mrad 69.2 mrad SOMS #3
Endstation 120 m
Figure 4 shows the intensity distribution predicted at the last pop-in intensity monitor
before the hutch 1 endstation at z=120 m from the undulator exit. The vertical banding structure results from figure error and MSFR components on the mirror surface in the direction parallel to the optical axis as described in Section 2 above. The SOMS substrates exhibited somewhat increased MSFR, and the effect is apparent in Fig. 4 as higher-frequency fine structure, present within and in-between the main bands composing the beam spot. Calculations have been performed to obtain the optimal selection and order of SOMS mirrors, and final alignment will be performed in-situ. For this purpose, feedback from the pop-in monitors located just before the AMO endstation will prove valuable in providing near-real-
Table 1. Surface specifications within the clear aperture (CA) of the SOMS mirror substrates.
Spatial frequency range
Spatial wavelength range
Specification
§ CA to 10-3
µm-1
CA to 1 mm <2 nm RMS and <0.25 µrad RMS
MSFR 10-3
µm-1
– 0.5 µm-1
2 µm – 1 mm < 0.25 nm RMS HSFR 0.5 µm
-1 – 50 µm
-1 20 nm – 2 µm < 0.4 nm RMS
Mirror # Figure (nm RMS) Slope error (µrad RMS)
SN1 1.8 0.19
SN2 1.3 0.2 SN3 1.2 0.37
SN4 0.64 0.14 SN5 1.4 0.37
Fig. 3. Figure (left) measured at LLNL for the five SOMS mirror substrates available to be installed at LCLS. Measured PSD curve (right) for SOMS sn4 mirror, with the PSD in the HSFR range shown before (dash line) and after (solid line) coating with B4C. The MSFR and HSFR properties were similar on all five SOMS mirrors. Bottom: rms values for the figure of each SOMS substrate within the central 200 mm-length, derived after subtraction of the best-fit sphere.
#110254 - $15.00 USD Received 1 May 2009; revised 17 Jul 2009; accepted 19 Jul 2009; published 18 Aug 2009
(C) 2009 OSA 31 August 2009 / Vol. 17, No. 18 / OPTICS EXPRESS 15513
time feedback for optical system alignment in an effort to reduce the observed intensity modulation as much as possible.
Of particular concern to experimenters at LCLS is the intensity distribution expected at the focus inside the experimental endstations. For the AMO instrument in hutch 1 a pair of orthogonal grazing incidence mirrors in Kirkpatrick-Baez configuration will be used to focus the LCLS beam into the center of the AMO instrument. These mirrors have a focal length of 1 m and are designed to produce a focal spot of ~1 µm FWHM. At the time of writing these mirrors have not yet been fabricated and detailed surface metrology data is not yet available. However, assuming an ideal focusing optic system, and using the calculated wavefield at the entrance to the AMO endstation, we can calculate the predicted focal spot properties in the AMO chamber as shown in Fig. 5 above.
The calculated AMO endstation focal spot structure is shown in Fig. 5. The figure displayed is for the brightest spot along the Z-axis, and is compared to the case of a perfect SOMS system (dashed line). Because metrology data are not yet available for the AMO focusing optics this calculation likely places an upper bound on the focusing spot properties given the predicted SOMS front-end performance. One point that is immediately apparent is that the focal spot is likely to vary in shape with energy due to the dependence of wavefront error and propagation properties on the photon energy, for different optical path errors and footprints on the mirrors across the SOMS energy range.
Fig. 4. Calculated intensity distribution of the FEL beam at the last pop-in intensity monitor before the endstation in hutch 1 (at z=120 m from the undulator exit). Calculation takes into account the measured SOMS figure and roughness of all three SOMS mirrors in the beam path. Vertical banding is due to the SOMS figure error and MSFR, which has been foreshortened in one direction due to grazing incidence of the X-ray beam. Intensity images in the SOMS branch at 0.8 and 2.0 keV are shown on the left and horizontal intensity profiles through the maximum on the right (dashed lines are beam profile calculated using ideal optics with no manufacturing surface imperfections).
#110254 - $15.00 USD Received 1 May 2009; revised 17 Jul 2009; accepted 19 Jul 2009; published 18 Aug 2009
(C) 2009 OSA 31 August 2009 / Vol. 17, No. 18 / OPTICS EXPRESS 15514
Several factors are important to LCLS experiments in the AMO chamber, but perhaps none more than obtaining the highest possible peak brightness in the focal spot. This quantity can be quantified by calculating the Strehl ratio – defined as the ratio of the observed peak intensity at the detection plane from a point source compared to the theoretical maximum peak intensity of a perfect imaging system working at the diffraction limit. Given the predicted SOMS front-end performance, we would predict Strehl ratios of ~0.6 at 0.8 keV and ~0.8 at 2 keV. Final Strehl ratios in the AMO endstation will of course depend on the AMO focusing optic performance and final system alignment of the LCLS soft X-ray front-end optics, and we intend to perform a detailed measurement of the actual focal spot properties once LCLS comes on line later this year.
4. Predicted performance for hard X-rays (CXI endstation)
X-rays in the 2-8 keV energy range are directed into hutches 3 through 6 at LCLS by the Hard X-ray Offset Mirrors (HOMS), as shown in Fig. 1. In order to access the hard X-ray beamline, SOMS mirror M1S is translated out of the XFEL beam path [5]. A total of two mirrors deflect the X-rays by ~30 cm horizontally. Each HOMS mirror consists of a single-crystal Si substrate, 450 mm long, 30 mm wide and 50 mm thick coated with a 50-nm thick SiC reflective layer deposited by DC-magnetron sputtering at LLNL [5,6,11]. The surface specifications for the HOMS mirrors within the HOMS clear aperture (385 mm x 15 mm) are
Fig. 5. Focal plane intensity structure in the plane of highest intensity, calculated based on the predicted SOMS front-end performance, figure 3. Solid lines represent the predicted intensity profile and dashed lines represent the case of perfect optics. Strehl ratios for the above two calculations (actual peak intensity relative to the case of ideal optics) are 0.6 at 0.8 keV and 0.8 at 2 keV
#110254 - $15.00 USD Received 1 May 2009; revised 17 Jul 2009; accepted 19 Jul 2009; published 18 Aug 2009
(C) 2009 OSA 31 August 2009 / Vol. 17, No. 18 / OPTICS EXPRESS 15515
summarized in Table 3. Designated M1H and M2H, the HOMS mirrors are located respectively 93.9 m and 105.3 m from the undulator exit with grazing incidence angles of 1.35 mrad, as summarized in Table 3.
Table 3. Mirror elements in the hard X-ray branch line
Mirror Distance from undulator
Angle of incidence
Serial number
M1H 93.9 m 1.35 mrad HOMS #1
M2H 105.3 m 1.35 mrad HOMS #2
Endstation 383 m
The CXI endstation is located in Hutch 5 in the far experimental hall at 383 m from the undulator exit. HOMS mirrors are reflective to 24 keV enabling the 3
rd harmonic to pass into
the hard X-ray branches. HOMS mirror substrates were polished by Carl Zeiss (Oberkochen, Germany) and
delivered to LLNL for metrology and coating in the Fall 2008 and Spring 2009. The SiC film thickness uniformity across the 385 mm HOMS clear aperture has been experimentally optimized so that the surface figure error contribution due to the SiC film is 0.35 nm rms and thus negligible compared to the HOMS substrate figure error, when the two are added quadratically. The SiC thin film deposition parameters have also been especially modified to achieve optimum roughness and stress [12]. The SiC film stress was determined experimentally to induce a figure deformation with a spherical-term-like shape on the HOMS substrate, which can be corrected using a special bending mechanism during final assembly of the HOMS mirrors [7]. The SiC coating has also been demonstrated to replicate the substrate topography in the MSFR range, and should only slightly affect the substrate HSFR in the
spatial period range < 1 m, which is not crucial for the HOMS wavefront properties discussed in this manuscript. For these reasons, the measured results for surface figure and roughness on the HOMS Si substrates shown in Fig. 6 were used in the wavefront propagation calculations and are expected to be fairly representative of the wavefront results from the final, SiC-coated HOMS mirrors. For the purposes of this study we use the figure and finish data for HOMS substrates sn2 and sn3 respectively for the M1H and M2H optics. A total of 4 HOMS mirror substrates have been fabricated, with the intention to ultimately install 2 and use the remaining 2 as spares.
Mirror # Figure (nm RMS) Slope error (µrad RMS)
SN1 2.4 0.27 SN2 1.0 0.27
SN3 2.0 0.22
SN4 1.5 0.23
Fig. 6. Figure error (left) measured at LLNL for the four HOMS mirror substrates, and measured PSD (Right) for HOMS #2 Si substrate. . Bottom: rms values for the figure of each HOMS
substrate within the central 420 mm-length, derived after subtraction of the best-fit sphere.
#110254 - $15.00 USD Received 1 May 2009; revised 17 Jul 2009; accepted 19 Jul 2009; published 18 Aug 2009
(C) 2009 OSA 31 August 2009 / Vol. 17, No. 18 / OPTICS EXPRESS 15516
Figure 7 shows the intensity distribution predicted at the last pop-in intensity monitor before the CXI endstation in hutch 5 of the far experimental hall at z=383 m from the undulator exit. The vertical banding structure visible in Fig. 7 once again results from a combination of figure error and MSFR on the reflecting surface, as well as slight clipping of the LCLS beam at 2 keV. Comparison of the pop-in images between Fig. 4 (SOMS) and Fig. 7 (HOMS) at 2 keV shows a lesser degree of fine intensity structure in the HOMS beamlines. This is attributed to the measured MSFR of the HOMS mirror substrates discussed in this manuscript being lower than the corresponding MSFR of SOMS mirror substrates. Note also that at 2 keV the LCLS beam slightly overfills the HOMS mirrors resulting in some edge effects in the far experimental hall.
As with all LCLS endstations, the intensity distribution at the focus inside the experimental endstations is of particular concern to experimenters. For the CXI instrument, two sets of orthogonal grazing incidence mirrors in Kirkpatrick-Baez configuration will be installed in the experimental chamber. One set of mirrors will have a focal length of ~1m and is designed to produce a focal spot of ~1 µm FWHM, whilst a second set with shorter focal distance will be used to produce a smaller focal spots of ~100nm FWHM. At the time of writing the CXI focusing mirrors have not yet been fabricated, and detailed as-manufactured surface metrology data are not yet available.
Fig. 7. Calculated intensity distribution of the FEL beam at the last pop-in intensity monitor before the CXI endstation in hutch 5 (at z=383 m from the undulator exit). Intensity images at at 0.8 and 2.0 keV are shown on the top and horizontal intensity profiles through the maximum are plotted on the bottom Solid lines represent the predicted intensity profile and dashed lines represent the case of perfect optics.
#110254 - $15.00 USD Received 1 May 2009; revised 17 Jul 2009; accepted 19 Jul 2009; published 18 Aug 2009
(C) 2009 OSA 31 August 2009 / Vol. 17, No. 18 / OPTICS EXPRESS 15517
The calculated focal spot structure in the CXI endstation using a 1m focusing optic is shown in Fig. 8 for the brightest spot along the Z-axis. Once again peak power levels are of importance to experimenters, and we look at the Strehl ratio as a measure of focusing quality. Given the predicted HOMS front-end performance we would predict Strehl ratios of ~0.57 at 2 keV and ~0.94 at 8 keV, as shown in Fig. 8. Once again actual system performance ultimately depends on optic alignment and final Kirkpatrick-Baez optic manufacturing quality. This will be thoroughly characterized as a part of the CXI instrument commissioning procedure and reported at a later time.
7. Diagnostics and wavefront measurement
Finally we turn our attention to the task of aligning the LCLS front-end optics and measuring the in-situ focal spot performance. The LCLS front-end design incorporates pop-in intensity monitors located immediately behind each mirror pair, and these can be used to diagnose the intensity profile of the beam immediately after each mirror. This setup reveals intensity changes in the beam, but does not directly yield vital information on the wavefront quality of the beam. In the absence of any practical interferometric measurement scheme, the wavefront must instead be inferred from changes in the intensity profile from mirror to mirror combined with appropriate phase retrieval techniques [13,14,15,16]. This enables characterization of the wave-field entering the various experimental stations, and can be used to predict but not measure the actual focal spot properties at the beam focus.
Fig. 8. Calculated focal plane intensity distribution at the focus of the CXI endstation using the 1m focal length K-B optics. Solid lines are the predicted intensity profile and dashed lines represent the case of perfect optics. Strehl ratios for the above two calculations (actual peak intensity relative to the case of ideal optics) are 0.57 at 2 keV and 0.94 at 8 keV.
#110254 - $15.00 USD Received 1 May 2009; revised 17 Jul 2009; accepted 19 Jul 2009; published 18 Aug 2009
(C) 2009 OSA 31 August 2009 / Vol. 17, No. 18 / OPTICS EXPRESS 15518
Of key importance to experimenters is the focal spot structure in the experimental interaction region. Directly measuring the focal spot structure is challenging for two reasons: first, the focal spot sizes are comparatively small compared to the resolution of optical scintillators and microscope diagnostics; secondly, the focal spot power density is sufficiently high to ablate or destroy any diagnostic placed directly at the focus. The ablation of selected materials placed at the focus can be used to estimate the beam profile and spot structure at full power [17], and this will be done at LCLS to measure the focal spot structure. Measurement of the focus can also be performed using a variety of phase retrieval techniques combined with coherent propagation to the focal region. Appropriate wavefront measuring techniques include installing an X-ray Hartmann wavefront sensor downstream of focus [18], using iterative wavefront recovery using a single defocused image and knowledge of the pupil plane illumination [19], and employing the technique of phase diversity [20]. The latter approach, comprising an iterative phase retrieval technique with multiple modulus constraints and no real space constraint, offers promise for diagnosing the focal spot structure using defocused intensity measurements in the focal spot region. The use of these techniques for measuring the LCLS focal spot performance, and actual performance obtained using the final focusing optics, will be reported in a subsequent paper once LCLS becomes operational later in 2009.
8. Conclusions
The focal spot structure at the LCLS X-ray free electron laser is of key importance to many planned experiments. To date investigations have concentrated only on the undulator output. Precision surface metrology data are now available for the X-ray optics that will transport the LCLS beam to the experimental endstations. We have used these metrology data to predict the beam wavefront structure expected at LCLS and we have shown that figure error and MSFR will give rise to significant intensity variations in the beam spot just before the final optics of each LCLS experiment. Variations of 50% or more from the ideal Gaussian beam shape can be expected, particularly in the SOMS branch lines. Intensity variations in the HOMS branch lines is expected to be less pronounced compared to the SOMS branch lines, due to a combination of lower intrinsic figure and MSFR of the HOMS mirror substrates when compared to the SOMS mirror substrates, shorter X-ray wavelengths, significantly lower angle of incidence of the HOMS mirrors compared to SOMS and lower figure and MSFR of the HOMS mirrors when compared to the SOMS mirrors. Due to the highly coherent light produced by LCLS this difference in surface finish (polish) manifests itself as increased intensity modulation in the propagated beam – an effect observed earlier in optics installed on undulator beamlines at synchrotron light sources. Indeed the methodology employed here – namely coherent wavefront propagation as opposed to ray tracing simulation – is necessary to understand and drive the polishing requirements for a wide range of coherent X-ray optics intended for use with synchrotron, high harmonic generation and free electron laser X-ray sources. The same methodology was employed to select the substrates (within each of the available SOMS and HOMS substrate sets) that would best cancel out wavefront errors and thus result in optimum performance. Once LCLS becomes operational, a more detailed and comprehensive investigation, including comparison of predicted and actual LCLS beam performance, will be the subject of a subsequent manuscript. Our purpose here is to give an initial prediction of focal spot properties based on currently available metrology data. Rapid dissemination of these results is critical to the scientific community currently in the final stages of planning experiments at LCLS.
Acknowledgments
The authors wish to thank the LCLS executive management (SLAC) and Donn McMahon (LLNL) for encouragement and funding for this manuscript. We are grateful to Jeff C. Robinson and Mark McKernan (LLNL) for technical assistance. This work was performed under the auspices of the U.S. Department of Energy by Lawrence Livermore National Laboratory in part under Contract W-7405-Eng-48 and in part under Contract DE-AC52-07NA27344. This work was performed in support of the LCLS project at SLAC.
#110254 - $15.00 USD Received 1 May 2009; revised 17 Jul 2009; accepted 19 Jul 2009; published 18 Aug 2009
(C) 2009 OSA 31 August 2009 / Vol. 17, No. 18 / OPTICS EXPRESS 15519