Page 1
Final thesis for the obtainment of the M.Sc. degree (Master of Science)
Predicting the Consumption of Young Adults concerning
Sugared and Sugar-free Beverages
Karen Dinkhoff University Twente
Niedenkampstr. 14 Communication Science
48565 Steinfurt Submitted to Dr. M.E. Pieterse
Tel.: 0172/2507861 and Drs. J.W.M. Verhoeven
Email: [email protected]
Page 2
2
Acknowledgment
Firstly I would like to thank the agency fischerAppelt Kommunikation GmbH for the
opportunity to develop this master thesis in the course of an internship. Furthermore, I
want to thank them for their qualified support.
Special thanks to the Healthcare team for all information and to Mrs. Susanne
Straetmans for her helpful supervision.
I would like to express my sincere appreciation to Dr. Marcel Pieterse and Drs. Joost
Verhoeven who helped me with words and deeds during this master thesis.
Page 3
3
Management Summary
In the course of an internship at the agency fischerAppelt Kommunikation GmbH a
quantitative study was developed and accomplished with the aim to obtain information
about the choice of non-alcoholic beverages made by young adults. On the basis of these
findings, recommendations for an educational initiative were formulated, in order to
reduce the uncertainty of the consumer and to provide a supportive help for making a
responsible choice.
A written questionnaire, based on an adjusted form of the Theory of Planned
Behaviour from Ajzen (1991), was carried out by sixth formers and students. To measure
the behaviour of young adults a Food Frequency Questionnaire concerning sugared and
sugar-free beverages was developed.
342 sixth former and students, comprising both males and females, with the mean
age of 20 years, completed the questionnaire during their lessons. On the basis of their
results it was determined, which factors of the TBP have the most important impact on
the choice of beverages and the intention to drink less sugared beverages.
The main conclusion of the study consists in the finding that the availability of
sugared beverages at home proved to be the most important factor to predict the
consumption of sugared beverages. The descriptive subjective norm of friends was the
only variable out of the TBP which had some predicting power on the consumption of
sugared beverages. The other constructs of the TBP turned out to be less influential. In
particular, the correlation of the intention towards the consumption and the behaviour is
unexpected low. Attitude, the injunctive subjective norm, the descriptive subjective norm
of the parents, the self-identity concerning the health awareness and the perceived
behavioural control were the components of the theory which account for the most
variance of the intention. Moreover, female respondents and students showed a more
positive attitude towards sugar-free beverages and consumed less sugared beverages
than male respondents and sixth former.
These findings lead to some recommendations for the initiative in order to offer the
consumer a supportive help to choose the right beverage. The initiative should focus
primarily on the attitude. People’s attitudes can be changed due to comprehensible,
individually relevant and credible messages, which include new arguments, but conform
to the person’s existing perceptions and experiences. The initiative should include
implementation intentions, which can be realized in everyday life. A successful approach
to change old habits consists in presenting new habits which replace the old existing
ones. In order to exert influence on the availability of beverages, it is necessary to
present possibilities to the respondents how they are able to exercise control on the
beverage purchase of the family.
Page 4
4
Table of Contents
List of Abbreviations 6
Index of Tables and Figures 7
Foreword 8
1. Introduction 9
1.1 The Health and Eating Habits of Adolescents and Young Adults 10
2. Drinking und Eating Situation in Germany 11
2.1 Drinking Situation 11
2.2 Eating and Health Situation 12
3. Theoretical Framework 14
3.1 Behavioural Determinants 14
3.1.1 Biological Factors 14
3.1.2 Sociocultural Factors 15
3.1.3. Home Economical Factors 16
3.1.4 Psychological Factors 16
3.2 Social Cognition Theories 17
3.2.1 Previous Behaviour as an Independent Variable 20
5. Method 22
5.1 Development of the Questionnaire 22
5.2 Main Questionnaire 23
5.3 Procedure 26
5.4 Subjects 27
6. Results 28
6.1 Socio Demographical Factors 28
6.2 Consumption of Sugared and Sugar-free Beverages 28
6.3 Respondents’ Knowledge of Beverages’ Sugar Content and
the Daily Fluid Demand 29
6.4 Relations between the Variables of the Adjusted Theory of Planned Behaviour 30
6.5 Multiple Regression Analysis of the Beverage Consumption
and the Intention to Drink Less Sugared Beverages 33
6.6 Group Differences Concerning the Predicting Power of the Constructs 34
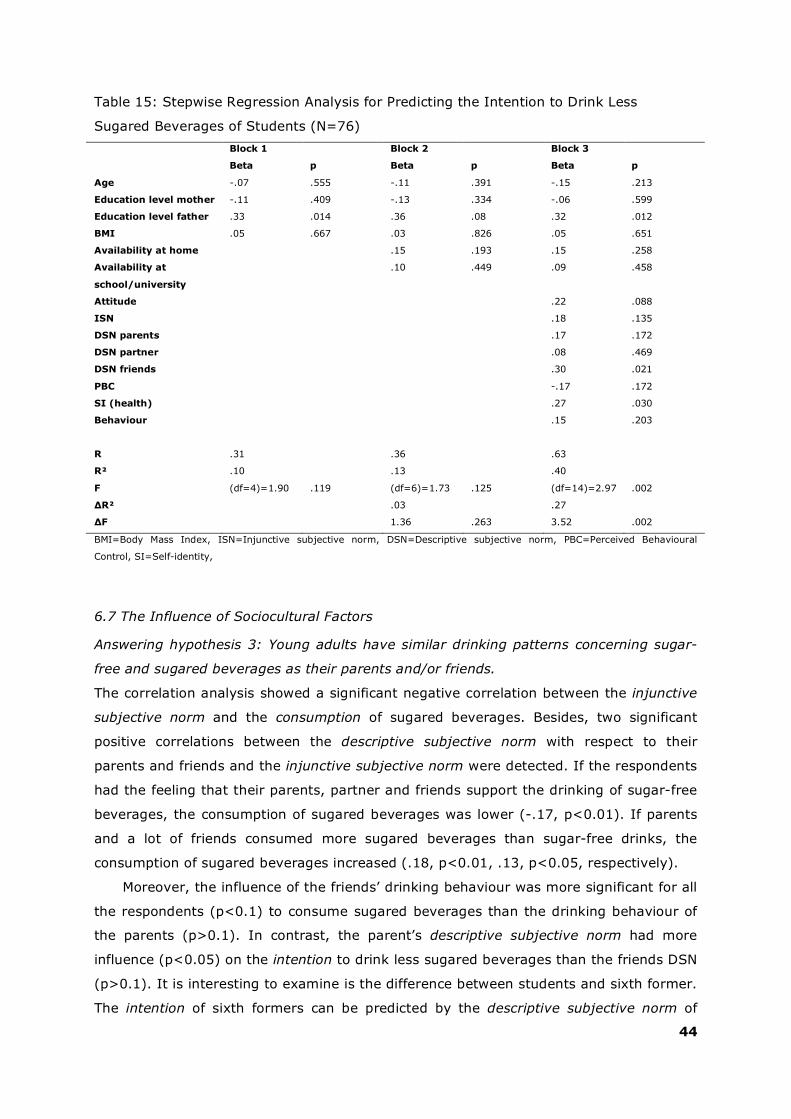
6.7 The Influence of Sociocultural Factors 44
6.8 The Influence of Home Economical Factors 45
6.9 The Influence of the Variables from the Theory of Planned Behaviour 46
Page 5
5
7. Discussion 49
7.1 General discussion 49
7.2 Discussion of the used model 50
7.2.1 Influence of Knowledge 51
7.2.2 Influence of Attitude 52
7.2.3 Influence of Injunctive and Descriptive Subjective Norm 52
7.2.4 Influence of Perceived Behavioural Control 55
7.2.5 Influence of Self-identity 56
7.2.6 Influence of Intention 57
7.2.7 Influence of Previous Behaviour 58
7.3 Limitations of the Study 58
8. Recommendations 60
8.1 Methods to Increase Knowledge and Change Attitudes 60
8.2 Methods to Change Perceived Environmental Influence 61
8.3 Methods to Change Intentions and Habits 61
8.4 Differences between the Groups 62
8.5 Overview on the Most Important Advices 62
8.6 Scientific Recommendations 63
9. List of References 64
10. Attachment 71
Page 6
6
List of Abbreviations
Abbreviation Meaning
TPB Theory of Planned Behaviour
KL Knowledge
A Attitude
ISN Injunctive Subjective Norm
DSN Descriptive Subjective Norm
SI Self-Identity
PBC Perceived Behavioural Control
I Intention
B Behaviour
Page 7
7
Index of Tables and Figures
Figure 1: Adjusted Theory of Planned Behaviour 1
Figure 2: Stepwise Regression of Predicting the Intention to Drink Less Sugared
Beverages Regarding the Total Population (N=249) 35
Table 1: Frequency Table of the Socio-Demographic Facts 27
Table 2: Frequency Table of the Averaged Beverage Consumption per Month Ranked
by Mean Frequency 29
Table 3: Descriptive Table of Real and Estimated Sugar Content (100 ml/gram) 30
Table 4: Correlations of the Constructs 32
Table 5: Stepwise Regression Analysis of Predicting the Consumption of Sugared
Beverages Regarding the Total Population (N=249) 33
Table 6: Stepwise Regression Analysis of Predicting the Intention to Drink Less
Sugared Beverages Regarding the Total Population (N=249) 34
Table 7: Independent-Samples T Test of the Gender Differences 36
Table 8: Stepwise Regression Analysis for Predicting the Consumption of Sugared
Beverages Regarding Female Respondents (N=144) 37
Table 9: Stepwise Regression Analysis for Predicting the Intention to Drink Less
Sugared Beverages of Male Respondents (N=104) 38
Table 10: Stepwise Regression Analysis for Predicting the Intention to Drink Less
Sugared Beverages of Female Respondents (N=144) 39
Table 11: Independent-Samples T Test of Age Differences 40
Table 12: Stepwise Regression Analysis for Predicting the Consumption of Sugared
Beverages Regarding Sixth former (N=172) 41
Table 13: Stepwise Regression Analysis for Predicting the Consumption of Sugared
Beverages Regarding Students (N=76) 42
Table 14: Stepwise Regression Analysis for Predicting the Intention to Drink Less
Sugared Beverages of Sixth former (N=172) 43
Table 15: Stepwise Regression Analysis for Predicting the Intention to Drink Less
Sugared Beverages of Students (N=76) 44
Table 16: One-way ANOVA for the Educational Level of the Father 45
Table 17: Correlation Analysis between the Beverage Consumption and the Availability
at Home and at School / University 46
Page 8
8
Foreword
Everyone has become accustomed to the great supply in every supermarket, has
adjusted to it and cannot imagine abdicating it. A great supply of food and beverages
comes along with being spoilt for choice, and therefore decision making is not always
easy. In particular, the beverage market grows enormously. On the market the supply of
beverages has become correspondingly diverse and therefore causes often confusion.
Besides this, the wide range of information concerning the fluid requirement complicates
the customer’s choice of beverages. Some sources indicate that the recommendation of
the daily intake of sugar-free beverages concerning adults should be at least 2.5 litres. In
contrast, other sources present the advice of 1.5 litres fluid daily (Valtin, 2002; Negoianu
& Goldfarb, 2008). Many and partly contradictory information about juices, smoothies
and soft drinks make the consumer insecure. Soft drinks and juices are often regarded
unbalanced with respect to their ingredients, whereby the consumer has a guilty
conscience due to the purchase and develops an “all-or-nothing” attitude. This leads to
the questions: What kind of beverages and how much of these beverages should be
consumed by the costumer?
Page 9
9
1. Introduction
The diverse and complex information about beverages and their health benefits or
threats confuse the consumer. A lot of consumers consider beverages as “allowed” and
“forbidden”, “good” and “bad” or “healthy” and “unhealthy”. This distinction of beverages
cannot be applied so easily. Different studies show that inflexible diet-rules are not
suitable for everyday life and that a violation of these strict rules leads to a loss of any
control so that the forbidden food or beverage is consumed excessively (Ellrott, 2003).
To shed light on the uncertainty and confusion, which the consumer has to overcome
almost every day, the agency of integrated communication, fischerAppelt Kommunikation
GmbH, pursues the intention to instigate an educational drinking initiative for one of their
customers. The planned campaign consists of three main goals: Firstly, it is aim to
provide helpful recommendations concerning the drinking behaviour. Secondly, the
campaign intends to offer a realistic impression of the current beverage market and to
supply information about beverage’s ingredients. Thirdly, it is goal to raise the enjoyment
in drinking beverages without overstraining the consumer and by presenting a great
supply of non-alcoholic beverages to the customer.
To address the target group of the initiative properly more information is needed, for
instance of their current drinking behaviour. The study compares the development of
young adult’s preferences for sugared (e.g., juices, soft drinks) and sugar-free beverages
(e.g., water, diet soft drinks). Sixth former (for a definition see § 5) and students
allegorize the target group (young adults). It is characteristic for them to be highly
educated and successful. Due to the fact, that they have to do intellectual work every
day, they need a lot of energy to maintain their concentration. Therefore, the drinking
and eating behaviour plays an important part because it provides them with the
demanded energy. It is of high significance for the development of the campaign to
investigate the group’s drinking behaviour in relation to their health awareness, their
drinking motives and the needs of the educational advertising concerning beverages.
Only by surveying these kinds of information it is feasible to prepare the right advice and
drinking information, which appeals to the consumers. The study tends to shed light on
the factors, which determine the drinking behaviour. Why do some people consume more
water and others more juices or soft drinks? Are there some factors which have an
important explanatory power? On the basis of these findings recommendation for a
campaign can be formulated, which help to reduce the uncertainty of the consumer and
give supportive help for taking a responsible choice.
Page 10
10
1.1 The Health and Eating Habits of Adolescents and Young Adults
The industrial countries observe a changing health situation of children and adolescents.
The German health care system has to deal with serious health problems, which affect a
big part of the young population. For instance, more than 20% of German children and
adolescents suffer from chronic diseases like asthma, diabetes or allergies
(Warschburger, 2000). Furthermore, the life style of children and adolescents gets more
complex due to growing leisure time facilities, an increasing food supply and due to
changes in the family structures. Because of these changes and the missing comparable
standards of older studies, the health behaviour was scrutinized by means of a new
study, “the KIGGS” (Studie zur Gesundheit von Kindern und Jugendlichen in
Deutschland) (Kurth, Bergmann, Dippelhofer, Hölling, Kamtsiuris & Thefeld, 2002).
KIGGS was set up by the Federal Ministry of Health and the Ministry of Education and
Research and intends to collect a wide range of socio-demographic information and
health related facts about the German youth. The goal of the study is to get a realistic
picture of the health situation and in consequence of this being able to present advices
for prevention programs.
An essential part of the health situation consists in the eating habits of adolescents.
In 2007 the results of the KIGGS-study concerning this area were published. The eating
behaviour has, among other factors, a great influence on the development of diseases,
like diabetes mellitus type 2, hypertension or cardiovascular diseases. Furthermore, the
eating and drinking behaviour can predict our physical well-being und willingness to be
active (Leitzmann, 2004). The body needs mineral nutrients, vitamins and fluid in order
to function properly.
With reference to this awareness water and other non-alcoholic beverages play an
important role in a balanced diet. The results of the KIGGS-study and other important
studies concerning the health behaviour of young adults are discussed in the next
chapter, following, an overview on the theoretical framework and the chosen theory (§3).
After this, the methods of the study and a description of the subjects (§4) are
represented. On the basis of the theoretical background, the research questions are
formulated (§5). In chapter six the results of the study are discussed, which provides a
deeper interpretation of the discussion paragraph (§7). In addition to this, weak points of
the study and possibilities of further research will be reviewed. Finally, recommendations
for the current campaign are presented in the last chapter (§8).
Page 11
11
2. Drinking und Eating Situation in Germany
2.1 Drinking Situation
The KIGGS-study indicates that 38.2% of the boys at the age of 14 to 17 years drink
mineral water several times a day, whereas 46.7% of the girls drink this kind of
beverage several times a day. 16.3% of the male probands drink tap water, respectively
21.2% of the female respondents. Likewise the drinking of mineral water, male
adolescents consume soft drinks (36.0%). With the rising age the consumption of soft
drinks increases significantly for both, boys and girls. However, male respondents are
characterised by a considerable higher consumption of soft drinks in comparison to young
females. The soft drink market has changed drastically in the last years and this has an
effect on the fluid intake of water. The water intake of children and adolescents
decreased between 1991 to 1998, whereas the soft drink intake increased (Sichert-
Hellert, Kersting & Manz, 2001). The consumption of juices correlates negatively with the
consumer’s age. The older the interviewees, the less juice they drink. Additionally, the
study reveals that young males drink less tap water with increasing age. Another
differentiation that can be made regarding the hydration is between migrants and non-
migrants. Boys and girls with migrational background drink more often soft drinks. But
this result is only significant for children and adolescents with a Turkish background and
for migrants of German origin. Juices are more commonly consumed by non-migrants
(Mesink, Kleiser, Richter, 2007).
To sum up, it can be observed that the consumption of soft drinks increases with
age, the consumption of juices and milk beverages decreases and water consumption
remains the same in the different stages of life.
The national consumption study of the Max Rubner-Institute (NVS), initiated in 2008,
examines the eating behaviour and the health state of the German population at the age
of 14 to 80 years. Women and men at the age of 19 to 34 years participate to a lesser
extent in the survey. Thereby the percentage distribution of the study differs from the
percentage distribution of the German population. Nevertheless, the study can be
considered as an important foundation for the nutritional situation of young adults in
Germany. According to the NVS, the recommended daily amount of 1.5 litres is
accomplished by both genders so that hydration is satisfactory. The intake of water
constitutes approximately half of the total hydration. Foremost, young men (19-24
years) consume a lot of water. Women at the age of 35 to 50 years consume the highest
amount of water. A quarter of the total beverage consumption consists of coffee and
green or black tea and 10% to 11% of the total composes of juices and nectars. 10% of
the male respondents’ total fluid intake consists of soft drinks. This is twice as much as
women’s amount of soft drinks (4%) referring to their total fluid intake. It turns out that
Page 12
12
the socio-demographic status has an effect on the choice of beverages. It is scientifically
proven that the lower social stratum of the population consumes sugared beverages, like
soft drinks, three to four times more frequently than the upper social stratum (NVS I,
2008; NVS II, 2008). These facts are brought into focus in this master thesis because
they are interesting analytical points for the curent study.
2.2 Eating and Health Situation
It is also crucial to scrutinize the eating behaviour of the German population and their
assessments towards diets and the current health situation. 76% of all respondents opine
that one can judge their health state as “very good” or “good”. One third (32.3%) of the
consulted young men at the age of 14 to 24 years estimates their state even as “very
good”. Women at this age share this view to a lesser extent (22.2%). The analysis of the
food choice shows however that women eat more healthy products than men do (e.g.,
270 gram fruit daily vs. 222 gram). It can be suggested that this may be similar for
beverages. Women drink probably more beverages with less sugar and/or with additional
health benefits.
More than half (52.6%) of the consulted respondents is not able to calculate their
own energy demand. Foremost, women and men aged between 19 and 24 years state a
negative calculation of their daily energy demand. Due to the fact, that people do not
know how much they have to eat and drink every day, it can be expected that a lot of
people eat and drink too much. Assigned to this study it can imply, that the respondents
have a high sugar intake by consuming sugared beverages because they are unaware of
their total energy demand.
The study shows that it is of high significance that women indicate a higher interest
in nutrition than men do and that already young female adolescents aged 14 to 18 years
take stock in this topic. Respondents with a higher graduation level (Abitur /
Fachhochschule entry qualification) search for nutrition facts more often than people with
a lower graduation (elementary school). To sum up, interest in nutrition correlates
positively with education. And for this research one can act on the assumption that
higher educated people have more interest and therefore more knowledge about healthy
eating and drinking.
In spite of the interest for a healthy nutrition only 12.6% of the respondents
accomplish the recommended daily vegetable amount of 400 grams. The German
Nutrition Society (DGE) gives the advice to consume 250 grams of fruits every day.
However, only 59% of the population accomplishes this recommendation. Least fruits are
consumed by men and women at the age of 19 to 24 years.
Page 13
13
A study of the Federal Centre of Health Education (1992) examined the German
population concerning their general food habits, their food consciousness and the
appliance of different diets by observing their weight reduction. 52% of the young adults
(20-29 years) declare that they pay attention deliberately to a healthy balanced diet. A
study of Heseker, Adolf, Eberhardt, Hartmann, Herwig, Kübler, Matiaske, Moch, Nitsche,
Schneider and Zipp (1994) reveals that young adults at the age of 18 to 24 years have
an increased awareness of a healthy nutrition (cited in Allgöwer, 2000). According to a
study, which is dealing with the eating behaviour of German students, 55.2% of the
young consulted students attempt to eat healthy and balanced. Particularly, the female
students pay a high attention to a balanced diet (Allgöwer, 2000). The health awareness
concerning beverages is rarely studied. Because of this, the health awareness is part of
the following analysis.
The outcomes show the Janus-faced side concerning the food situation of young
adults. Oftentimes, there is a gap between the self-reported eating behaviour and the
state of food intake. In the following passages, it will be clarified which determinants
correlate with the drinking and eating behaviour and why many young female and male
adolescents fail to apply a healthy nutrition in everyday life, although their strong will is
existent.
Page 14
14
3. Theoretical Framework
What predicts the drinking behaviour of young adults? Which influence has the sugar
content on the choice decision of a beverage? To what extent can one relate the drinking
behaviour to the general health awareness? The drinking and eating situation of young
adults, in particular of students, is hardly studied in Germany (Allgöwer, 2000) and a
complete overview cannot be given. Foremost, the drinking of non-alcoholic sugared and
sugar-free beverages was not focused in any study. As a consequence, it is difficult to
refer to studies concerning the drinking behaviour. Therefore studies examining the
eating behaviour are consulted in the course of this work. The results of these studies will
be presented as well as the relevance for the target group “young adults”. After the
description of every determinant, a hypothesis is expressed with relevance to this study.
A distinction between sugared and sugar-free beverages is applied in every hypothesis.
3.1 Behavioural Determinants
The development of behavioural patterns is not that simple because a lot of influential
factors interact with one another. One of these factors is for instance the social
environment (Gedrich, 2003). In addition, behaviour can be developed on the basis of
previous experiences, which demanded the same behaviour. One eats and drinks not just
as a result of our biological requirements, but due to the influence of psychological,
sociocultural and home economical determinants (Gedrich, 2003). In the next
subparagraphs different influential factors are discussed, which might have impact on the
decision making process.
3.1.1 Biological Factors
The genotype, in particular the gender, influences the eating behaviour. Although
humans have an inherent preference for the taste “sweet” and an aversion towards
“bitter” (Ellrott, 2007), there are differences concerning the preference of taste between
women and men. Empirical studies state that women eat more fruit, vegetables, milk
products, whole meal-products and less sugared food than men do. These findings
conclude that women eat healthier than men (Gerhards & Rössel, 2003). Other studies
state that the age has an impact on the eating and drinking pattern, too. Older people
show a healthier lifestyle pattern than young people (Rappoport, Peters, Downey,
McCann & Huff-Corzine, 1993). Grimm, Harnack and Story (2004) affirm that the
preference of taste has a big influence on what we drink and eat and is the most
important predictor for the choice of a certain beverage.
Page 15
15
Hypothesis 1: Female adults drink less sugared beverages than male adults.
Hypothesis 2: Older respondents (students) drink less sugared beverages than younger
respondents (sixth former).
3.1.2 Sociocultural Factors
The predilection for a certain taste is not only based upon a genetic preference or a
prenatal imprint but also on the determinant familiarity (Asp, 1999; Gniech, 2003). If
something is frequently offered (mere exposure), the person becomes acquainted with
this taste and is going to develop a preference for it (Contento, Williams, Michela &
Franklin, 2006; Gniech, 2003). This provides another socioccultural factor which can be
defined as the influence of family and friends. Their drinking patterns affect the
adolescent’s choice of beverages (Grimm, Harnack & Story, 2004). People identify
themselves with certain groups and dissociate with others. If one decides to join a certain
group, he or she is faced with different group norms, learns from other group members
and adopts their behaviour patterns.
The sociocultural determinant education can be considered as a further aspect which
leads to grouping of adolescents. People who have a higher education aim to be part of a
special environment. Education is correlated with income and eating behaviour. People
who belong to a better educational society often have more income and more money to
spend for healthy food. Other explanations for this coherence can either be the
knowledge of nutrition, which increases with the level of education (Kußmaul, Döring,
Stender, Winkler & Keil, 1995) or the associated symbolic meaning of different foods. The
more educated a social class, the more they associate fat and cheap products with a
vulgar taste, which they dislike. Summing up, nutrition provides the possibility of
choosing a certain group belonging (Barlösius, 1999).
The causal coherence between financial resources, education class and the choice of
food cannot be indicated clearly. Whether a higher income leads to the purchase of more
expensive, healthier and better food or a higher income results in a better education and
therefore in more knowledge, is controversial up to now. But apparently one can only eat
what one is able to buy. On the one hand, this is predicted by the income (Furst,
Connors, Bisogni, Sobal & Winter Falk, 1996), and on the other hand by the availability
of the product. Grimm, Harnack und Story (2004) and Gracey, Stanley, Burke, Corti und
Beilin (1996) showed due to their research that accessibility, in particular the availability
of soft drinks, water, juices and other food at their homes and at school, provides a
significant influence on the beverage and food choice.
Page 16
16
Hypothesis 3: Young adults have similar drinking patterns concerning sugar-free and
sugared beverages as their parents and/or friends.
Hypothesis 4: Young adults from a higher educated family drink less sugared beverages
than young adults from a lower educated family.
3.1.3. Home Economical Factors
Furthermore, the home economical situation determines the food offering at home. Who
is responsible for the food? Which reasons specify the purchases? How are the food and
beverages prepared and consumed? The values of eating and drinking are determined by
the culture but can vary immensely in every family. People in a relationship eat healthier
than single-living people (Roos, Lahelma, Virtanen, Prättälä, & Pietinen, 1998). This
study also indicates that the presence of children has an impact on the purchase of food
and beverages. Households with children younger than 14 years spend more money for
healthy food than others households. Up to now, the mother is mostly in charge of
purchasing and preparing the food, therefore she is the one who determinates which food
is available (Gedrich, 2003). This leads to the hypothesis that children have similar
eating patterns as their parents.
A study of Gracey et al. (1996) verifies that an unhealthy eating behaviour is caused
by the inability of adolescents to exert an impact on the food choice at home. Apart from
that, other studies have shown that healthy eating behaviour is associated with family
structures and parents. Whereas the consumption of fast-food correlates with the
relationship to friends, independence and fun (Backman, Haddad, Lee, Johnston &
Hodgkin, 2002).
Hypothesis 5: The availability of sugared beverages at home and at school has an
influence on the consumption of sugared beverages among young adults.
3.1.4 Psychological Factors
Nutrition can be considered as a symbolic value. For instance, fast-food is associated with
fun and in contrast, a familial setting leads to a consumption of healthy food among
young adolescents. In this case, psychological processes play a significant role. Emotions,
motives, attitudes and cognitive processes, like perception, thinking and learning, are
parts of the psychological component.
Emotions excite a reaction in the individual, which can be either positive or negative.
Emotions – as a trigger for reactions – are not inevitably necessary for the food intake
because food can cause a reaction without being triggered off by emotions namely due to
the drive hunger. Nevertheless, some food products are able to evoke emotions.
Sometimes, one wants to eat or drink a special product just because it activates specific
Page 17
17
emotions. Hence, it can be called a motif. By the choice of an aliment, people want to
experience taste, put themselves in a certain emotional situation, express belonging or
the social status.
Besides the factor emotion, the choice of food is determined by values, confidence,
outcoming expectations, intentions and involvement (Gedrich, 2003).
The analysis of the influential factors shows that the determination of the eating and
drinking behaviour is a complex process. It is impossible to analyse all determinants in
one single study. Because of this, paragraph 3.2 gives an overview on two existing
theories referring to the behavioural research, which can built a significant foundation for
an empirical survey and the most important psychological factors (attitude, perceived
subjective norm and perceived behavioural control).
3.2 Social Cognition Theories
Different behavioural models try to give theoretical answers. The theory of the “Health
Belief Model” (Hochbaum, Rosenstock, Leventhal and Kegels, 1956) assumes that a
behaviour depends on two variables: the value which implies how one credits the goal
(e.g., to drink and eat healthy is important) and the appraisal which includes whether
one can reach the goal by the current behaviour or not (e.g., eat fruit and vegetables).
The determinants which influence the behaviour are: the perceived susceptibility to
develop a certain disease (diseases can be the result of an unhealthy diet), the perceived
severity, perceived benefits or barriers and cues to action (Damoiseaux, van der Molen &
Kok, 1993).
Another explanatory model of behaviour is Ajzen’s “Theory of Planned Behaviour”
(1991). The “Theory of Planned Behaviour” supposes that behaviour is determined by the
current behavioural intention. This intention is composed of three factors, namely the
attitude of an individual towards an object, the subjective norm and the perceived
behavioural control to accomplish a certain behaviour.
Attitudes result from certain motives and the positive or negative appraisal to what
extent a certain object or behaviour is able to correspond with the individual motives
(Backman et al., 2002). People, who have a positive attitude towards healthy food, are of
the opinion that the consumption of healthy products leads to an improvement of their
health, an increase of their energy and a good feeling about themselves. The chance that
these people live a healthy lifestyle is considerably higher than for those people who
have a negative attitude towards a healthy lifestyle (Gracey et al., 1996). Besides this,
the study states that there is a relation between the positive attitude towards a healthy
Page 18
18
diet and the desire to control one’s own weight, to lower cholesterol, to test their own
willpower and to improve their appearance.
On the one hand, people know their own preferences and dislikes from personal
experiences. On the other hand, people do not have to undergo these experiences but
can basically develop own drinking and eating behaviour by observing others (imitation
learning) (Bandura, 2001; Ellrott, 2007). The subjective norm refers to the individual
perception, in particular, how important others value a certain object and how they
behave.
The last factor, the perceived behavioural control, describes the own appraisal of the
ability to accomplish a certain behaviour, although one has to overcome barriers and
obstacles. The stronger the belief that one is able to eat healthy, the bigger is the chance
to have a healthy eating behaviour.
In order to form an attitude, a subjective norm or a perceived behavioural control, it
is necessary to receive knowledge of the topic. The numerous information people have to
face every day, have to be selected, organized and interpreted. In this way a subjective
perception concerning a healthy eating behaviour, which co-determines people’s
(purchase) decisions, is developed. Studies show that the knowledge of health and a
balanced diet has an influence on our eating behaviour. In view of these results, it can be
assumed that people who know a lot about food, consequently eat and drink healthier
(Backman et al., 2002). The ignorance of food ingredients can lead to a barrier, which
hinders a healthy eating behaviour (Gracey et al., 1996).
The main aim of the study is not to built up a preventive intervention trying to
persuade the target group to drink less sugared beverages. The study rather tries to get
an overview of the factors, which influence the choice of beverages. Consequently, the
TPB fulfils the requirements of the study to a greater extent than the other theory and is
therefore applied.
Nevertheless, additions have to be made in the “Theory of Planned Behaviour” to
improve its validity. The perceived behavioural control can be both, the control over
external properties (e.g., availability) and the internal control over abilities and skills.
There are some studies which report that there has to be made a distinction between
internal and external perceived behavioural control (IPBC, respectively EPBC), (Armitage
& Conner, 1999a; Conner & Armitage, 1998; Terry & O’Leary, 1995; White, Terry &
Hogg, 1994).
The second change, which has to be applied, concerns the subjective norm. On the
one hand, a subjective norm can be developed due to the perceived values of other
people and on the other hand, it can resolve from the perception of other people’s
performances. This distinction can be subdivided into two different categories which are
Page 19
19
named injunctive (“ought meaning of social norm”) and descriptive (“is meaning of social
norm”) (Cialdini, Reno & Kallgren, 1990, p.1015).
The third and last addition to the already existent study is the construct self-identity.
Self-identity may be defined as “the salient part of an actor’s self which relates to a
particular behavior” (Conner & Armitage, 1998, p.1444). Several studies from different
health related areas have stated, that the performance of a certain behaviour is
consistent with one’s own self-identity and thereby can be seen as an enrichment of the
Theory of Planned Behaviour (Pierro, Mannetti & Livi, 2003; Sparks & Guthrie, 1998;
Armitage & Conner, 1999b; Sparks & Shepherd, 1992).
By relating the adjusted TPB with the complex of problems named above, one
obtains the following structure:
The young adult’s knowledge of sugared and sugar-free beverages and their
ingredients, as well as the arisen awareness of these beverages exerts an influence on
the attitude. It can be assumed that someone, who deals with a healthy diet and
consequently knows a lot about ingredients and beverages, has a more positive attitude
concerning healthy beverages and therefore consumes less sugared drinks (Duffey &
Popkin, 2006).
The attitude, which is based upon knowledge, norms and values, predicts how a
beverage is valued. If one emphasises strong flavour, there will be a bigger addiction to
consume beverages which are more flavourful than water. If a greater importance is
placed on drinking healthy beverages, the tendency will show a higher consumption of
water.
The subjective norm is based upon the individual perception of the social
environment and on the observation of other people. What does the environment
consume? And how do they talk about beverages? If all friends drink soft drinks, the
chance will increase that a young adult consumes the same beverage in order to belong
to the certain group (Contento, Williams, Michela & Franklin, 2006). As named above, a
clear distinction between injunctive and descriptive subjective norms (ISN and DSN) is
applied in the study.
To what extent do young adults rate themselves as being able to drink healthy
beverages at any time? Which obstacles are hit? And is it possible to control the
obstacles? Theses answers can be measured due to the internal and external perceived
behavioural control (IPBC and EPBC). The first question refers to one’s own abilities and
skills and the other remaining questions advert to the external possibilities.
People create self-perceptions which are characteristics they ascribe to themselves.
In this study the self-perception is called self-identity. Young adults, who consider their
lifestyle as healthy, show a healthier drinking behaviour. They basically drink water or
tea in order to comply with their ideals (Sirgy, 1986).
Page 20
20
The last construct of the theory is based upon the intention to perform a certain
behaviour. If someone makes the plan to achieve something, the chance will be
significantly higher, that he will actually fulfil the intention, than the chance for someone
who does not aim to achieve the self-made plan. In the “Theory of Planned Behaviour”
the intention is the only direct link to behaviour and is determined by all the factors
named above.
3.2.1 Previous Behaviour as an Independent Variable
Some studies discovered that previous behaviour belongs to the independent variables
and has influence on the intention, which can be seen as the dependent variable (Towler
& Shepherd, 1991; Godin & Gionet, 1991). If someone always behaves in a certain way,
the intention will comply with his or her behaviour, so that the person does not perceive
dissonance between act and intention (Festinger, 1957).
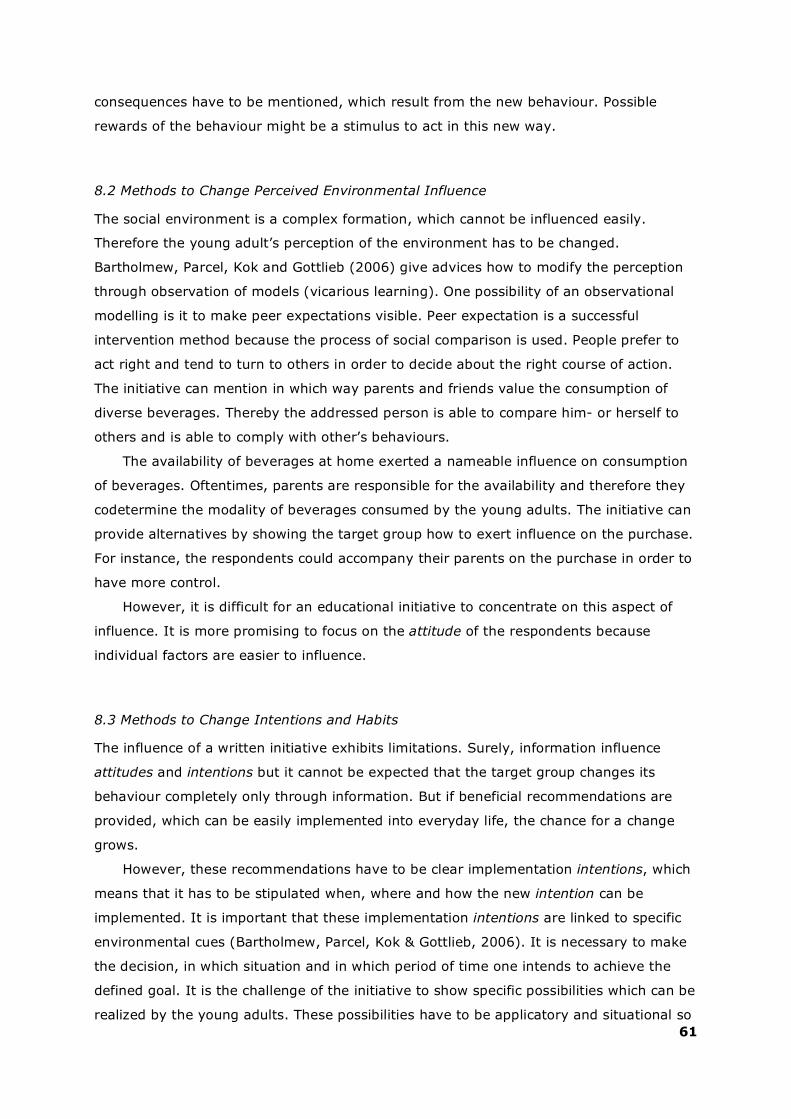
In figure 1 the arrow between the variable behaviour and the variable intention
reveals this coherence. The arrow has a broken line to clarify that it is not safe to say yet
which connection exists. With the help of a regression analysis the relationship between
intention and behaviour will be examined.
It is important to make the annotation that this study is a cross-sectional one. This
indicates that the behaviour is measured only one time and therefore its constancy
cannot be reviewed.
Hypothesis 6: The more adults know about the beverages’ ingredients the less sugared
beverages they drink.
Hypothesis 7: The more positive the attitude towards sugared beverages the higher the
consumption of sugared beverages (the worse the intention to drink less sugar-free
beverages).
Hypothesis 8: The stronger the perception of the injunctive subjective norm concerning
sugared beverages the higher the consumption of sugared beverages (the worse the
intention to drink less sugar-free beverages).
Hypothesis 9: The stronger the perception of the descriptive subjective norm concerning
sugared beverages the higher the consumption of sugared beverages (the worse the
intention to drink less sugar-free beverages).
Page 21
21
Behaviour
Intention
Attitude Perceived
Behavioural Control
Subjective norm
Injunctive norm
Descriptive norm
Self-Identity
Internal PBC
External PBC Knowledge
Hypothesis 10: The worse the perception concerning the internal behavioural control of
drinking sugared beverages the higher the consumption of sugared beverages (the worse
the intention to drink less sugar-free beverages).
Hypothesis 11: The worse the perception concerning the external behavioural control of
drinking sugared beverages the higher the consumption of sugared beverages (the worse
the intention to drink less sugar-free beverages).
Hypothesis 12: The less the self-identity considering oneself as healthy, the higher the
consumption of sugared beverages (the worse the intention to drink less sugar-free
beverages).
Hypothesis 13: The lower the intention to drink sugar-free beverages the higher the
consumption of sugared beverages.
Hypothesis 14: The higher the consumption of sugared beverages the lower the intention
to drink sugar-free beverages.
With the aid of the following questionnaire, it will be examined to what extent the factors
named above exert influence on the drinking behaviour of young adults.
Figure 1: Adjusted Theory of Planned Behaviour
Page 22
22
5. Method
5.1 Development of the Questionnaire
The pre-test pursues the aim to test the comprehensibility of the questionnaire. This
offers the possibility to exclude or change questions, which are difficult to understand
and therefore mistakable questions and statements are avoided in the final survey.
To identify the factors, which affect the choice of beverages, an open questionnaire
was sent to 30 German students by email (see attachment 1). Five students returned a
completed questionnaire and on the foundation of these findings some additional answer
possibilities were applied. Taste, healthfulness, a good value for money and the effect of
the beverage (e.g., adipsous and refreshing) were the most important determinants
named to choose a special beverage. The other questions are based upon studies from
Armitage and Conner (1999a), Povey, Conner, Sparks, James and Shepher (1998) and
Sparks and Shepherd (1992). The English questions were translated into German in
order to avoid difficulties with the English language.
In addition, two different experts of the topic and people from the target group were
asked to comment on the questionnaire with the aim to increase the internal and
substantive validity of the constructs. In an open face-to-face questionnaire three staff-
members of fischerAppelt were requested to check the questionnaire regarding
formulations, content and structure. All of the respondents are very familiar with the
topic of sugared and sugar-free beverages. With the help of their advices the
questionnaire became more explicit and every important topic was considered. The
respondents usually commented on the questions concerning the perceived behavioural
control. Although the translation into German has the aim to avoid understanding
problems, comprehension difficulties occurred because some items cannot be translated
one-to-one.
Besides that, three people of the target group (two students and one pupil) were
asked to comment on the comprehensibility and the content of the questionnaire. Their
remarks were integrated in the ongoing questionnaire. Due to this applied pre-tests one
can be sure that the questionnaire is coherent for the target group. Furthermore, the
three consulted young adults expressed problems with the questions concerning the
perceived behavioural control in almost the same manner. The given remarks led to
following changes: The question “Ich habe viel eigene Kontrolle über das Trinken von
zuckerfreien Getränken” was changed into „Es liegt in meinen eigenen Händen, wie viele
zuckerfreie Getränke ich trinke“, the statement “Ich finde es schwierig, immer
zuckerfreie Getränke zu trinken, da ich oft nicht weiß, wie viel Zucker in den Getränken
steckt” was modified into „Ich finde es schwierig, immer zuckerfreie Getränke zu trinken,
da ich oft nicht weiß, in welchen Getränken Zucker ist“, „Die Situation kontrolliert oft das
Page 23
23
Trinken von zuckerfreien Getränken“ was changed into „Es ist oft von der Situation
abhängig, ob ich zuckerfreie Getränke trinke“, „Das Trinken von zuckerfreien Getränken
ist teuer“ was altered into „In Anbetracht des Geldes, das mir zur Verfügung steht, kann
ich mir zuckerfreie Getränke nur selten leisten“ and „Es gibt Faktoren, die außerhalb
meiner Kontrolle liegen, die mich am Trinken von zuckerfreien Getränken hindern“ was
changed into „Es gibt Faktoren in meinem Umfeld, die ich nicht beeinflussen kann und
mich deshalb am Trinken von zuckerfreien Getränken hindern“.
To test the substantive validity, two students absorbed in the study communication
sciences were asked to read all questions without knowing, which question belongs to
which construct. They were asked to assign the questions to the constructs, which fitted
the different questions most suitable. Thereby it can be detected to what extent the
“measure is judged to be reflective of, or theoretically linked to, a construct under study”
(Farrell, Souchon & Durden, n.d., p.4). During this pre-test some questions were not
assigned rightly but they were not changed because they were tested in the same way in
other studies and there they turned out be questioned properly. This occurred especially
within the construct of self-identity. The question “Es liegt in meinen eigenen Händen,
wie viele zuckerfreie Getränke ich trinke” or „Ich fühle mich wohl, wenn ich zuckerfreie
Getränke trinke“ were assigned to the construct self-identity. But these questions do not
reflect an individual characteristic. It is rather an estimation of the person’s ability and
feelings. Because of that, no changes took place.
5.2 Main Questionnaire
A questionnaire (see attachment 10.4), asking respondents about drinking sugar-free
and sugared beverages, was constructed. At the beginning of the questionnaire, the topic
of the study was explained and it was affirmed that the answers of the respondents are
treated confidentially. The respondents obtained a detailed definition of sugared and
sugar-free beverages and which beverages are not included in the survey. The
questionnaire measured additionally the self-identity, internal and external perceived
behavioural control, injunctive and descriptive subjective norms, as well as the central
components of the “Theory of Planned Behaviour” (knowledge, attitude and intention)
and moreover requested demographic information. The questions were presented in a
fixed order and were mostly measured on a five-point Likert scale, which stretches from
disagree completely to agree completely. The variables were reverse-coded, where it
seemed appropriate.
Sixth former were asked to answer nine demographical questions and students ten
questions concerning their social and demographical background (age, gender, size,
weight, class, field of study, family background and educational achievement of the
Page 24
24
parents). Two questions were applied to detect which beverages are available at their
parent’s home and at school.
Knowledge (KL). The questionnaire included four questions about the knowledge
concerning beverages and their contents (e.g. “Wie viel Gramm Zucker befinden sich in
100 ml (Angaben beziehen sich auf die gezuckerte Version des Getränks?”). Different
possible answers were offered, including the right answer. To incorporate the difficulty,
concerning the estimation of the beverages’ sugar amount every answer which deviated
–3 points and +3 points from the officially right answer, was considered right. The three
point variance was chosen because 3 grams represent one sugar cube and this is the
established benchmark to rate the sugar amount of beverages. Finally, the right answers
were added up, so that everyone was able to achieve a knowledge index between 0 and
15 points.
Attitude (A). 19 questions concerning the attitude (e.g., “Zuckerfreie Getränke sind
langweilige Getränke”) were surveyed in the questionnaire. Most questions are based on
studies of healthy eating behaviour, which used the “Theory of Planned Behaviour” (see §
5.1). Besides, different questions about beverages and their characteristics, which were
developed from the pre-test, were applied. Both, direct and indirect measures of attitude,
were used in the study. A semantic differential scale was used to assess the direct
attitude of the consulted young adults. The participants were requested to respond to the
sentence “Im Allgemeinen finde ich das Trinken von zuckerhaltigen Getränken…” on a
five-point bipolar scale (e.g., “lecker” compared to “widerlich”). The indirect measure was
composed of different statements, which the respondents had to rate on a five-point
Likert scale from “Stimme überhaupt nicht zu” up to “Stimme voll und ganz zu”. The
construct attitude was coded positively and reliable due to usage of the Cronbach’s Alpha
coefficient .84.
Injunctive subjective norm (ISN). The injunctive subjective norm was tested due to four
statements (e.g., “Meine Eltern finden es gut, wenn ich zuckerfreie Getränke trinke”).
Important people, who may influence the participants, are parents, friends and girl- or
boyfriends. In this case an indirect measure with the five-point Likert scale was also
used. The Cronbach’s Alpha coefficient of the summed scale was .75. This construct had
a positive coding.
Descriptive subjective norm (DSN). Three statements were used in order to test the
influence of the descriptive subjective norm on the choice of beverages (e.g., “Meine
Eltern trinken mehr zuckerhaltige Getränke als zuckerfreie”). A five-point Likert scale was
Page 25
25
applied to measure the answers of two questions. One question asked for the number of
friends, who drink sugared beverages every day. The responded questions offered three
types of social influencers: the parents, the partner and the friends. The construct had a
negative coding concerning sugar-free beverages. The Cronbach’s Alpha coefficient was
.52 which represented a low internal consistency. One can speak of an internal
consistency if the alpha value lies above .70 (Spector, 1992). The influencers can have a
conflicting drinking behaviour, therefore every person or group was respectively taken
apart.
Perceived behavioural control (PBC). The analysis was carried out for the overall
construct perceived behavioural control because the Cronbach’s Alpha coefficients for
internal and external perceived behavioural control were rather low. The eleven items
belonging to the two constructs resulted in a Cronbach’s Alpha coefficient of .60. After
deleting one item („Zuckerfreie Getränke sind Zuhause häufiger verfügbar als
Zuckerhaltige“) the coefficient was 0.61. The analysis of the factors released no
explanation for the low consistency. Since other studies used the same items and proved
the reliability of the construct perceived behavioural control with the existing ten items, it
is used in the further calculations. The construct had a positive coding and the items
were measured on a five-point Likert scale.
Self-identiy (SI). The respondents were asked to answer four questions concerning their
self-identity based on a study of Sparks and Shepherd (1992) (e.g., “Ich sehe mich
selbst als jemanden, der sich mit gesunder Ernährung beschäftigt”). All items regarding a
healthy eating behaviour were measured on a five-point Likert scale ranging from
“Stimme überhaupt nicht zu” to “Stimme voll und ganz zu”. The answers referring to the
self-identity resulted in a Cronbach’s Alpha coefficient of .42. The Cronbach’s Alpha
coefficient was .62, after deleting the last item. This construct was used in several
studies and therefore it is utilized further on. To examine this low reliability, an analysis
of the different factors was arranged (see attachment 10.5). The first three items
concerning the health awareness composed one factor. The other factor consists of the
last item “Ich sehe mich selbst als jemanden, der Essen und Trinken genießt”. It was
clarified that a distinction between the three items, which describe the health awareness,
and the one item concerning the hedonism, is necessary. The construct describing the
health awareness was coded positively and the single item concerning the hedonism was
coded negatively.
Intention (I). Three items relating to the intention were presented on a five-point Likert
scale by assessing the participants’ intention to drink more sugar-free beverages (e.g.,
Page 26
26
“Ich plane in der Zukunft mehr zuckerfreie Getränke zu trinken”). The three items have a
high internal consistency and built up a Cronbach’s Alpha coefficient of .83. The intention
towards sugar-free beverages was coded positively.
Behaviour (B). At the end of the questionnaire all of the respondents were requested to
fill in a “Food Frequency Questionnaire” concerning their drinking behaviour, which
included the choice of 18 different sugared and sugar-free beverages. The total sugar
consumption was calculated by multiplying the number of glasses with the sugar content
of the different beverages. In this passage the sugar intake from beverages is expressed
in gram per day. Due to the fact, that a sugar index was calculated, the construct was
coded negatively concerning sugar-free beverages.
Diaries. As named above some of the young adults additionally took part in a diary
survey for three days. Diary records are generally considered more accurate than
recalling the dietary intake because the respondents write the fluid intake immediately
down after drinking, which decreases the number of errors associated with recalls
(Bandini, Must, Cyr, Anderson, Spadano & Dietz, 2003). They were asked to keep a diary
for three days because some studies showed that respondents find it invasive and
burdensome to record their food intake over a longer period (Macdiarmid & Blundell,
1998). The compliance of keeping a diary declines from reporting day to reporting day,
so that the risk of underreporting grows enormously and the validity decreases (Green,
Allen & O’Connor, 1998; Moreno, Kersting, de Henauw, González-Gross, Sichert-Hellert,
Matthys, Mesana & Ross, 2005; Gersovitz, Madden & Smiciklas-Wright, 1978). To make
the respondents stay with the diary, the reporting of the drinking behaviour was limited
to two weekdays and one day of the weekend.
5.3 Procedure
The main research method consisted of a quantitative survey among German students
with different majors and sixth former in Germany. Sixth former can be defined as pupils
at the age of 16 to 19 years visiting a secondary school in Germany. Sixth former have
the highest educational level of all pupils living in Germany.
The questionnaires were distributed at the beginning or end of a school lesson or
lecture and collected again after a quarter of an hour. Before the questionnaires were
handed out, the investigator presented information on the background and content of the
study and offered the possibility to ask questions during the completion of the
questionnaires. Some respondents attended voluntarily a diary survey of their beverage
consumption for three days (two weekdays and one day of the weekend).
Page 27
27
The data was entered in SPSS 15.0 for Windows and different types of analyses were
carried out.
5.4 Subjects
348 respondents took part in the study. Six questionnaires had to be excluded from the
analysis because important parts of the questionnaire were not filled in or because the
age of the respondents fell below 16 years.
54 respondents (15.8%) wanted to fill in a diary survey about their beverage
consumption. After two weeks eight diaries were handed back. The response rate was
about 14.8%. Due to these few returns, the diaries were excluded from the analysis.
Table 1 shows the demographical characteristics of the studied population. The mean
age was about 20 years within the range of 16 to 29 years. 145 men (42.4%) and 197
women (57.6%) filled in the questionnaire. 219 sixth formers from a secondary school
(64%) and 123 students (36%) with different majors (e.g., Business Administration,
Media management, Dentistry) answered the questions.
Table 1: Frequency Table of the Socio-Demographic Facts
N %
Gender Female 197 57.6
Male 145 42.4
BMI Underweight 32 9.4
Normal weight 254 74.3
Overweight 29 8.5
Obese 11 3.2
Education status Sixth former 219 64.0
Student 123 36.0
Origin mother German 318 93.0
Other 24 7.0
Origin father German 308 90.1
Other 34 9.8
Education level mother Low education 171 50.0
Medium education 70 20.5
High education 87 25.4
Unknown 14 4.1
Education level father Low education 142 41.5
Medium education 43 12.6
High education 135 39.5
Unknown 21 6.1
Missing 1 0.3
Page 28
28
6. Results
6.1 Socio Demographical Factors
Most respondents featured a mother with German origin (N=318). The answers of the
remaining consulted young adults showed that, 7% of the respondents had a mother
with a foreign origin (e.g., Turkey, Poland, Greece, China etc.). 90.1% of the consulted
students’ and pupils’ male parents featured a German origin. 34 respondents had a
father from foreign countries like Turkey, Italy, Spain, Poland etc.
The educational levels are divided into low, medium and high. Parents with no
graduation or who visited a school only for ten years (secondary general school,
intermediate secondary school and grammar school, classes 5 to 10) fall in the
designation low. People with a vocational diploma and a graduation at a grammar school
qualifying for university admission are considered as having a medium education. Highly
educated people are those who accomplished their university degree.
Half of the respondent’s mothers presented a low education. Followed by nearly one
third of high educated mothers. The average education level of mothers proved to be the
graduation of a vocational diploma, hence a medium education. The questionnaire exhibit
just as many low educated fathers as high educated fathers. Similar to the mothers’
education, the average education level represented a vocational diploma graduation.
6.2 Consumption of Sugared and Sugar-free Beverages
Table 2 gives an overview on the beverage consumption of the respondents. There is
only one beverage which was consumed daily 4 to 6 times, namely water. Another study
features approximately equivalent results. According to the NVS (2008), the German
population consumes 1115 gram water a day. The category of sparkling apple juice
showed a consumption two to three times a week. Orange juice, skimmed milk, whole
milk, multivitamin juice and soft drinks belong to the group of beverages which were
consumed once a week. The respondents declared that they rarely drink yoghurt drinks,
chocolate milk, apple juice, diet soft drinks and ice tea. Hardly never buttermilk, soya
milk, grape juice, vegetable juice, bio soft drink and smoothies were consumed by the
respondents. The total sugar intake resulted in about 6.9 gram every day.
Page 29
29
Table 2: Frequency Table of the Averaged Beverage Consumption per Month Ranked by
Mean Frequency
(N varies between 338 and 342, depending on the different items)
never 1-2
times a
month
1 time
a
week
2-3
times
a
week
4-6
times
a
week
1
time
a day
2-3
times
a day
4-6
times
a day
7
times
or
more
often
a day
Mean
Water
3 8 11 6 13 18 53 81 149 7.63
Sparkling
apple juice
50 56 50 63 40 24 42 11 5 3.91
Orange juice
62 89 56 50 28 28 17 8 4 3.32
Skimmed milk
116 50 40 31 31 46 15 5 8 3.27
Soft drink
58 107 72 46 22 11 15 8 3 3.05
Whole milk
143 56 29 30 19 41 17 4 3 2.87
Multivitamin
juice
118 93 50 33 25 12 6 3 1 2.52
Apple juice
114 112 45 23 21 13 7 2 3 2.47
Chocolate
milk
149 72 46 31 16 17 8 1 1 2.38
Diet soft
drink
168 74 35 29 11 11 8 4 2 2.23
Ice tea
172 91 30 17 11 2 13 3 2 2.09
yoghurt
drinks
170 113 30 12 6 4 1 1 0 1.79
Bio soft drink
237 79 12 4 5 2 1 1 0 1.46
Grape juice
240 82 6 6 5 9 2 0 1 1.44
Smoothie 247 70 17 4 2 1 1 0 0 1.39
Buttermilk
227 54 5 10 2 2 1 1 0 1.38
Vegetable
juice
305 22 4 4 1 2 2 1 0 1.22
Soya milk
332 10 1 1 1 3 1 0 1 1.15
6.3 Respondents’ Knowledge of Beverages’ Sugar Content and the Daily Fluid Demand
The respondents were asked to estimate the sugar content of the different beverages.
The beverage, which was rated mostly as containing the highest sugar amount, was ice
tea. The respondents estimated that ice tea has twice as much sugar as the real content.
Page 30
30
Furthermore, they overestimated the sugar content of soft drinks and bio soft drink. An
understatement was existent concerning the sugar content of grape juice. By contrast,
the consulted people estimated the sugar content concerning chocolate milk, apple juice,
sparkling apple juice and smoothies really close to the exact amount.
19.3% (N=66) estimated the right fluid demand of 1.5 litres daily. Nearly half of the
respondents were of the opinion that 2.5 litres is the right fluid intake by beverages
every day (N=161, 47.1%). A third of the consulted people assessed a fluid demand of 3
litres (M=111, 32.5%).
Table 3: Descriptive Table of Real and Estimated Sugar Content (100 ml/gram)
Real sugar content Estimated sugar content Std.D.
Chocolate milk 12.00 12.53 3.34
Apple juice 11.00 11.00 3.32
Grape juice 17.00 11.27 3.48
Sparkling apple juice 8.00 9.77 2.99
Soft drinks 11.00 15.73 2.12
Bio soft drinks 6.00 8.89 3.46
Ice tea 6.00 13.41 3.32
Smoothie 12.00 10.99 3.68
Std.D. = Standard Deviation
6.4 Relations between the Variables of the Adjusted Theory of Planned Behaviour
First of all a correlation matrix was computed to examine the relationship between the
different constructs. Due to this approach the positive or negative correlations can be
detected.
The mean of the construct knowledge averaged 6.96 (N=275). This result is a little
bit lower than half of the 15 questions concerning knowledge. It is also interesting to
have a look at the number of completed questions of knowledge. Nearly 20% of all
respondents did not fill questions of knowledge (N=67) in. The attitude construct reached
an average of 0.42 (N=326), which appeared between the statements “So-so” and “I
agree”. The attitude towards sugar-free beverages was rated by the respondents in a
positive direction. The injunctive subjective norm scored an average of -0.12 (N=313)
whereas it is located between “So-so” and “I do not agree”. That means, that the
respondents did not agree with the statement that their surrounding drink more sugare
beverages than sugar-free beverages. The first part of the descriptive subjective norm
asking for the parents’ behaviour, reached an average of -0.75 (N=342). The second part
referring to the perceived behaviour of the partner scored an average of -0.26 (N=308).
This means, that most parents and partners drink more sugar-free beverages than
sugared ones. On the contrary, an average of 3.58 (N=339) was set up by the third and
last part of the descriptive subjective norm. That leads to the conclusion, that most of
the respondent’s friends drink sugared beverages every day. The perceived behavioural
Page 31
31
control was rated with an averaged amount of 0.83 (N=327). This value tends to the
statement “I agree” and means that the respondents thought of themselves to be able to
control the consumption of beverages. The self-identity construct, which refers to the
health awareness, had an average value of 0.37 (N=338). This is only a weak positive
rating of being a health aware consumer. The part consisting of the hedonistic view
scored an average of 1.23 (N=341). With this part of the construct, the respondents
agreed or agreed squarely and thought of themselves to be a hedonistic customer. The
intention to drink less sugared beverages showed an average of -0.16. Most of the
respondents did not have the intention to drink less sugared beverages. The total sugar
intake resulted in about 6.9 gram every day.
Almost every construct had some significant correlations with other constructs (see
table 4). Remarkable is the construct knowledge and the one item concerning the
consumption view, which tries to reflect a part of the construct self-Identity (SI
consumption). These constructs had no linear relationship with any other construct. Due
to this fact, they were excluded in the regression analysis.
The availability of beverages at home and at school or university was included in the
correlation analysis. The availability at home correlated strongly with the constructs
attitude, the descriptive subjective norm of the parents and partner and with the
consumption of sugared beverages. If sugared beverages were often available at home,
respondents had a more negative attitude towards sugar-free beverages. Respondents
who observed their parents and partners drinking more sugared beverages stated that
there were more sugared beverages available at home. The availability at school or
university had no significant effect at all.
The attitude towards sugar-free beverages featured a positive correlation with the
injunctive subjective norm, the perceived behavioural control, the self-identity (health)
and the intention to drink less sugared beverages. It correlated negatively with the
descriptive subjective norm in observing the parents and friends, who drink sugared
beverages. Furthermore, the positive attitude towards sugar-free beverages had a
negative correlation with the consumption of sugared beverages. The negative
correlations were already expected because a correlation analysis between positively and
negatively coded constructs was applied. The injunctive subjective norm showed a
negative correlation with three constructs: the descriptive subjective norm of parents,
friends and behaviour. If the surrounding of the respondents had a positive meaning
towards sugar-free beverages, the self-identity was judged more positively just as the
intention. There was a positive correlation between parents drinking a lot of sugared
beverages with partners and friends and their consumption of sugared beverages. The
perceived behavioural control and the self-identity were lower, if parents consumed more
sugared beverages. The descriptive subjective norm showed a positive correlation with
Page 32
32
the behaviour. Just like the DSN of parents, the descriptive subjective norm of the
partner had a positive correlation with the DSN of the friends. Respondents, who had a
lot of friends drinking sugared beverages everyday scored badly on the construct self-
identity. Besides this, these consulted people appeared to drink more sugared beverages.
If participants thought of themselves as having a lot of behavioural control, they
presented a more positive picture of their self-identity referring to their health
awareness. On the other hand, the self-identity as a healthy person appeared in a
positive correlation with the intention to drink more sugar-free beverages and in a
negative way with the consumption of sugared beverages. The intention to drink more
sugar-free beverages had a negative correlation with the behaviour concerning the
consumption of sugared beverages. Even though the correlation showed the expected
direction, the correlation between the intention and the consumption of sugared
beverages appeared to be low. Other studies proved correlations between .20 till .57
(e.g., Armitage & Conner, 1999b; Povey et al., 2000). The strongest correlations of the
consumption concerning sugared beverages were presented with the availability of
sugared beverages at home and the attitude about sugar-free beverages.
Table 4: Correlations of the Constructs
Availab
ility
home-
Availab
ility
school
/ uni.-
KL+ A+ ISN+ DSN
parent
-
DSN
partne
r-
DSN
friends
-
PBC+ SI
health
+
SI
consu
mption
-
I+
B-
Availability
home
Availability
school /uni.
.15**
KL -.07 -.00
A -.29** .08 -.01
ISN -.18** .08 -.00 .50**
DSN parents .23** -.03 -.03 -.32** -.24**
DSN partner .09 .04 -.06 -.11 .00 .39**
DSN friends .22** -.08 -.01 -.29** -.19** .26** .14*
PBC -.14* -.01 .02 .17** .02 -.14* -.06 .04
SI health -.16** -.06 -.01 .44** .29** -.24** -.05 -.22** .18**
SI
consumption
-.11 .00 -.03 -.08 .04 -.11 .01 -.00 .05 .06
I -.03 .07 -.05 .44** .41** .00 -.02 -.08 -.06 .25** -.09
B .25** -.03 .01 -.26** -.17** .18** .02 .13* -.07 -.16** -.05 -.11*
*p<0.05, ** p<0.01
KL=Knowledge, A=Attitude, ISN=Injunctive subjective norm, DSN=Descriptive subjective norm, PBC=Perceived Behavioural
Control, SI=Self-identity, I=Intention, B=Behaviour
+=positive coded, -=negative coded
Page 33
33
6.5 Multiple Regression Analysis of the Beverage Consumption and the Intention to Drink
Less Sugared Beverages
A regression analysis was carried out in a stepwise method using behaviour as a
dependent variable (see table 5). The independent variables consisted of the
demographical data, the availability of sugared beverages at home and at school /
university and the constructs from of the Theory of Planned Behaviour which correlate
significantly with the dependent variable.
From the sample as a whole, it was possible to account for approximately 10% of the
variance in behaviour using availability of sugared beverages at home only. The most
important determinants of the first and third block are the education level of the father
and the descriptive subjective norm of the friends. The other factors do not contribute
significantly to prediction the consumption of sugared beverages.
Table 5: Stepwise Regression Analysis of Predicting the Consumption of Sugared
Beverages Regarding the Total Population (N=249)
Block 1
Beta
P
Block 2
Beta
P
Block 3
Beta
p
Age -.10 .122 -.03 .699 -.01 .870
Education level mother .01 .980 -.03 .652 -.06 .422
Education level father .05 .493 .10 .150 .13 .065
BMI .02 .792 .01 .833 -.00 .950
Availability at home .33 .000 .32 .000
Availability at
school/university
-.05 .405 -.05 .496
Attitude -.06 .450
ISN -.07 .372
DSN parents .08 .270
DSN partner -.06 .378
DSN friends -.12 .066
PBC .04 .580
SI (health) -.04 .568
Intention -.03 .649
R .11 .34 .38
R² .01 .11 .15
F (df=4)=0.78 .542 (df=6)=5.11 .000 (df=14)=2.91 .000
ΔR² .10 .04
ΔF 13.62 .000 1.22 .286
BMI=Body Mass Index, ISN=Injunctive subjective norm, DSN=Descriptive subjective norm, PBC=Perceived Behavioural
Control, SI=Self-identity
In terms of the factor intention, the determinants of the Theory of Planned Behaviour can
be accounted for 29% of the variance. Attitude, the descriptive subjective norm of the
parents and the partner, the perceived behavioural control and the self-identity
concerning health awareness were identified as the strongest predictors. In addition, a
Page 34
34
significant proportion of the variance concerning the factor intention (5%) was explained
due to the demographical data.
Intention as a dependent variable can be explained by 59% of the theory. Only 38%
of the variance referring to behaviour can be predicted by the theory and therefore the
Theory of Planned Behaviour had more explanatory power within the regression analysis
of the intention. Figure 2 shows the predictive power of every single variable on the
intention to drink less sugared beverages.
Table 6: Stepwise Regression Analysis of Predicting the Intention to Drink Less Sugared
Beverages Regarding the Total Population (N=249)
Block 1
Beta
p
Block 2
Beta
p
Block 3
Beta
p
Age .10 .127 .08 .244 .03 .671
Education level mother -.09 .208 -.10 .177 -.06 .346
Education level father .21 .004 .21 .004 .16 .009
BMI .10 .124 .10 .142 .11 .058
Availability at home -.00 .991 .09 .134
Availability at
school/university
.07 .261 .03 .573
Attitude .41 .000
ISN .20 .002
DSN parents .19 .003
DSN partner -.07 .233
DSN friends .04 .467
PBC -.11 .041
SI (health) .11 .083
Behaviour -.03 .649
R .23 .24 .59
R² .05 .06 .35
F (df=4)=3.44 .009 (df=6)=2.51 .023 (df=14)=8.95 .000
ΔR² .01 .29
ΔF .653 .521 13.04 .000
BMI=Body Mass Index, ISN=Injunctive subjective norm, DSN=Descriptive subjective norm, PBC=Perceived Behavioural
Control, SI=Self-identity
6.6 Group Differences Concerning the Predicting Power of the Constructs
Two group differences were made within the hypotheses formulated in chapter 3: it is
distinguished between genders and age (sixth former vs. students). The results are
described in the following paragraphs.
Answering hypothesis 1: “Female adults drink less sugared beverages than male adults.”
There are some important differences between the genders concerning their drinking
behaviour, which can be ascertained with the help of an Independent-Samples T Test.
The most important difference which can be made is between female’s and male’s
Page 35
35
attitude towards sugar-free beverages. Young female adults showed a better attitude
towards sugar-free beverages than boys. Furthermore, they perceived a higher injunctive
subjective norm of their surrounding and a higher descriptive subjective norm of their
parents and friends than the male respondents. Female adults considered themselves to
have a higher health-consciousness. On the other hand, boys rated the pleasure of
consuming more significantly than the female counterpart did. With an average of 5.37
gram sugar every day the female adults consumed 3.52 gram less sugar than the male
respondents.
Figure 2: Stepwise Regression of Predicting the Intention to Drink Less Sugared
Beverages Regarding the Total Population (N=249)
The regression analysis (tables 8 till 10) showed that the behaviour and the intention of
female and male respondents were influenced by different constructs. Due to the fact,
Page 36
36
that regression analysis concerning male’s consumption of sugared beverages had a low
significance (p>0.1), the remarks are only devised shortly and the table is not contained
in the article (see attachment 10.5).
Within both groups, the availability of sugared beverages at home was the most
important predictor of the consumption concerning sugared beverages. Within the male
group the availability at home, the descriptive subjective norm of the friends and the
education level of the father accounted for 18% of the variance in behaviour. The second
and third most important predictors within the female group turned out to be the attitude
towards sugar-free beverages and the BMI. All in all, they accounted for 26% of the
variance.
Table 7: Independent-Samples T Test of the Gender Differences
Gender N Mean Std. D. t
Knowledge Female 158 6.94 1.84 -.243
Male 117 6.99 1.86
Attitude Female 188 .58 .52 6.09**
Male 138 .21 .57
ISN Female 183 .03 .73 3.79**
Male 130 -.33 .89
DSN parents Female 197 -.86 1.13 -2.27*
Male 145 -.59 1.10
DSN partner Female 184 -.18 1.23 1.33
Male 124 -.36 1.06
DSN friends Female 196 3.42 .92 -3.61**
Male 143 3.78 .95
PBC Female 189 .80 .44 -1.34
Male 138 .87 .53
SI health Female 195 .49 .74 3.39**
Male 143 .21 .76
SI consumption Female 197 1.15 .87 -2.01*
Male 144 1.35 .90
Intention Female 196 .02 .97 3.86**
Male 145 -.40 1.03
Behaviour Female 197 5.37 6.26 -3.55**
Male 145 8.89 10.64
*p<0.05, **p<0.01
KL=Knowledge, A=Attitude, ISN=Injunctive subjective norm, DSN=Descriptive subjective norm, PBC=Perceived Behavioural
Control, SI=Self-identity, I=Intention, B=Behaviour
Page 37
37
The attitude and the descriptive subjective norm concerning the parents and the partner
were significant predictors of the intention in both groups. In addition, predictive value
was presented by the injunctive subjective norm and the BMI within the male group. The
fourth most important predictor of female’s intention was the education level of the
father. Summing up, the four constructs accounted for 41% and 36% respectively, of the
variance concerning intention.
Table 8: Stepwise Regression Analysis for Predicting the Consumption of Sugared
Beverages Regarding Female Respondents (N=144)
Block 1
Beta
p
Block 2
Beta
p
Block 3
Beta
p
Age -.09 .300 .03 .733 .03 .703
Education level mother -.06 .536 .03 .760 .02 .824
Education level father -.05 .587 -.01 .932 -.03 .764
BMI -.11 .214 -.11 .180 -.13 .101
Availability at home .43 .000 .36 .000
Availability at
school/university
-.09 .281 -.04 .643
Attitude -.26 .012
ISN -.13 .164
DSN parents .01 .943
DSN partner -.06 .455
DSN friends -.06 .513
PBC .08 .387
SI (health) .04 .634
Intention .12 .199
R .17 .44 .51
R² .03 .20 .26
F (df=4)=1.01 .404 (df=6)=5.58 .000 (df=14)=3.19 .000
ΔR² .17 .06
ΔF 14.35 .000 1.31 .243
BMI=Body Mass Index, ISN=Injunctive subjective norm, DSN=Descriptive subjective norm, PBC=Perceived Behavioural
Control, SI=Self-identity
Page 38
38
Table 9: Stepwise Regression Analysis for Predicting the Intention to Drink Less Sugared
Beverages of Male Respondents (N=104)
Block 1
Beta
p
Block 2
Beta
p
Block 3
Beta
p
Age -.03 .774 -.04 .712 -.07 .459
Education level mother -.08 .478 -.10 .409 -.04 .715
Education level father .08 .482 .09 .414 .01 .960
BMI .31 .002 .31 .002 .22 .018
Availability at home .03 .804 .04 .709
Availability at
school/university
.09 .399 .12 .193
Attitude .26 .024
ISN .28 .007
DSN parents .27 .007
DSN partner -.22 .022
DSN friends .19 .036
PBC -.10 .241
SI (health) .13 .179
Behaviour -.03 .704
R .31 .32 .64
R² .10 .10 .41
F (df=4)=2.62 .040 (df=6)=1.88 .092 (df=14)=4.41 .000
ΔR² .01 .30
ΔF .461 .632 5.76 .000
BMI=Body Mass Index, ISN=Injunctive subjective norm, DSN=Descriptive subjective norm, PBC=Perceived Behavioural
Control, SI=Self-identity
Page 39
39
Table 10: Stepwise Regression Analysis for Predicting the Intention to Drink Less
Sugared Beverages of Female Respondents (N=144)
Block 1
Beta
p
Block 2
Beta
p
Block 3
Beta
p
Age .15 .078 .15 .106 .09 .247
Education level mother -.08 .411 -.08 .388 -.06 .456
Education level father .27 .004 .28 .003 .26 .002
BMI .02 .773 .02 .805 .05 .485
Availability at home .03 .333 .10 .287
Availability at
school/university
.02 .836 -.06 .475
Attitude .47 .000
ISN .19 .029
DSN parents .18 .043
DSN partner -.00 .976
DSN friends -.05 .565
PBC -.13 .116
SI (health) .08 .357
Behaviour .10 .199
R .29 .29 .60
R² .09 .09 .36
F (df=4)=3.26 .014 (df=6)=2.18 .049 (df=14)=5.16 .000
ΔR² .01 .00 .27
ΔF .09 .910 6.85 .000
BMI=Body Mass Index, ISN=Injunctive subjective norm, DSN=Descriptive subjective norm, PBC=Perceived Behavioural
Control, SI=Self-identity
Answering hypothesis 2: Older respondents (students) drink less sugared beverages than
younger respondents (sixth former).
Another aspect of the differences within the groups can be considered the age. Students
are older (M=23.4 years) than sixth formers (M=17.6 years) and therefore have other
perceptions of their surroundings. During this period, a change in their living situation
takes place. Most students move out of their parent’s home and live on their own or with
friends. Due to this reason, some variations may appear in the judgments of the different
constructs.
Students showed a more positive attitude towards sugar-free beverages than sixth
former. Furthermore, they observed their parents drinking less sugared beverages and
have less friends drinking sugared beverages daily. Students scored their health
awareness and the consumption view on the scale of self-identity significantly higher
than sixth former. The last difference, which can be made, refers to the intentions of
drinking less sugared beverages. Sixth former showed a lower intention of drinking less
sugared beverages than students.
Page 40
40
Table 11: Independent-Samples T Test of Age Differences
Education level N Mean Std. D. t
Knowledge Sixth formers 191 7.01 1.70 .562
Students 84 6.86 2.14
Attitude Sixth formers 211 .33 .58 -4.16**
Students 84 .59 .52
ISN Sixth formers 208 -.17 .81 -1.52
Students 105 -.02 .83
DSN parents Sixth formers 219 -.64 1.18 2.35*
Students 123 -.93 1.11
DSN partner Sixth formers 203 -.25 1.14 .200
Students 105 -.28 1.30
DSN friends Sixth formers 219 3.68 .94 2.91**
Students 120 3.38 .93
PBC Sixth formers 210 .83 .47 .138
Students 117 .83 .50
SI health Sixth formers 217 .31 .79 -2.06*
Students 121 .48 .68
SI consumption Sixth formers 219 1.16 .92 -2.20*
Students 122 1.37 -80
Intention Sixth formers 218 -.26 1.01 -2.41*
Students 123 .02 1.00
Behaviour Sixth formers 219 7.51 8.26 1.70
Students 122 5.81 9.20
*p<0.05, **p<0.01
A=Attitude, ISN=Injunctive subjective norm, DSN=Descriptive subjective norm, PBC=Perceived behavioural control; SI=Self-
identity, I=Intention
The predicting of the intention to drink less sugared beverages and the consumption of
sugared beverages (behaviour) was compared between the two groups. In both groups,
the availability at home accounted for significant proportions of the variance in
behaviour. However, other factors were also important predictors of the student group.
The descriptive subjective norm of the friends and the self-identity concerning the health
awareness had influence on the consumption of sugared beverages. All in all, the three
constructs accounted for 29% of the variance. The educational level of the father was an
influential determinant of the sixth former’s consumption of sugared beverages. 15% can
be explained due to the two constructs.
Page 41
41
The attitude and the education level of the father predicted a big part of the intention in
terms of the sixth former and student group. These two constructs in addition with the
injunctive subjective norm, the BMI, the descriptive subjective norm of the partner and
the parents, accounted for 42% of the variance in the sixth former’s intention. 40% of
the student’s intention was predicted by the attitude, the education level of the father,
the descriptive subjective norm of the friends and the self-identity with respect to the
health awareness.
The analysis of the respondent’s educational level pointed out that some differences
certainly exist between the age groups.
Table 12: Stepwise Regression Analysis for Predicting the Consumption of Sugared
Beverages Regarding Sixth former (N=172)
Block 1
Beta
P
Block 2
Beta
p
Block 3
Beta
p
Age -.06 .415 -.01 .888 -.00 .988
Education level mother -.08 .372 -.11 .215 -.13 .135
Education level father .07 .439 .11 .190 .14 .100
BMI .01 .915 .01 .874 .02 .842
Availability at home .33 .000 .32 .000
Availability at
school/university
-.03 .654 -.01 .884
Attitude -.08 .475
ISN -.03 .735
DSN parents .05 .636
DSN partner -.07 .422
DSN friends -.04 .605
PBC .07 .385
SI (health) .00 .981
Intention -.11 .266
R .09 .33 .38
R² .01 .11 .15
F (df=4)=.37 .829 (df=6)=3.43 .003 (df=14)=1.92 .028
ΔR² .10 .04
ΔF 9.47 .000 .82 .589
BMI=Body Mass Index, ISN=Injunctive subjective norm, DSN=Descriptive subjective norm, PBC=Perceived Behavioural
Control, SI=Self-identity,
Page 42
42
Table 13: Stepwise Regression Analysis for Predicting the Consumption of Sugared
Beverages Regarding Students (N=76)
Block 1
Beta
p
Block 2
Beta
p
Block 3
Beta
p
Age -.05 .663 -.03 .794 .05 .407
Education level mother .19 .153 .14 .291 .10 .774
Education level father .03 .835 .09 .521 .05 .358
BMI .06 .625 .03 .770 .02 .181
Availability at home .31 .010 .27 .049
Availability at
school/university
-.05 .701 -.16 .269
Attitude .07 .597
ISN -.14 .280
DSN parents .10 .449
DSN partner -.09 .461
DSN friends -.39 .005
PBC .03 .812
SI (health) -.23 .098
Intention .18 .203
R .21 .36 .54
R² .05 .13 .29
F (df=4)=.85 .496 (df=6)=1.78 .116 (df=14)=1.78 .062
ΔR² .09 .16
ΔF 3.51 .035 1.68 .120
BMI=Body Mass Index, ISN=Injunctive subjective norm, DSN=Descriptive subjective norm, PBC=Perceived Behavioural
Control, SI=Self-identity,
Page 43
43
Table 14: Stepwise Regression Analysis for Predicting the Intention to Drink Less
Sugared Beverages of Sixth former (N=172)
Block 1
Beta
p
Block 2
Beta
p
Block 3
Beta
p
Age -.03 .727 -.05 .558 -.01 .825
Education level mother -.10 .261 -.12 .194 -.11 .145
Education level father .14 .105 .14 .110 .07 .345
BMI .14 .072 .14 .079 .13 .037
Availability at home -.05 .498 .10 .142
Availability at
school/university
.11 .163 .07 .263
Attitude .41 .000
ISN .30 .000
DSN parents .25 .001
DSN partner -.21 .003
DSN friends -.01 .868
PBC -.04 .527
SI (health) .07 .360
Behaviour -.07 .266
R .19 .21 .65
R² .03 .05 .42
F (df=4)=1.50 .204 (df=6)=1.35 .232 (df=14)=5.21 .000
ΔR² .01 .38
ΔF 1.09 .340 12.84 .000
BMI=Body Mass Index, ISN=Injunctive subjective norm, DSN=Descriptive subjective norm, PBC=Perceived Behavioural
Control, SI=Self-identity,
Page 44
44
Table 15: Stepwise Regression Analysis for Predicting the Intention to Drink Less
Sugared Beverages of Students (N=76)
Block 1
Beta
p
Block 2
Beta
p
Block 3
Beta
p
Age -.07 .555 -.11 .391 -.15 .213
Education level mother -.11 .409 -.13 .334 -.06 .599
Education level father .33 .014 .36 .08 .32 .012
BMI .05 .667 .03 .826 .05 .651
Availability at home .15 .193 .15 .258
Availability at
school/university
.10 .449 .09 .458
Attitude .22 .088
ISN .18 .135
DSN parents .17 .172
DSN partner .08 .469
DSN friends .30 .021
PBC -.17 .172
SI (health) .27 .030
Behaviour .15 .203
R .31 .36 .63
R² .10 .13 .40
F (df=4)=1.90 .119 (df=6)=1.73 .125 (df=14)=2.97 .002
ΔR² .03 .27
ΔF 1.36 .263 3.52 .002
BMI=Body Mass Index, ISN=Injunctive subjective norm, DSN=Descriptive subjective norm, PBC=Perceived Behavioural
Control, SI=Self-identity,
6.7 The Influence of Sociocultural Factors
Answering hypothesis 3: Young adults have similar drinking patterns concerning sugar-
free and sugared beverages as their parents and/or friends.
The correlation analysis showed a significant negative correlation between the injunctive
subjective norm and the consumption of sugared beverages. Besides, two significant
positive correlations between the descriptive subjective norm with respect to their
parents and friends and the injunctive subjective norm were detected. If the respondents
had the feeling that their parents, partner and friends support the drinking of sugar-free
beverages, the consumption of sugared beverages was lower (-.17, p<0.01). If parents
and a lot of friends consumed more sugared beverages than sugar-free drinks, the
consumption of sugared beverages increased (.18, p<0.01, .13, p<0.05, respectively).
Moreover, the influence of the friends’ drinking behaviour was more significant for all
the respondents (p<0.1) to consume sugared beverages than the drinking behaviour of
the parents (p>0.1). In contrast, the parent’s descriptive subjective norm had more
influence (p<0.05) on the intention to drink less sugared beverages than the friends DSN
(p>0.1). It is interesting to examine is the difference between students and sixth former.
The intention of sixth formers can be predicted by the descriptive subjective norm of
Page 45
45
their parents and their partner (see table 14). However, the intention of students was
only influenced by the descriptive subjective norm of their friends.
The analysis showed clearly that the social environment had an important impact on
the drinking behaviour of the respondents but the importance varies in the different
groups.
Answering hypothesis 4: Young adults from a higher educated family drink less sugared
beverages than young adults from a lower educated family.
A one-way ANOVA analysis with a post-hoc comparison (Bonferroni) was carried out to
check the relationship between education and drinking pattern. Three education levels
were distinguished: low, medium and high education level (see table 1).
Looking at the education level of the father, the analysis showed one significant
difference between the education levels. The descriptive subjective norm concerning
parents’ consumption of sugared beverages appeared differently between respondents,
who have a father with a low education and respondents, who have a father with high
education. Respondents observed their high educated fathers consuming less sugared
beverages. Differences within the other constructs and between the education levels of
the mothers were not significant and therefore were not mentioned.
The regression analysis showed that the educational level of the father had an
impact (p<0.1) on sixth former’s consumption of sugared beverages (see table 12). The
intention of students and women was predicted among other things by the educational
level of the father (p<0.1).
Table 16: One-way ANOVA for the Educational Level of the Father
Education level N Mean Std. D. F
DSN parents Low education 142 -.59 1.17 2.92*
High education 135 -.96 1.03
*p<0.5
6.8 The Influence of Home Economical Factors
Answering hypothesis 5: “The availability of sugared beverages at home and at school
has an influence on the consumption of sugared beverages by young adults.”
In the theoretical framework speculations on the influence of the availability and the
consumption of beverages were assumed. The next analysis shows the correlation
between the availability of different beverages at home or at school / university and the
consumption of these beverages. Table 17 shows clearly that beverages’ availability at
home correlates significantly with the consumption. The consumption of ice tea and
smoothies showed simply no correlation to the availability of beverages at home. The
availability at school or at the university influenced only the consumption of smoothies.
Page 46
46
The regression analyses (table 5, 8, 12 and 13) detected the factor availability of sugared
beverages at home to be the most important predictor concerning the consumption of
sugared beverages. No other variable had such big influence on the actual behaviour.
Therefore the hypothesis, that the availability of sugared beverages at home has a
big influence on the consumption of sugared beverages, can be totally supported. The
influence of the availability at school and at the university cannot be supported.
Table 17: Correlation Analysis between the Beverage Consumption and the Availability at
Home and at School / University
Availability home Availability school / university
Soft drinks consumption .51** .03
Ice tea consumption -.02 -.00
Bio soft drinks consumption .31** .03
Sparkling apple juice consumption .55** .03
Apple juice consumption .40** .11
Milk consumption .08 -.01
Chocolate milk consumption .44** .02
Smoothies consumption .07 .46**
Orange juice consumption .46** -.03
Water consumption .25** -.01
**p<0.01
6.9 The Influence of the Variables from the Theory of Planned Behaviour
Answering hypothesis 6: “The more adults know about the beverages’ ingredients the
healthier they drink.”
The correlation analysis in table 4 presented no significant coherence between knowledge
of beverages’ ingredients and a healthful drinking pattern (.01). It cannot be expected
that higher knowledge leads to healthy drinking patterns in collaboration with more
awareness. Due to this conclusion, the hypothesis had to be discarded.
Answering hypothesis 7: “The more positive the attitude towards sugared beverages the
higher the consumption of sugared beverages (the worse the intention to drink less
sugar-free beverages).”
As shown in the correlation analysis (table 4), there was a significant negative coherence
between the attitude towards sugar-free beverages and the consumption of sugared
Page 47
47
beverages (-.26, p<0.01). The regression analyses cannot support a strong predictive
power of this construct. Only the intention to drink less sugared beverages was strongly
influenced by the construct attitude. The attitude of sixth formers had more effect on the
intention to drink sugar-free beverages than the attitude of students. Both, female and
male adult’s intention was mainly predicted by the attitude but the significance was
somewhat higher for the female respondents. The results clarified that the hypothesis
cannot be supported for the determination of the behaviour but well for the prediction of
the intention.
Answering hypothesis 8: “The stronger the perception of the injunctive subjective norm
concerning sugared beverages the higher the consumption of sugared beverages (the
worse the intention to drink less sugar-free beverages).”
The injunctive subjective norm concerning sugar-free beverages had a significant
negative correlation with the consumption of sugared beverages. That means, that a high
injunctive subjective norm concerning sugared beverages resulted in a higher
consumption of sugared beverages. However, the ISN had no significant influence on the
proportion of variance in behaviour. Comparable to the determinant attitude, the
injunctive subjective norm accounted for the variance in intention. Simply for students
the injunctive subjective norm could not be considered as an important predictor of
intention.
Answering hypothesis 9: “The stronger the perception of the descriptive subjective norm
concerning sugared beverages the higher the consumption of sugared beverages (the
worse the intention to drink less sugar-free beverages).”
In advance, a distinction between the descriptive subjective norm of parents, partners
and friends was made. Every group can exert a different power of influence on the target
group. The correlation analysis showed that parents and friends had a greater impact on
the behaviour of the respondents (.18, p<0.01, .15, p<0.05, respectively) than the
partner (.02). Parents, who consumed a lot of sugared beverages, influenced the choice
of their child concerning sugared beverages positively. The regression analysis showed
that the descriptive subjective norm of the parents had influence on the intention of the
whole sample, the intention of both genders and of the sixth formers. The other
subjective influencer is the circle of friends. The more friends, who drank sugared
beverages daily, the more sugared beverages were consumed by the target group. This
determinant accounted for important variance in the behaviour. It is applicable for all
respondents, but especially for the consumption of sugared beverages concerning male
respondents and students. Friends showed predictive power on student’s and male’s
intention. Although there was no significant correlation between the descriptive
Page 48
48
subjective norm concerning the partner and the behaviour or intention, the regression
analysis detected an influence on the intention of male respondents and sixth formers.
Answering hypothesis 10: “The worse the perception concerning the perceived
behavioural control of drinking sugared beverages the higher the consumption of sugared
beverages (the worse the intention to drink less sugar-free beverages).”
The perceived behavioural control showed no significant correlation with the behaviour,
nor with the intention to drink less sugared beverages. The only significant influence of
the determinant, was exerted on the prediction of the intention for the whole sample. A
low significance was detected within the prediction of the female respondent’s intention.
Answering hypothesis 11: “The less self-identity considering oneself as healthy the higher
the consumption of sugared beverages (the worse the intention to drink less sugar-free
beverages).”
The self-identity as being very health-orientated correlated with the intention to drink
less sugared beverages and the consumption of sugared beverages significantly. The
self-identity did not account for a proportion of the variance in behaviour but well for a
part of the intention’s variance. In particular, the determinant was able to predict the
intention of the student group significantly.
Answering hypothesis 12: “The lower the intention to drink sugar-free beverages the
higher the consumption of sugared beverages.”
Indeed, the correlation analysis showed a significant coherence between the intention
and the consumption of beverages but only in a low modality (-.11). The regression
analysis also approved that the two constructs only allegorized a low relationship. The
determinant intention had no influence on the prediction of the consumption. Therefore
the hypothesis has to be revised.
Answering Hypothesis 13: “The higher the consumption of sugared beverages the lower
the intention to drink sugar-free beverages.”
As named above the relationship between the two determinants appeared to be low. No
influential power of the previous behaviour can be detected in order to predict the
intention towards sugared beverages. Again, the hypothesis cannot be supported.
Page 49
49
7. Discussion
The aim of the study consisted in obtaining information about the choice of non-alcoholic
beverages made by young adults. These results are necessary in order to give advices for
an educational initiative which intends to reduce the uncertainty of the consumer and
provide a supportive help for making a responsible choice. This chapter deals with a more
interpretative view on the results and an explanatory approach.
7.1 General discussion
Not more than 10% of a normal grownup’s energy intake should consist out of sugar
(DGE, 2003). This corresponds to 45 - 55 gram sugar daily. The current study showed
that young adults received approximately 7 gram sugar out of beverages every day. This
represents 12% to 15% of the daily sugar amount. In comparison to another study,
these consulted young adults presented a comparably low sugar intake from beverages.
A study from Briefel, Wilson and Gleason (2009) points out that the energy intake from
sugared beverages averaged about 159 kcal. This represents approximately 40 gram
sugar and therefore the consumption of sugar turns out to be four times as much as in
this study. Within the female and student group, sugar intake from sugared beverages
was lower, although the difference between students and sixth former was not
significant. The NVS study (2008) provides similar information. The study reports that
male adults drink more sugar-containing beverages, like juices and soft drinks.
Furthermore, the fluid intake of water and juices complied with the data of the NVS.
Approximately 1250 gram water and 260 gram juices (apple juice, orange juice, grape
juice and multivitamin juice) were consumed by the consulted people. According to the
NVS, the fluid intake of water was composed of 1100 gram for men and 1119 gram for
women. Men drink 270 gram juices every day and women 232 gram. The respondents
indicated that they consumed an average of 72 ml soft drinks daily (men’s intake=103
ml and women’s intake=49 ml). On the contrary, the study of NVS presents, that the
consulted male adults consumed 224 gram soft drinks and the women 88 gram of soft
drinks. This is clearly a higher consumption of soft drinks in comparison to the current
study. Different explanations for the aberration can be expressed. It might be possible,
that the probands modified their answers in order to conform to the social requirements
or that they experienced difficulties in recalling the beverage consumption. This is a
problem that frequently appears in researches. On the other hand, the discrepancy can
be explained by the selection of the population. In this study the respondents belong to a
high educated population. Other studies (Roos, Lahelma, Virtanen, Prättälä, & Pietinen,
1998; NVS I, 2008; NVS II, 2008) detect that high educated people tend to eat and drink
Page 50
50
healthier, which also implies a consumption of soft drinks to a lesser extent. The NVS
(2008) states that the lower stratum of the population consumes soft drinks three to four
times more frequently than the upper social stratum. The age of the respondents can be
associated with a high consumption of sugared beverages, according to other researches
(Mesink, Kleiser, Richter, 2007; NVS I, 2008; NVS II, 2008). The explanation for the
divergent consumption of soft drink can barely be substantiated due to the factor age.
This study presented less overweight and obese respondents than the KIGGS study
(2003-2006). Approximately 17% of young adults in Germany have overweight and
8.5% are obese. This initiated study detected 8.5% being overweight and 3.2% suffering
from obesity. If the reported amount of sugar intake from beverages is valid, then this
can be considered as a possible explanation for the lower percentages concerning
overweight and obesity. Hence, this implies that respondents, who drank less soft drinks
featured less weight problems. The relationship between a high education and less
weight problems is supported by different studies (Danielzik & Müller, 2006; Kurth &
Schaffrath Rosario, 2007). If the selection of a high educated population is an
intermediate effect between the consumption of soft drinks and the weight cannot be
maintained surely. In addition, the possibility has to be considered, that the consulted
people did not fill their right weight in because they were ashamed of it.
7.2 Discussion of the used model
The strongest predictor of the consumption amount concerning sugared beverages was
the availability of sugared beverages at home. This assumption is also backed up by
other studies (Kassem, Lee, Modeste & Johnston, 2003; Grimm, Harnack, Story, 2004).
A direct relationship between the availability of sugared beverages and the consumption
of soft drinks can be detected for all subgroups. Although most determinants of the
Theory of Planned Behaviour correlated with the factor behaviour and with each other,
they did not always show the expected effects on the prediction of the behaviour. The
only determinant, which had a predicting power on the consumption of sugared
beverages, was the descriptive subjective norm of the friends. In particular, it is
noticeable that the intention and the behaviour had a low relationship. This implies that
no matter how strong the intention is to drink less sugared beverages or how positive the
attitude towards sugar-free beverages is, in the end the consumption is mostly predicted
by the availability of the beverages at home. This allows the assumption that the
consumption and choice of beverages is often an impulsive action without far-reaching
cognitions.
The determinants seemed to be more useful to predict the intention to drink less
sugared beverages. In this connection the attitude, the injunctive subjective norm, the
Page 51
51
descriptive subjective norm of the parents, the self-identity with regard to the health
awareness and the perceived behavioural control predicted a big proportion concerning
the variance in intention. All the regression analysis (of the whole sample and the
subgroups) showed that the intention to drink less sugared beverages was influenced by
more predictors than just the actual behaviour. This leads to the conclusion that in this
case, the Theory of Planned Behaviour was a better model to predict the intention
regarding the performance of a certain behaviour.
The Theory of Planned Behaviour had a different impact on different groups. The
group differences of every single determinant are discussed in detail in the following
description.
7.2.1 Influence of Knowledge
In this study knowledge was unrelated to the consumption of sugared beverages and to
any of the other behavioural determinants. Due to these findings, it can be assumed that
knowledge of beverages (i.e., sugar content, types of sweeteners, recommended daily
amount of fluid) had no measurable influence on the actual drinking behaviour of the
whole sample. This assumption can be supported by the outcome, that knowledge was
not associated with gender or education level. Female respondents reported drinking less
sugared beverages, but did not show a higher level of knowledge. Similarly, the student
population, which is considered older and a little bit more educated, did not show a
higher level of knowledge in comparison to the younger population. Other health related
studies also detected the weak predictable power of knowledge. Although knowledge of a
topic is a pre-condition, the effect on the behaviour is, however, low (Van der Velde &
Van der Pligt, 1990; Joseph, Montgomery, Emmons, Kessler, Ostrow, et al., 1987;
Reinher, Kersting, Chahda Andler, 2003).
Another possible explanation of the result might be that the respondents possibly
experienced problems with the completion of the questions because they were asked for
information too detailed. Thereby a lot of respondents might have filled something in
without knowing which answer is correct. This could have led to the average knowledge
index of 6.96 (highest possible points were 15). In turn, this indicates that there is a lot
of information, which the consumer has to face every day and that these information are
not presented comprehensible enough. Most of the people still have a wrong conception
of the ingredients concerning different beverages. It seems as if the young adults
followed rules of thumb, which segmented beverages in different categories. Juices were
often regarded as healthful because they are obtained from crushing fruits. In contrast,
soft drinks were perceived as beverages with a high amount of sugar. Both kinds of
beverages include sugar and are energy-dense beverages, so that it is not simply said,
which beverage is healthier concerning the sugar content. The beverage with the highest
Page 52
52
sugar amount is definitely grape juice (17 grams sugar on 100 ml), which was rated with
an average of 11.27 by the participants. The respondents estimated that soft drinks have
the highest amount of sugar (M=15.73), although these beverages contain
approximately 11 grams sugar.
Even though, the impact of knowledge on the intention and the consumption of
sugared beverages is limited, it is important to provide a clear, honest and unbiased
overview on the different beverages and their ingredients. Thereby the consumer
receives the possibility to take responsible decisions without being unaware of certain
beverages and their influence on health.
7.2.2 Influence of Attitude
In general, most respondents reported a positive attitude towards sugar-free beverages.
They agreed that sugar-free beverages are healthier, tasty and have other advantages
over sugared beverages.
Both, the bivariate correlations and the regression analyses, confirmed that attitude
is an important determinant of the intention to drink sugar-free beverages. Moreover the
determinant attitude affected the consumption of sugared beverages of some groups.
An important distinction can be applied between gender and age. Young females
have a more positive attitude towards sugar-free beverages (see table 7). This can be
related to the greater interest they possess for food, beverages and their ingredients
(NVS I, 2008; NVS II, 2008). Although no differences concerning the knowledge of
beverages were detected in this study, other studies, however, show that females pay
more attention to a healthy and balanced diet and therefore know more about this topic
in general (Allgöwer, 2000). In addition, students also showed a more positive attitude
towards sugar-free beverages (see table 13). Perhaps, younger people, in this case sixth
former, have no big health problems yet and therefore do not spend time in gathering
information about a healthy eating and drinking behaviour. The Independent-Samples T
Test showed that the students’ BMI is significantly higher than the BMI of the sixth
former (t=-3.36, p<0.001). This can imply, that sixth former have less problems
concerning their weight and thereby do not have to look on their energy intake as much
as students. Sixth former have not reached their final body height yet and therefore
cannot be compared to students without approaching this explanation really cautiously.
7.2.3 Influence of Injunctive and Descriptive Subjective Norm
A negative correlation between the injunctive subjective norm and the consumption of
sugared beverages was exhibited (-.17, p<0.01). This fact maintains the conclusion, that
the perceived attitude of the social environment influences the personal behaviour.
Although the regression analysis showed no effect of the injunctive subjective norm on
the behaviour, there does exist an effect concerning the intention to drink less sugared
Page 53
53
beverages. In combination with other determinants of the Theory of Planned Behaviour,
the injunctive subjective norm accounted for 35% of the variance concerning their
intention. In particular, the injunctive subjective norm had a predictive value for the male
and female respondent’s and the sixth former’s intention.
The injunctive subjective norm differs within the gender. Female adults perceived a
higher injunctive subjective norm than male adults (see table 7). Possibly, it is more
important for females, which impression the social environment has of them. Females
put more emphasis on their good looks and ideal body shape because they have a more
negative body-image than men (Muth & Cash, 1997; Feingold & Mazzella, 1997; Hayes &
Ross, 1987). Therefore they have the wish to appeal to their friends, their partner and
their family. The only distinction between students and sixth former, which can be made,
is that the intention of sixth former was among other things influenced by the injunctive
subjective norm. Apparently, students were less motivated to comply with the norms of
their social environment, although it can be assumed that students knew which norms
the social environment exhibits. This does not mean that the social environment had no
influence at all, but that the influence, which can be seen, is observable due to the
descriptive subjective norm.
In advance, a distinction between the descriptive subjective norm of the parents,
partners and friends was made. Every group can exert a different influence on the target
group. The figures show that parents and friends had a greater impact on the behaviour
of the respondents (.18, p<0.01, .15, p<0.05, respectively) than the partner (.02). The
regression analysis showed that the descriptive subjective norm of the parents had an
influence on the intention of the whole sample, specifically on the intention of both
genders and of the sixth former. The lack of influence within the student group can be
explained by the living situation of the students. Most students live on their own or in
flat-sharing communities. Therefore parents cannot exert such big influence on their
observable behaviour anymore. The influence of friends even predicted a part of the
variance in the consumption of sugared beverages and was therefore the only predictive
variable out of the TPB concerning the behaviour among this group. Particularly, the
descriptive subjective norm of friends loomed obviously in the consumption of sugared
beverages of male respondents and students. Friends, furthermore, had a predictive
power on student’s and male’s intention. Although there was no significant correlation
between the descriptive subjective norm concerning the partner with the behaviour or
intention, the regression analysis detected influence on the intention of male respondents
and sixth former.
A lot of studies exist, which refer to the social pressure and the affinity of conformity.
People try to behave in the same way as other people in order to reach conformity
(Solomon, 1955). If family and friends mostly drank sugared beverages, the respondents
Page 54
54
most likely tended to drink more sugared beverages, too. This expresses the group
belonging and avoids that other group members comment on or disapprove of the
respondent’s deviant behaviour. Particularly friends have a great impact on the behaviour
of the target group (Hundleby & Mercer, 1987). Young adults spend a lot of time with
people of the same age because they are similar to them and they have same interests.
They influence each other and they adopt behavioural patterns of one other (Berndt,
2008). Female participants possessed fewer friends, who drank sugared beverages daily.
It can be expected that females have more female friends and that most of the males’
respondents have friends of the same gender. Due to the fact, that girls generally drank
less sugared beverages, the difference concerning the descriptive subjective norm can be
explained. Similar to women, students stated that they have fewer friends, who drink
sugared beverages. But these few friends drinking sugared beverages had a nameable
influence on the behaviour of the students. The regression analysis demonstrates that a
part of the student’s consumption of sugared beverages can be explained by this kind of
descriptive subjective norm.
The influence of the partners had no worth mentioning effect on the behaviour of the
respondents. The correlation tended to zero. Only the intention of male and sixth former
was influenced by this determinant. They frequently observed their partners drinking
more or less sugared beverages. For the rest of the population this had no noteworthy
effect. The study showed that students drank less sugared beverages. Hence, this can
explain the fact, that the students observed their partner drinking less sugared
beverages. But female respondents consumed less sugared beverages as well. Actually, it
has to be expected that females observed their boyfriends drinking more sugared
beverages and not the other way around.
Another explanation is the development of preferences by imitation learning
(Bandura, 2001; Ellrot, 2007). Respondents, who observed their parents and friends
drinking sugar-free beverages tended to drink the same beverages. Besides that, it can
be hypothesized, that the beverages, which the parents consume, are more often
available at home and the target group is therefore confronted with these kinds of
beverages more frequently. Table 17 supports this hypothesis of availability and
consumption. Beverages were consumed more often, if they were available at home.
Having a look at the differences between the groups, it becomes apparent that male
respondents observed their parents more often drinking sugared beverages than females
(see table 7). The reason may be related to the availability of beverages at home which
had a significant correlation with the DSN of the respondent’s parents (.23, p<0.01). It
was significant that soft drinks (t=2.66, p<0.01), ice-tea (t=2.10, p<0.05) and chocolate
milk (t=2.98, p<0.01) were more often available at the males respondent’s home.
Merely the availability of smoothies was mentioned more often by female respondents
Page 55
55
(t=-2.86, p<0.01). The other beverages did not differ with regard to their availability.
These results lead to the assumption, that households, in this case especially households
of the male respondents, consumed more sugared beverages because they were more
available. It cannot be indicated clearly, whether the male’s demand for sugared
beverages led to the supply at home or the parents determined the availability at home.
A research of de Bruijn, Kremers, de Vries, van Mechelen and Brug (2007) showed that
more restrictive parenting practices are associated with a lower consumption of sugared
beverages. Girls reported an authoritative parenting style more often than boys, so that
it can be expected that this is a reason for a supply of less sugared beverages at girl’s
home (Kremers, Brug, de Vries, Engels, 2003). A less authoritative male’s home might
be intercessional for a bigger supply of sugared beverages. Nevertheless, the intention of
both genders can be predicted by the descriptive subjective norm of their parents (see
table 10 and 11).
Students stated that their parents drink more sugar-free beverages than sixth
former’s parents. This can be explained by the availability of beverages too. Soft drinks
(t=2.30, p<0.01), ice tea (t=3.18, p<0.01), chocolate milk (t=4.01, p<0.001) and milk
(t=3.06, p<0.01) were more available at the home of sixth former so that these kinds of
beverages could be consumed more often. It is quite possibly, that the availability was a
result of sixth former’s requirement for sugared beverages at home. In the majority of
the cases, students do not stay at their parents anymore and do not decide about the
beverage purchase anymore. Student’s parents might change their drinking behaviour
after the move out of their children. This relationship between availability of sugared
beverages at home and student’s consumption of beverages has to be determined in a
follow-up study. Besides the aspect of availability, the aspect of friend’s influence is
interesting to examine.
7.2.4 Influence of Perceived Behavioural Control
The respondents rated their perceived behavioural control as good and considered
themselves as being in control of drinking sugared or sugar-free beverages and being
independent of their surrounding or the situation. It can be seen positively that they see
themselves as being able to decide what they want to drink in whichever situation. But it
is rather doubtful that the answers mirror the reality because there are some situations
in which they cannot exert influence on the availability of beverages (e.g., they have no
influence on the beverage supply at their friend’s home or in a bar). The analyses
showed that the availability at home was strongly related to the behaviour of
consumption and this can be seen as an external factor, which cannot be controlled by
the respondents totally. The correlation analysis showed that the more sugared
beverages were available at home the lower was the perceived behavioural control to
Page 56
56
drink sugar-free beverages (-0.14, p<0.05). The consulted people possibly had
difficulties to project themselves in the actual position or situation or the statements
were perceived as being too abstract. It can be deduced from the figures that the
estimation of the perceived behavioural control had no influence on the consumption of
more sugared or more sugar-free beverages. Some people, who drink sugared
beverages, decided voluntarily to consume them and therefore it was redundant to ask
the question if they are able to drink less because they wouldn’t want to consume less
sugared beverages anyway.
The determinant accounted for some variance in the intention to drink sugar-free
beverages for the whole sample and to a less pronounced degree for female respondents.
Other differences cannot be detected. Maybe some respondents intended to drink less
sugared beverages but their impulsiveness and the temptation concerning the availability
of sugared beverages thwarted their plans.
7.2.5 Influence of Self-identity
The self-identity can be divided into two independent elements: on the one hand identity
concerning the health awareness and on the other hand identity concerning the
hedonism. This division can be supported by the low inter-correlation of the two
constructs. The first part correlated negatively with the consumption of sugared
beverages (-.16, p<0.01). People, who see themselves as being healthy, want to act in a
consistent way. It is important for them that their behaviour reflects the characteristics,
which they ascribe to themselves. Female respondents described themselves having a
higher health awareness than male adults (table 7). This fact complies with other studies
examining the health beliefs of men and women (Hayes & Ross, 1987; Rappoport,
Peters, Downey, McCann & Huff-Corzine, 1993) and it is consistent with the construct
attitude, which girls rated more positively than boys. The quantity of students was also
higher at the construct self-identity with reference to health awareness (table 13). The
self-identity did not account for a proportion of the variance in behaviour but it did
account for a part of intention’s variance. In particular, the determinant self-identity
predicted the intention within the student group significantly.
The second part of self-identity had no significant correlation with behaviour. But
there is a difference between females and males as well as between students and sixth
former. To a greater degree, men and students thought of themselves as being a
hedonistic consumer. It has to be asked which products are perceived as being
hedonistic. Rappoport et al. (1993) state that younger and older adults give different
ratings to food. Older adults give higher pleasure ratings towards healthy food, like rice
and fish, whereas younger adults favour snacks. With age, the consumption of products
might develop a different meaning. Students get a more positive attitude towards
Page 57
57
healthy food (in this case towards sugar-free beverages) and the context of eating gets
another meaning. They have dinner with their friends more often than sixth former who
mostly eat at home with their family. Different settings, different kinds of food and
different people give food and beverages different meanings. Perhaps this leads to a
higher valuation of consumption. Females might have problems in fulfilling their personal
pleasure without feeling remorseful. Fagerli and Wandel (1999) argue that women more
often choose food that seems to be healthy and complies with dietary guidelines. Povlsen
(1985) calls this phenomenon “women’s greater rationality” (cited in Fagerli & Wandel,
1999, p.187). They look more carefully at the ingredients of different food and beverages
and try to eat very conscientiously (Rappoport, Peters, Downey, McCann & Huff-Corzine,
1993). This control and rationality can lead to less pleasure during the consumption of
food and beverages. But hedonistic consumers may also see themselves as healthy
persons (see students). This does not have to be a contradiction in term because healthy
products can be very delicious, too.
7.2.6 Influence of Intention
The intention showed a significant negative correlation with the behaviour (-.11,
p<0.01). The respondents with a positive intention towards the reducing of consuming
sugared beverages showed a lower consumption of sugared beverages. However, the
correlation is not that strong. Other studies (e.g., Armitage & Conner, 1999b; Povey et
al., 2000) show a greater coherence between the two variables. The regression analysis
awarded that the intention had no influence on the prediction of the beverage
consumption. This can be explained due to the fact, that some people already drank less
sugared beverages and therefore they did not intend to drink even less of these
beverages. Furthermore the intention of the whole population towards the consumption
of more sugar-free beverages was very low (.11). The application of the Independent-
Samples T Test allows to draw the conclusion that neither a high intention nor a low
intention to drink less sugared beverages induced a different drinking behaviour (t=-
1.32, p>0.1).
Although there did not exist a high intention to drink less sugared beverages in any
group, females and students were more motivated to decrease their consumption of
sugared beverages (see table 7 and 11). This was consistent to the other findings, which
showed that females and students think more positively of sugar-free beverages.
According to the Theory of Planned Behaviour, all determinants have direct influence on
the intention. The analysis (table 4) showed that the constructs attitude, injunctive
subjective norm and self-identity concerning the health awareness correlated positively
and significantly with the intention.
Page 58
58
7.2.7 Influence of Previous Behaviour
In paragraph 3.2.1 it was mentioned that not the behaviour has to be the dependent
variable but the intention, which can be influenced by previous behaviour, or in other
words by habits. The regression analysis did not show any influence of the behaviour on
the intention, hence it cannot be proven which causal relationship exists. But all the
regression analyses detected, that the intention to drink less sugared beverages was
influenced by more predictors than just the actual behaviour. This leads to the conclusion
that, in this case, the Theory of Planned Behaviour is a better model for predicting the
intention to perform a certain behaviour. Changes within the variables of the Theory of
Planned Behaviour can only have an impact on the intention and not on the behaviour.
The educational drinking initiative has to bring the influence on the intention into focus
and cannot expect that changes of the consumption behaviour take place.
7.3 Limitations of the Study
Some hypotheses cannot be verified because limitations of the study occured.
The first limitation one has to make concerns the reliability of the constructs.
Although most questions and statements are based upon studies using similar topics, the
reliability of the construct self-identity and perceived behavioural control cannot be
considered high. The questions were translated into German to avoid understanding
problems. Sometimes it was difficult to translate one-to-one so that the meaning of the
items changed slightly. In future studies, the questionnaire has to be checked more
precisely and a standardized questionnaire for the German language has to be
developed. Because the two constructs did not have such big influence on the behaviour
and the intention, the lack of reliability is not that crucial.
The theoretical background showed that there is a difference between educational
classes concerning the food and beverage choice (Kußmaul, Döring, Stender, Winkler &
Keil, 1995). Less educated people drink more sugared beverages like soft drinks, than
more educated people (NVS I, 2008; NVS II, 2008). The comparison of parents’
education level in this study did not support this fact. These groups represented the
higher educated classes and as a result families of a higher socio-economic status are
overrepresented in this sample. If the study had compared pupils of secondary general
schools with pupils of grammar schools, there could have been some differences. But
because only respondents above 16 years were studied and pupils of secondary general
schools are younger, this difference was not examined.
It is always difficult to get results which are free from bias. There are a lot of
sources, which emerged from bias, and therefore it can lead to inexact completion of the
questionnaire. One source of bias concerned the shortcoming of privacy. The respondents
Page 59
59
completed the questionnaire in the presence of their classmates or fellow students. They
had the possibility to talk during the completion and to compare their answers.
Furthermore, the threat of social desirable answers existed (Hoogstraten, 2004). Perhaps
some consulted people wanted to deny socially undesirable traits because they want to
be seen in a favourable light by their friends and by the researcher (Nederhof, 1985).
Besides that, a lack of concentration was observed (Hoogstraten, 2004). In some classes
were more than 20 students and sometimes the teacher was not present during the
completion of the questionnaire. That induced to a noisy surrounding which distracted
the respondents from conscious answering. If they did not read the questions and answer
possibilities properly, they might have made mistakes easily. The survey gets more valid
if every respondent is able to fill the questionnaire in on their own. But because of
temporal, financial and areal limitations this could not be realized.
The study used a self-reported questionnaire which means that every respondent
had to answer questions concerning their own life. Some questions might have been
displeasing because they asked for private information, like the questions concerning the
weight or the educational level of their parents. Perhaps these questions invoked
dishonest answers because the respondents felt ashamed, although the questionnaires
were taken anonymously.
Moreover it is difficult to estimate the own beverage intake correctly. Drinking often
happens unconsciously and therefore the respondents did not know exactly how often
they drink which beverage and how much of it. Next to this, the human memory has
limits and cannot keep everything in mind so that the recall of consumed beverages gets
difficult (Smith, Jobe & Mingay, 1991). The study tried to avoid this bias with the help of
a Food diary. Unfortunately, only a few Food diaries returned so that they were excluded
from the study.
A final limitation of the study is the cross-sectional character, which means that the
data was only taken at one specified moment. The interpretations have to be handled
with caution because the data cannot detect clear causal relationships (Dooley, 2001). In
fact these are only assumptions and they have to be proven further on by other studies.
Page 60
60
8. Recommendations
On the basis of the study’s findings recommendations for the educational campaign can
be devised. The initiative tries to give helpful suggestions concerning the drinking
behaviour. The beverage market grows enormously and hence a great supply of food and
beverages comes along with being spoilt for choice, and therefore decision making is not
always easy. To avoid confusion and to inform the target group adequately,
recommendations can be given on the foundation of the detected figures. In general, it is
more significant to focus on the intention of the behaviour. No matter if it is the aim to
convince somebody to drink more sugared beverages or more sugar-free beverages, the
analyses demonstrated that there exists a greater impact of influence on the intention.
8.1 Methods to Increase Knowledge and Change Attitudes
The knowledge index showed that young adults know little about beverages and their
ingredients. For a conscious decision it is important to have information about the
beverages. The educational campaign should imply an objective view on the general
beverage supply. Juices and soft drinks could be compared with regard to their sugar
content. The misconceptions concerning the fluid intake and the double-tracked division
into good and bad beverages have to be disproved. With the reattribution of beverages a
new view on the beverage supply can be created and the double-tracked division can be
avoided. Therefore, information about the beverages and their characteristics are
needed.
The information has to be prepared in a compressible, individually relevant and
credible way. This means that the information is clearly expressed and includes only the
most important facts for the target group. Too much inconsiderable information cannot
be kept in mind. It is also fundamental that the messages are not too discrepant to the
target group’s experiences. People who drink very healthy cannot be persuaded that soft
drinks are not so unhealthy. In fact, they have to be convinced that the consumption of a
soft drink is also allowed from time to time in a balanced diet. Furthermore, credible
sources, containing studies or utterances from experts, have to be named. The experts
have to be accepted by and identifiable for the target group.
The initiative should provide new arguments in order to present the importance of
consuming diverse beverages. If the advantages are presented in a suitable way for the
target group, the young adults will feel more addressed and give more attention to the
information. This means, that the initiative should use the language of the young adults
and should not evoke an impression that is too cautionary. In this context, specified
Page 61
61
consequences have to be mentioned, which result from the new behaviour. Possible
rewards of the behaviour might be a stimulus to act in this new way.
8.2 Methods to Change Perceived Environmental Influence
The social environment is a complex formation, which cannot be influenced easily.
Therefore the young adult’s perception of the environment has to be changed.
Bartholmew, Parcel, Kok and Gottlieb (2006) give advices how to modify the perception
through observation of models (vicarious learning). One possibility of an observational
modelling is it to make peer expectations visible. Peer expectation is a successful
intervention method because the process of social comparison is used. People prefer to
act right and tend to turn to others in order to decide about the right course of action.
The initiative can mention in which way parents and friends value the consumption of
diverse beverages. Thereby the addressed person is able to compare him- or herself to
others and is able to comply with other’s behaviours.
The availability of beverages at home exerted a nameable influence on consumption
of beverages. Oftentimes, parents are responsible for the availability and therefore they
codetermine the modality of beverages consumed by the young adults. The initiative can
provide alternatives by showing the target group how to exert influence on the purchase.
For instance, the respondents could accompany their parents on the purchase in order to
have more control.
However, it is difficult for an educational initiative to concentrate on this aspect of
influence. It is more promising to focus on the attitude of the respondents because
individual factors are easier to influence.
8.3 Methods to Change Intentions and Habits
The influence of a written initiative exhibits limitations. Surely, information influence
attitudes and intentions but it cannot be expected that the target group changes its
behaviour completely only through information. But if beneficial recommendations are
provided, which can be easily implemented into everyday life, the chance for a change
grows.
However, these recommendations have to be clear implementation intentions, which
means that it has to be stipulated when, where and how the new intention can be
implemented. It is important that these implementation intentions are linked to specific
environmental cues (Bartholmew, Parcel, Kok & Gottlieb, 2006). It is necessary to make
the decision, in which situation and in which period of time one intends to achieve the
defined goal. It is the challenge of the initiative to show specific possibilities which can be
realized by the young adults. These possibilities have to be applicatory and situational so
Page 62
62
that cue-response links can be formed. A possible implementation intention could be the
advice to drink a glass of orange juice during breakfast every morning in order to get
already enough vitamins at the beginning of the day.
The best method to change old habits is to form new habits. This implies that the
initiative should give advices how to behave in a different way. For instance, it is of high
significance to explain the diversity of the beverage supply and to underline which
beverage can constitute a conscious substitute for another.
8.4 Differences between the Groups
Due to the fact, that females and males have a different view concerning sugar-free
beverages, they have to be addressed differently. The aspect of the sugar content plays
a major role for female adults. They are more afraid of gaining weight so that they lose
the pleasure of eating and drinking more easily. The campaign may have to include this
aspect and should demonstrate possibilities how to drink diversely without gaining
weight. In this case implementation intentions can be a successful way of changing the
behaviour as well.
The importance of conscious eating and drinking is not present in the group of the
sixth former. The initiative has to present them hip reasons for drinking diversely without
appearing too cautionary. Sixth former tend to boycott recommendations easily, if they
have the feeling to be lectured. An alternative to this, would be to direct the attention
towards the advantages of different taste experiences.
8.5 Overview on the Most Important Advices
Finally an overview on the most important recommendations is provided. The mentioned
methods in order to accomplish the main aim are approved intervention methods, which
are applied by many health promotion programs.
- The messages have to be comprehensible, individually relevant and credible.
- The initiative has to present new arguments to the target group, which need to conform
to the already existing perceptions and experiences.
- Possibilities have to be mentioned how the respondents can exert influence on the
family’s purchase of beverages.
- The initiative has to mention clear implementation intentions, which can be easily
realized in everyday life.
- New habits have to be presented in order to change the old habits successfully.
Page 63
63
8.6 Scientific Recommendations
Apart from the recommendations with regard to the content, scientific recommendations
can be outlined for follow-up studies. This study only focused on sugared and sugar-free
beverages. But there are more factors which influence the choice of beverages and are
worth considering in a new study: preservatives, artificial flavours, nutrient content and
preference or aversion for carbonated beverages.
Due to the fact, that environmental influences, especially the availability at home,
are important predictors for the consumption of beverages, it is necessary to examine
this variable more precisely. The Theory of Planned Behaviour postulates that these
variables are mediated by the perceived behavioural control. But in course of this study it
seems as if the theory is not adequate to account completely for such influences.
Furthermore, the Theory of Planned Behaviour is not capable of predicting the
behaviour, but has only the ability to predict the intention to drink sugar-free beverages.
A follow-up study should think about other models which attempt to predict the
consumption of beverages.
The cross-sectional type of the study leads to problems with causal explanations. By
means of a longitudinal study and interviews with the target group, the causal
relationships could be examined. Interviews with the target groups are a good starting
point for a follow-up study because it supports the development of a valid questionnaire.
Page 64
64
9. List of References
Allgöwer, A. (2000). Gesundheitsförderung an der Universität. Opladen: Leske + Budrich.
Ajzen, I. (1991). The theory of planned behavior. Organizational Behavior and Human
Decision Processes, 50, 179-211.
Armitage, C.J., Conner, M. (1999a). Distinguishing Perceptions of Control from Self
Efficacy: Predicting Consumption of a Low-Fat Diet Using the Theory of Planned
Behavior. Journal of Applied Social Psychology, 29 (1), 72-90.
Armitage, C.J., Conner, M. (1999b). Predictive Validity of the Theory of Planned
Behaviour: The Role of Questionnaire Format and Social Desirability. Journal of
Community & Applied Social Psychology, 9, 261-272.
Asp, E.H. (1999). Factors affecting food decisions made by individual consumers. Food
policy, 24, 287-294.
Backman, D.R., Haddad, E.H., Lee, J.W., Johnston, P.K., Hodgkin, G.E. (2002).
Psychological Predictors of Healthful Dietary Behavior in Adolescents. Journal of
Nutrition Education and Behavior, 34 (4), 184-193.
Bandini, L.G., Must, A., Cyr, H., Anderson, S.E., Spadano, J.L., Dietz, W.H. (2003).
Longitudinal changes in the accuracy of reported energy intake in girls 10-15 y of
age. The American Journal of Clinical Nutrition, 78, 480-484.
Bandura, A. (2001). Social Cognitive Theory. An Agentic Perspective. Annu. Rev.
Psychol., 52, 1-26.
Barlösius, E. (1999). Soziologie des Essens: Eine Sozial- und kulturwissenschaftliche
Einführung in die Ernährungsforschung. München: Juventa.
Bartholmew, L.K., Parcel, G.S., Kok, G., Gottlieb, N.H. (2006). Planning Health Promotion
Programs: An Intervention Mapping Approach. (2nd edition). San Francisco: Jossey-
Bass.
Berndt, T.J. (2008). Friendship and Friends’ Influence in Adolescence. Current Directions
in Psychological Science, 1 (5), 156-159.
Page 65
65
Briefel, R.R., Wilson, A., Gleason, P.M. (2009). Consumption of Low-Nutrient, Energy-
Dense Foods and Beverages at School, Home, and Other Locations among School
Lunch Participants and Nonparticipants. Journal of the American Dietetic Association,
109 (1), 79-90.
Cialdini, R.B., Rono, R.R., Kallgren, C.A. (1990). A Focus Theory of Normative Conduct:
Recycling the Concept of Norms to Reduce Littering in Public Places. Journal of
Personality and Social Psychology, 58 (6), 1015-1026.
Conner, M., Armitage, C.J. (1998). Extending the Theory of Planned Behavior: A Review
and Avenues for Further Research. Journal of Applied Social Psychology, 28 (15),
1429-1464.
Contento, I.R., Williams, S.S., Michela, J.L., Franklin, A.B. (2006). Understanding the
food choice process of adolescents in the context of family and friends. Journal of
Adolescents Health, 38, 575-582.
Damoiseaux, Dr.V., van der Molen, Prof. dr. H.T., Kok, Prof. dr. G.J. (1993).
Gezondheidsvoorlichting en gedragsverandering. Assen: Van Gorcum & Comp B.V.
Danielzik, S., Müller, M.J. (2006). Sozioökonomische Einflüsse auf Lebensstil und
Gesundheit von Kindern. Deutsche Zeitschrift für Sportmedizin, 57 (9), 214-219.
de Bruijn, G.J., Kremers, S.P.J., de Vries, H., van Mechelen, W., Brug, J. (2007).
Associatins of social-environmental and individual-level factors with adolescents soft
drink consumption: results from the SMILE study. Health Education Research, 22 (2),
227-237.
DGE (2003). Fragen und Antworten zur “Prävention von Übergewicht bei Kindern.
Retrieved February, 22, 2009 from
http://www.dge.de/modules.php?name=News&file=article&sid=351
Dooley, D. (2001). Social Research Methods. 4th edition. New Jersey: Prentice-Hall.
Duffey, K.J., Popkin, B.M. (2006). Adults with Healthier Dietary Patterns Have Healthier
Beverage Patterns. The Journal of Nutrition, 136, 2901-2907.
Page 66
66
Ellrott, T. (2003). Genuss gehört dazu – Flexibles Ernährungsverhalten macht das Leben
leichter. Moderne Ernährung Heute, 3, 1-4.
Ellrott, T. (2007). Wie Kinder essen lernen. Ernährung 2007, 1, 167-173.
Fagerli, R.A., Wandel, M. (1999). Gender Differences in Opinions and Practices with
Regard to a “Healthy Diet”. Appetite, 32, 171-190.
Farrell, A.M. Souchon, A.L., Durden, G.R. (e.a.) The Service Leadership Scale: A
Substantive Validity Test. [Electronic version]. Services Marketing, Track 15, 2328-
2335.
Feingold, A., Mazzella, R. (1997). Gender Differences in Body Image Are Increasing.
Psychological Science, 9 (3), 190-195.
Festinger, L. (1957). A theory of cognitive dissonance. Stanford University Press.
Furst, T., Connors, M., Bisogni, C.A., Sobal, J., Winter Falk, L. (1996). Food Choice: A
Conceptual Model of the Process. Appetite, 26, 247-266.
Gedrich, K. (2003). Determinants of nutritional behaviour: a multitude of levers for
succesful intervention? Appetite, 41, 231-238.
Gersovitz M., Madden J.P., Smiciklas-Wright, H. (1978). Validity of the 24-hr. dietary
recall and seven-day record for group comparisons. Journal of the American Dietetic
Association, 73, 48–55.
Gniech, G. (2002). Essen und Psyche. Über Hunger und Sattheit, Genuss und Kultur. 2.
überarbeitete Auflage. Berlin, Heidelberg, New York, Barcelona, Hongkong, London,
Mailand, Paris, Tokio: Springer.
Godin, G., Gionet, N.J. (1991). Determinants of an intention to exercise of an electric
power commission’s employees. Ergonomics, 34 (9), 1221-1230.
Gracey, D., Stanley, N., Burke, V., Corti, B., Beilin, L.J. (1996). Nutritional knowledge,
beliefs and behaviours in teenage school students. Health Education Research, 11
(2), 187-204.
Page 67
67
Green, T.J., Allen, O.B., O’Connor, D.L. (1998). Frequency Questionnaire Are Valid
Measures for Assessing the Folate and Vitamin B-12 Intakes of Women Aged 16 to
19 Years. The Journal Of Nutrition, 128 (10), 1665-1671.
Grimm, G.C., Harnack, L., Story, M. (2004). Factors associated with soft drink
consumption in school-aged children. Journal of the American Dietetic Association,
104 (8), 1244-1250.
Hayes, D., Ross, C.E. (1987). Concern with Appearance, Health Beliefs, and Eating
Habits. Journal of Health and Social Behaviour, 28 (2), 120-130.
Heseker, H., Aldolf, T., Eberhardt, W., Hartmann, S., Herwig, A., Kübler, W., Matiaske,
B., Moch, K., Nitsche, A., Schneider, R., Zipp, A. (1994). Verbundstudie
Ernährungserhebung, Risikofaktoren Analytik; Band III; Lebensmittel- und
Nährstoffaufnahme Erwachsener in der Bundesrepublik Deutschland. Niederkleen:
Wissenschaftlicher Fachverlag.
Hoogstraten, J. (2004). De machteloze onderzoeker. Voetangels en klemmen van
sociaal-wetenschappelijk onderzoek. 6e druk. Amsterdam: Boom.
Hundleby, J.D., Mercer, G.W. (1987). Family and Friends as Social Environments and
Their Relationship to Young Adolescents’ Use of Alcohol, Tobacco and Marijuana.
Journal of Marriage and the Family, 49 (1), 151-164.
Joseph, J.G., Montgomery, S.B., Emmons, C.A., Kessler, R.C., Ostrow, D.G., et al.
(1987). Magnitude and determinants of behavioral risk reduction: Longitudinal
analysis of a cohort at risk for AIDS. Psychological Health, 1, 73-96.
Kassem, N.O., Lee, J.W., Modeste, N.N., Johnston, P.K. (2003). Understanding soft drink
consumption among female adolescents using the Theory of Planned Behavior.
Health Education Research, 18 (3), 278-291.
Kremers, S.P.J., Brug, J., de Vries, H., Engels, R.C.M.E. (2003). Parenting style and
adolescent fruit consumption. Appetite 41, 43-50.
Kurth, B.-M., Bergmann, K.E., Dippelhofer, A., Hölling, H., Kamtsiuris, P., Thefeld, W.
(2002). Die Gesundheit von Kindern und Jugendlichen in Deutschland.
Bundesgesundheitsblatt-Gesundheitsforschung-Gesundheitsschutz, 45, 852-858.
Page 68
68
Kurth, B-M., Schaffrath Rosario, A. (2007). Die Verbreitung von Übergewicht und
Adipositas bei Kindern und Jugendlichen in Deutschland. Bundesgesundheitsblatt-
Gesundheitsforschung-Gesundheitsschutz, 50, 736-743.
Kußmaul, B., Döring, A., Stender, M., Winkler, G., Keil, U. (1995). Zusammenhang
zwischen Ernährungsverhalten und Bildungsstand: Ergebnisse der
Ernährungserhebung 1984/85 des MONICA-Projektes Augsburg.
Ernährungswissenschaften, 34, 177-182.
Leitzmann, C. (2004). Vollwert-Ernährung auf dem Prüfstand. Herbstakademie Ernährung
zwischen Lust und Frust. Received on October, 9, 2008 from http://stadt-
koeln.de/imperia/md/content/pdfdateien/pdf57/43.pdf#page=56
Macdiarmid, J., Blundell, J. (1998). Assessing dietary intake: Who, what and why of
under-reporting. Nutrition Research Reviews, 11, 231-253.
Mensink, G.B.M., Kleiser, C., Richter, A. (2007). Lebensmittelverzehr bei Kindern und
Jugendlichen in Deutschland. Bundesgesundheitsblatt-Gesundheitsforschung-
Gesundheitsschutz, 50, 609-623.
Moreno, L.A., Kersting, M., de Henauw, S., González-Gross, M., Sichert-Hellert, W.,
Matthys, C., Mesana, M.I., Ross, N. (2005). How to measure dietary intake and food
habits in adolescence: the European perspective. International Journal of Obesity,
29, 66-77.
Muth, J.L., Cash, T.F. (1997). Body-Image Attitudes: What Difference Does Gender
Make? Journal of Applied Social Psychology, 27 (16), 1438-1452.
Nationale Verzehrsstudie II: Ergebnisbericht Teil 1. Max Ruber-Institut Karlsruhe
2008.
Nationale Verzehrsstudie II: Ergebnisbericht Teil 2. Max Ruber-Institut Karlsruhe
2008.
Nederhof, A.J. (1985). Methods of coping with social desirability bias: a review. European
Journal of Social Psychology, 15, 263-280.
Page 69
69
Negoianu, D., Goldfarb, S. (2008). Just Add Water. Journal of American Society of
Nephrology, 19, 1041-1043.
Pierro, A., Mannetti, L., Livi, S. (2003). Self-Identity and the Theory of Planned Behavior
in the Prediction of Health Behavior and Leisure Activity. Self and Identity, 2, 47-60.
Povey, R., Conner, M., Sparks, P., James, R., Shepherd, R. (2000). The Theory of
Planned Behaviour and Healthy Eating: Examining Additive and Moderating Effects of
Social Influence Variables. Psychology and Health, 14, 991-1006.
Rappoport, L., Peters, G.R., Downey, R., McCann, T., Huff-Corzine, L. (1993). Gender
and Age Differences in Food Cognition. Appetite, 20, 33-52.
Reinher, T., Kersting, M., Chahda, C., Andler, W. (2003). Nutritional knowledge of
obese compared to non obese children. Nutrition Research, 23, 645-649.
Roos, E., Lahelma, E. Virtanen, M. Prättälä, R., Pietinen, P. (1998). Gender,
Socioeconomic Status and Family Status as Determinants of Food Behaviour. Social
Science and Medicine 46, 1519-1529.
Sichert-Hellert, W., Kersting, M., Manz, F. (2001). Fifteen year trends in water intake in
German children and adolescents: Results of the DONALD Study. Acta Paediatr, 90,
732-727.
Sirgy, M.J. (1986). Self-congruity: Toward a theory of personality and cybernetics. New
York: Praeger.
Smith, A.F., Jobe, J.B., Mingay, D.J. (1991). Retrieval from Memory of Dietary
Information. Applied Cognitive Psychology, 5, 269-296.
Solomon, E.A. (1955). Opinions and Social Pressure. Scientific America, 193 (5), 31-35.
Sparks, P., Guthrie, C.A. (1998). Self-Identity and the Theory of Planned Behavior: A
Useful Addition or an Unhelpful Artifice? Journal of Applied Social Psychology, 28
(15), 1393-1410.
Page 70
70
Sparks, P., Shepherd, R. (1992). Self-Identity and the Theory of Planned Behavior:
Assessing the Role of Identification with “Green Consumerism”. Social Psychology
Quarterly, 55 (4), 388-399.
Spector, P.E. (1992). Summated Rating Scale Construction: An Introduction. Sage
Publications, Inc.
Terry, D.J., O’Leary, J.E. (1995). The theory of planned behaviour: The effects of
perceived behavioural control and self-efficacy. British Journal of Social Psychology,
34, 199-220.
Towler, G., Shepherd, R. (1991). Modifying of Fishbein and Ajenz’s the Theory of
Reasoned Action to Predict Chip Consumption. Food Quality and Preference, 3, 37-
45.
Van der Velde, F.W., Van der Pligt, J (1990). AIDS-Related Health Behavior: Coping,
Protection Motivation, and Previous Behavior. Journal of Behavioral Medicine, 14 (5),
429-451).
Valtin, H. (2002). “Drink at least eight glasses of water a day.” Really? Is there scientific
evidence for “8 x 8”? American Journal Physiology Regulatory Integrative and
Comparative Physiology, 283, 993-1004.
Warschburger, P. (2000). Psychosoziale Belastungen und Bewältigungsanforderungen.
Klinische Kinderpsychologie, Band 3, 253.
White, K.M., Terry, D.J., Hogg, M.A. (1994). Safer sex behavior: The role of attitudes,
norms, and control factors. Journal of Applied Social Psychology, 24, 2164-2192.
Page 71
71
10. Attachment
10.1 Pre-test and Answer possibilities
1.) Welche Eigenschaften muss ein alkoholfreies Getränk haben, um von dir
gekauft zu werden?
• Taste (naturally, not to sweet, something special)
• Design
2.) Welche Motive spielen bei deiner Wahl von alkoholfreien Getränken eine Rolle?
• Value for money
• Psychological value (Coke vs. Pepsi, hip)
• Previous experiences
• Health
• Effect of beverage (adipsous, stay/get alert, refreshing)
3.) Wählst du bestimmte alkoholfreie Getränke für bestimmte Anlässe/Tageszeiten aus?
Wenn ja, welche wofür? Und wieso?
• Fit to food
• Situation
4.) Anmerkungen
Page 72
72
10.2 First version questionnaire
Umfrage zum Trinkverhalten von alkoholfreien Getränken Sehr geehrte/r Teilnehmer/in,
meistens machen wir es unterbewusst und nebenbei. Dabei ist es ein lebenswichtiges Verhalten: das Trinken. In Studien hat das Trinkverhalten bislang wenig Aufmerksamkeit bekommen und wurde unter verhaltenswissenschaftlichen Aspekten kaum betrachtet. Das soll sich mit dieser Studie nun ändern. Die Umfrage wird im Rahmen einer Abschlussarbeit an der Universität Twente
(Niederlande) durchgeführt und ausgewertet. Kernstück der Umfrage ist ein sechsseitiger
Fragebogen, den Sie in der Anlage finden. Sie benötigen für das Ausfüllen ungefähr 15
Minuten. Ihre Angaben werden natürlich vertraulich behandelt und anonym verwendet.
Die Auswertung wird keinen Rückschluss auf Ihre Person zulassen.
Desweiteren gibt es die Möglichkeit, freiwillig an einer Zusatzstudie teilzunehmen. Bei
dieser müssen Sie eine Woche lang Ihren Konsum von alkoholfreien Getränken notieren.
Als kleinen Anreiz können Sie ein persönlich ausgewertetes Trinkfazit erhalten. Sollten
Sie Interesse haben, füllen Sie die letzte Angabe des Fragebogens aus und melden Sie
sich bei der Studienleiterin.
Alle gestellten Fragen beziehen sich auf kalte, alkoholfreie Getränke, die sowohl mit als
auch ohne Kohlensäure sein können und als „light“ oder normale Variante im Supermarkt
zu kaufen sind. Alkoholische Getränke, sowie Kaffee und Tee sind nicht Bestandteil des
Fragebogens.
Lassen Sie sich beim Ausfüllen von Ihrer ersten spontanen Idee leiten. Es geht um Ihre
Meinung und da gibt es weder falsch noch richtig.
Ich bedanke mich für Ihre Unterstützung und freue mich auf Ihre Meinung!
Mit freundlichen Grüßen
Karen Dinkhoff
Page 73
73
Demografische Fragen 1. Alter:……………………………………………… 2. Geschlecht:
o Weiblich o Männlich
3. Größe:………………..cm 4. Gewicht:……………..kg
5. Ich besuche die:
o 11. Klasse o 12. Klasse o 13. Klasse
(Ich studiere seit:………………………………….) 6. Herkunftsland der Mutter:………………………………………………………………………………………. 7. Herkunftsland des Vaters:………………………………………………………………………………………..
8. Der höchste Bildungsabschluss meiner Mutter:
o Kein Abschluss o Hauptschulabschluss o Realschulabschluss o 10. Klasse Gymnasium o Fachhochschulreife o Allgemeine Hochschulreife o Abgeschlossenes Studium an der Fachhochschule o Abgeschlossenes Studium an der Universität o Weiß ich nicht
9. Der höchste Bildungsabschluss meines Vaters:
o Kein Abschluss o Hauptschulabschluss o Realschulabschluss o 10. Klasse Gymnasium o Fachhochschulreife o Allgemeine Hochschulreife o Abgeschlossenes Studium an der Fachhochschule o Abgeschlossenes Studium an der Universität o Weiß ich nicht
10. Folgende Getränke sind Zuhause verfügbar (Mehrfachnennungen möglich):
Nie Selten Ab und zu Fast immer Immer
o Biolimonade o Eistee o Apfelschorle o Soft Drinks (Cola, Fanta) o Apfelsaft o Milch o Schokomilch o Smoothies o Traubensaft
Page 74
74
o Wasser 11. Folgende Getränke sind an der Schule verfügbar (Mehrfachnennungen möglich):
Nie Selten Ab und zu Fast immer Immer
o Biolimonade o Eistee o Apfelschorle o Soft Drinks (Cola, Fanta) o Apfelsaft o Milch o Schokomilch o Smoothies o Traubensaft o Wasser
12. Wie viel Gramm Zucker befindet sich in 100 ml 4 5 6 7 8 9 10 11 12 13 14 15 16 17
- Biolimonade: - Eistee: - Apfelschorle: - Cola: - Apfelsaft: - Schokomilch: - Smoothie: - Traubensaft:
13. Wie viel Flüssigkeit sollte eine erwachsene Person, laut der Deutschen Gesellschaft für
Ernährung (DGE) täglich durch Getränke zu sich nehmen? o 0.5 Liter o 1 Liter o 1.5 Liter o 2.5 Liter o 3 Liter o 5 Liter
14. Was sind von den untengenannten Begriffen Süßstoffe? (Mehrfachnennungen möglich)
o Saccharin o Aspartam o Sorbit o Cyclamat o Isomalt
Page 75
75
Meinungsumfrage Stimme Teils, Stimme zu Stimme Stimme
überhaupt nicht zu teils voll und nicht zu ganz zu
15. Die neuen Biolimonaden sind, bezüglich ihres Zuckeranteils, die gesunde Alternative zu gewöhnlichen Limonaden.
Im Allgemeinen finde ich das Trinken von zuckerhaltigen Getränken 16. Lecker Widerlich 17. Gut Schlecht 18. Klug Unklug 19. Empfehlenswert Nicht empfehlenswert 20. Wohltuend Ekel erregend 21. Gesund Ungesund Stimme Stimme Teils, Stimme Stimme voll überhaupt nicht zu teils zu und ganz nicht zu zu
21. Ich fühle mich wohl, wenn ich zuckerfreie Getränke trinke. 22. Ich fühle mich gesünder, wenn ich zuckerfreie Getränke trinke. 23. Ich habe ein gutes Gewissen, wenn ich zuckerfreien Getränke trinken würde. 24. Zuckerfreie Getränke helfen mir, mein Gewicht zu halten. 25. Zuckerfreie Getränke sind durstlöschender als zuckerhaltige. 26. Zuckerfreie Getränke sind erfrischender als zuckerhaltige. 27. Zuckerfreie Getränke sind hipper als zuckerhaltige. 28. Zuckerfreie Getränke sind langweilige Getränke. 29. Der Spaß am Trinken vergeht mir durch zuckerfreie Getränke. 30. Zuckerfreie Getränke sind teurer als
Page 76
76
zuckerfreie. Stimme Stimme Teils, Stimme Stimme voll überhaupt nicht zu teils zu und ganz nicht zu zu 31. Zuckerfreie Getränke schmecken nicht gut. 32. Zuckerfreie Getränke helfen mir nicht meine Konzentration zu steigern. Stimme Stimme Teils, Stimme Stimme voll überhaupt nicht zu teils zu und ganz nicht zu zu 33. Meine Eltern finden es gut, wenn ich zuckerfreie Getränke trinke. 34. Meine Freunde finden es gut, wenn ich zuckerfreie Getränke trinke. 35. Mein/e Partner/in findet es gut, wenn ich zuckerfreie Getränke trinke. 36. Ich bekomme oft von meinen Freunden zuckerfreie Getränke angeboten. Stimme Stimme Teils, Stimme Stimme voll überhaupt nicht zu teils zu und ganz nicht zu zu 37. Meine Eltern trinken mehr zuckerhaltige Getränke als zuckerfreie. 38. Mein/e Partner/in trinkt mehr zuckerhaltige Getränke als zuckerfreie. 39. Wie viele deiner Freunde trinken täglich zuckerhaltige Getränke?
o Keiner o Wenige o Manche o Die meisten o Alle
Stimme Stimme Teils, Stimme Stimme voll überhaupt nicht zu teils zu und ganz nicht zu zu 40. Wenn ich es möchte, bin ich der Lage, jederzeit zuckerfreien Getränken zu trinken.
41. Ich habe viel eigene Kontrolle über das Trinken von zuckerfreien Getränken. 42. Ich finde es schwierig, immer zuckerfreie Getränke zu trinken, da ich oft nicht weiß, wie viel Zucker in den Getränken steckt. 43. Ich finde es schwierig, zuckerhaltigen Getränken zu widerstehen.
Page 77
77
Stimme Stimme Teils, Stimme Stimme voll überhaupt nicht zu teils zu und ganz nicht zu zu 51. Ich sehe mich selbst als einen gesunden Esser und Trinker. 52. Ich sehe mich selbst als jemanden, der sich mit gesunder Ernährung beschäftigt. 53. Ich sehe mich selbst als jemanden, der sich über die Folgen der Ernährung bewusst ist. 54. Ich sehe mich selbst als jemanden, der Essen und Trinken genießt. Stimme Stimme Teils, Stimme Stimme voll überhaupt nicht zu teils zu und ganz nicht zu zu 55. Ich plane in der Zukunft mehr zuckerfreie Getränke zu trinken. 56. Ich beabsichtige in der Zukunft nicht weniger zuckerhaltige Getränke zu trinken. 57. Ich möchte gerne mehr zuckerfreie Getränke zu mir nehmen. Mit Hilfe von folgender Liste möchten wir überprüfen wie oft Sie durchschnittlich welche Getränke konsumieren. Bitte füllen Sie die Liste aus und machen Sie bei jedem Getränk
Stimme Stimme Teils, Stimme Stimme voll überhaupt nicht zu teils zu und ganz nicht zu zu 44. Ich empfinde es als schwierig, in jeder Situation auf zuckerfreien Getränke zurück zu greifen. 45. Die Situation kontrolliert oft das Trinken von zuckerfreien Getränken. 46. Das Trinken von zuckerfreien Getränken ist teuer. 47. Zuckerfreie Getränke sind weniger verfügbar an der Schule / der Universität als zuckerhaltige. 48. Zuckerfreie Getränke sind häufiger verfügbar Zuhause als zuckerhaltige. 49. Es gibt Faktoren, die außerhalb meiner Kontrolle liegen, die mich am Trinken von zuckerfreien Getränken hindern 50. Die Auswahl von zuckerfreien Getränken ist begrenzter als die Auswahl von zuckerhaltigen.
Page 78
78
nur ein Kreuz. Bei jedem Getränk geht es um die Größe eines Standardglases von 250 ml. Getränk Nie 1 – 2
mal im Monat
1-mal die Woche
2 – 3 mal die Woche
4 – 6 mal die Woche
1-mal am Tag
2 – 3 mal am Tag
4 – 6 mal am Tag
7 mal oder öfter am Tag
Vollmilch (3.5% Fett)
Fettarme Milch (1.5% Fett)
Magermilch (max. 0.3% Fett)
Sojamilch Schokomilch Purer Apfelsaft Purer Traubensaft
Purer Orangensaft
Apfelsaftschorle Brauselimonade (z.B. Cola, Fanta)
Light Brauselimonade (z.B. Cola light, zero)
Biolimonade Eistee Leitungs- oder Mineralwasser
Smoothies Möchten Sie an der Zusatzstudie teilnehmen? Dann füllen Sie in untenstehendes Feld als erstes ihr Geburtsjahr, dann die letzten beiden Buchstaben ihres Vor- und Nachnamens ein: _ _ _ _ _ _ _ _ (JJJJ,VV,NN)
Page 79
79
10.3 Substantive Validity Analysis
Answers first expert
The attitude which is built on basic of knowledge, norms and values predicts how we
esteem beverages. If one emphasises taste there will be a bigger addiction to consume
beverages with taste instead of water. If it’s important to someone that the beverage is
healthy the tendency will go to drinking water.
- Zuckerfreie Getränke sind erfrischender als zuckerhaltige.
- Zuckerfreie Getränke sind durstlöschender als zuckerhaltige.
- Zuckerfreie Getränke sind langweilige Getränke.
- Zuckerfreie Getränke schmecken nicht gut.
- Zuckerfreie Getränke helfen mir nicht meine Konzentration zu steigern.
- Zuckerfreie Getränke sind hipper als zuckerhaltige.
- Der Spaß am Trinken vergeht mir durch zuckerfreie Getränke.
- Ich finde es schwierig, zuckerhaltigen Getränken zu widerstehen.
The subjective norm based on the individual perception of the social environment and on
the observation of other people. What does the environment consume? And how do they
speak about beverages? If al friends drink a soft drink the chance will be bigger that one
takes the same so that one belongs to the group (Contento, Williams, Michela & Franklin,
2006). As named above there will be made a clear distinction between injunctive and
descriptive norms in the study. On the one hand a subjective norm can be the perceived
values of important others but on the other the perception of the performance of others.
This can be two different things which can be named injunctive (ought meaning of social
norm) and descriptive (is meaning of social norm).
- Mein/e Partner/in findet es gut, wenn ich zuckerfreie Getränke trinke.
- Meine Eltern trinken mehr zuckerhaltige Getränke als zuckerfreie.
- Meine Freunde finden es gut, wenn ich zuckerfreie Getränke trinke.
- Meine Eltern finden es gut, wenn ich zuckerfreie Getränke trinke.
- Mein/e Partner/in trinkt mehr zuckerhaltige Getränke als zuckerfreie.
- Es ist oft von der Situation abhängig, ob ich zuckerfreie Getränken trinke.
- Ich bekomme oft von meinen Freunden zuckerfreie Getränke angeboten.
To what extent asses young adults themselves as being able to drink always healthy
beverages at any time. Which barriers are perceived? And is it possible to control the
barriers? This can be measured by the internal and external perceived behavioural
control. The first refers to one´s own abilities and skills and the other to the external
Page 80
80
possibilities. One can estimate that if one has the skills or facilities (e.g, the knowledge
or the money) to eat and drink healthy but the healthy foods aren´t available at a certain
place that one will fail to achieve the conducted behaviour.
- Es gibt Faktoren in meinem Umfeld, die außerhalb meiner Kontrolle liegen, die
mich am Trinken von zuckerfreien Getränken hindern
- In Anbetracht des Geldes, das mir zur Verfügung steht, kann ich mir
zuckerfreie Getränke nur selten leisten.
- Zuckerfreie Getränke sind Zuhause häufiger verfügbar als zuckerhaltige.
- Die Auswahl von zuckerfreien Getränken ist begrenzter als die Auswahl von
zuckerhaltigen.
- Zuckerfreie Getränke sind teurer als zuckerhaltige.
- Zuckerfreie Getränke sind weniger verfügbar an der Schule / der Universität
als zuckerhaltige.
- Wenn ich es möchte, bin ich der Lage, jederzeit zuckerfreie Getränke zu
trinken.
- Ich finde es schwierig, immer zuckerfreie Getränke zu trinken, da ich oft nicht
weiß, in welchen Getränken Zucker ist.
- Ich empfinde es als schwierig, in jeder Situation auf zuckerfreie Getränke
zurück zu greifen.
People hold self-concepts or self-perceptions which are characteristics that people ascribe
to themselves. In this study it will be called self-identity. Persons who think that they
have a healthy lifestyle will show a healthier drinking behaviour and mostly drink water
or tea because they want to comply with their ideals (Sirgy, 1986). The questions of this
construct based on the study of Sparks and Shepherd (1992).
- Ich fühle mich gesünder, wenn ich zuckerfreie Getränke trinke.
- Ich sehe mich selbst als jemanden, der sich über die Folgen der Ernährung
bewusst ist.
- Zuckerfreie Getränke helfen mir, mein Gewicht zu halten.
- Ich sehe mich selbst als einen gesunden Esser und Trinker.
- Ich sehe mich selbst als jemanden, der sich mit gesunder Ernährung
beschäftigt.
- Ich fühle mich wohl, wenn ich zuckerfreie Getränke trinke.
- Es liegt in meinen eigenen Händen, wie viele zuckerfreie Getränken ich trinke.
- Ich sehe mich selbst als jemanden, der Essen und Trinken genießt.
- Ich habe ein gutes Gewissen, wenn ich zuckerfreie Getränke trinke.
Page 81
81
The last construct is the intention to perform a certain behaviour. If someone takes the
plan to do something the chance that he will actually do this will be bigger than for
someone who doesn’t plan it. In the TPB the intention is the only direct link to behaviour
and is determined by all factors named above.
- Ich plane in der Zukunft mehr zuckerfreie Getränke zu trinken.
- Ich beabsichtige in der Zukunft weniger zuckerhaltige Getränke zu trinken.
- Ich möchte gerne mehr zuckerfreie Getränke zu mir nehmen.
Answers second expert
The attitude which is built on basic of knowledge, norms and values predicts how we
esteem beverages. If one emphasises taste there will be a bigger addiction to consume
beverages with taste instead of water. If it’s important to someone that the beverage is
healthy the tendency will go to drinking water.
- Zuckerfreie Getränke sind erfrischender als zuckerhaltige.
- Zuckerfreie Getränke sind durstlöschender als zuckerhaltige.
- Zuckerfreie Getränke sind langweilige Getränke.
- Zuckerfreie Getränke sind teurer als zuckerhaltige.
- Zuckerfreie Getränke schmecken nicht gut.
- Zuckerfreie Getränke sind hipper als zuckerhaltige.
- Der Spaß am Trinken vergeht mir durch zuckerfreie Getränke.
The subjective norm based on the individual perception of the social environment and on
the observation of other people. What does the environment consume? And how do they
speak about beverages? If al friends drink a soft drink the chance will be bigger that one
takes the same so that one belongs to the group (Contento, Williams, Michela & Franklin,
2006). As named above there will be made a clear distinction between injunctive and
descriptive norms in the study. On the one hand a subjective norm can be the perceived
values of important others but on the other the perception of the performance of others.
This can be two different things which can be named injunctive (ought meaning of social
norm) and descriptive (is meaning of social norm).
- Mein/e Partner/in findet es gut, wenn ich zuckerfreie Getränke trinke.
- Meine Eltern trinken mehr zuckerhaltige Getränke als zuckerfreie.
- Meine Freunde finden es gut, wenn ich zuckerfreie Getränke trinke.
- Meine Eltern finden es gut, wenn ich zuckerfreie Getränke trinke.
- Mein/e Partner/in trinkt mehr zuckerhaltige Getränke als zuckerfreie.
- Ich bekomme oft von meinen Freunden zuckerfreie Getränke angeboten.
Page 82
82
- Zuckerfreie Getränke sind weniger verfügbar an der Schule / der Universität
als zuckerhaltige.
- Zuckerfreie Getränke sind Zuhause häufiger verfügbar als zuckerhaltige.
- Die Auswahl von zuckerfreien Getränken ist begrenzter als die Auswahl von
zuckerhaltigen.
To what extent asses young adults themselves as being able to drink always healthy
beverages at any time. Which barriers are perceived? And is it possible to control the
barriers? This can be measured by the internal and external perceived behavioural
control. The first refers to one´s own abilities and skills and the other to the external
possibilities. One can estimate that if one has the skills or facilities (e.g, the knowledge
or the money) to eat and drink healthy but the healthy foods aren´t available at a certain
place that one will fail to achieve the conducted behaviour.
- Es gibt Faktoren in meinem Umfeld, die außerhalb meiner Kontrolle liegen, die
mich am Trinken von zuckerfreien Getränken hindern
- In Anbetracht des Geldes, das mir zur Verfügung steht, kann ich mir
zuckerfreie Getränke nur selten leisten.
- Wenn ich es möchte, bin ich der Lage, jederzeit zuckerfreie Getränke zu
trinken.
- Ich finde es schwierig, immer zuckerfreie Getränke zu trinken, da ich oft nicht
weiß, in welchen Getränken Zucker ist.
- Ich empfinde es als schwierig, in jeder Situation auf zuckerfreie Getränke
zurück zu greifen.
- Ich finde es schwierig, zuckerhaltigen Getränken zu widerstehen.
- Es liegt in meinen eigenen Händen, wie viele zuckerfreie Getränke ich trinke.
- Es ist oft von der Situation abhängig, ob ich zuckerfreie Getränke trinke.
People hold self-concepts or self-perceptions which are characteristics that people ascribe
to themselves. In this study it will be called self-identity. Persons who think that they
have a healthy lifestyle will show a healthier drinking behaviour and mostly drink water
or tea because they want to comply with their ideals (Sirgy, 1986). The questions of this
construct based on the study of Sparks and Shepherd (1992).
- Ich fühle mich gesünder, wenn ich zuckerfreie Getränke trinke.
- Ich sehe mich selbst als jemanden, der sich über die Folgen der Ernährung
bewusst ist.
- Ich sehe mich selbst als einen gesunden Esser und Trinker.
- Ich sehe mich selbst als jemanden, der sich mit gesunder Ernährung
beschäftigt.
Page 83
83
- Ich fühle mich wohl, wenn ich zuckerfreie Getränke trinke.
- Ich sehe mich selbst als jemanden, der Essen und Trinken genießt.
- Ich habe ein gutes Gewissen, wenn ich zuckerfreie Getränke trinke.
-
The last construct is the intention to perform a certain behaviour. If someone takes the
plan to do something the chance that he will actually do this will be bigger than for
someone who doesn’t plan it. In the TPB the intention is the only direct link to behaviour
and is determined by all factors named above.
- Ich plane in der Zukunft mehr zuckerfreie Getränke zu trinken.
- Ich beabsichtige in der Zukunft weniger zuckerhaltige Getränke zu trinken.
- Ich möchte gerne mehr zuckerfreie Getränke zu mir nehmen.
- Zuckerfreie Getränke helfen mir, mein Gewicht zu halten.
- Zuckerfreie Getränke helfen mir nicht meine Konzentration zu steigern.
Page 84
84
10.4 Final Version Questionnaire
Umfrage zum Trinkverhalten von alkoholfreien Getränken Sehr geehrte/r Teilnehmer/in,
meistens machen wir es unbewusst und nebenbei. Dabei ist es ein lebenswichtiges Verhalten: das Trinken. In Studien hat das Trinkverhalten bislang wenig Aufmerksamkeit bekommen und wurde unter verhaltenswissenschaftlichen Aspekten kaum betrachtet. Das soll sich mit dieser Studie nun ändern. Die Umfrage wird im Rahmen einer Abschlussarbeit an der Universität Twente (Niederlande) durchgeführt und ausgewertet. Sie benötigen für das Ausfüllen des Fragebogens ungefähr 10 Minuten. Ihre Angaben werden natürlich vertraulich behandelt und anonym verwendet. Des Weiteren gibt es die Möglichkeit, freiwillig an einer Zusatzstudie teilzunehmen. Bei dieser bitten wir Sie, drei Tage lang Ihren Konsum von alkoholfreien Getränken zu notieren. Als kleinen Anreiz können Sie ein persönlich ausgewertetes Trinkfazit erhalten. Sollten Sie Interesse haben, füllen Sie die letzte Angabe des Fragebogens aus und melden Sie sich bei der Studienleiterin. Alle gestellten Fragen beziehen sich auf kalte, alkoholfreie Getränke, die sowohl mit als auch ohne Kohlensäure sein können und als zuckerfreie oder zuckerhaltige Variante im Supermarkt zu kaufen sind. Unter zuckerfreie Getränke fallen Wasser und Lightlimonaden. Zuckerhaltige Getränke sind Säfte, Limonaden, Schorlen und Milchgetränke. Alkoholische Getränke sowie Kaffee und Tee sind nicht Bestandteil des Fragebogens. Lassen Sie sich beim Ausfüllen von Ihrer ersten spontanen Idee leiten und erschrecken Sie nicht bei den Wissensfragen. Ich bedanke mich für Ihre Unterstützung und freue mich auf Ihre Meinung! Mit freundlichen Grüßen Karen Dinkhoff
Page 85
85
Demografische Fragen 1. Alter:……………………………………………… 2. Geschlecht:
o Weiblich o Männlich
3. Größe:………………cm 4. Gewicht:……………kg
5. Ich besuche die: (Ich studiere seit:…………………………………………..
o 11. Klasse Studiengang:………………………………………………….) o 12. Klasse o 13. Klasse
6. Herkunftsland der Mutter:……………………………………………………………………………………… 7. Herkunftsland des Vaters:………………………………………………………………………………………
8. Der höchste Bildungsabschluss meiner Mutter:
o Kein Abschluss o Hauptschulabschluss o Realschulabschluss o 10. Klasse Gymnasium o Fachhochschulreife o Allgemeine Hochschulreife o Abgeschlossenes Studium an der Fachhochschule o Abgeschlossenes Studium an der Universität o Weiß ich nicht
9. Der höchste Bildungsabschluss meines Vaters:
o Kein Abschluss o Hauptschulabschluss o Realschulabschluss o 10. Klasse Gymnasium o Fachhochschulreife o Allgemeine Hochschulreife o Abgeschlossenes Studium an der Fachhochschule o Abgeschlossenes Studium an der Universität o Weiß ich nicht
10. Folgende Getränke sind Zuhause bei meinen Eltern verfügbar:
Nie Selten Ab und zu Fast immer Immer
o Biolimonade o Eistee o Apfelschorle o Softdrinks (z.B. Cola, Fanta) o Apfelsaft o Milch o Schokomilch o Smoothies o Orangensaft o Mineralwasser
Page 86
86
11. Folgende Getränke sind an der Schule verfügbar: Nie Selten Ab und zu Fast immer Immer
o Biolimonade o Eistee o Apfelschorle o Softdrinks (z.B. Cola, Fanta) o Apfelsaft o Milch o Schokomilch o Smoothies o Orangensaft o Mineralwasser
12. Wie viel Gramm Zucker befinden sich in 100 ml (Angaben beziehen sich auf die
gezuckerte Version des Getränks) 4g 5g 6g 7g 8g 9g 10g 11g 12g 13g 14g 15g 16g 17g
- Biolimonade: - Eistee: - Apfelschorle: - Cola: - Apfelsaft: - Schokomilch: - Smoothie: - Traubensaft:
13. Wie viel Flüssigkeit sollte eine erwachsene Person, laut der Deutschen Gesellschaft für
Ernährung (DGE), täglich durch Getränke zu sich nehmen? o 0.5 Liter o 1 Liter o 1.5 Liter o 2.5 Liter o 3 Liter o 5 Liter
14. Was sind von den untengenannten Begriffen Süßstoffe? (Mehrfachnennungen möglich)
o Saccharin o Aspartam o Sorbit o Cyclamat o Isomalt
Page 87
87
Stimme Stimme Teils, Stimme zu Stimme
überhaupt nicht zu teils voll und nicht zu ganz zu
15. Die neuen Biolimonaden sind, bezüglich ihres Zuckeranteils, die gesunde Alternative zu gewöhnlichen Limonaden.
Im Allgemeinen finde ich das Trinken von zuckerhaltigen Getränken 16. Lecker Widerlich 17. Gut Schlecht 18. Klug Unklug 19. Empfehlenswert Nicht empfehlenswert 20. Wohltuend Schädlich 21. Gesund Ungesund Stimme Stimme Teils, Stimme Stimme voll überhaupt nicht zu teils zu und ganz nicht zu zu
22. Ich fühle mich wohl, wenn ich zuckerfreie Getränke trinke. 23. Ich fühle mich gesünder, wenn ich zuckerfreie Getränke trinke. 24. Ich habe ein gutes Gewissen, wenn ich zuckerfreie Getränke trinke. 25. Zuckerfreie Getränke helfen mir, mein Gewicht zu halten. 26. Zuckerfreie Getränke sind durstlöschender als zuckerhaltige. 27. Zuckerfreie Getränke sind erfrischender als zuckerhaltige. 28. Zuckerfreie Getränke sind hipper als zuckerhaltige. 29. Bei zuckerfreie Getränken ist es mir wichtiger, dass ich ein Markengetränk wähle als bei zuckerhaltigen 30. Zuckerfreie Getränke sind langweilige Getränke. 31. Der Spaß am Trinken vergeht mir durch zuckerfreie Getränke.
Page 88
88
Stimme Stimme Teils, Stimme Stimme voll überhaupt nicht zu teils zu und ganz nicht zu zu 32. Zuckerfreie Getränke sind teurer als zuckerhaltige.
33. Zuckerfreie Getränke schmecken nicht gut. 34. Zuckerfreie Getränke helfen mir nicht meine Konzentration zu steigern. Stimme Stimme Teils, Stimme Stimme voll überhaupt nicht zu teils zu und ganz nicht zu zu 35. Meine Eltern finden es gut, wenn ich zuckerfreie Getränke trinke. 36. Meine Freunde finden es gut, wenn ich zuckerfreie Getränke trinke. 37. Mein/e Partner/in findet es gut, wenn ich zuckerfreie Getränke trinke. 38. Ich bekomme oft von meinen Freunden zuckerfreie Getränke angeboten. Stimme Stimme Teils, Stimme Stimme voll überhaupt nicht zu teils zu und ganz nicht zu zu 39. Meine Eltern trinken mehr zuckerhaltige Getränke als zuckerfreie. 40. Mein/e Partner/in trinkt mehr zuckerhaltige Getränke als zuckerfreie. 41. Wie viele deiner Freunde trinken täglich zuckerhaltige Getränke?
o Keiner o Wenige o Die Hälfte o Die meisten o Alle
Stimme Stimme Teils, Stimme Stimme voll überhaupt nicht zu teils zu und ganz nicht zu zu 42. Wenn ich es möchte, bin ich der Lage, jederzeit zuckerfreie Getränke zu trinken.
43. Es liegt in meinen eigenen Händen, wie viele zuckerfreie Getränken ich trinke. 44. Ich finde es schwierig, immer zuckerfreie Getränke zu trinken, da ich oft nicht weiß, in welchen Getränken Zucker ist.
Page 89
89
Stimme Stimme Teils, Stimme Stimme voll überhaupt nicht zu teils zu und ganz nicht zu zu 45. Ich finde es schwierig, zuckerhaltigen Getränken zu widerstehen. Stimme Stimme Teils, Stimme Stimme voll überhaupt nicht zu teils zu und ganz nicht zu zu 46. Ich empfinde es als schwierig, in jeder Situation auf zuckerfreie Getränke zurück zu greifen. 47. Es ist oft von der Situation abhängig, ob ich zuckerfreie Getränke trinke. 48. In Anbetracht des Geldes, das mir zur Verfügung steht, kann ich mir zuckerfreie Getränke nur selten leisten. 49. Zuckerfreie Getränke sind weniger verfügbar an der Schule als zuckerhaltige. 50. Zuckerfreie Getränke sind Zuhause häufiger verfügbar als zuckerhaltige. 51. Es gibt Faktoren in meinem Umfeld, die ich nicht beeinflussen kann und mich deshalb am Trinken von zuckerfreien Getränken hindern. 52. Die Auswahl von zuckerfreien Getränken ist begrenzter als die Auswahl von zuckerhaltigen. Stimme Stimme Teils, Stimme Stimme voll überhaupt nicht zu teils zu und ganz nicht zu zu 53. Ich sehe mich selbst als einen gesunden Esser und Trinker. 54. Ich sehe mich selbst als jemanden, der sich mit gesunder Ernährung beschäftigt. 55. Ich sehe mich selbst als jemanden, der sich über die Folgen der Ernährung bewusst ist. 56. Ich sehe mich selbst als jemanden, der Essen und Trinken genießt. Stimme Stimme Teils, Stimme Stimme voll überhaupt nicht zu teils zu und ganz nicht zu zu 57. Ich plane in der Zukunft mehr zuckerfreie Getränke zu trinken.
Page 90
90
Stimme Stimme Teils, Stimme Stimme voll überhaupt nicht zu teils zu und ganz nicht zu zu 58. Ich beabsichtige in der Zukunft weniger zuckerhaltige Getränke zu trinken. 59. Ich möchte gerne mehr zuckerfreie Getränke zu mir nehmen. Mit Hilfe von folgender Liste möchten wir überprüfen, wie oft Sie durchschnittlich welche Getränke konsumieren. Bitte füllen Sie die Liste aus und machen Sie bei jedem Getränk nur ein Kreuz. Bei jedem Getränk geht es um die Größe eines Standardglases von 250 ml. Getränk Nie 1 – 2
mal im Monat
1-mal die Woche
2 – 3 mal die Woche
4 – 6 mal die Woche
1-mal am Tag
2 – 3 mal am Tag
4 – 6 mal am Tag
7 mal oder öfter am Tag
Vollmilch (3.5% Fett)
Fettarme Milch (1.5% Fett)
Magermilch/ Buttermilch (max. 0.3% Fett)
Joghurtdrinks
Sojamilch Schokomilch Purer Apfelsaft Purer Traubensaft
Purer Orangensaft
Multivitaminsaft
Gemüsesaft
Apfelsaftschorle Brauselimonade (z.B. Cola, Fanta)
Light Brauselimonade (z.B. Cola light, zero)
Biolimonade Eistee Leitungs- oder Mineralwasser
Smoothies Möchten Sie an der Zusatzstudie teilnehmen? Dann füllen Sie in untenstehendes Feld als erstes Ihr Geburtsjahr, dann die letzten beiden Buchstaben Ihres Vor- und Nachnamens ein. Dies ist Ihr persönlicher Code, der es ermöglicht, Ihre Anonymität zu erhalten und die Zusatzstudie an diesen Fragebogen koppeln zu können. _ _ _ _ _ _ _ _ (JJJJ,VV,NN)
Page 91
91
10.5 Additional analysis Factor analysis SI Variable SI Initial Eigenvalues Extraction Sum of Squared Loadings Total % of Variance Total % of Variance 1 1.73 43.24 1.73 43.24 2 1.04 25.87 1.04 25.87 3 0.77 19.12 4 0.47 11.77
Component matrix SI Item Comp 1 Comp 2 1 .792 2 .810 3 .655 4 .964
Factor analysis PBC Variable PBC Initial Eigenvalues Extraction Sum of Squared Loadings Total % of Variance Total % of Variance 1 2.35 22,52 2.25 22.52 2 1.49 14.93 1.49 37.46 3 1.09 10.93 1.09 48.38 4 1.00 10.04 1.00 58.42 5 .88 8.83 6 .81 8.10 7 .70 7.02 8 .66 6.59 9 .56 5.63 10 .54 5.39
Component matrix PBC Item Comp 1 Comp 2 Comp 3 Comp 4 1 .562 2 .485 -.506 3 .451 4 .412 -.503 5 .435 6 .598 7 .662 8 .496 .513 9 .590 10 .426 .472
Page 92
92
Excluded Table (low p): Stepwise Regression Analysis for Predicting the Consumption of
Sugared Beverages of Male Respondents
Block 1
Beta
p
Block 2
Beta
p
Block 3
Beta
p
Age -.05 .615 -.02 .867 -.04 .701
Education level mother -.09 .415 -.14 .222 -.18 .133
Education level father .22 .062 .28 .017 .33 .007
BMI .03 .770 .04 .676 .07 .543
Availability at home .26 .011 .33 .004
Availability at
school/university
.01 .902 -.02 .848
Attitude .14 .306
ISN -.14 .278
DSN parents .06 .617
DSN partner -.01 .939
DSN friends -.25 .020
PBC -.01 .895
SI (health) -.06 .617
Intention -.05 .704
R .20 .32 .43
R² .04 .11 .18
F (df=4)=1.01 .405 (df=6)=1.92 .086 (df=14)=1.41 .161
ΔR² .07 .08
ΔF 3.62 .031 1.04 .412
Independent-Samples T Test: Low intenders vs. high intenders (no significant difference)
Education level N Mean Std. D. t
Consumption of
sugared
beverages
High intenders
Low intenders
102
238
6.11
72.76
6.45
9.41
-1.32