91
Predicting the Impact of Global Climatic Change on Land Use Patterns in Europe Andy Turner Centre for Computational Geography University of Leeds, Leeds, UK
| Date post: | 16-Dec-2015 |
| Category: |
Documents |
| Upload: | martha-lawson |
| View: | 217 times |
| Download: | 1 times |

Predicting the Impact of Global Climatic Change on Land Use Patterns in
EuropeAndy Turner
Centre for Computational Geography
University of Leeds, Leeds, UK

Thanks are due to:
• Stan Openshaw• Ian Turton• Tim Perree

Contents• Why model agricultural land use change
for 75 years hence?
• Existing models
• A neurocomputing approach
• Assembling the data
• Running the models
• Results
• What next?

Why?• It is an important subject
• It potentially affects many millions
• It emphasizes what little we know
• It provides a first attempt that others will have to beat later
• Someone had to try and do it!
• It provides a good example of how GIS can be used to model environmental systems showing both the strengths and weaknesses

Some Background
• This research was part of the EU Medalus III project
• Medalus = {Mediterranean Desertification and Land Use}
• Wide range of environmental research topics mainly concerned with modelling hill slope erosion, hydrological systems, water management, ecosystems, and climatic change in semi-arid Mediterranean climate zones
• Study Area = The Mediterranean climate region of the EU
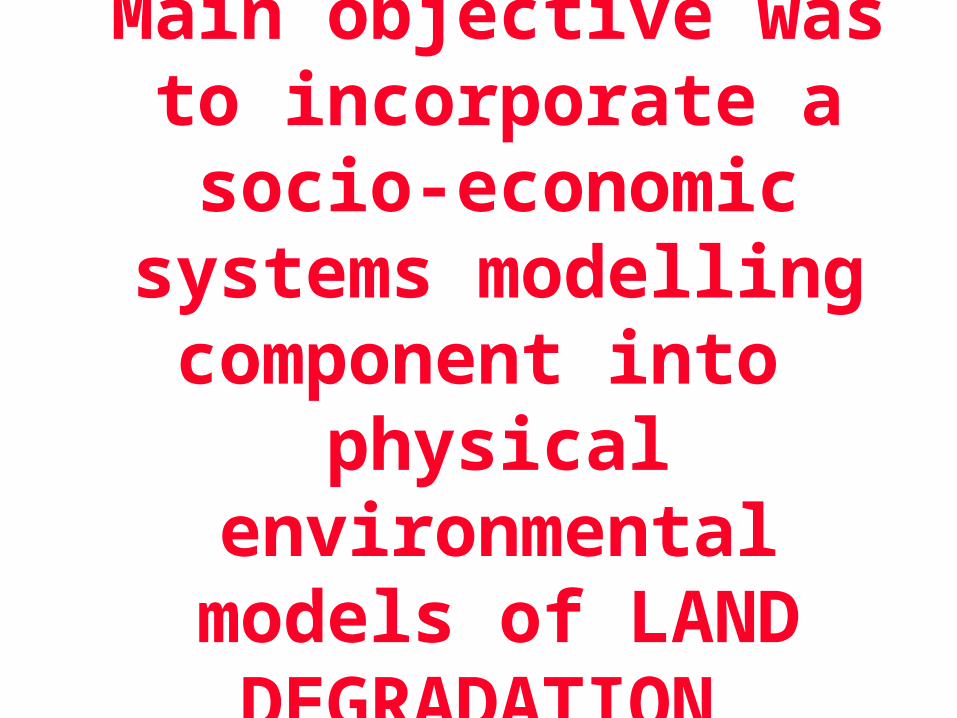
Main objective was to incorporate a socio-economic systems
modelling component into physical environmental
models of LAND DEGRADATION
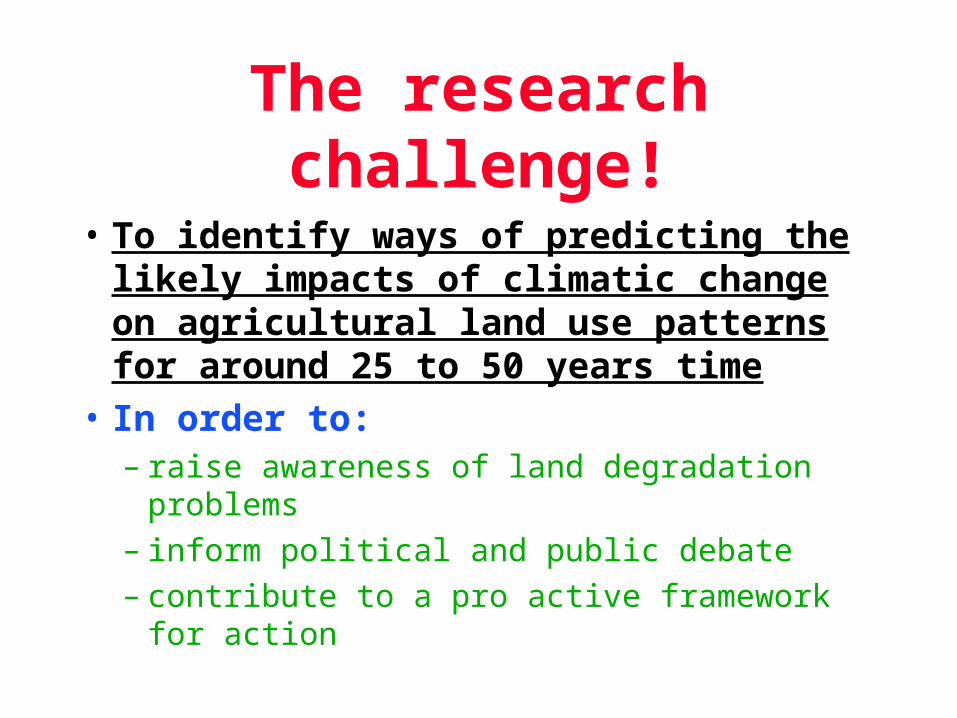
The research challenge!
• To identify ways of predicting the likely impacts of climatic change on agricultural land use patterns for around 25 to 50 years time
• In order to:– raise awareness of land degradation problems– inform political and public debate– contribute to a pro active framework for action

The hardness of this challenge should not be
under-estimated!
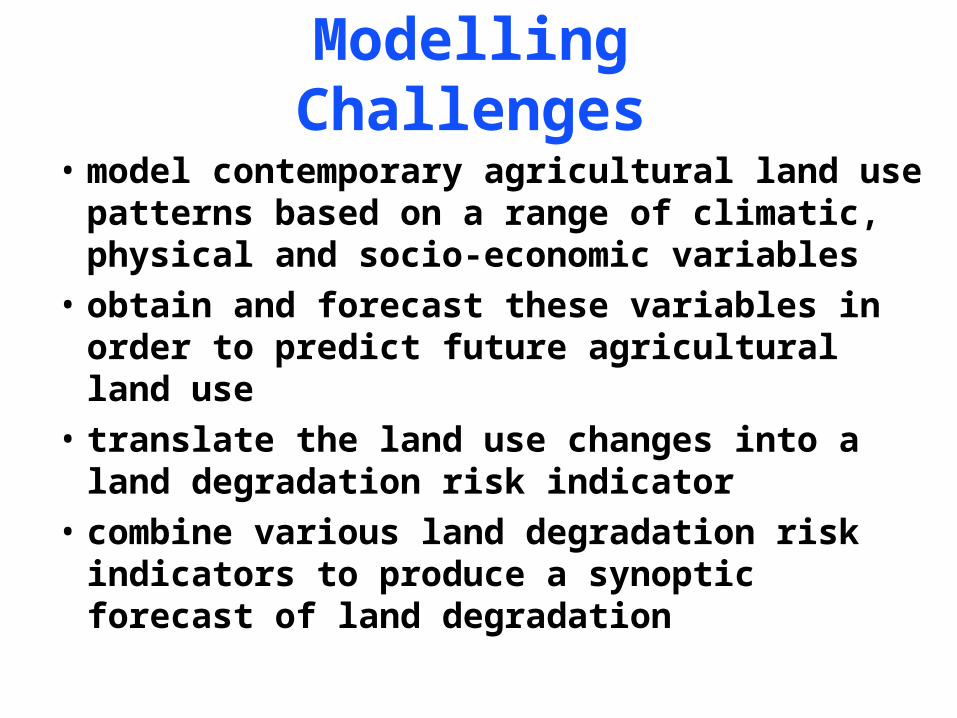
Modelling Challenges
• model contemporary agricultural land use patterns based on a range of climatic, physical and socio-economic variables
• obtain and forecast these variables in order to predict future agricultural land use
• translate the land use changes into a land degradation risk indicator
• combine various land degradation risk indicators to produce a synoptic forecast of land degradation
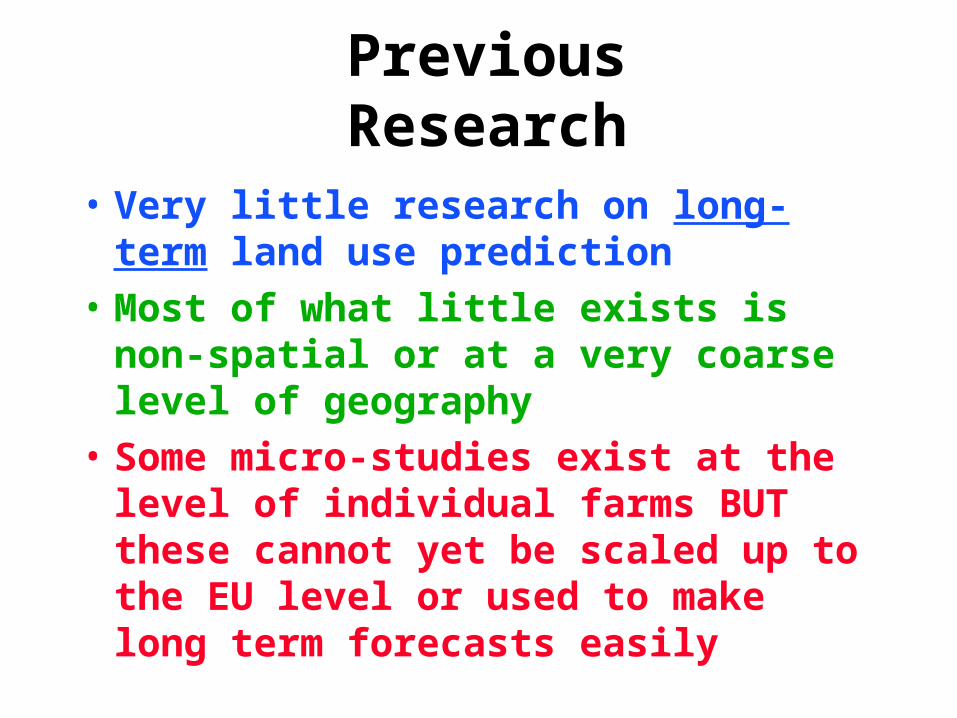
Previous Research
• Very little research on long-term land use prediction
• Most of what little exists is non-spatial or at a very coarse level of geography
• Some micro-studies exist at the level of individual farms BUT these cannot yet be scaled up to the EU level or used to make long term forecasts easily
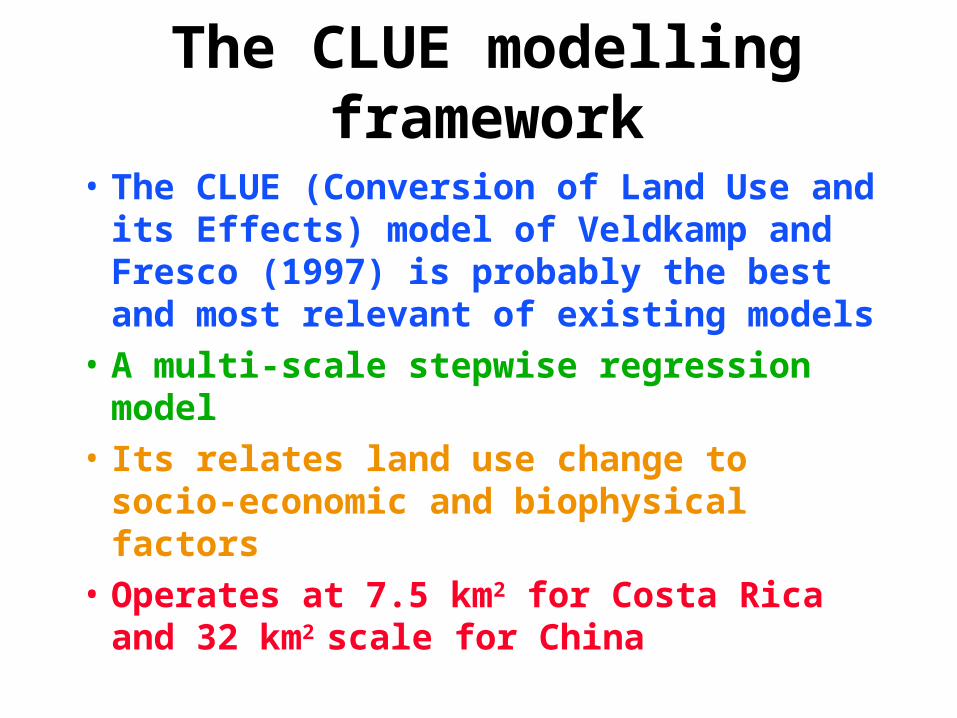
The CLUE modelling framework
• The CLUE (Conversion of Land Use and its Effects) model of Veldkamp and Fresco (1997) is probably the best and most relevant of existing models
• A multi-scale stepwise regression model
• Its relates land use change to socio-economic and biophysical factors
• Operates at 7.5 km2 for Costa Rica and 32 km2 scale for China

CLUE Model
• linear
• It is run recursively
• It produces nice computer movies
• Its runs at too coarse a scale to be useful
• It will probably have dreadful error propagation properties

Modelling Design Checklist Highest possible level of spatial resolution Consistency in coverage and application Make forecasts for 75 years hence Link with other Medalus III Projects and models Incorporate the principal driving factors and
processes Produce outputs that can be instantly understood
by “Joe Public” Provide a framework that can be refined later

Building a Synoptic Prediction System (SPS)
• Objective was to build a GIS based computer modelling system able to link changes in the climate with associated physical and socio-economic changes in order to make synoptic land degradation forecasts for the entire Mediterranean climate region of the EU
• It was to function in a manner similar to a long-term weather forecast

SPS Modelling• A model was required to link:
– climate (temperature and rainfall)– soil characteristics (permeability, texture,
fertility, parent material)– biomass– elevation– population densities
• to predict current and future patterns of agricultural land use

Synoptic Prediction System
NOW
FUTURE
IMPACT LanduseLanduse
population
Socio-economic
Physical
climate
heightbiomass
soil
Physical
climate
heightbiomass
soil
population
Socio-economicClassification

SPS is limited by the following:available data from other Medalus teams and
elsewherealmost complete absence of space-time data
serieslack of knowledge of all the principal
mechanisms thought to be at workthe need to incorporate a broad range of
inputs to ensure plausibilitythe necessity of working at a fine level of
spatial detail
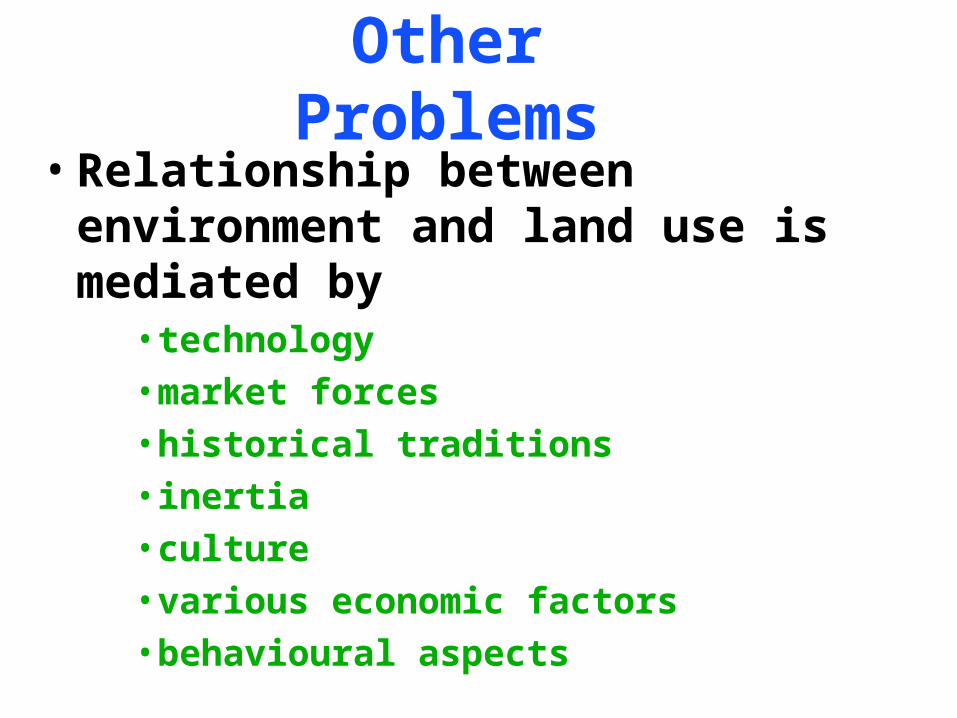
Other Problems• Relationship between environment and
land use is mediated by• technology• market forces• historical traditions• inertia • culture• various economic factors• behavioural aspects

but

but

there is little that can be done about any of this!

The problem was
HOW to
OPERATIONALISE this schematic model in the best
possible way
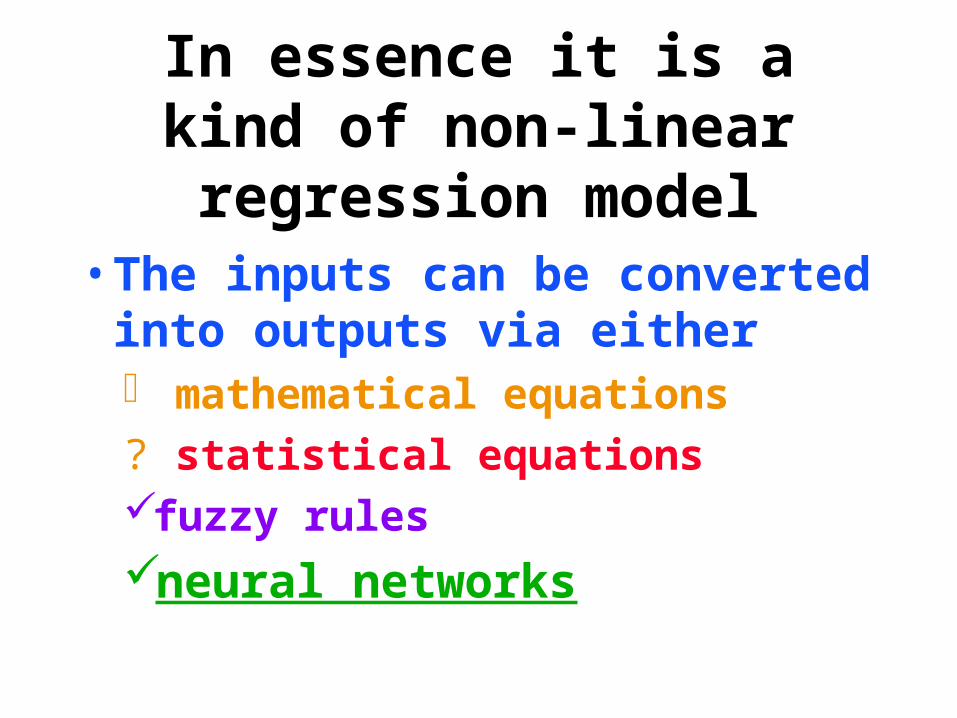
In essence it is a kind of non-linear regression model
• The inputs can be converted into outputs via either mathematical equations
? statistical equations fuzzy rules
neural networks

SPS is based on a
neurocomputing approach

Do not
PANIC!the basic idea is very simple
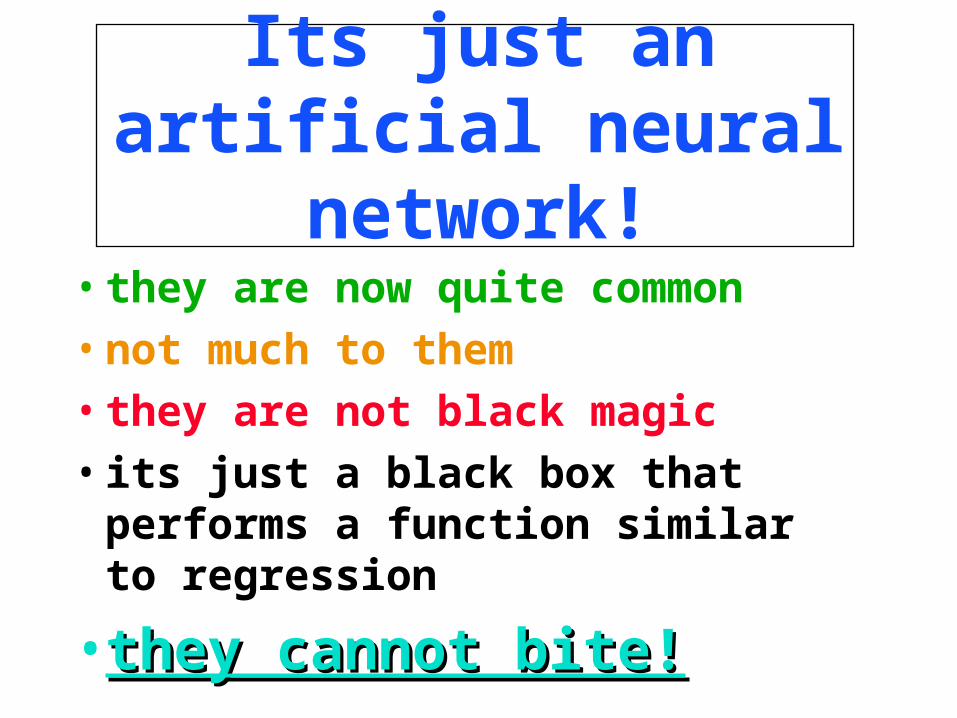
Its just an artificial neural network!
• they are now quite common
• not much to them
• they are not black magic
• its just a black box that performs a function similar to regression
• they cannot bite!they cannot bite!
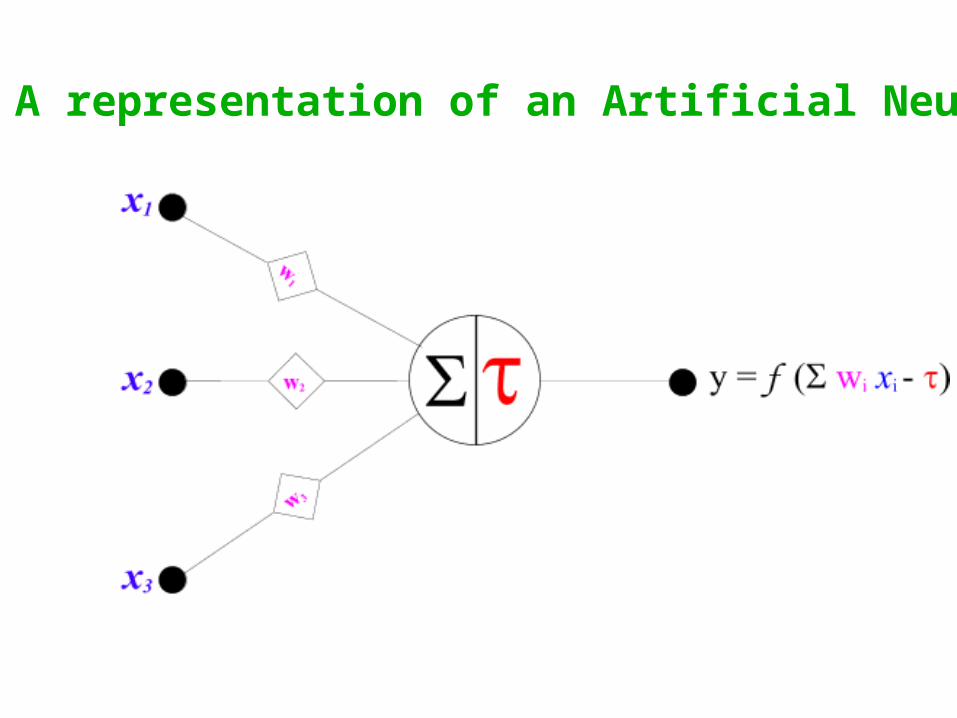
A representation of an Artificial Neuron

Input Layer
Hidden Layer
Output Layer
A representation of a 6x4x1 simple network

Neural Networks Offer several advantages
they are universal approximatorsthey are equation freethey are highly non-linearthey are robust and noise resistantprobably offer the best levels of
performancethey can model hard problemswidely applicable modellers

Neural HeadachesNeural HeadachesThey are essentially black box modelsTraining can be problematic
over-traininglength runs
Choice of Architecture is subjective with an element of black art or luck or intuition
Often a presumption of prejudice against because of the lack of process understanding

Some Key Assumptions
• the training data were representative
• the predictor variables were appropriate
• the effects of missing variables were implicit in the available variables
• the neural net architectures were reasonable
• that there is a systematic relationship between environmental variables and land use that is modellable

Building a SPS
• Step 1. Assemble the data for a common EU wide geography for– present day
• Step 2. Obtain or make forecasts for these data for– 75 years time
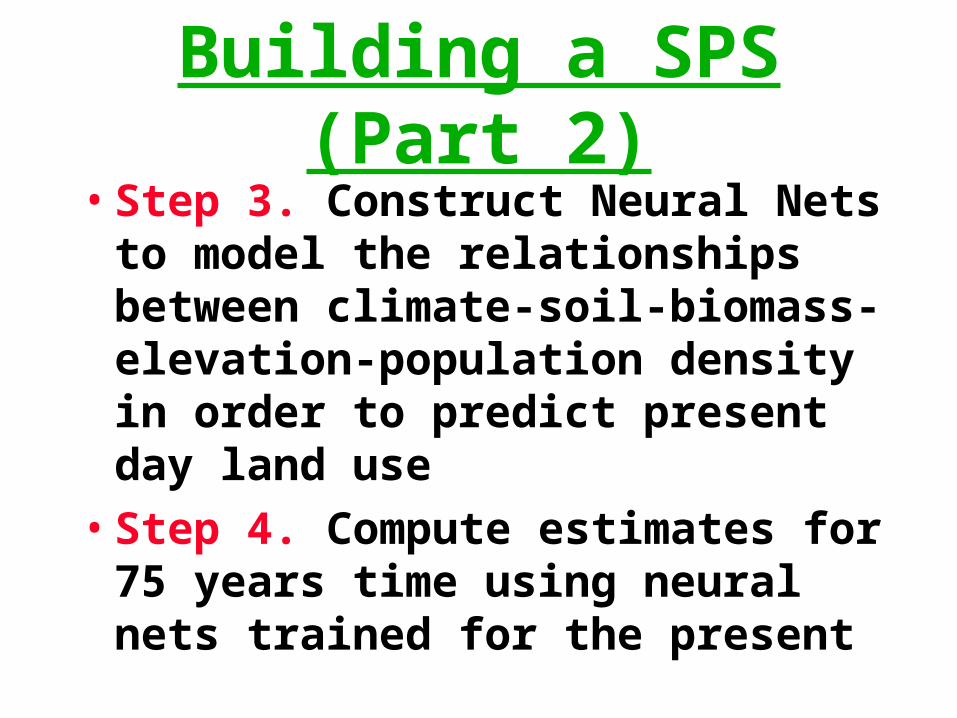
Building a SPS (Part 2)• Step 3. Construct Neural Nets to
model the relationships between climate-soil-biomass-elevation-population density in order to predict present day land use
• Step 4. Compute estimates for 75 years time using neural nets trained for the present
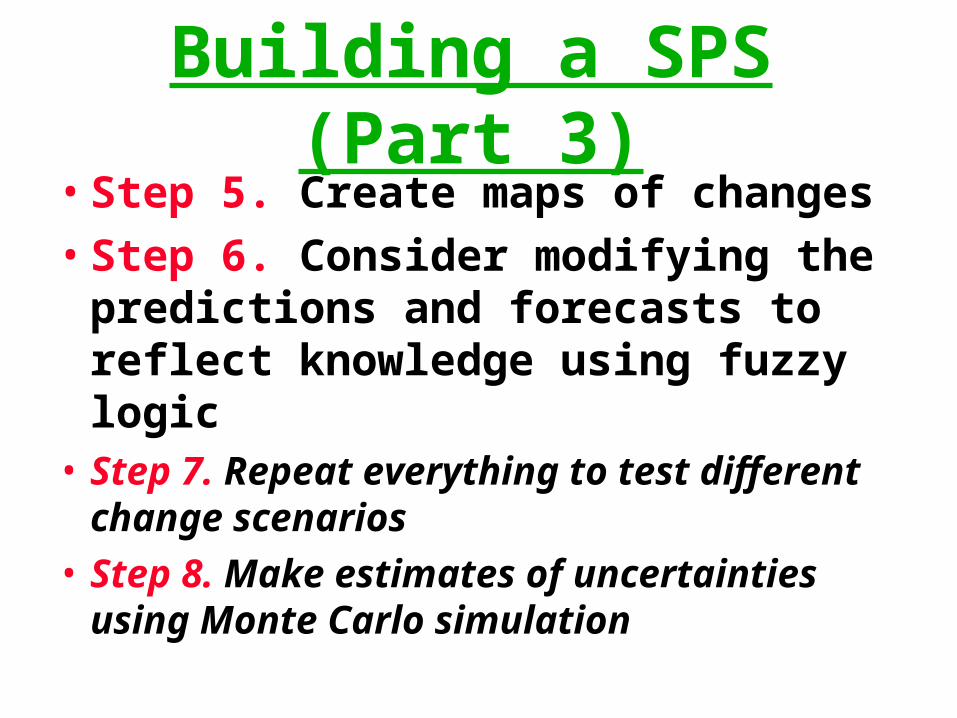
Building a SPS (Part 3)• Step 5. Create maps of changes
• Step 6. Consider modifying the predictions and forecasts to reflect knowledge using fuzzy logic
• Step 7. Repeat everything to test different change scenarios
• Step 8. Make estimates of uncertainties using Monte Carlo simulation

Step1: Assemble data for a common EU wide geography
• Not easy!
• A major reason for the lack of models linking environmental and socio-economic variables is the lack of a common data geography
• Environmental data tends to be grid-square based for small areas whilst socio-economic data tend to be for far larger and irregular polygons

Data required to predict agricultural land use
Soil TypeSoil QualityBiomassTemperature: seasonalPrecipitation: seasonaldigital elevation modelpopulation density

Why these variables?
• They are clearly related in some way to agricultural land use patterns
• They reflect the research by other Medalus teams
• They were available in some form
• They were available or could be estimated

1 Decimal Minute EU database• Decided to use grid-squares
• Best scale was about 1km2 or 1 decimal minute of resolution
• Most environmental data can be manipulated into a 1 DM cell format using GIS
• BUTBUT.... socio-economic data need to be interpolated from a coarser to a finer geography
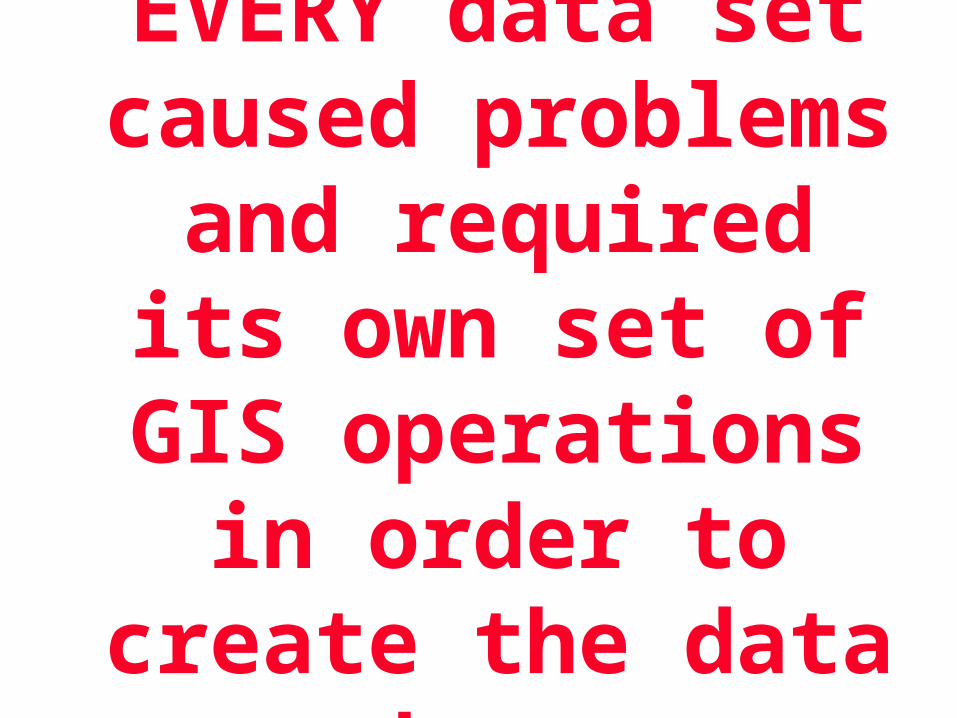
EVERY data set caused problems and required its own set of
GIS operations in order to create the
data base
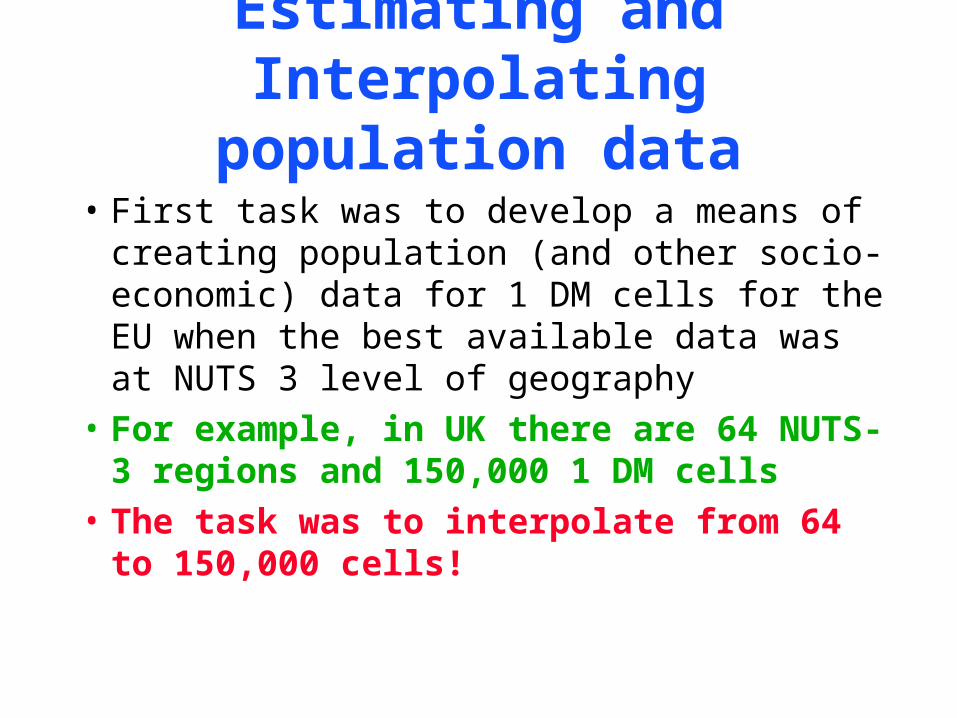
Estimating and Interpolating population data
• First task was to develop a means of creating population (and other socio-economic) data for 1 DM cells for the EU when the best available data was at NUTS 3 level of geography
• For example, in UK there are 64 NUTS-3 regions and 150,000 1 DM cells
• The task was to interpolate from 64 to 150,000 cells!

The Interpolation Problem
Nuts31DM

Methodology
• Use available GB census data as target data
• Nothing as good available for anywhere else in the EU
• Test out different methods of estimating these data from EU wide predictor variables
• Apply the best method to rest of EU

Review of Existing methods There are SOME existing methods that can
be used A very old simple method
• uniform area shares Various surface interpolation methods
• Tobler’s pycnophylactic surface• RIVM’s Goodchild et al (1993) method

RIVM population density surface

RIVM Smart Interpolation Weighting factors were used to create a
population potential surface auxiliary data sources were used to
modify the weights: Sea, Roads, Rivers An estimate of population was made
using the weights Best of the existing methods Errors are large
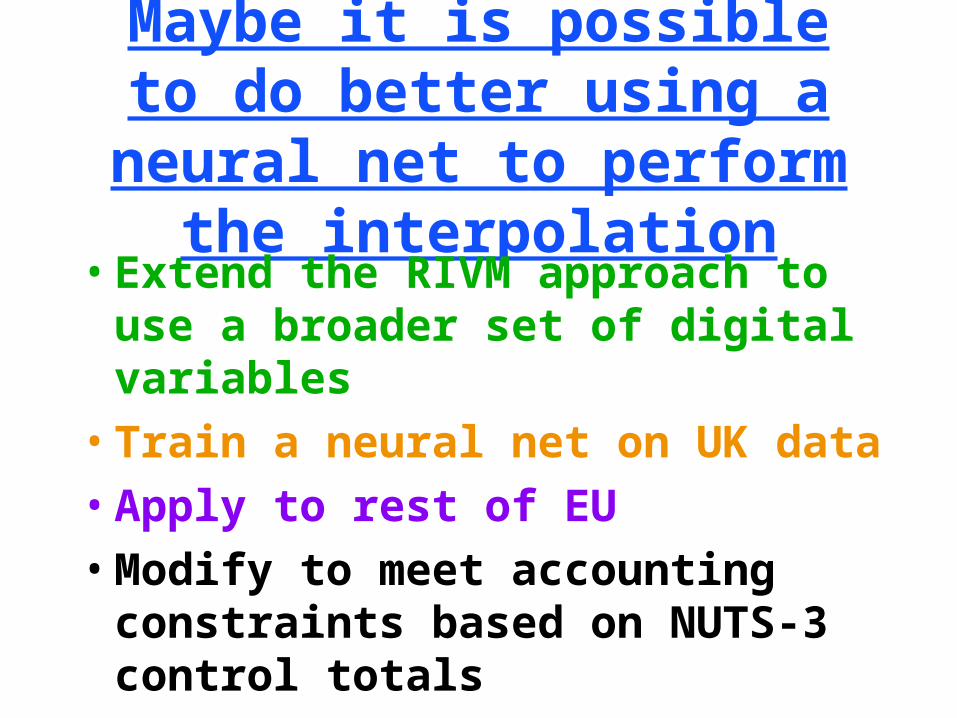
Maybe it is possible to do better using a neural net to perform
the interpolation• Extend the RIVM approach to use a
broader set of digital variables
• Train a neural net on UK data
• Apply to rest of EU
• Modify to meet accounting constraints based on NUTS-3 control totals

What Spatial Data for the EU is available that can help?
Data available for all of EU are:• Bartholomew’s 1:1000 000 digital map data
with various layers (+ DCW)• Other spatial data (DTM, slope, land cover)• NUTS 3 coverages• RegioMap and Eurostat Statistical Data
forecasts at NUTS3 level• Satellite data (eg. Night-time lights data)

Population Predictor Variables
• distance to – built up areas
– airport
– parks
– river and canals
– towns by size
• location of– built up areas
– place names
• density of– communication networks
– various roads
– railways
• height above sea level• night-time lights• RIVM’s population

Communications network density

Motorway and dual carriageway density
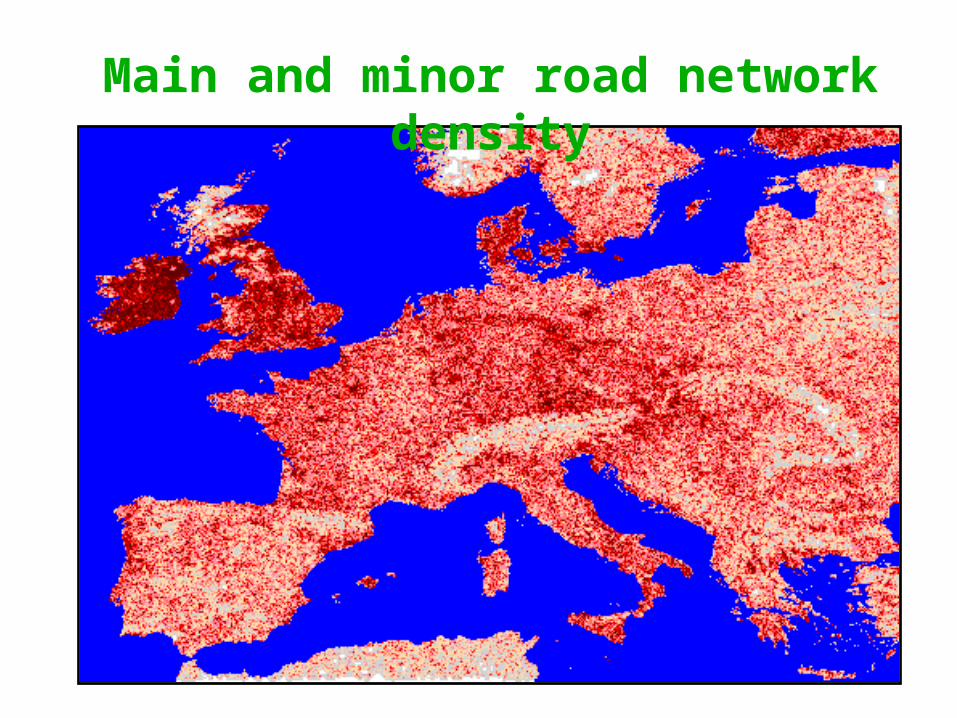
Main and minor road network density
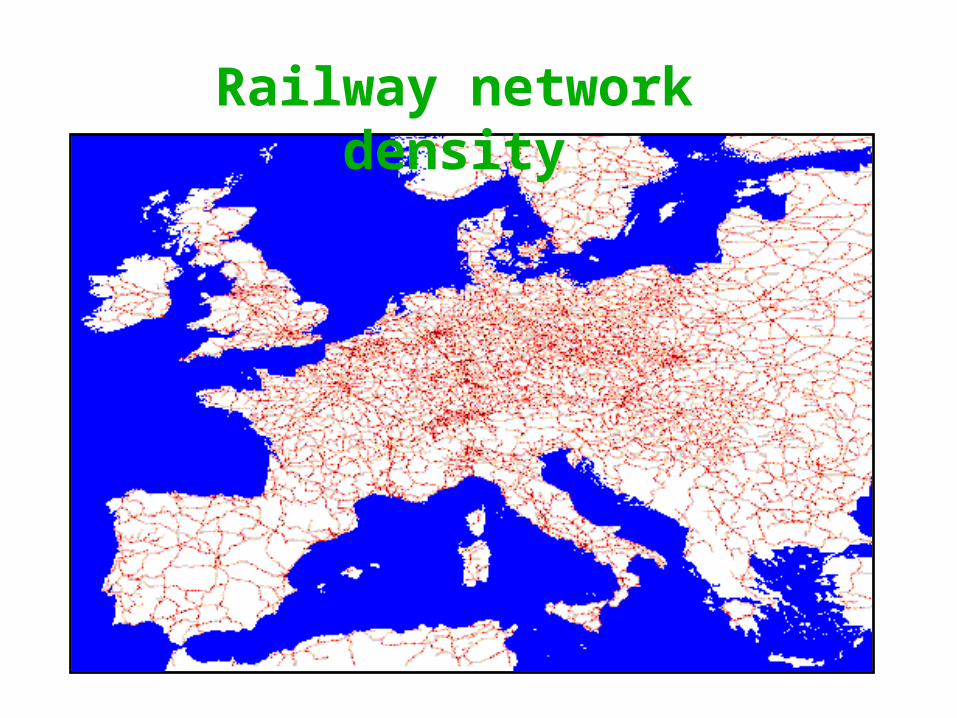
Railway network density
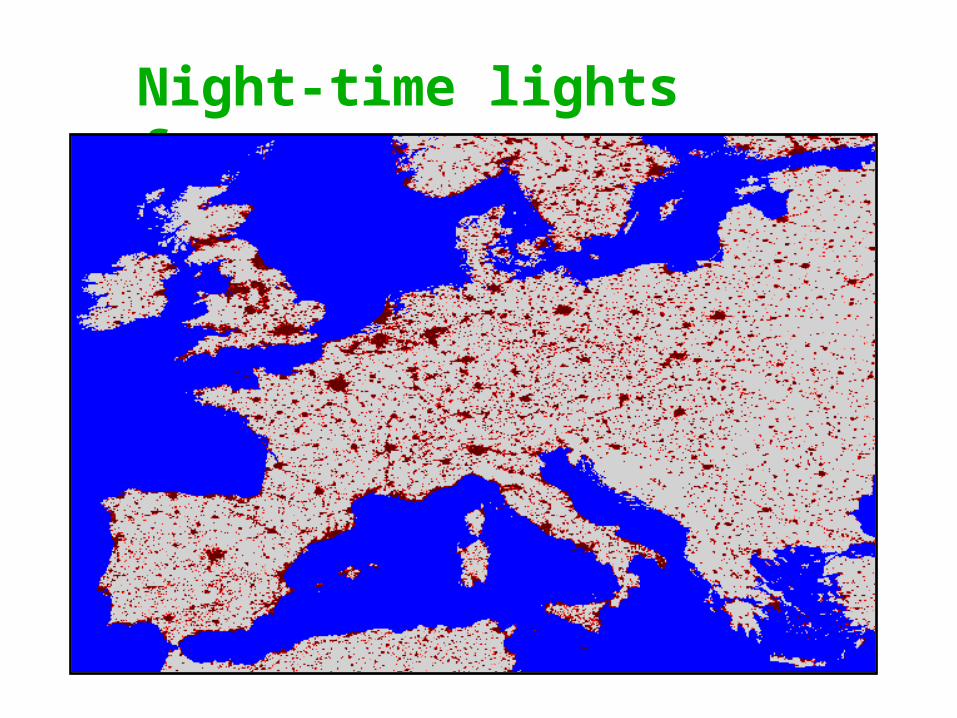
Night-time lights frequency
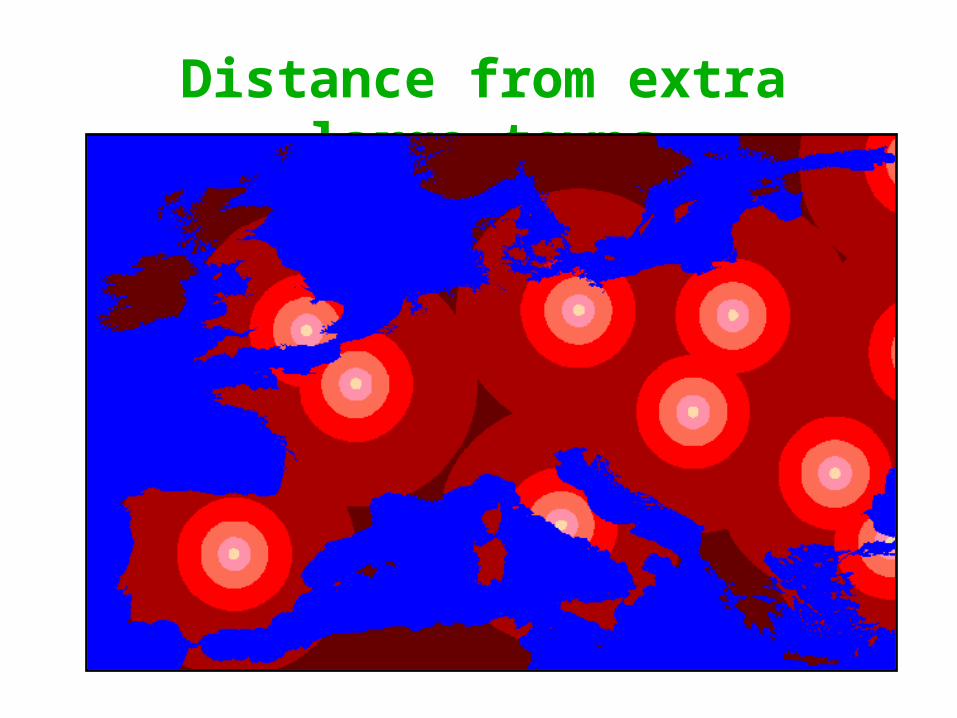
Distance from extra large towns

Distance from large towns
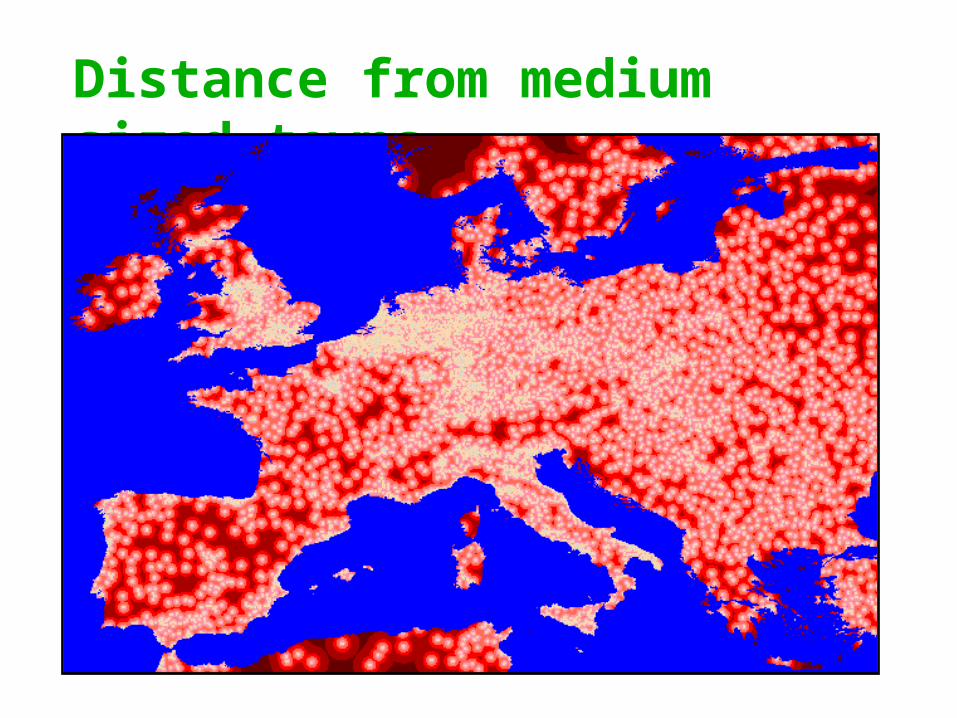
Distance from medium sized towns

Distance from small towns
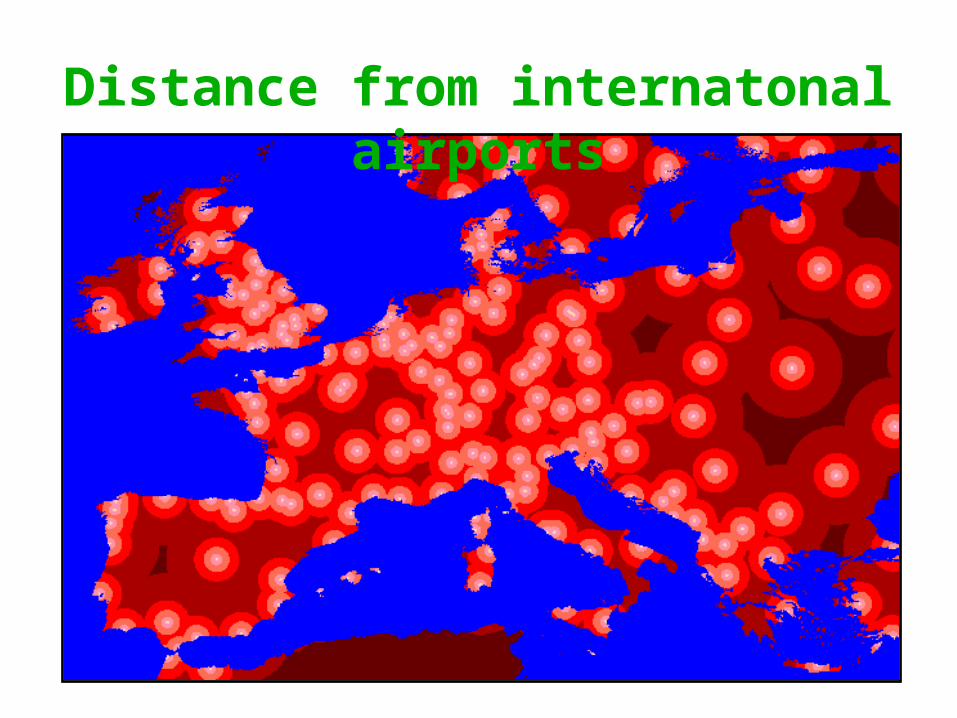
Distance from internatonal airports
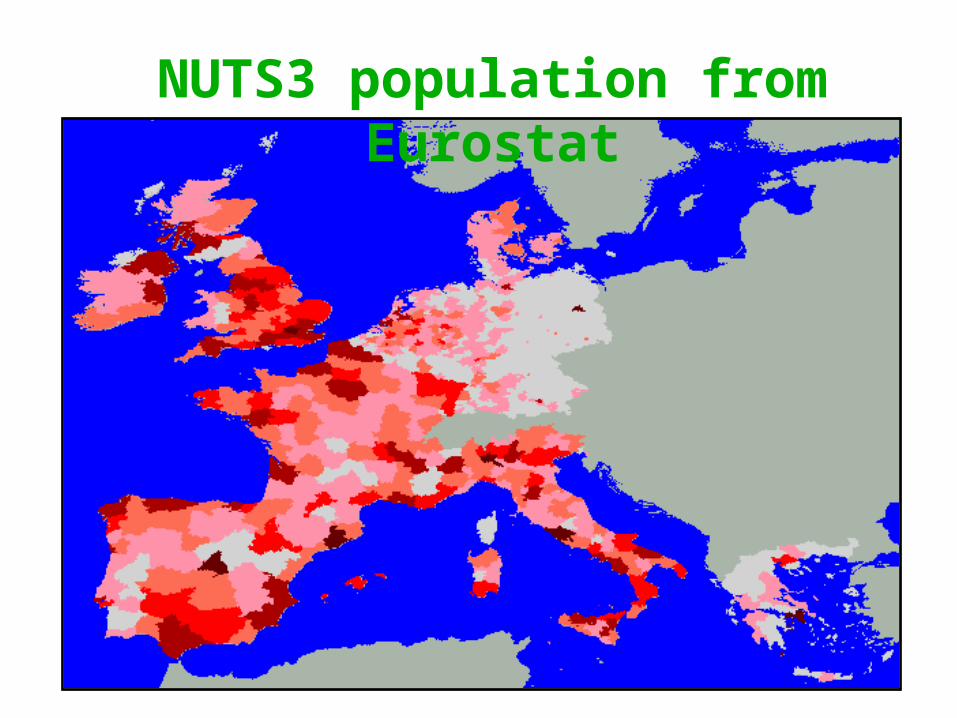
NUTS3 population from Eurostat
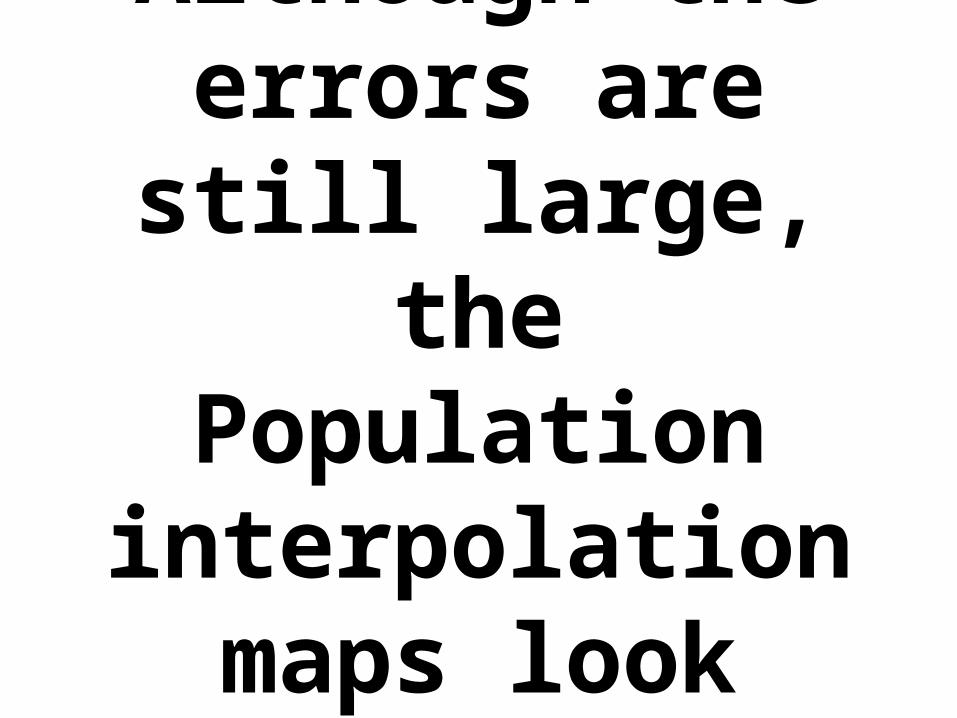
Although the errors are still
large, the Population
interpolation maps look good!
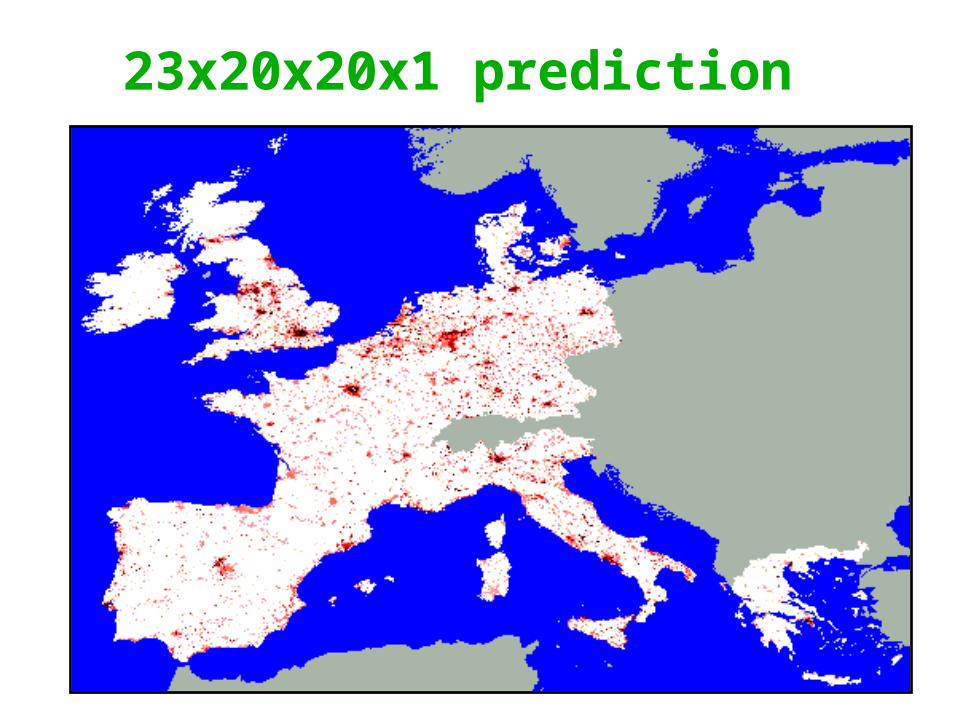
23x20x20x1 prediction

23x20x20x1 prediction close up of Italy

(continue..) Step1: Assemble data for a
common EU wide geography
• Climatic Data based on global climatic change models– results for a network of 50 weather stations– linear interpolation to 0.5 DM grid– imported into ArcInfo and aggregated to 1 DM
cells
• Spatial interpolation errors probably less than forecast errors!!!!!!
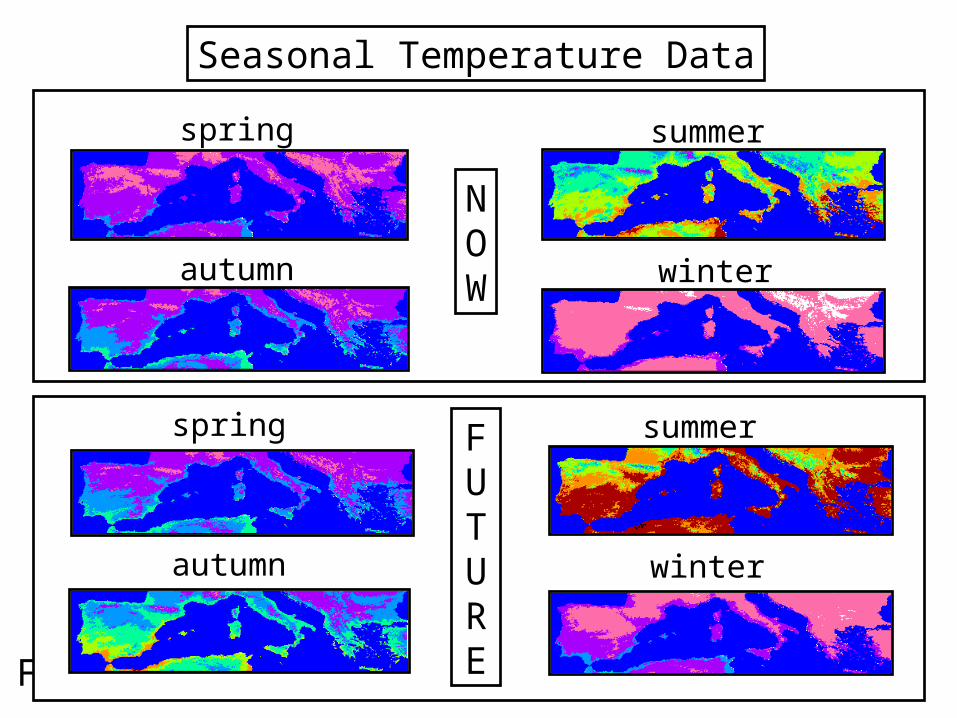
spring summer
autumn winter
Forecast
Seasonal Temperature Data
NOW
FUTURE
spring summer
autumn winter

spring summer
autumn winter
FUTURE
spring summer
autumn winter
Seasonal Precipitation Data
NOW

Height above Sea level
Climatic Biomass Potential
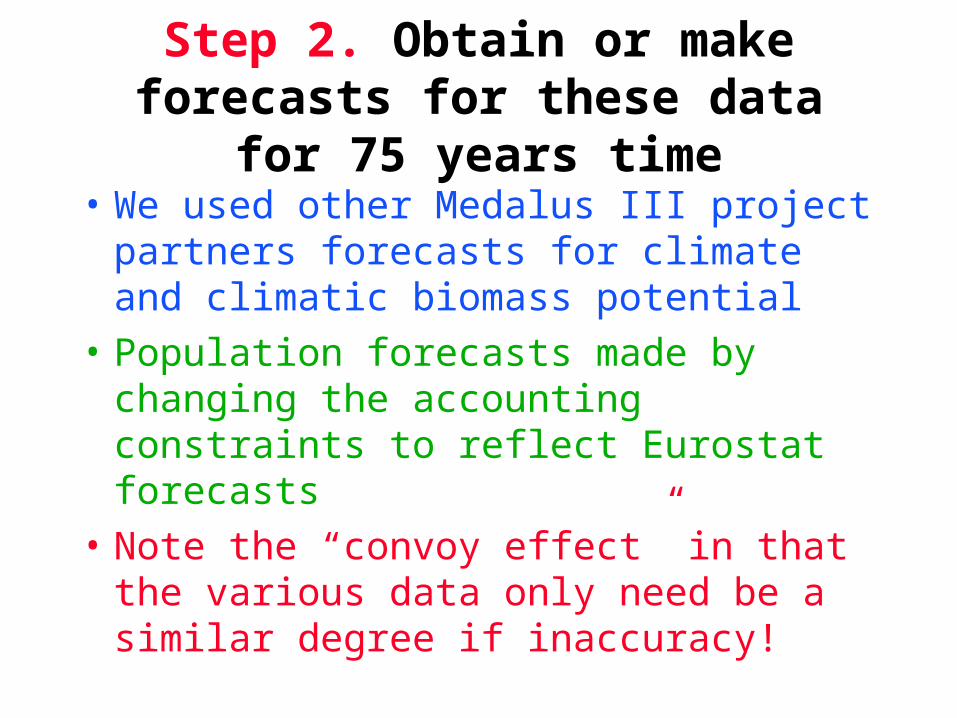
Step 2. Obtain or make forecasts for these data for 75 years time
• We used other Medalus III project partners forecasts for climate and climatic biomass potential
• Population forecasts made by changing the accounting constraints to reflect Eurostat forecasts
• Note the “convoy effect” in that the various data only need be a similar degree if inaccuracy!

Step 3. Construct Neural Nets to model the relationships between climate-soil-biomass-elevation-population in order
to predict present day land use
• used a feed forward multi-layer perceptron
• training data based on 20,000 randomly selected cells
• trained using a hybrid approach– genetic optimiser to start training– fine tuning using a conjugate gradient method

SPS Neural Net• Aim was to model current land use
• Various architectures investigated
• Best had 18 inputs, a single hidden layer with 50 neurons, and 1 output neuron
• Net trained on present and then given the same inputs for the forecast years
• Results “appear” promising!Results “appear” promising!

Results

Dominant Arable Landuse
Observed
Predicted
Forecast

Dominant Tree Landuse
Observed
Predicted
Forecast

Dominant Waste Landuse
Observed
Predicted
Forecast

Deficiencies!many social, economic, and political
processes are only implicitly presentneural net modelling would be better if the
data inputs were betteruncertainty levels remain unidentifiedmixture of data sources with very different
error and uncertainty levels

(yet more grave) Deficiencies!
a major assumption that global climatic change is equivalent to a shift in the boundaries of agricultural capability
there is an assumption that technology and behavioral influences remain constant as implicit in the training data
land use categorization is very crude

Good Points?a first attempt at socio-environmental
modellinga common methodology for the EUbrave (maybe foolish) attempt at broad-
brush forecasts for 50 years aheadframework can be used to yield improved
results
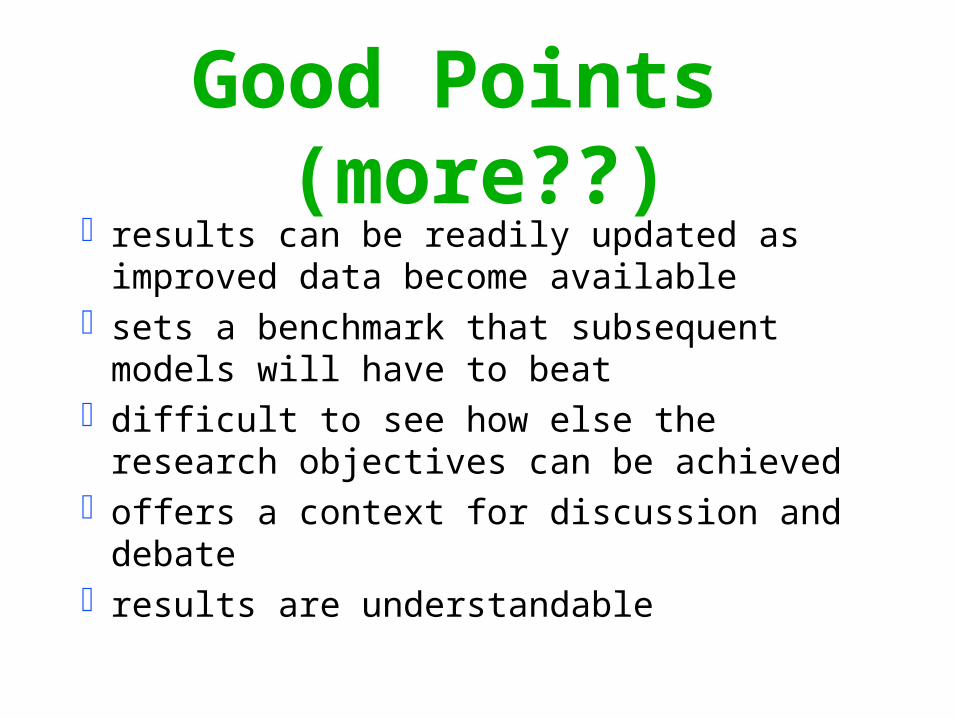
Good Points (more??)results can be readily updated as improved
data become availablesets a benchmark that subsequent models will
have to beatdifficult to see how else the research
objectives can be achievedoffers a context for discussion and debateresults are understandable

Step 5. Create maps of changesStep 6. Consider modifying the predictions and forecasts to reflect knowledge expressed as fuzzy rules

Fuzzy Interpretation of Impacts
• Important to handle the uncertainty in the predictions and data
• Fuzzy logic is a good way to achieve this
• Also allows incorporation of intelligent rules of thumb to add realism to computer model results
• Can be further extended as required

INPUTS
Knowledge base
Rulebase Membership Functions
IF...THENIF...THENIF...THEN
Fuzzyfication De-Fuzzyfication
OUTPUTS
InferenceEngine
Schematic of Fuzzy Land Degradation Interpreter

16 Fuzzy Rules
• If landuse_now is arable and landuse_future is:
– arable then land degradation is possible
– trees then land degradation is unlikely
– waste then land degredation is serious
– other landuse then land degradation is probable

• If landuse_now is trees and landuse_future is:– arable then land degradation is possible
– trees then land degradation is possible
– waste then land degredation is serious
– other landuse then land degradation is probable

• If landuse_now is waste and landuse_future is:– arable then land degradation is possible
– trees then land degradation is possible
– waste then land degredation is extensive
– other landuse then land degradation is possible

• If landuse_now is other and landuse_future is:– arable then land degradation is possible
– trees then land degradation is possible
– waste then land degredation is severe
– other landuse then land degradation is unlikely
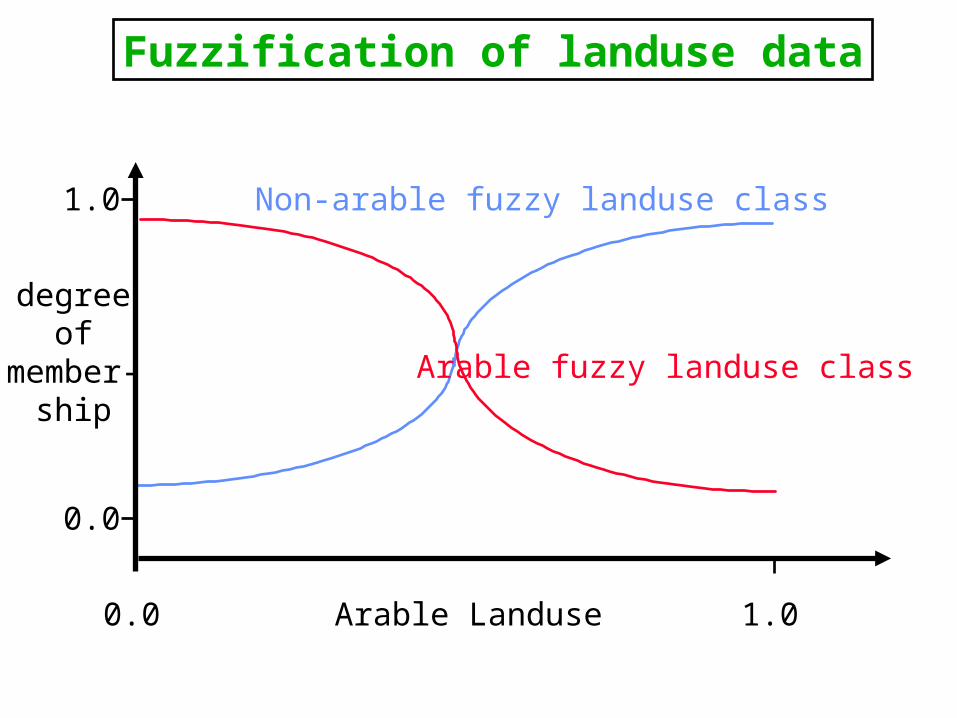
0.0 1.0
0.0
1.0 Non-arable fuzzy landuse class
Arable fuzzy landuse class
Fuzzification of landuse data
Arable Landuse
degreeof
member-ship

Land degradation membership function
possible probableunlikely extensive severe serious
fuzzy classes
land degradation scale
degreeof
member-ship
0.0 1.0
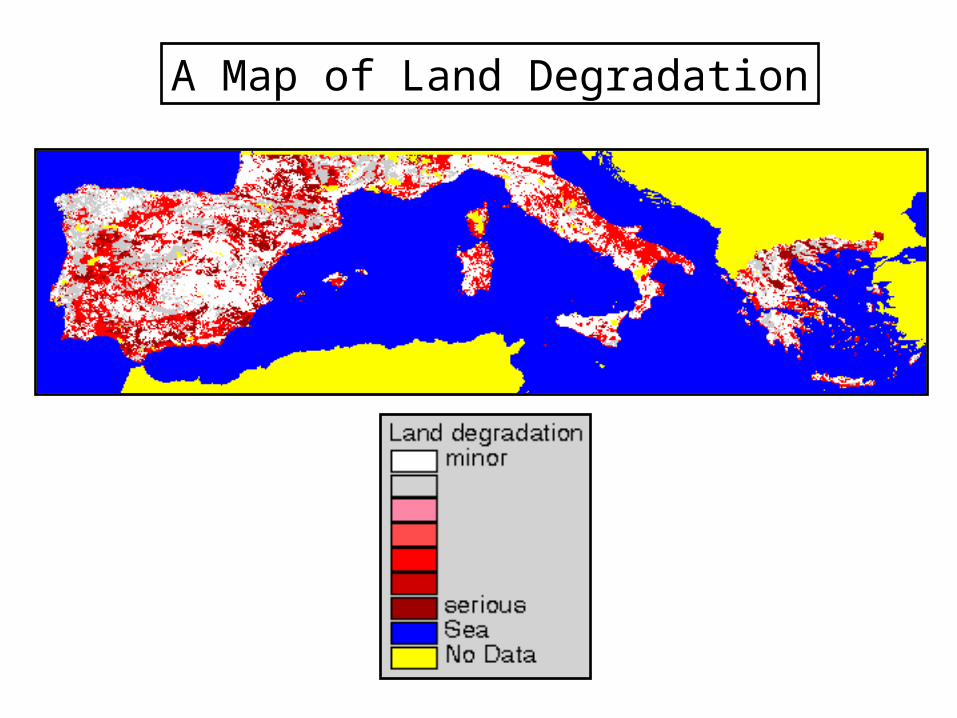
A Map of Land Degradation

Step 7. Repeat everything to test different change scenariosStep 8. Make estimates of uncertainties using Monte Carlo simulation
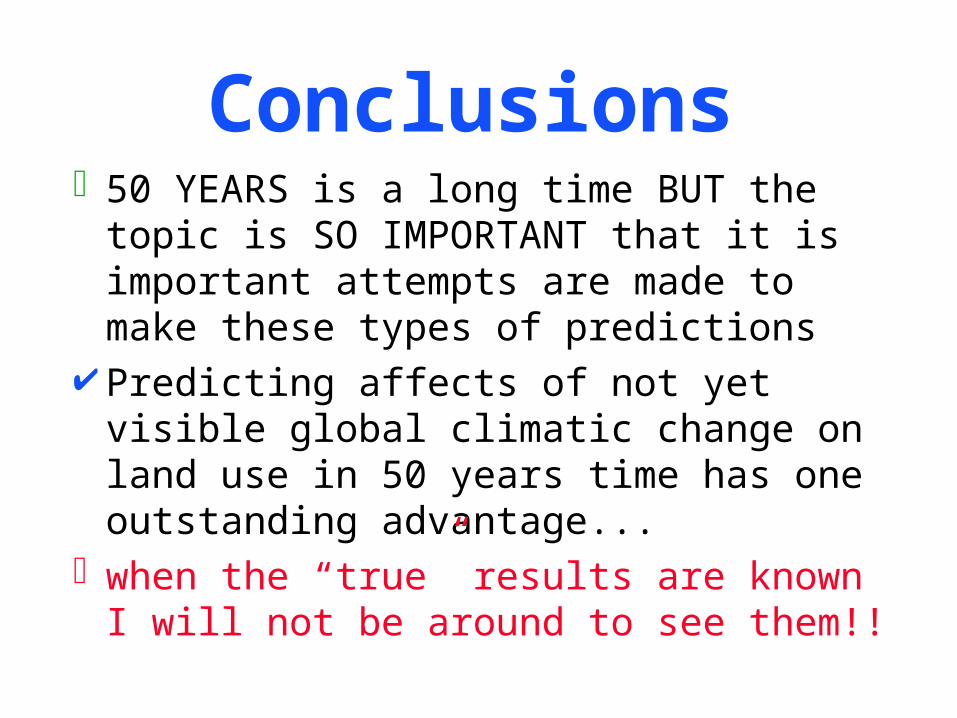
Conclusions50 YEARS is a long time BUT the topic is
SO IMPORTANT that it is important attempts are made to make these types of predictions
Predicting affects of not yet visible global climatic change on land use in 50 years time has one outstanding advantage...
when the “true” results are known I will not be around to see them!!

The results presented today are:
• Preliminary
• Subject to change
• They need to be improved upon
• They are almost certainly WRONG
• They are probably very WRONG
• Its even conceivable they could be COMPLETELY WRONG

http://www.geog.leeds.ac.uk/staff/a.turner
http://www.medalus.leeds.ac.uk/SEM/home.htm


