Prediction of Bitcoin Price Movements Based on Machine Learning Method and Strategy Construction
Siyu Yao*, Di Ma*, Yingying Zhang* Xi’an Tieyi International Curriculum Center
No.120 Youyi East Road, Beilin District, Xi'an City, Shaanxi Province, China
*These authors contributed to the work equllly and should be regarded as co-first authors.
Keywords: Technical indicators, Bitcoin price movements, Machine learning, Model fusion
Abstract: Bitcoin is the world's leading cryptocurrency and allows users to conduct anonymous transactions safely over the Internet. Bitcoin has attracted the attention of investors in recent years. We obtained the historical data of Bitcoin prices from 2010 to 2020 and analyzed the trend of Bitcoin prices based on 10 technical indicators. Then several machine learning methods such as the Logistic regression, Support Vector Machine (SVM), Random Forest (RF), XGBoost and lightGBM were used to predict movements of Bitcoin Prices. The experimental results showed that lightGBM was the most accurate in predicting the movements. In addition, we found that the results calculated with discrete variables of technical indicators were better than that with continuous features as input. Principal Component Analysis could reduce dimension so that the prediction performance of all machine learning models was improved. Finally, we integrated three models SVM with Gaussian kernel, XGBoost and lightGBM by the idea of Bagging. The total return reached about 1200% using Bagging method to buy or sell Bitcoin in a year and a half, which is prior to lightGBM method. Machine learning methods and the fusion model used for predicting Bitcoin price could also solve the problem of other digital currency price prediction.
1. Introduction Bitcoin is the longest running and best-known cryptocurrency and was first released as open
source by Satoshi Nakamoto in 2009 [1]. Bitcoin acts as a decentralized medium for digital exchange, and transactions are validated and recorded in public distributed ledgers (blockchains) without the need for trusted record keeping institutions or central intermediaries [2-3]. Transaction modules are "linked" together as an immutable record of all transactions that have occurred. Like any currency or commodity on the market, Bitcoin transactions and financial instruments were quickly accepted by the public. Bitcoin itself is very controversial. Some scholars believe that it is a currency with the characteristics of legal tender, while some scholars believe that Bitcoin itself is a virtual commodity. It does not fall within the scope of legal tender and cannot serve as a general equivalent with the equivalent exchange function of money [4].
With the improvement of people's recognition of cryptocurrency, the easing policies of various governments and the entry of investors, a large number of online trading platforms have been established worldwide, and the global cryptocurrency market has reached a level of trillions [5]. The unique 24-hour market system, t+0 trading rules, natural advantages and the high volatility of multiple markets of the same variety attract a large number of developers and investors to enter the market by quantitative trading.
With the increase of Bitcoin application scenarios and the easing of the government's attitude, Bitcoin's impact on the original monetary system. Its economic status has been steadily rising and attracted more and more investors' attention. Developers who trade stocks, futures and stock indexes have entered the market one after another and can occupy a place in emerging markets. Compared with other safe and stable financial investment methods, Bitcoin investment is still a venture capital activity. The profit is higher, but the risk is higher. How to get the highest benefit with the least risk? This is bound to be a topic of deep concern to investors. But the research on the
2020 International Conference on Economic Management and Corporate Governance (EMCG 2020)
prediction of special currency is still in its infancy. Is Bitcoin similar to stocks? Can historical data and current observation data be used to predict the future? Can it be applied to the prediction of Bitcoin trading trend? What attributes are suitable for Bitcoin prediction?
The aim of this paper is to understand the rule of Bitcoin price fluctuation, study its internal mechanism and achieve the prediction of Bitcoin price movements. Machine learning method could be trained by using the sample data set, and finally the model has the ability to make corresponding decisions [6]. The purpose of machine learning is to find the hidden rules and relations between input and output and improve the ability to predict the output structure of unknown input data. It shows the schematic diagram of Bitcoin movements prediction. The steps are as follows: we will obtain the daily frequency data of Bitcoin price, construct the technical indicators including MA, MACD, RSI, etc. to predict the movements of the special currency. Accuracy, precision, recall and AUC are used to evaluate the model and determine which model has higher accuracy. Generally, the prediction results could be better based on the model fusion technology. Finally, we will optimize the model based on the appropriate technical indicators and construct strategy for Bitcoin trading.
2. Related Work Quantitative trading relies on the development of the securities investment market and is favored
by more and more investors [7]. It uses quantitative methods and computer programs to issue trading orders, with the purpose of obtaining the maximum profits. Quantitative trading has a long history in developed countries such as Europe and the United States. The application scope of quantitative trading is not limited to the stock market because of its stable investment income. In recent years, quantitative trading is advancing to the digital money market [8]. Due to the development of digital money investment market and the transformation of demand, as well as the rapid development of machine learning and deep learning and other innovative technologies, more and more researchers have carried out in-depth research on digital currency transactions in the aspect of quantitative trading [9].
There are many methods to study digital currency based on Artificial Intelligence methods. Yan et al. established regression model and variance decomposition to verify whether there is a short-term or long-term correlation between different digital currencies [10]. Su et al studied the current situation and transaction risks of Bitcoin market according to the characteristics of digital currency trading market [11]. The experiment tested more than 40 common factors of different types of stock market in the digital money market. After the processing of single factor and factor regression process, 16 factors were finally selected to construct trading strategy, and the simulated returns were better. Besides, three variables had a significant short-term lag effect on the Bitcoin price and the impact time is relatively long [12]. Qing et al. proved that the future trading trend of Bitcoin can be estimated based on historical data and current observation data by applying Support Vector Machine (SVM) model and Bayesian linear regression model. Traditional models could help predict future trends of Bitcoin prices [13]. Custard et al. used automated methods for calculating the quality of digital resources. The purpose was to determine whether 16 indicators can be used to accurately classify resources into different quality level, and determine which indicators have a positive or negative impact on resource classification [14]. Prediction of time series data through several machine learning algorithms showed fusion of different models could improve the overall accuracy [15]. Kareem et al. presented that Bitcoin price fluctuates greatly and Bitcoin's relative insulation and high volatility is hard to predict [16]. Machine learning technology was also adopted to predict the price of Bitcoin at different times according to their daily prices and high-frequency prices [17].
Deep learning is a learning model with multiple hidden layers. Deep learning uses multiple hidden processing layers to construct computational models. It learns the high-level representation of data in abstract dimensions and has a good application in digital currency prediction. Daily data of $1,681 cryptocurrencies from April to November 2015 were analyzed to help predict its trend. The result of long-term short-term memory (LSTM) model showed that simple trading strategies assisted by the most advanced machine learning algorithms are better than standard benchmarks
107
[18]. Recurrent Neural Network (RNN) was used to predict the price trend of USD Bitcoin. The final result was that nonlinear deep learning is better than ARIMA, but the latter is not obvious [19]. Since 2019, with the help of pre training language models such as Google BERT, ALBERT, ELECTRA and so on, the ability of language comprehension has been approaching human level [20]. The understanding and analysis task of text information has entered a vast new field.
Both traditional machine learning method and deep learning method have good effect on the prediction of movements of digital currency. The combination of technical indicators and the analysis of digital currency movements based on machine learning method have good interpretability. Therefore, this section summarizes the advantages and disadvantages of machine learning methods and technical indicators. Then we will compare the prediction results of Bitcoin based on different models.
3. Data 3.1 Introduction of Bitcoin
Figure 1 shows the price of Bitcoin fluctuates greatly that influenced by supply and demand, speculation, regulation and internal technology [21]. Seven ministries and commissions, including the Central bank, announced that China had banned the trading of virtual currencies in September 2017. The price of Bitcoin has further increased. The price of Bitcoin dropped significantly between February and May 2018 and then stabilized at the same level for nearly 8 months. Bitcoin bid fell below $4,100 at 4:30am on November 21. Bitcoin prices hit a record high for the year in April 2019 and then topped $7,000 for the first time in nearly eight months. The price of Bitcoin passed the $10,000 mark on June 22 and keeps increasing. The price of Bitcoin shot above $12,000 on June 26, a level it reached last year. Bitcoin prices also fluctuate in some ranges in 2020.
Figure 1 Fluctuation of Bitcoin price
3.2 Construction of technical indicators Technical indicators we adopted for evaluating Bitcoin trending and their formulas are shown.
The formulas of the technical indicators could be found in previous references [22-24]. MA
108
(moving-average) has been applied longtime and is a measure of a trend in price changes. PSY has a certain reference significance to study and judge the short-term trend and can study the psychological fluctuation of investors on the stock market. Aroon is the technical index invented by Tushar in 1995 and indicate the trend change and trend intensity of asset prices. CCI measures whether share prices, foreign exchange or precious metals trade outside their normal distribution. CMO uses up day and down day data in the numerator of the formula which is different from other momentum index such as RSI and KDJ. MACD refers to the moving average of similarities and differences. MACD represents the change of market trend while MACD with different K-line levels represents the buying and selling trend in the current level cycle according to the double-exponential moving average. Relative Strength Index (RSI) is a leading indicator of how market prices will behave in the future based on a comparison of forces between rising and falling trends. Specifically, it can be considered as overbought phenomenon if the price rises rapidly; otherwise, it can be considered as oversold phenomenon. Stochastic KD mainly studies the relationship between the low and low prices and the closing market, reflecting the strength of the price trend and the phenomenon of overbuying or selling.
3.3 Summary statistics for Bitcoin movements In the technical indicator MACD, we set the parameter fast period to be 14 days, the parameter
slow period to be 26 trading days, and the parameter signal period to be 7 days. Periods for other technical indicators, such as MA, PSY, RSI, Aroon, CCI, CMO and RSI, is set to be 14 days. Table 1 shows summary statistics for technical indicators. These technical indictors are important to predict the movements of Bitcoin prices theoretically.
Table 1 Summary statistics for technical indictors
Logistic regression is a statistical analysis method to study whether there is a linear or nonlinear relationship between one or more independent variables and one dependent variable [25]. Logistic regression is a probability nonlinear regression model, which is a multivariate analysis method to study the relationship between classification observation results and some influencing factors. Logistic regression function is as follows and P could be regard as the probability :
Logistic regression belongs to discriminant model, and there are many methods of model regularization (L0, L1, L2, etc.). This model could get a good probability interpretation and easily update the model with new data (online gradient descent algorithm). If we need a probability
109
framework or want to quickly integrate more training data into the model in the future, this model is a good choice. The loss function of L1-norm Logistic regression could reduce the features dimension and shown as follows:
The loss function of L2-norm in Logistic regression is another method for solving
multicollinearity and shown in following equation:
4.2 Support Vector Machine
Support vector machine (SVM) is a method of adding new dimensions to view problems [26]. Its purpose is to find a hyperplane to segment the sample. The principle of segmentation is to maximize the interval. Finally, it is transformed into a convex quadratic programming problem to solve. The function of hyperplane is:
Support vector machine model can be divided into linear and nonlinear [26]. The data samples are said to be linearly separable if a linear function can separate the samples. In two-dimensional space there is not one line that can be divided, so the linear separable support vector machine corresponds to the line that can correctly divide the data and has the largest interval. Nonlinear transformation can be used to transform nonlinear problems into linear problems. It presents that the training samples can be mapped from the original space to a higher dimensional space and the samples are linearly separable in this space.
There are several kinds of kernel functions in common use [26]: Linear kernel function: < xi, xj > Polynomial kernel function: (c< xi, xj >+r)d Radial basis kernel function (Gaussian kernel function): exp(-c|xi-xj|)2 Sigmoid kernel function: (tanh (c<xi, xj>+r))
4.3 Random Forest Decision Tree is a decision analysis method to calculate the probability and a graphical method
to intuitively apply probability analysis [27]. For Decision Trees, data preparation is often simple or unnecessary, and can deal with both data-type and regular-type attributes at the same time. Feasible and effective results can be achieved for large data sources in a relatively short time. It is easy to measure the reliability of the model by static test. In practical applications, data sets often fail to achieve the above classification effect of "whether simulated transactions are supported or not". Gini index minimization criterion is adopted for feature selection. The diagram of Decision Tree and the Gini index after splitting is defined as follows:
Random Forest is a classifier that uses multiple Decision Trees to train and predict a sample. Random Forest is a classifier containing multiple Decision Trees and determined by the mode number of the categories output by individual trees [28]. This method can handle the amount of input into variables and assess the importance of variables in determining categories; In addition, Random Forest can detect deviations and viewing data with fast learning process.
110
4.4 XGBoost
XGBoost is an optimized algorithm on the basis of AdaBoost and GBDT that is composed of model, parameters and objective function [29]. The model can be understood as a combination of basis functions and weights. Optimizing the objective function needs to achieve two goals of making the predicted value close to the true valueand ensuring the generalization ability of the model. In order to reach the first one, we can minimize the loss function. For the second point, we can minimize the penalty term that controls the complexity of the model in the measurement of the loss function or a regularization term, such as L1 and L2 reuglaration. We optimize the objective function to achieve the optimal combination of error and complexity. Objective function Obj(x) is shown as follows:
𝑂𝑂bj(𝑥𝑥) = 𝐿𝐿(𝑥𝑥) + Ω(𝑥𝑥) The function consists of error function L(x) and complex function Ω(x). The purpose of the
function is to make the loss deviation as small as possible. The final concern is the size of the generalization error (the balance point between the deviation and the variance). The deviation describes the fitting ability of the algorithm itself, and the variance describes the impact of data disturbance. The implementation step of XGBoost is to select a base learner (decision tree, logistic regression and other weak classifiers). The idea of XGBoost is to learn the loss value before each iteration and add the predicted value of the base classifier to predict the result. After arranging the features, the following calculation formula can be used to traverse the value of each split point of each dimension feature to determine the optimal split point.
𝐺𝐺ain =12 �
𝐺𝐺𝐿𝐿2
𝐻𝐻𝐿𝐿 + 𝜆𝜆+
𝐺𝐺𝑅𝑅2
𝐻𝐻𝑅𝑅 + 𝜆𝜆−
(𝐺𝐺𝐿𝐿 + 𝐺𝐺𝑅𝑅)2
𝐻𝐻𝐿𝐿 + 𝐻𝐻𝑅𝑅 + 𝜆𝜆�− 𝛾𝛾
The left subtree gradient value is 𝐺𝐺𝐿𝐿,The gradient of the right subtree is 𝐺𝐺𝑅𝑅. It is the complexity cost introduced by adding new leaf nodes.
4.5 LightGBM LightGBM is an open source and efficient distributed gradient boosting tree algorithm released
by Microsoft in 2017 [30]. Due to its fast speed, low memory consumption and relatively high accuracy. The proposal of the LightGBM model not only reduces the computational cost, but also improves the computational efficiency of the model.
Higher accuracy and lower memory usage can be obtained In the case of high computational efficiency. LightGBM mainly made improvements in the following aspects: Gradient-based, One-Side, Sampling (GOSS) and Exclusive Feature Bundling (EFB). LightGBM uses the histogram algorithm to merge mutually exclusive features. I shows the diagram of histogram algorithm in LightGBM. The solution is to discretize the continuous attribute value into m integers and construct a histogram while discretizing. When traversing, the discretized value can be used as an index to accumulate statistics in the histogram, and then the discrete value of the histogram can be traversed to find the optimal cut point. In this way, the performance of the model is further accelerated because the huge amount of unnecessary calculations is avoided.
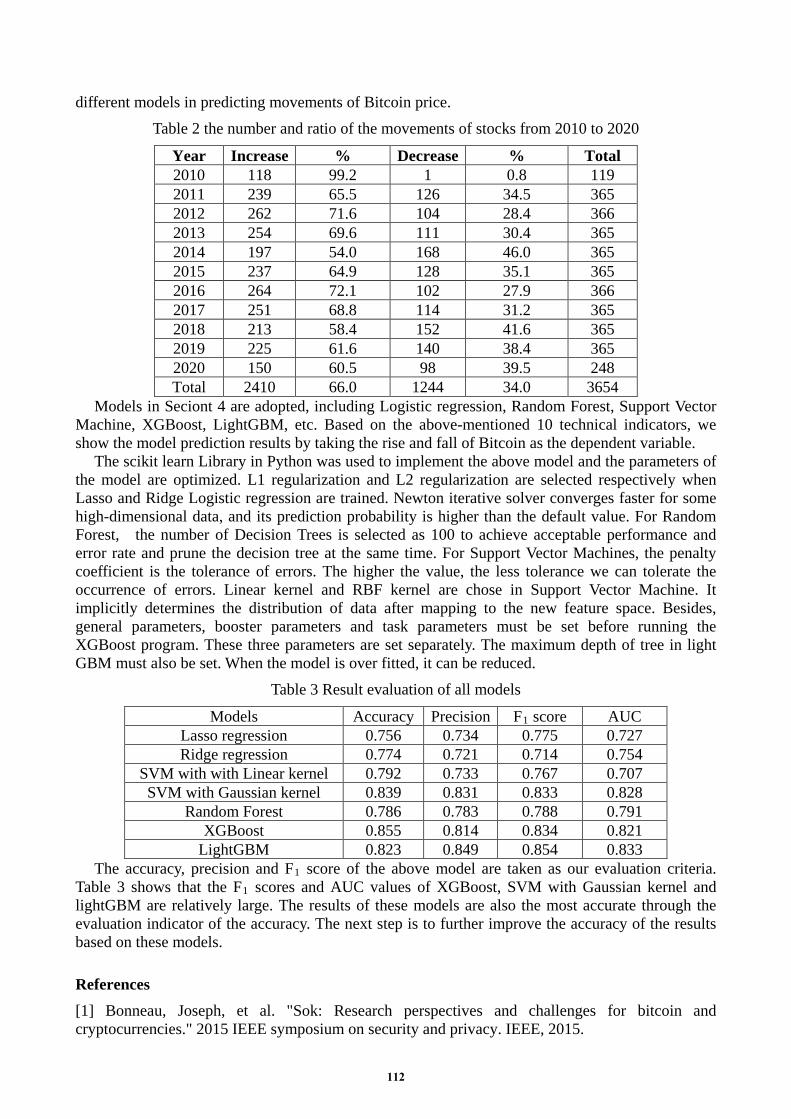
5. Results Table 2 mainly describes the number and ratio of the increase and decrease of Bitcoin from 2010
to 2020. It shows that Bitcoin increased a lot in past one decade. The increase of the total number of 2410 is less than the decrease of 1224. In 2010 only one day the Bitcoin prices fall. There were special circumstances in 2016 and 2014. The increase was 264 in 2008 and the decrease was 162, while the increase was 54.0% and the decrease was 46.0% in 2014. The data from 2010 to 2018 are used as the training set and the data from 2019 to 2020 as the test set to analyze the effect of
111
different models in predicting movements of Bitcoin price. Table 2 the number and ratio of the movements of stocks from 2010 to 2020
Models in Seciont 4 are adopted, including Logistic regression, Random Forest, Support Vector Machine, XGBoost, LightGBM, etc. Based on the above-mentioned 10 technical indicators, we show the model prediction results by taking the rise and fall of Bitcoin as the dependent variable.
The scikit learn Library in Python was used to implement the above model and the parameters of the model are optimized. L1 regularization and L2 regularization are selected respectively when Lasso and Ridge Logistic regression are trained. Newton iterative solver converges faster for some high-dimensional data, and its prediction probability is higher than the default value. For Random Forest, the number of Decision Trees is selected as 100 to achieve acceptable performance and error rate and prune the decision tree at the same time. For Support Vector Machines, the penalty coefficient is the tolerance of errors. The higher the value, the less tolerance we can tolerate the occurrence of errors. Linear kernel and RBF kernel are chose in Support Vector Machine. It implicitly determines the distribution of data after mapping to the new feature space. Besides, general parameters, booster parameters and task parameters must be set before running the XGBoost program. These three parameters are set separately. The maximum depth of tree in light GBM must also be set. When the model is over fitted, it can be reduced.
LightGBM 0.823 0.849 0.854 0.833 The accuracy, precision and F1 score of the above model are taken as our evaluation criteria.
Table 3 shows that the F1 scores and AUC values of XGBoost, SVM with Gaussian kernel and lightGBM are relatively large. The results of these models are also the most accurate through the evaluation indicator of the accuracy. The next step is to further improve the accuracy of the results based on these models.
References [1] Bonneau, Joseph, et al. "Sok: Research perspectives and challenges for bitcoin and cryptocurrencies." 2015 IEEE symposium on security and privacy. IEEE, 2015.
112
[2] Crosby M, Pattanayak P, Verma S, et al. Blockchain technology: Beyond bitcoin[J]. Applied Innovation, 2016, 2(6-10): 71. [3] Mainelli, Michael, and Mike Smith. "Sharing ledgers for sharing economies: an exploration of mutual distributed ledgers (aka blockchain technology)." Journal of Financial Perspectives 3.3 (2015). [4] Weber, Beat. "Bitcoin and the legitimacy crisis of money." Cambridge Journal of Economics 40.1 (2016): 17-41. [5] https://www.finextra.com/ [6] Papernot, Nicolas, Patrick McDaniel, and Ian Goodfellow. "Transferability in machine learning: from phenomena to black-box attacks using adversarial samples." arXiv preprint arXiv:1605.07277 (2016). [7] Beunza, Daniel, and David Stark. "Tools of the trade: the socio-technology of arbitrage in a Wall Street trading room." Industrial and corporate change 13.2 (2004): 369-400. [8] West, Robert A., and Michael J. Burns. "System and method for displaying money management information in an electronic trading environment." U.S. Patent No. 7,565,315. 21 Jul. 2009. [9] Chalapathy, Raghavendra, and Sanjay Chawla. "Deep learning for anomaly detection: A survey." arXiv preprint arXiv:1901.03407 (2019). [10] Chen, Yan. "Blockchain tokens and the potential democratization of entrepreneurship and innovation." Business Horizons 61.4 (2018): 567-575. [11] Su, Chi-Wei, et al. "RETRACTED: Testing for multiple bubbles in bitcoin markets: A generalized sup ADF test." (2018): 56-63. [12] Conrad, Christian, Anessa Custovic, and Eric Ghysels. "Long-and short-term cryptocurrency volatility components: A GARCH-MIDAS analysis." Journal of Risk and Financial Management 11.2 (2018): 23. [13] Qin, Meng, Chi-Wei Su, and Ran Tao. "BitCoin: A new basket for eggs?." Economic Modelling (2020). [14] Custard, Myra, and Tamara Sumner. "Using machine learning to support quality judgments." D-Lib Magazine 11.10 (2005): 1082-9873. [15] Mosavi, Amir, et al. "Comprehensive Review of Deep Reinforcement Learning Methods and Applications in Economics." arXiv preprint arXiv:2004.01509 (2020). [16] Hassan, M. Kabir, Mohammad Sydul Karim, and Aishath Muneezac. "A Conventional and Sharīʿah Analysis of Bitcoin." Arab Law Quarterly 1.aop (2020): 1-35. [17] McNally, Sean, Jason Roche, and Simon Caton. "Predicting the price of bitcoin using machine learning." 2018 26th Euromicro International Conference on Parallel, Distributed and Network-based Processing (PDP). IEEE, 2018. [18] Fischer, Thomas, and Christopher Krauss. "Deep learning with long short-term memory networks for financial market predictions." European Journal of Operational Research 270.2 (2018): 654-669. [19] McNally, Sean, Jason Roche, and Simon Caton. "Predicting the price of bitcoin using machine learning." 2018 26th Euromicro International Conference on Parallel, Distributed and Network-based Processing (PDP). IEEE, 2018. [20] Clark, Kevin, et al. "Electra: Pre-training text encoders as discriminators rather than generators." arXiv preprint arXiv:2003.10555 (2020). [21] Polasik, Michal, et al. "Price fluctuations and the use of bitcoin: An empirical inquiry."
113
International Journal of Electronic Commerce 20.1 (2015): 9-49. [22] Briza, Antonio C., and Prospero C. Naval Jr. "Stock trading system based on the multi-objective particle swarm optimization of technical indicators on end-of-day market data." Applied Soft Computing 11.1 (2011): 1191-1201. [23] Oncharoen, Pisut, and Peerapon Vateekul. "Deep learning for stock market prediction using event embedding and technical indicators." 2018 5th International Conference on Advanced Informatics: Concept Theory and Applications (ICAICTA). IEEE, 2018. [24] Dai, Zhifeng, et al. "Forecasting stock market returns: New technical indicators and two-step economic constraint method." The North American Journal of Economics and Finance (2020): 101216. [25] Park, Hyeoun. "An introduction to logistic regression: from basic concepts to interpretation with particular attention to nursing domain." Journal of Korean Academy of Nursing 43.2 (2013): 154-164. [26] Suthaharan, Shan. "Support vector machine." Machine learning models and algorithms for big data classification. Springer, Boston, MA, 2016. 207-235. [27] Brandão, Luiz E., James S. Dyer, and Warren J. Hahn. "Using binomial Decision Trees to solve real-option valuation problems." Decision Analysis 2.2 (2005): 69-88. [28] MChen, Zheshi, Chunhong Li, and Wenjun Sun. "Bitcoin price prediction using machine learning: An approach to sample dimension engineering." Journal of Computational and Applied Mathematics 365 (2020): 112395. [29] Chen, Tianqi, et al. "Xgboost: extreme gradient boosting." R package version 0.4-2 (2015): 1-4. [30] Ke, Guolin, et al. "LightGBM: A highly efficient gradient boosting decision tree." Advances in neural information processing systems. 2017. [31] Deng, Yue, et al. "Deep direct reinforcement learning for financial signal representation and trading." IEEE transactions on neural networks and learning systems 28.3 (2016): 653-664. [32] Lei, Kai, et al. "Time-driven feature-aware jointly deep reinforcement learning for financial signal representation and algorithmic trading." Expert Systems with Applications 140 (2020): 112872.