Page 1
This is a repository copy of Prediction of channel connectivity and fluvial style in the flood basin successions of the Upper Permian Rangal Coal Measures (Queensland).
White Rose Research Online URL for this paper:http://eprints.whiterose.ac.uk/82575/
Version: Accepted Version
Article:
Stuart, J, Mountney, NP, McCaffrey, WD et al. (2 more authors) (2014) Prediction of channel connectivity and fluvial style in the flood basin successions of the Upper Permian Rangal Coal Measures (Queensland). American Association of Petroleum Geologists (AAPG) Bulletin, 98 (2). 191 - 212. ISSN 0149-1423
https://doi.org/10.1306/06171312088
[email protected] ://eprints.whiterose.ac.uk/
Reuse
Unless indicated otherwise, fulltext items are protected by copyright with all rights reserved. The copyright exception in section 29 of the Copyright, Designs and Patents Act 1988 allows the making of a single copy solely for the purpose of non-commercial research or private study within the limits of fair dealing. The publisher or other rights-holder may allow further reproduction and re-use of this version - refer to the White Rose Research Online record for this item. Where records identify the publisher as the copyright holder, users can verify any specific terms of use on the publisher’s website.
Takedown
If you consider content in White Rose Research Online to be in breach of UK law, please notify us by emailing [email protected] including the URL of the record and the reason for the withdrawal request.
Page 2
1
Prediction of channel connectivity and fluvial style in the floodbasin
successions of the Upper Permian Rangal Coal Measures (Queensland)
J.Y. Stuart1, N.P. Mountney
1, W.D. McCaffrey
1, S. Lang
2, J.D. Collinson
3
1 Fluvial Research Group, School of Earth and Environment, University of Leeds, Leeds, LS2
9JT, UK
2 Woodside Energy Ltd, Perth, WA, Australia
3 John Collinson Consulting Limited, Delos, Knowl Wall, Beech, Staffordshire, ST4 8SE, UK
Author for correspondence: Jen Stuart, [email protected]
Abstract
Predicting the presence and connectivity of reservoir-quality facies in otherwise
mud-prone fluvial overbank successions is important as such sandbodies can
potentially provide connectivity between larger neighboring sandbodies. This
paper addresses minor channelized fluvial elements (crevasse splay and
distributary channels), and attempts to predict connectivity between such
sandbodies in 2 interseam packages of the Upper Permian Rangal Coal
measurements. Channel body percent as measured in well logs were 2% in the
upper (Aries-Castor) interseam, and 17% in the lower (Castor-Pollux)
interseam. Well spacing was too great to allow accurate correlation of channel
bodies. The Ob River, Siberia, was used as modern analogue to supply
planform geometric measurements of splay and distributary channels, so that
stochastic modeling of channel bodies was possible. The resulting models
demonstrated that (i) channel-body connectivity is more uniform in distributary
river systems than in splay complexes; (ii) relatively good connectivity is seen in
proximal positions in splays, but decreases distally from the source as channel
elements diverge; (iii) connectivity tends to be greater down the axis of splays,
with more isolated channel bodies occurring at the margins.
Keywords: Fluvial, distributary, crevasse, secondary channel, tertiary channel,
connectivity, reservoir modeling, Rangal Coal Measures, Bowen Basin, Ob
River
Page 3
2
Introduction
The distribution of sand bodies in fluvial overbank settings is strongly controlled
by processes that dictate the style and frequency of overbank flooding
(Benedetti 2003) via the breaching of levees, the generation of crevasse splays
(Morozova & Smith 2000), and the development of minor distributary channels
(Smith et al. 1989). In particular, size, longevity, spatial distribution and style of
connection of splays to primary channels governs the distribution of sand-prone
elements in overbank successions. The presence of reservoir-quality facies,
such as secondary and tertiary splay and distributary channel deposits, in
otherwise mud-prone fluvial overbank successions may provide significant
connectivity between neighboring major channel elements in avulsion-prone
channel belts, as in the Westphalian Coal Measures, Durham, UK (Fielding,
1986).
Although determination of three-dimensional sedimentary architecture and
overbank connectivity is crucial for reservoir prediction in low net:gross
floodplain settings, the typical km-scale well spacing in some hydrocarbon fields
is too great and the total number of wells too few for the development of the
appropriate predictive models. Likewise tertiary splay and minor distributary
channel elements (ø5" o" vjkempguu" � Avenell 1998) are typically below the
vertical resolution of seismic data (Bridge & Tye 2000; Ethridge & Schumm
2007), and their presence cannot be ascertained, nor their impact on
connectivity inferred, from such data.
In low-accommodation fluvial settings, sand-prone channel elements are
preferentially preserved as stacked and overlapping multi-story and multi-lateral
bodies, whereas in higher accommodation settings, mud-prone overbank
elements have greater preservation potential and neighboring channel bodies
tend to be spatially isolated (Bristow & Best 1993). An increased rate of
accommodation creation is commonly attributed to one or more of the following
driving mechanisms: (1) high rates of basin subsidence such as encountered in
many foreland basin settings (e.g. Marenessi et al. 2005); (2) base-level rise
(Bristow et al. 1999; Bourquin et al. 2006) Most systems are governed by a
combination of these factors, although one may be dominant (Ethridge et al.
1998).
Page 4
3
Facies associations routinely identified in low net:gross, relatively high-
accommodation fluvial overbank settings include those associated with mires,
levees, secondary and tertiary distributary channels, and splays and splay
complexes, including those composed of multiple tertiary splay channels, as
well as finer-grained units: floodplain-lake fills and floodplain fines, including
palaeosols (Smith & Pérez-Arlucea 1994; Jorgensen & Fielding 1996; Cazanacli
& Smith 1998; Farrell 2001). Figure 1 illustrates the typical architecture and
internal facies make-up of these depositional elements. Reservoir-quality
sandstones are most likely to be present in the overbank setting as networks of
secondary and tertiary channel elements, the accumulated deposits of which
typically attain thicknesses of up to a few meters, and which may form laterally
extensive splay bodies over distances of several kilometers. It is, however,
typically difficult to distinguish between deposits of some of the smaller-scale
overbank elements, particularly when relying on core or well-logs alone for
interpretation (Brierley et al. 1997).
The aim of this study is to demonstrate the architecture and connectivity of
secondary (distributary) and tertiary (distributary and splay) channelized sand
bodies in a low net:gross fluvial setting, to assess the potential for
communication between reservoir-quality (sandy) elements in overbank
settings. Specific objectives of this study are (i) to document criteria by which
minor channelized elements can be identified on wireline logs, (ii) to quantify
infill proportions and dimensions of tertiary channels, (iii) to present quantitative
data on plan-view geometries of modern tertiary channel elements, and (iv) to
stochastically model the predicted lateral and vertical connectivity of tertiary
channels. The connectivity of such sand bodies is investigated for two
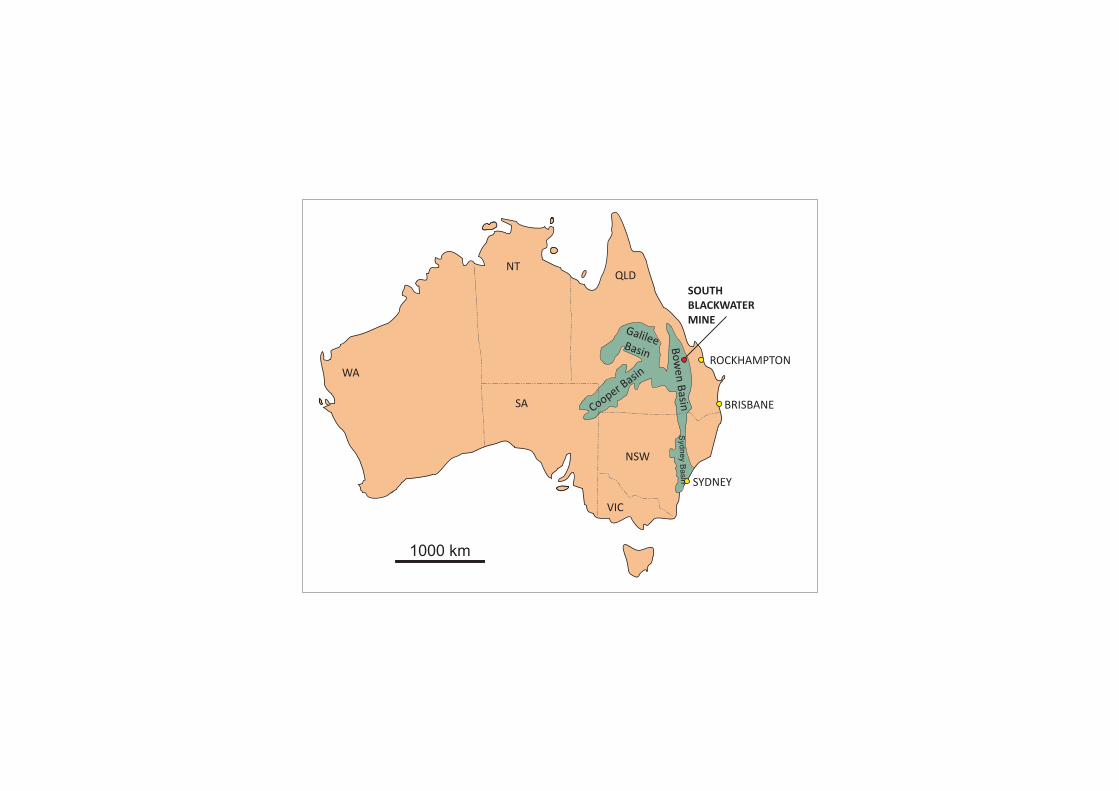
interseam intervals at the South Blackwater Mine, Queensland (Fig. 2), a
Permian coal-bearing floodbasin succession.
This work is significant for the following reasons: (i) current models that predict
sand-body occurrence in floodbasin settings are overly simplistic and largely
qualitative in nature (Bridge & Tye 2000); (ii) current approaches to estimating
hydrocarbon reserves in fluvial reservoirs routinely only assess the geometry of
major (primary) fluvial sand bodies (e.g. multi-storey channel complexes), and
Page 5
4
this potentially underestimates the true volume by ignoring the additional
significant volume associated with minor secondary and tertiary channel and
splay elements; (iii) few models currently exist with which to assess the role of
minor secondary and tertiary channel and splay elements in terms of their role
in aiding communication and connectivity between primary channel bodies.
Geological Setting
The Permian Rangal Coal Measures of the Bowen Basin, at the South
Blackwater Mine, Bowen Basin, Queensland (Fig. 2) are exposed in a series of
open cast workings and have been penetrated by a series of shallow boreholes
for which well-log and core data are available. The coal measures are
widespread throughout the basin and they have been exploited through
intensive open-cut mining since the 1970s (Mutton 2003). The Rangal Coal
Measures form part of the fill of the Bowen Basin, which evolved � along with
several other Eastern Australian Gondwanan basins � as part of the Middle-
Late Palaeozoic Tasman Orogen (Fielding et al. 1993; Fielding 2001; Fig 3).
Three pulses of sedimentation directed southwards along the basin axis
occurred during the Late Permian, the last of which was responsible for the
accumulation of the Wuchiapingian-Changhsingian age Rangal Coal Measures
and equivalents, which represent the preserved deposits of a large scale
distributary fluvial system (Fielding et al. 1993; Allen & Fielding 2007). The
sheet-like nature of primary channel deposits formed in the Rangal Coal
measures is indicative of a low-sinuosity system and the Rangal Coal Measures
are considered to have formed in a broad alluvial plain setting (Fielding et al.
1993)
At the South Blackwater Mine, the Rangal Coal Measures are preserve three
mineable coal seams within the study area: Aries (A), Castor (B) and Pollux (C).
Within the Rangal Coal Measures, several facies associations have been
recognized by previous research. Fielding (1993) identified the following: Sheet-
like sandstone channel bodies; laterally accreted, heterolithic channel bodies;
proximal overbank; crevasse channel fill; floodbasin; lake floor; mire. Avenell
(1998) interpreted wireline and core data as: sheet-like channel sandstone
bodies (primary channel elements); heterolithic distributary channel bodies
(secondary channel elements); minor crevasse channel bodies (tertiary channel
Page 6
5
elements); levee; floodbasin; lacustrine and mire. Michaelsen et al. (2000)
interpreted the interseam deposits as: trunk river channels and crevasse feeder
channels; levee bank�proximal crevasse splay; distal splay�overbank; marsh;
peat mire and floodbasin lake.
Data and Methods
The study covers a 2km2 area of the South Blackwater Mine, Queensland.
Detailed correlation of a subsurface part of the Rangal Coal Measures
succession was undertaken using a high-density subsurface dataset of wireline
logs from 63 coal exploration wells. Available well logs included, including
gamma-ray (GR), density, caliper and sonic logs were utilized.
High-resolution lithologic logs were made for each well in the dataset using
Oilfield Data Manager (ODM) software, primarily via the interpretation of GR
and density log responses. For the purpose of lithology interpretation, GR cut-
offs were defined as follows: clay/mudstone, >110 API GR; siltstone and silty
sandstone, 110-90 API GR; 'clean' sandstone (>60% sand), <90 API GR
(Avenell, 1998). Coal was easily identified by its distinctive signature
characterized by very low GR values coincident with low density values.
After assigning lithologies to each well, architectural elements (Miall, 1985)
were assigned to packages of deposits deemed to have been formed by the
same processes. To help achieve this, an extended and refined lithology and
facies scheme for the Rangal Coal Measures was developed from a previous
core-based study at the South Blackwater Mine (Avenell 1998) and this was
used as the basis for the architectural-element scheme developed in this study.
Patterns in well-log curves and litholologic cycles were identified and assigned
to fluvial and overbank architectural elements. Architectural elements were then
correlated between subsurface wells in an attempt to characterize two-
dimensional facies changes and, where possible, the likely three-dimensional
sedimentary architecture and style of connectivity of secondary and tertiary
fluvial channel elements considered to have arisen as a product of crevassing in
a distributary system.
Page 7
6
Where it was not possible to predict architectural-element type and extent from
groups of neighboring well logs, measurements and estimates of likely plan-
form geometry were made via the adoption and implementation of geometries
of similar elements from analogous modern systems. Study of these modern
fluvial systems involved the measurement of channel widths, lengths and
sinuosities using NASA Landsat and Google Earth® imagery. These analogue
data were integrated into reservoir models of the study area using
Reckonnect®, a fluvial stochastic modeling software package. Reckonnect was
chosen due to its ability to run multiple iterations of models in a short time
period, in order to test the effect on reservoir connectivity of changing the
dimensions and other parameters of the channel-element sand bodies.
Interpretations of the depositional sub-environments of the Rangal Coal
Measures interseam intervals were then made based on the proportions and
distributions of architectural elements observed in each of the two interseam
intervals, one between the Aries (A) and Castor (B) seams, and the other
between the Castor (B) and Pollux (C) seams.
Architectural Elements
Seven principal architectural elements have been identified in the study area
between the Aries (A) and Pollux (C) seams (Fig. 4) using defined GR cut-offs
for sand (<90), silty sand (90-110) and mud (>110), together with correlation of
wireline log signatures between neighboring well-logs. The architectural
element scheme is based on that of Avenell (1998).
(1) Secondary tributary channel elements. The wireline log character of these
elements shows a sharp, erosional base, with a fining-up, blocky or bell-shaped
gamma response. These deposits are <90 API GR. These elements are greater
than 3 m thick and are interpreted as hetrolithic distributary channel-fill deposits
(Fielding et al. 1993). Distributary channels are typically bounded by levees, are
subject to some lateral accretion, and grade laterally into finer-grained floodplain
deposits (Avenell, 1998), in places causing local 'washouts' of the Castor (B)
seam (Fig. 6).
Page 8
7
(2) Tertiary crevasse channel elements. These elements have a GR of <110
API GR, in a succession of <3 m-thickness sandstone. They are typically sharp-
based, fining-up to clayey, silty sand. The overall log signature is blocky or bell-
shaped. Laterally more extensive tertiary channel elements are interpreted as
those of mature crevasse channels, analogous to the stage 3 splay channels of
Smith et al. (1989). Less extensive, poorly developed tertiary channel elements
are interpreted as immature or abruptly abandoned splay channels of a stage 1
or stage 2 crevasse splay (Smith et al. 1989).
(3) Channel-margin (including levee) and lake-margin elements. Channel-
margin deposits form the finer-grained equivalent to adjoining channelized
deposits. They typically exhibit fine-grained (alternating high and low GR) log
patterns, corresponding to interbedded sandstones, siltstones and clay drapes.
Lake-margin deposits routinely exhibit coarsening-up, progradational log
patterns, but are difficult to distinguish from levee channel-margin deposits
where observed in wireline borehole logs alone.
(4) Proximal- to medial-floodplain elements. Deposits of these elements consist
of interlaminated sandstone, siltstone and clay-rich partings, with a highly
variable log pattern attributed to splays and flooding.
(5) Distal floodplain elements. Deposits of these elements are characterized by
laminated siltstones and mudstones, with a GR log signatures generally >110
API GR. Minor sandstone intervals identified in these packages likely represent
the distal deposits of crevasse splays.
(6) Floodplain lake and frequently inundated floodplain elements. These
deposits of interlaminated claystones, mudstones and silty-mudstones, with rare
lenses of siltstone and sandstone, have GR log readings generally >110 GR
API. They are indicative of a system subject to seasonal flooding.
(7) Mire elements. Within these deposits, a blocky, low GR-log signature is
indicative of coals. This �blocky� GR response, together with a low DENL
response distinguishes coal from sandstone. These deposits constitute coal
seams and carbonaceous shales formed in peat mires.
Page 9
8
Thick and sheet-like primary channel-fill elements are not encountered in the
interseam deposits of the study area, though such bodies are identified from
some wells beneath the C seam. Most wells stopped at or just beneath the C
seam, so correlation of these extensive sand-prone elements has not been
possible.
Correlation
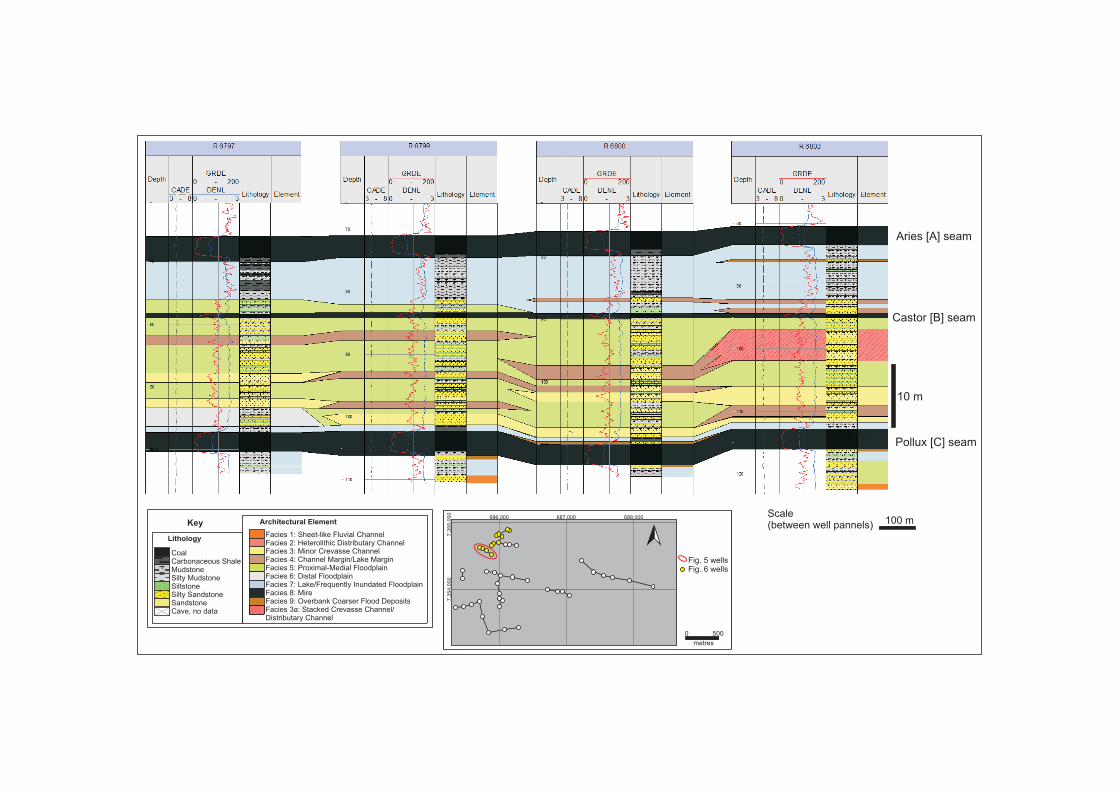
Figure 5 details a typical subsurface well correlation, taken from the northeast of
the study area (see inset map for location). The correlation utilizes caliper,
gamma-ray and density wireline logs to identify the three major coal seams
present in the studied interval, to interpret the interseam lithology, and to
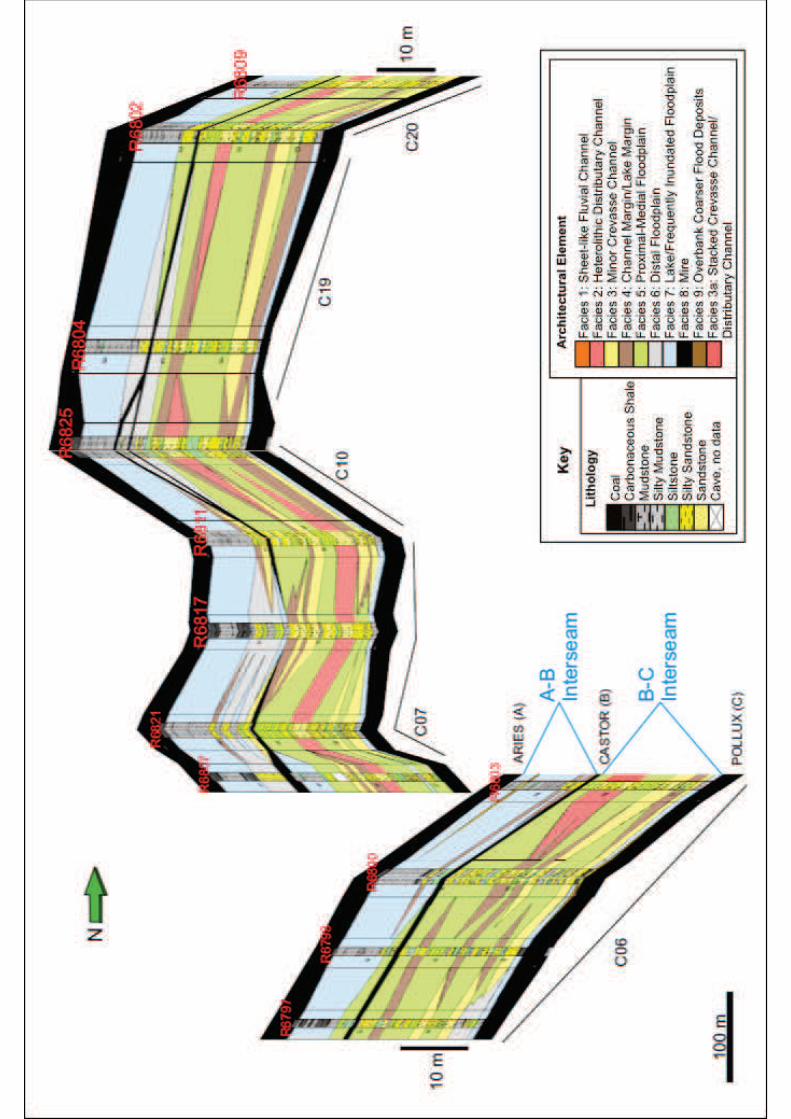
interpret the architectural elements present in the interseams. Fence diagrams
collating key correlation panels were constructed to demonstrate the three-
dimensional architecture of the interseam deposits (Fig. 6) and to identify key
areas of secondary and tertiary fluvial channel deposition.
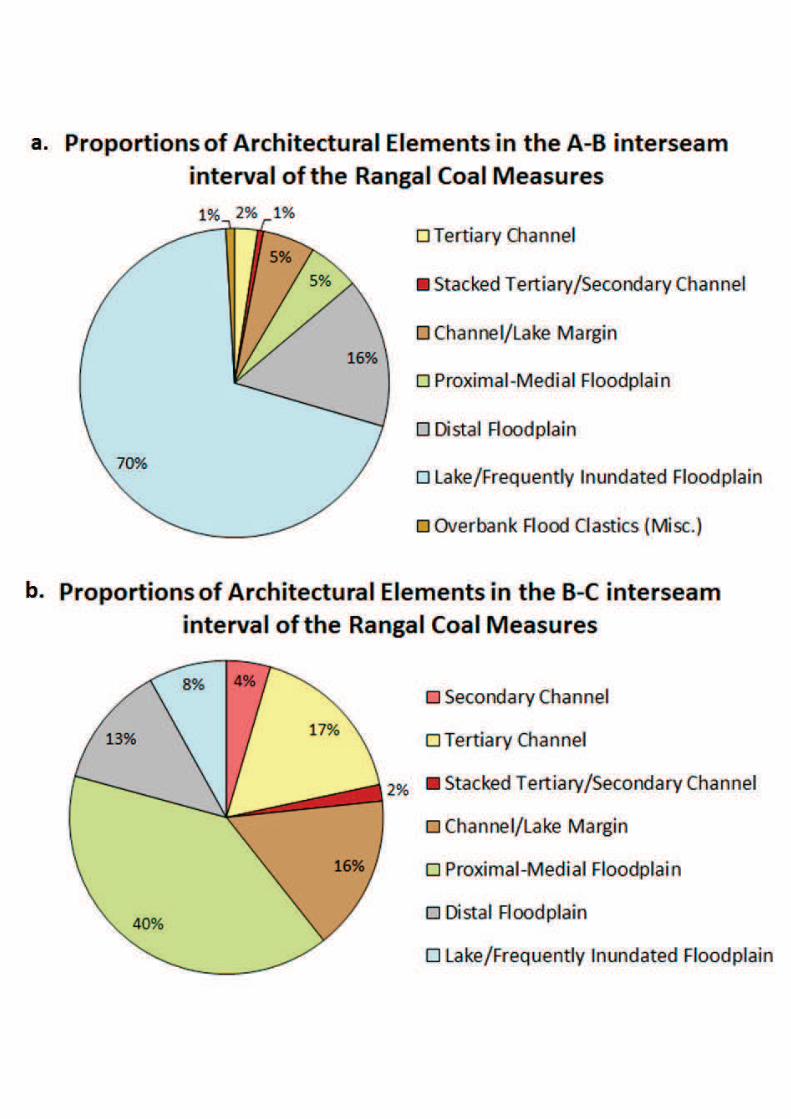
Element Proportions
Proportions of the A-B, and B-C interseam intervals infilled by each architectural
element were measured from their thicknesses in each interpreted well log (Fig.
7). Net:gross was calculated for each interval (A-C, A-B, B-C), taking only
'clean' (GR <90 API) sandstone as net. The correlation panel and fence
diagram (Figs. 5 & 6) demonstrate that the B-C interseam has a greater
proportion of channel elements and therefore a higher net:gross than the A-B
interseam.
Channel Element Thicknesses and Widths
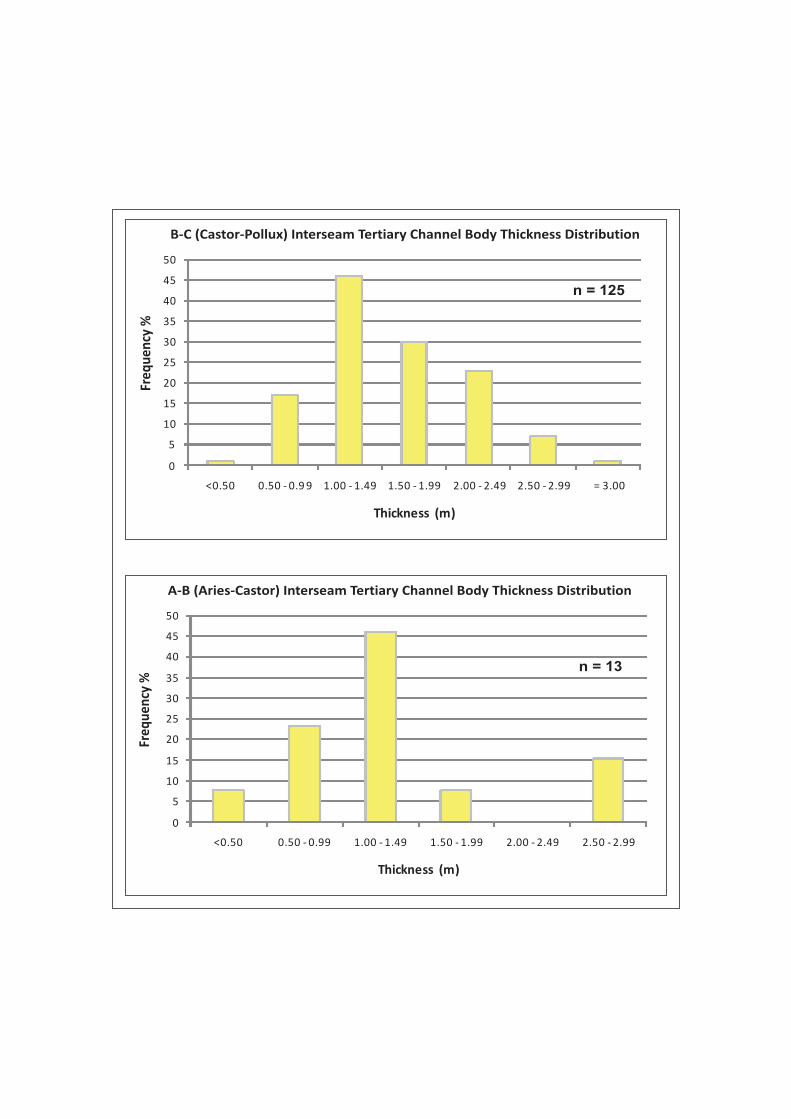
Channel-element thicknesses were determined from well logs. A frequency plot
reveals the distribution of the range of channel thicknesses (Fig. 8), where
frequency refers to the number of appearances in well logs. It was not possible
to measure channel-element widths using the well correlation data alone
because well spacing was greater than the width of the channel elements in
most cases, such that estimated widths measured from correlation panels
Page 10
9
effectively became a function of the well spacing rather than a true indicator of
channel-body width.
Interpretation
Analogue Measurements
In cases where it is not possible to directly derive all the information necessary
to build accurate reservoir models from available datasets, analogue data may
be used to approximate the missing parameters (e.g. plan-form geometry) that
cannot be determined from the primary subsurface dataset alone (Alexander,
1993; Lang et al. 2002). For overbank depositional systems whose constituent
architectural elements (e.g. floodplain and splay) are readily preserved, such as
those of the Rangal Coal Measures, modern analogues must be chosen from
relatively high-accommodation fluvial/fluvio-deltaic settings in which extensive
peat-forming processes are acting and for which frequent flooding, crevassing
and deposition occurs on the floodplain.
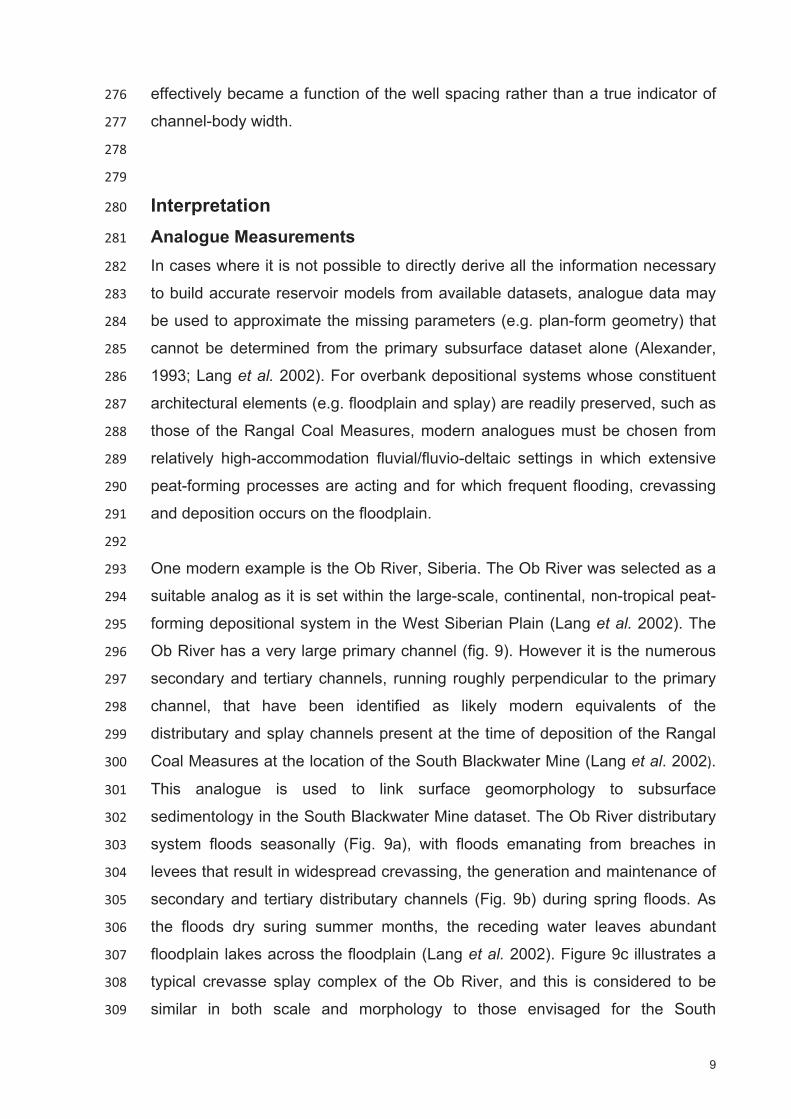
One modern example is the Ob River, Siberia. The Ob River was selected as a
suitable analog as it is set within the large-scale, continental, non-tropical peat-
forming depositional system in the West Siberian Plain (Lang et al. 2002). The
Ob River has a very large primary channel (fig. 9). However it is the numerous
secondary and tertiary channels, running roughly perpendicular to the primary
channel, that have been identified as likely modern equivalents of the
distributary and splay channels present at the time of deposition of the Rangal
Coal Measures at the location of the South Blackwater Mine (Lang et al. 2002 .
This analogue is used to link surface geomorphology to subsurface
sedimentology in the South Blackwater Mine dataset. The Ob River distributary
system floods seasonally (Fig. 9a), with floods emanating from breaches in
levees that result in widespread crevassing, the generation and maintenance of
secondary and tertiary distributary channels (Fig. 9b) during spring floods. As
the floods dry suring summer months, the receding water leaves abundant
floodplain lakes across the floodplain (Lang et al. 2002). Figure 9c illustrates a
typical crevasse splay complex of the Ob River, and this is considered to be
similar in both scale and morphology to those envisaged for the South
Page 11
10
Blackwater study succession, based on the similarity in scale of the various
architectural elements known from the two systems.
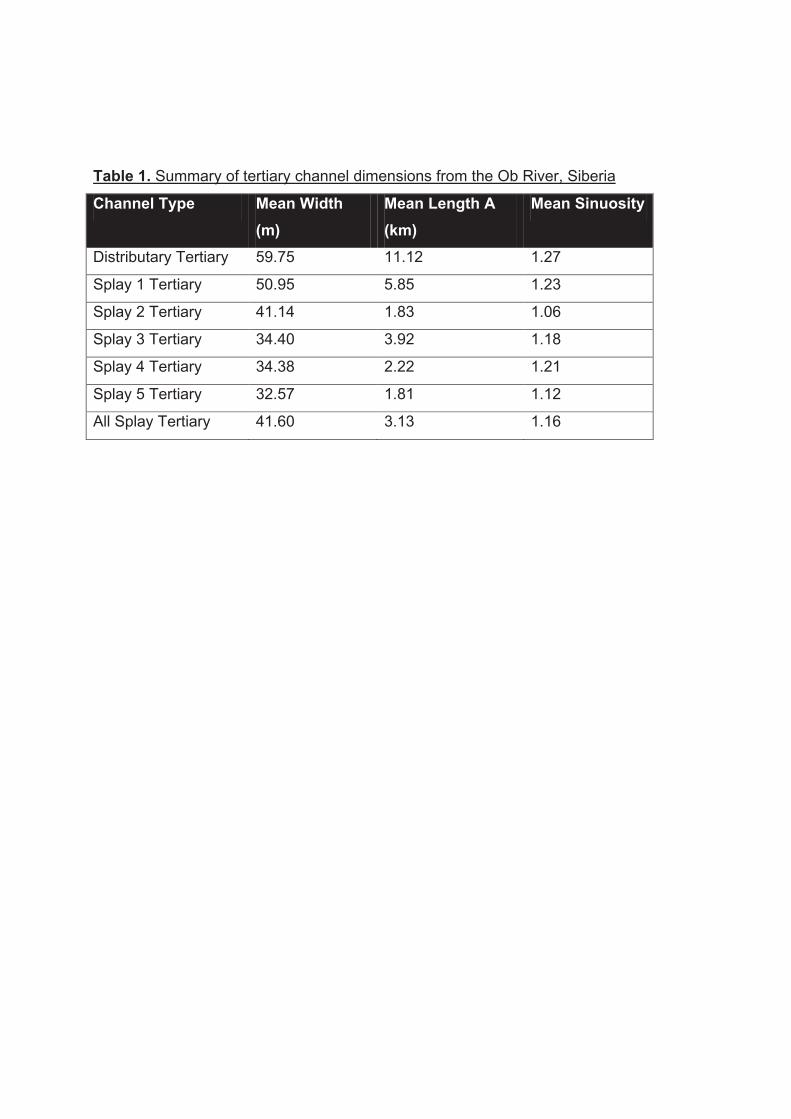
Measurement of the dimensions of the planform geometries of tertiary channels
of the Ob River (both splay and distributary), including width, length and
sinuosity, were taken from Google Earth aerial photographs (Table 1). Mean
sinuosity (1.16) and width (41.60 m) of splay channels (N = 43) was less than
that of the distributary tertiary channels (sinuosity = 1.27; width = 59.75 m, N =
24).
Modeling
The tertiary channels in the Ob River record little evidence for significant lateral
migration via the accretion of point-bar deposits, so preserved sediment
geometries assumed to be similar to those on the surface. Measurements of
the widths and sinuosities of active channels from the Ob River analogue were
therefore used in combination with the subsurface data, to derive estimates of
likely infill proportions and channel thickness:width relationships for the Rangal
Coal Measures. These were in turn used to define input ranges for stochastic
models of the interseams made using Reckonnect (fluvial stochastic modeling
software).
Reckonnect is a stochastic, object-based model that quickly models channel
bodies to assess the effect of changing channel body dimensions and
distributions on connectivity (Collinson & Preater). Models are created using
channel body thickness and channel percentage data from wells, and geometric
data (e.g. channel body width and sinuosity). Modelled output is simple, treating
all channel bodies as reservoir, and all other deposits (model background) as
non-reservoir. The models allow quantification of channel body connectivity, as
well as connectivity to pseudo-wells.
For each model run, graphic output from a a randomly selected run was
generated to illustrate the form of modeled channel geometries, and predicted
style of clustering, channel connectivity (where channel connectivity by volume
is defined as the mean percentage of sand connected to a random sandy point),
and channel-body percentages observed in pseudo-wells. Results demonstrate
Page 12
11
potential well connectivity to sand bodies in the model, where well connectivity
is defined as the probability (%) that pseudo-wells are connected by a
continuous sandy path (Fig. 10a).
Reckonnect is not suitable for modeling two types of channel simultaneously
(i.e. secondary and tertiary channels), and therefore models were built to
represent the distribution of tertiary channels, which make up a greater
proportion of interseam infill. In the A-B (Aries-Castor) interseam, infill by minor
channels is 2% by tertiary channels and <1% by secondary channels. In the B-
C (Castor-Pollux) interseam, the bias towards tertiary channels is greater with
17% infill by tertiary channels and 2% by secondary channels.
As both splay and distributary channels are identified in the South Blackwater
Mine (Avenell, 1998) and in the Ob River (Fig. 9), both of these fluvial styles
were modeled for the interseam deposits. Figures 10-12 show random
replications from modeling runs conducted with 100 replications in each run. As
well as the graphic output, Reckonnect also generates statistics covering
channel proportion, channel connectivity and sand connectivity to pseudo-wells
for each modeling run, summaries of which are given in tables 2-4. Model inputs
are listed in Tables 2a, 3a and 4a.
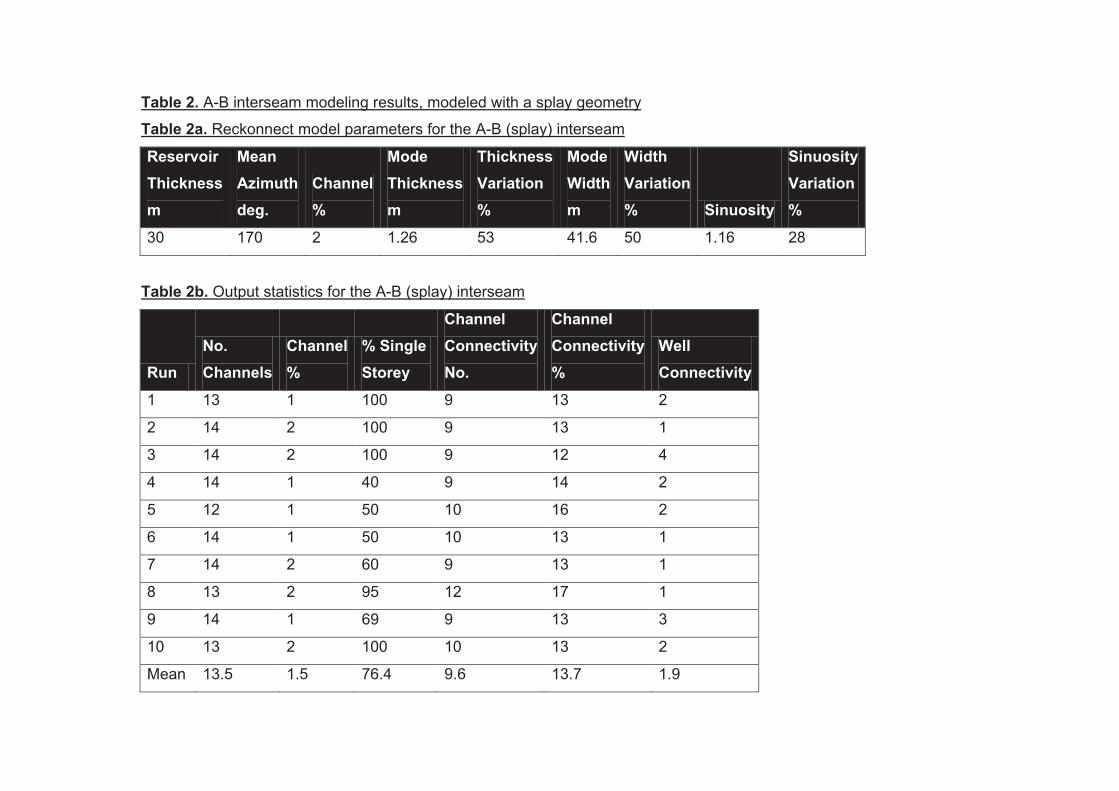
The sand-poor A-B interseam was modeled with a splay (fan-like) geometry
(Fig. 10b), whereby all modeled channels were forced to originate from a single
point; this is the most likely arrangement to account for the low proportion of
channel-infill and interpreted poor channel network development within the
modeled interseam volume. The B-C interseam was modeled with both splay
and distributary geometries, the latter type being characterized by channels that
have no fixed point of origin within the model.
Due to the low proportion (2%) of channel-body infill in the A-B interval, very few
channel bodies are modeled, and the majority (on average 87%) of those that
are present are isolated (i.e. are not in communication with another channel
body within the modeled interval) (Fig. 10b). Channel-body connectivity was low
across most of the model (mean channel-body connectivity = 13%). The
pseudo-wells demonstrate that, in both proximal and distal locations, wells are
Page 13
12
likely only to intersect isolated (i.e. non-clustered) channel bodies, if any, with
the mean well connectivity being only 1.9%.
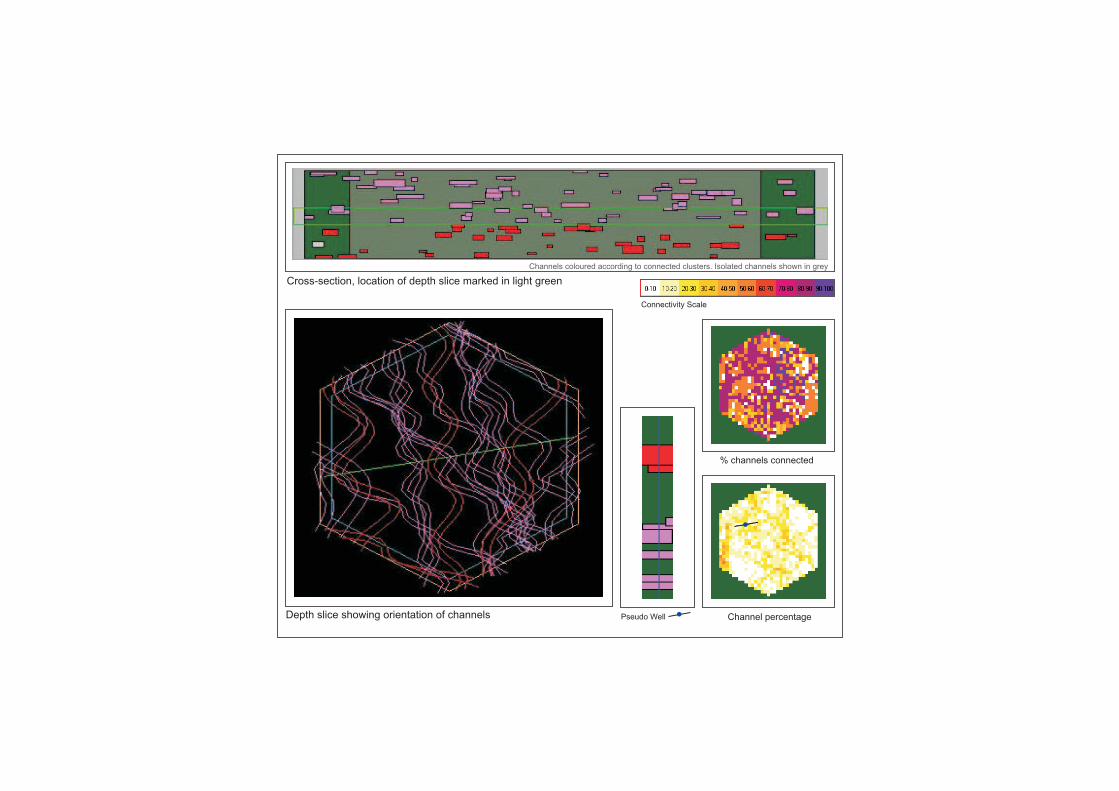
The B-C interseam, when modeled as a crevasse splay complex (Fig. 11),
displayed the following features compared to the model for the A-B interseam:
greater overall channel-body percentage (17%), greater mean channel-body
thickness (1.59 m), which resulted in higher mean connectivity of channel
bodies (22%) such that they formed multiple clusters of connected channel
bodies. As expected in a splay, channel-body connectivity decreased distally
and away from the axis of the splay, with isolated channel bodies more
commonly occurring towards the splay margins. Figure 11 demonstrates a
representative output from the B-C (splay) modeling runs: pseudo-wells
demonstrate that, for a proximal location, it is possible for wells to intersect
almost all of the channel clusters, whereas for distal locations, a well will
intersect fewer channel bodies, the majority of which are likely to be isolated.
Mean well connectivity is 46%: i.e. by intersecting channel clusters, a single well
would be predicted, on average, to be in communication with 46% of the
channel bodies modeled.
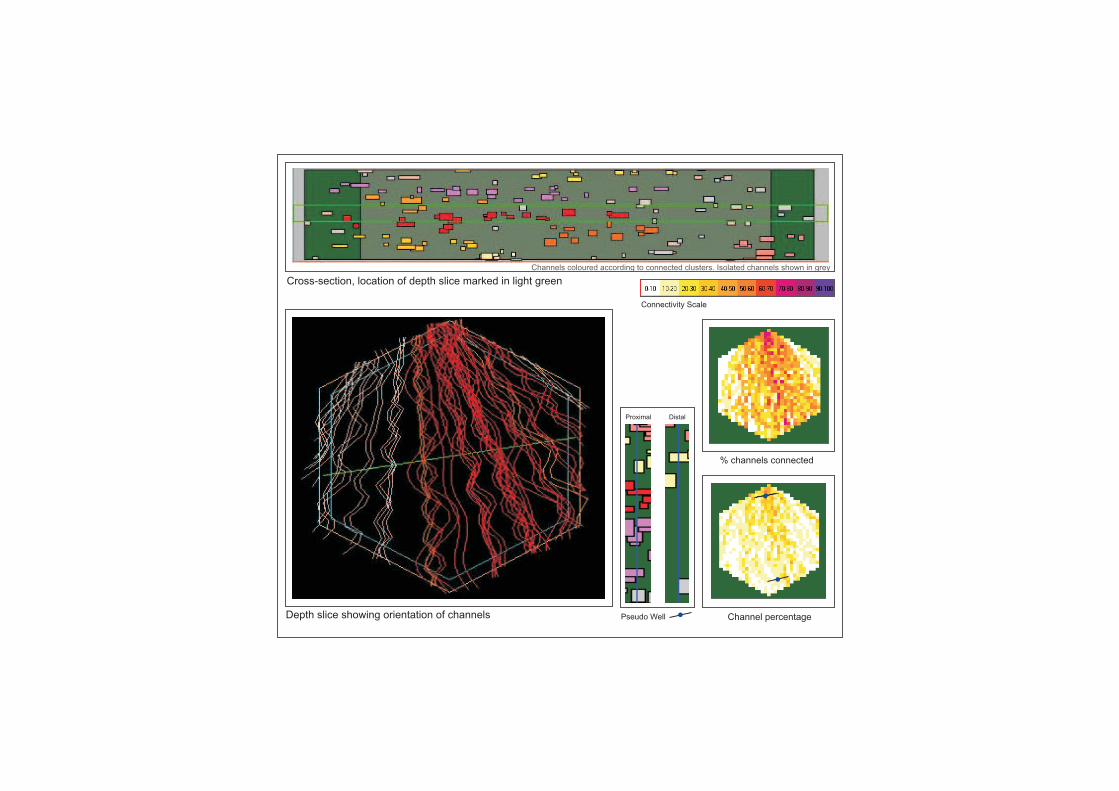
When modeled as a distributary system � i.e. where channels have no fixed
point of origin (Fig. 12) � the B-C interseam displayed the following features:
distributary tertiary channels were modeled with greater widths and sinuosities
than crevasse-splay channels, using width and sinuosity measurements
provided from the Ob River (Table 1). This resulted in greater amalgamation
and stacking of channel bodies and generated fewer but larger channel-body
clusters, yielding an average channel-body connectivity of 54% by volume.
Channel-body connectivity was distributed more randomly across the modeled
interval compared to that predicted by models of the interval that used a splay-
type geometry (Fig. 12, �% channels connected� inset figure). As a result,
pseudo-wells were, on average, likely to intersect all of the channel clusters,
yielding a mean well connectivity of 79.8%.
Discussion
Depositional Models
Page 14
13
Typical plan-form geometries of tertiary channel-body assemblages � i.e.
elements generated in splay complexes and distributary channel settings � from
the Ob River have been combined with channel body distributions resulting from
the random replications of stochastic modeling runs in order to propose three-
dimensional architectural models of the A-B (Aries-Castor) and B-C (Castor-
Pollux) interseam deposits of the Rangal Coal Measures succession.
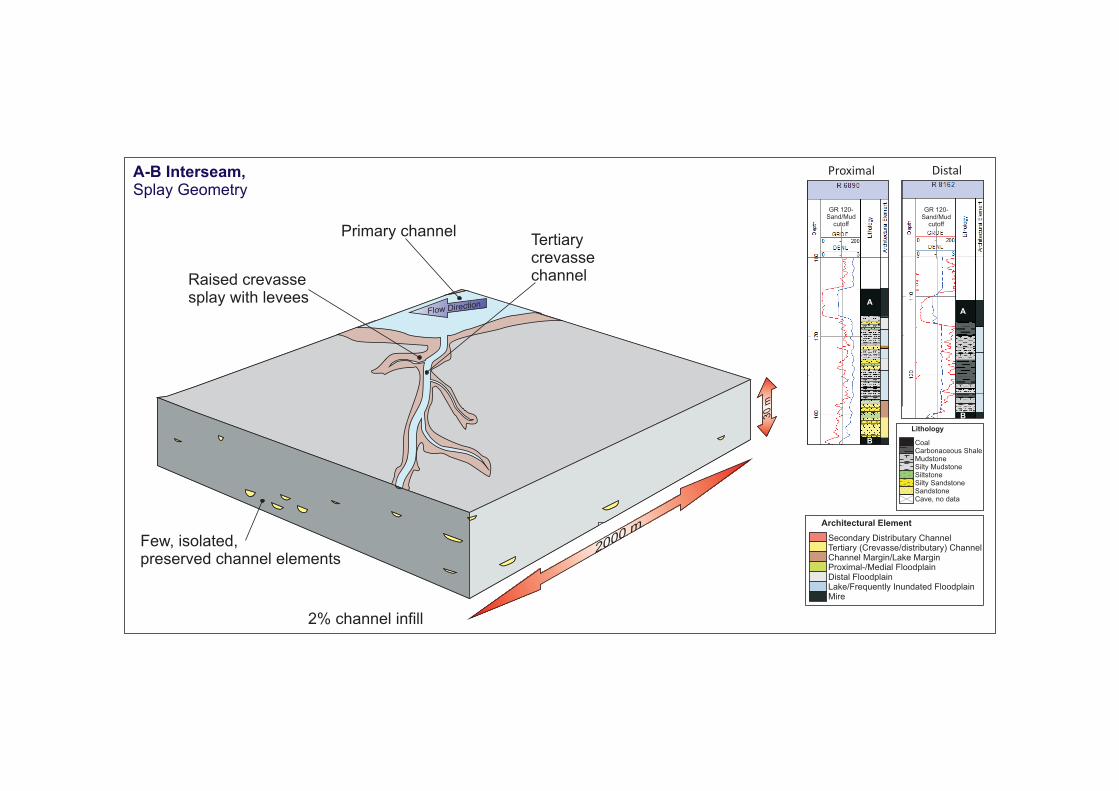
Upper (A-B interseam) interval: The A-B interseam is a poorly developed
crevasse splay complex, with few, poorly connected channel bodies in a very
low net:gross, distal floodplain setting (Fig. 13). Negligible connectivity is
predicted for this interval. Channel bodies are mostly immature, being poorly
developed, thin and isolated. The inset well-logs taken from the South
Blackwater Mine dataset demonstrate typical successions from the interval (Fig.
13). Channel bodies present are interpreted as small scale-tertiary channels
that abruptly grade laterally into channel-margin levee and lake-margin
deposits.
The difference in fluvial style between A-B interseam deposits and the lower
B-C interseam deposits may be attributed to a number of factors. The deposits
could have formed during an episode of increased rate of accommodation
creation, resulting in drowning of mires, splays and more medial floodplain
deposits, thereby preferentially preserving distal floodplain deposits, rather than
primary channel deposits.
Lower (B-C interseam) interval: The B-C (Castor-Pollux) interseam can be
interpreted as large, well-developed crevasse splay complex (Fig. 14), which
evolved over time to preserve a network of interconnected splay-channel
elements in a medial floodplain setting (similar to those seen in the Ob River).
Connectivity likely exhibits a large spatial variation, being significantly greater in
proximal positions, where channels are more closely clustered adjacent to the
source of the splay. The inset wireline well logs demonstrate typical medial and
distal successions from the interval (Fig. 14).
The B-C interseam can alternatively be interpreted as a complex assemblage of
bifurcating, meandering distributary channel bodies (Fig. 15). Distributary
Page 15
14
channel bodies interpreted from this part of the succession are considered to be
of low sinuosity (Fielding et al. 1993). A network of distributary-channel
elements will have a higher overall connectivity, and a more random distribution
of connectivity than channel elements modeled as a crevasse-splay
morphology.
A network of distributary channels originating at various points along a reach of
the larger primary channel might explain the large number of channel bodies
observed in the subsurface succession, in contrast to the relatively channel-
poor overlying A-B interseam. The inset well-logs demonstrate successions
predicted at various locations in such a system. Deposits in the South
Blackwater Mine dataset generally grade laterally from channel element, to
channel-margin element, to medial floodplain element, and locally to distal
floodplain element (Avenell 1998). The B-C interseam is considered to be
closely analogous to the floodplain morphology of the modern Ob River.
Limitations of data
The principal limitation for this study is the limited lateral extent of the data,
leading to uncertainty as to where the data is situated in the overall depositional
system, and how representative of that system it is. A single splay in the Ob
River (Fig. 9c) is 4000 m by 5000 m, yet the entire study area at South
Blackwater Mine measures only 1000 m by 2000 m. Thus, the predictions of
subsurface fluvial architecture arising from this study could represent only a
small portion of a much larger distributary system, so care must be taken when
extrapolating interpretations made from such small sub-sections of what is
overall a much larger fluvial system. This may explain the contrasting styles of
deposition interpreted in the A-B and B-C interseams, including the observed
differences in the proportions of overall channel bodies � 2% versus 17%,
respectively.
Although apparently an extremely low net:gross interval, with negligible
reservoir potential, the A-B interseam examined in the study area might
represent a low net:gross fluvio-lacustrine environment located in a floodplain
setting, at a stratigraphic level which overall has a greater reservoir potential
Page 16
15
elsewhere within the larger system. Analysis of a larger dataset from a wider
spatial area could provide additional insight into the regional variability of such
systems.
Conclusions
Subsurface datasets, even those of relatively high resolution such as the closely
spaced coal mine wells of the South Blackwater Mine, may still not provide data
of sufficient density of coverage to accurately resolve small-scale (tertiary)
channel-element dimensions in floodbasin settings. Where the spacing of
subsurface wells is greater than the mean width of any channel elements
present, modern analogues can be a useful tool in supplementing the primary
dataset to yield information regarding likely analogous plan-form geometries.
Simple models created using Reckonnect reservoir modeling software
demonstrate some characteristic features of channel connectivity in small-scale
distributary fluvial systems developed in floodbasin settings, such as those of
the Rangal Coal Measures succession: (i) channel-body connectivity is more
uniform in distributary river systems than in splay complexes; (ii) relatively good
connectivity is seen in proximal positions in splays, but decreases distally from
the source as channel elements diverge; (iii) connectivity tends to be greater
down the axis of splays, with more isolated channel bodies occurring at the
margins.
Good connectivity between channel bodies is expected in some cases (e.g. in
the B-C interseam, which has a 17% channel proportion). However, where
channel percentage is very low, as in the A-B interseam, connectivity between
channel bodies is negligible. It is therefore vital to accurately constrain the
proportions of infill by each architectural element in the system, in order to
produce models with realistic channel-body distributions and connectivities.
Care must be taken when extrapolating findings from small datasets to a larger
scale, as a small dataset may provide a biased, non-representative
representation of the subsurface at a regional scale. This may be of particular
relevance in petroleum exploration, where seismic datasets typically cannot
resolve small-scale channel elements, and where well data are sparse,
Page 17
16
potentially leading to biased estimations of architectural-element proportions,
especially where inappropriate analogues have been used to provide
supplementary data.
Acknowledgments
This work was funded through the sponsorship of the Fluvial Research Group at
the University of Leeds by Areva, BHP Billiton, ConocoPhillips, Nexen, Saudi
Aramco, Shell and Woodside. Open-release subsurface data from the Rangal
Coal Measures (released for Avenell in 1998 by BHP) were provided by
Woodside. This work has benefited from an earlier study by Avenell (1998), the
borehole dataset being a subset of that used by Avenell. Woodside provided
logistical support to assist in gaining access to the data. The authors thank John
Preater for the provision of Reckonnect® modeling software.
References
Alexander, J., 1993, A discussion on the use of analogues for reservoir geology:
Geological Society Special Publications, v. 69, p. 175-194.
Allen, J. P., and C. R. Fielding, 2007, Sequence architecture within a low-
accommodation setting: An example from the Permian of the Galilee and
Bowen basins, Queensland, Australia: AAPG Bulletin v. 91, p. 1503-
1539.
Avenell, L. C., 1998, The South Blackwater Reservoir Analogue Project
(Thesis), Queensland University of Technology, Brisbane, 70 p.
Benedetti, M. M., 2003. Controls on overbank deposition in the Upper
Mississippi River. Geomorphology, v. 56 (3-4), p. 271-290.
Bourquin, S., S. Peron, and M. Durand, 2006, Lower Triassic sequence
stratigraphy of the western part of the Germanic Basin (west of Black
Forest): Fluvial system evolution through time and space: Sedimentary
Geology, v. 186, p. 187-211.
Bridge, J. S., and R. S. Tye, 2000, Interpreting the Dimensions of Ancient
Fluvial Channel Bars, Channels, and Channel Belts from Wireline-Logs
and Cores: AAPG Bulletin, v. 84, p. 1205-1228.
Brierley, G. J., R. J. Ferguson, and K. J. Woolfe, 1997, What is a fluvial levee?:
Sedimentary Geology, v. 114, p. 1-9.
Page 18
17
Bristow, C. S., and J. L. Best, 1993, Braided rivers: perspectives and problems:
Geological Society Special Publications, v. 75, p. 1-11.
Bristow, Skelly, and Ethridge, 1999, Crevasse splays from the rapidly
aggrading, sand-bed, braided Niobrara River, Nebraska: effect of base-
level rise: Sedimentology, v. 46, p. 1029-1047.
Cazanacli, D. & N. D., Smith, 1998. A study of morphology and texture of
natural levees - Cumberland Marshes, Saskatchewan, Canada.
Geomorphology, v. 25 (1-2), p. 43-55.
Collinson, J. & J. Preater, Reckonnect® Connectivity modelling software:
http://www.reckonnect-software.com/
Ethridge, F. G., and S. A. Schumm, 2007, Fluvial seismic geomorphology: a
view from the surface: Geological Society, London, Special Publications,
v. 277, p. 205-222.
Ethridge, F. G., L. J. Wood, and S. A. Schumm, 1998, Cyclic variables
controlling fluvial sequence development: Problems and Perspectives:
SEPM Special Publication, v. 59, p. 17-29.
Farrell. K. M., 2001, Geomorphology, facies architecture, and high-resolution,
non-marine sequence stratigraphy in avulsion deposits, Cumberland
Marshes, Saskatchewan. Sedimentary Geology, v. 139 p. 93-150.
Fielding, C. R., 1986, Fluvial channel and overbank deposits from the
Westphalian of the Durham coalfield, NE England: Sedimentology, v. 33,
p. 119-140.
Fielding, C. R., A. J. Falkner, and S. G. Scott, 1993, Fluvial response to
foreland basin overfilling; the Late Permian Rangal Coal Measures in the
Bowen Basin, Queensland, Australia: Sedimentary Geology, v. 85, p.
475-497.
Lang, S. C., J. Kassan, J. Benson, C. Grasso, T. Hicks, N. Hall, and C. Avenell,
2002, Reservoir Characterisation of Fluvial, Lacustrine and Deltaic
Successions - Applications of Modern and Ancient Geological
Analogues: Proceedings, Indonesian Petroleum Association, v. 1, p. 557-
578.
Marenessi, S. A., C. O. Limarino, A. Tripaldi, and L. I. Net, 2005, Fluvial
systems variations in the Rio Leona Formation: Tectonic and eustatic
controls on the Oligocene evolution of the Austral (Magallanes) Basin,
Page 19
18
southernmost Argentina: Journal of South American Earth Sciences, v.
19, p. 359-372.
Miall, A. D., 1985, Architectural-Element Analysis: A New Method of Facies
Analysis Applied to Fluvial Deposits: Earth-Science Reviews, v. 22, p.
261-308.
Michaelsen, P., R. A. Henderson, P. J. Crosdale, and S. O. Mikkelsen, 2000,
Facies Architecture and Depositional Dynamics of the Upper Permian
Rangal Coal Measures, Bowen Basin, Australia: Journal of Sedimentary
Research, v. 70, p. 879-895.
Morozova, G. S., and N. D. Smith, 2000, Holocene avulsion styles and
sedimentation patterns of the Saskatchewan River, Cumberland
Marshes, Canada: Sedimentary Geology, v. 130, p. 81-105.
Mutton, A. J. (Compiler), 2003, Queensland Coals 14th Edition, Queensland
Department of Natural Resources and Mines. Smith, N. D., T. A. Cross,
J. P. Dufficy, and S. R. Clough, 1989, Anatomy of an avulsion:
Sedimentology, v. 36, p. 1-23.
Smith, N. D., and M. Pérez-Arlucea, 1994, Fine-Grained Splay Deposition in the
Avulsion Belt of the Lower Saskatchewan River, Canada: Journal of
Sedimentary Research, v. 64B, p. 159-168.
Smith, N. D., T. A. Cross, J. P. Dufficy, and S. R. Clough, 1989. Anatomy of an
avulsion. Sedimentology, v36 (1), p. 1-23.
Page 20
Table Captions
Table 1. Summary of tertiary channel dimensions from the Ob River, Siberia.
Table 2. A-B interseam modeling results for a splay-type geometry.
Table 3. B-C interseam modeling results for a splay-type geometry.
Table 4. B-C interseam modeling results for a distributary-type geometry.
Figure Captions
Fig. 1. Schematic diagram illustrating the typical facies associations and
architectural elements encountered in a low net:gross fluvial overbank environment.
Fig. 2. Location of the Bowen Basin and South Blackwater Mine. Adapted from Allen
& Fielding (2007) and Fielding et al. (1993).
Fig. 3. Tectonostratigraphic chart detailing tectonic phases in the Bowen Basin
region and their relationship to corresponding formations. Rangal Coal Measures are
highlighted. Adapted from Allen & Fielding (2007).
Fig. 4. Architectural element scheme of the fluvial and overbank deposits of the
Rangal Coal Measures present in the interseam packages of the South Blackwater
Mine, Queensland (Adapted in part from Avenell 1998). Lithologies and architectural
elements assigned using gamma-ray (GRDE) and density (DENL) logs.
Fig. 5. Correlation panel from the NE of the study area (location circled on the inset
map), demonstrating negligible net:gross A-B interseam and low-to-moderate
net:gross B-C interseam, where both tertiary and secondary channels are present.
Location of the correlation is shown in the inset map, as is the location of the fence
diagram (Fig. 6). Wireline log abbreviations: GRDE (gamma ray, API units), DENL
(density), CADE (caliper).
Page 21
Fig. 6. Fence diagram demonstrating presumed 3D spatial geometry of elements.
Laterally continuous fine-grained floodplain deposits are accurately correlated. Well
spacing was too wide (50 m to 250 m) to accurately correlate tertiary channels,
which globally are typically less than 250m width (Gibling 2006). Attempts to
correlate individual channel bodies has lead to some unrealistic correlations.
Negligible net: gross in A-B interseam, 20% net:gross in B-C interseam.
Fig. 7. Well logs provided proportions of infill by each architectural element in both
(a) the Aries-Castor (A-B) interseam and (b) the Castor-Pollux (B-C) interseam.
Proportions measured by thickness of occurrence in studied well logs. The A-B
interseam is dominated by distal deposits, with only 2% tertiary channel infill,
whereas the B-C interseam is dominated by medial deposits, with 17% tertiary
channel infill.
Fig. 8. Tertiary channel element thickness data taken from well logs in both the A-B
and B-C interseams.
Fig. 9. (a) Overview image of the Ob River, Siberia. This large-scale, distributary
system has a up to 40 km-wide floodplain. The primary channel is low sinuosity, over
1 km wide, and numerous secondary distributary and tertiary (distributary and
crevasse) channels are present. (b) A typical crevasse splay from the Ob River,
Siberia, measuring 5 km in length. Green areas represent the raised crevasse
complex, and tertiary channel levees. Dark areas of the floodplain are inundated by
spring flood waters. (c) Secondary and tertiary distributary channels in the Ob River,
Siberia. Channels exhibit a range of sinuosities and bifurcations are common. Splay
complexes exhibit a fractal nature, with mini �splays� often originating from larger
splay complexes and tertiary channels.
Fig. 10. (a) Schematic diagram explaining the graphic outputs of Reckonnect
modeling runs used in Figs. 10b-12. The graphic output represents one random
replication out of 100 iterations made in each modeling run. (b) Graphic output of a
random replication from a Reckonnect modeling run, representing the A-B
interseam, with a splay geometry. With only 2% channel infill in the interval, the
cross-section shows very few channels, the majority of which are isolated (shown in
Page 22
grey). The depth slice demonstrates channel orientations and geometries (depth
slice location shown in light green on the cross-section). The connectivity scale can
be used to interpret the channel connectivity and channel percentage outputs:
Channel connectivity is negligible across most of the model. Mean channel
connectivity is 11%; i.e. 11% of the 2% of the model infilled by channel bodies is
connected. In this scenario, only 0.02% of the modeled interval is represented by
reservoir-quality sand bodies that are in some way connected. The pseudo wells
demonstrate that in both proximal and distal locations, the well is likely only to
intersect isolated channels, if any. Table 2c shows the statistical output from this
replication.
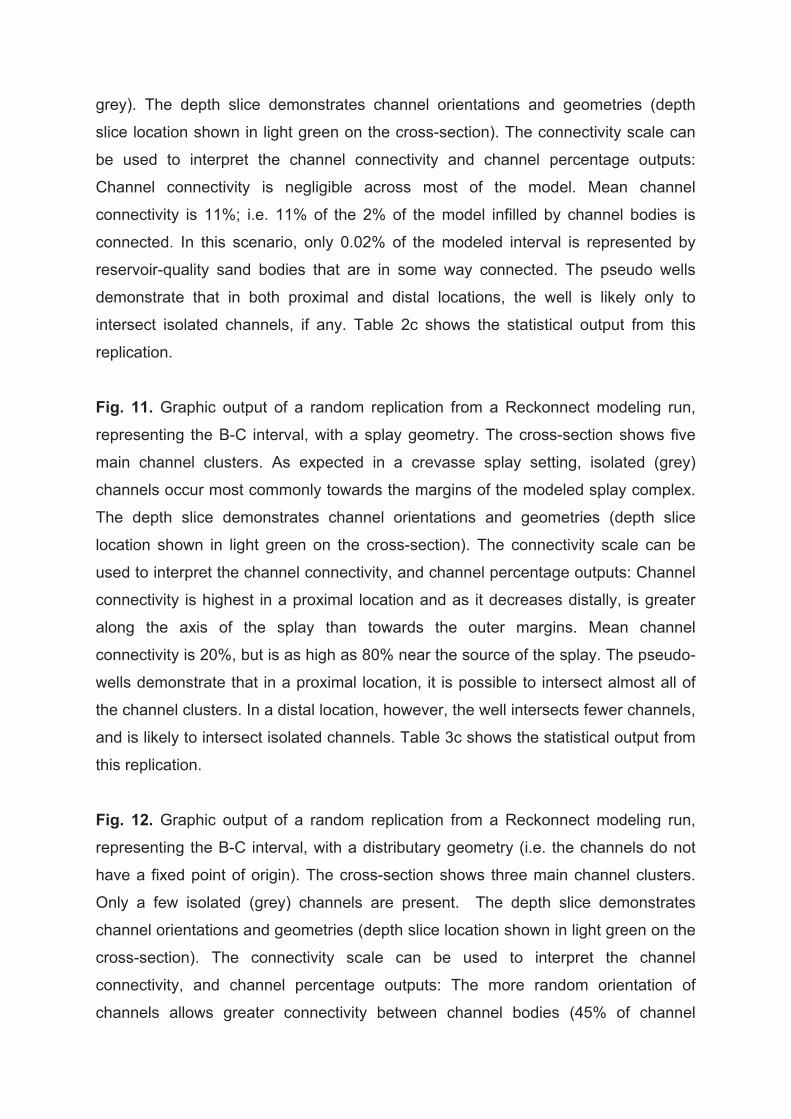
Fig. 11. Graphic output of a random replication from a Reckonnect modeling run,
representing the B-C interval, with a splay geometry. The cross-section shows five
main channel clusters. As expected in a crevasse splay setting, isolated (grey)
channels occur most commonly towards the margins of the modeled splay complex.
The depth slice demonstrates channel orientations and geometries (depth slice
location shown in light green on the cross-section). The connectivity scale can be
used to interpret the channel connectivity, and channel percentage outputs: Channel
connectivity is highest in a proximal location and as it decreases distally, is greater
along the axis of the splay than towards the outer margins. Mean channel
connectivity is 20%, but is as high as 80% near the source of the splay. The pseudo-
wells demonstrate that in a proximal location, it is possible to intersect almost all of
the channel clusters. In a distal location, however, the well intersects fewer channels,
and is likely to intersect isolated channels. Table 3c shows the statistical output from
this replication.
Fig. 12. Graphic output of a random replication from a Reckonnect modeling run,
representing the B-C interval, with a distributary geometry (i.e. the channels do not
have a fixed point of origin). The cross-section shows three main channel clusters.
Only a few isolated (grey) channels are present. The depth slice demonstrates
channel orientations and geometries (depth slice location shown in light green on the
cross-section). The connectivity scale can be used to interpret the channel
connectivity, and channel percentage outputs: The more random orientation of
channels allows greater connectivity between channel bodies (45% of channel
Page 23
bodies are connected). There is also a more random spread of connectivities and
channel percentages in the model. Mean channel connectivity is 45%, but is as high
as 90-100% in some areas. The pseudo-well demonstrates that it is possible to
intersect the two largest channel clusters, so that the pseudo well is in
communication with 77% of the channel bodies. Table 4c shows the statistical output
from this replication.
Fig. 13. Simplified 3D architectural model of the Aries [A] - Castor [B] seam interval,
incorporating planform geometries from modern analogues, and channel element
dimensions and distributions from Reckonnect modeling. Analysis of wireline-log
data indicates that silty mudstones, mudstones and claystones dominate the interval;
typical of distal floodplain and lacustrine deposits. The inset logs are examples of
proximal and distal logs from the A-B interseam. Tertiary channel elements present
in the interval tend to be isolated, and are interpreted as small-scale, crevasse splay
channels, bordered by leveed channel-margin deposits. Channelised elements are
attributed to the distributary fluvial system that was responsible for drowning out the
B seam peat mire environment.
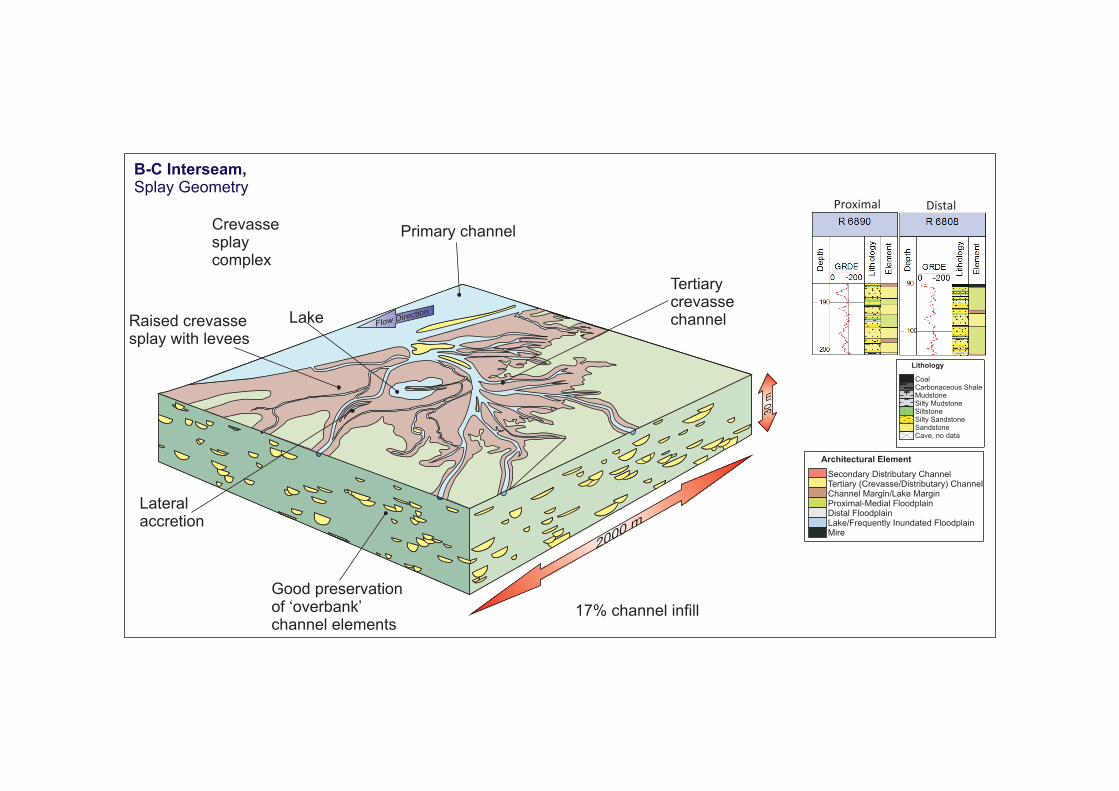
Fig. 14. Simplified 3D architectural diagram for the B-C interseam, with tertiary
channels present as leveed crevasse splay channels. The diagram incorporates
planform geometries of the Ob River modern analogue with channel distributions
inline with model outputs from Reckonnect. Medial floodplain deposits are
dominantly preserved. Isolated channels tend towards the margins of the splay, with
connectivity decreasing distally from the splay source. There is overlapping of
channels (as demonstrated by the BC1 modeling run, Fig. 11). The connectivity
between channel bodies may be further enhanced by potential connectivity through
fine sand or silty-sand splay stacks. The inset well log sections illustrate anticipated
proximal and distal well logs for such a splay-based system.
Fig. 15. Simplified 3D architectural diagram for the B-C interseam, with tertiary
channels present as leveed, meandering, bifurcating distributary channels. The
diagram incorporates planform geometries of the Ob River modern analogue with
channel distributions inline with model outputs from Reckonnect. Medial floodplain
deposits are dominantly preserved. Some channels are isolated, however
Page 24
connectivity is good where channels overlap. The inset well log sections illustrates
relatively high net:gross areas anticipated within the system.
Page 25
Table 1. Summary of tertiary channel dimensions from the Ob River, Siberia
Channel Type Mean Width
(m)
Mean Length A
(km)
Mean Sinuosity
Distributary Tertiary 59.75 11.12 1.27
Splay 1 Tertiary 50.95 5.85 1.23
Splay 2 Tertiary 41.14 1.83 1.06
Splay 3 Tertiary 34.40 3.92 1.18
Splay 4 Tertiary 34.38 2.22 1.21
Splay 5 Tertiary 32.57 1.81 1.12
All Splay Tertiary 41.60 3.13 1.16
Page 26
Table 2. A-B interseam modeling results, modeled with a splay geometry
Table 2a. Reckonnect model parameters for the A-B (splay) interseam
Reservoir
Thickness
m
Mean
Azimuth
deg.
Channel
%
Mode
Thickness
m
Thickness
Variation
%
Mode
Width
m
Width
Variation
% Sinuosity
Sinuosity
Variation
%
30 170 2 1.26 53 41.6 50 1.16 28
Table 2b. Output statistics for the A-B (splay) interseam
Run
No.
Channels
Channel
%
% Single
Storey
Channel
Connectivity
No.
Channel
Connectivity
%
Well
Connectivity
1 13 1 100 9 13 2
2 14 2 100 9 13 1
3 14 2 100 9 12 4
4 14 1 40 9 14 2
5 12 1 50 10 16 2
6 14 1 50 10 13 1
7 14 2 60 9 13 1
8 13 2 95 12 17 1
9 14 1 69 9 13 3
10 13 2 100 10 13 2
Mean 13.5 1.5 76.4 9.6 13.7 1.9
Page 27
Table 2c. Output statistics for the A-B (splay) random replication (Fig. 10b).
Run
No.
Channels
Channel
%
Channel
Connectivity
No.
Channel
Connectivity
%
Well
Connectivity
3 18 2 7 11 1
Page 28
Table 3. B-C interseam modeling results, modeled with a splay geometry
Table 3a. Reckonnect model parameters for the B-C (splay) interseam
Reservoir
Thickness
m
Mean
Azimuth
deg.
Channel
%
Mode
Thickness
m
Thickness
Variation
%
Mode
Width
m
Width
Variation
% Sinuosity
Sinuosity
Variation
%
30 170 17 1.59 40 41.6 50 1.2 28
Table 3b. Output statistics for the B-C (splay) interseam
Run
No.
Channels
Channel
%
%
Single
Storey
Channel
Connectivity
No.
Channel
Connectivity
%
Well
Connectivity
1 130 14 14 14 20 44
2 131 16 85 14 20 47
3 130 14 87 14 19 42
4 136 15 84 15 22 51
5 128 14 84 12 20 45
6 132 15 85 18 26 59
7 134 17 82 20 29 47
8 130 15 82 16 24 44
9 123 15 85 14 20 40
10 128 15 83 15 21 42
Mean 130.2 15 77.1 15.2 22.1 46.1
Page 29
Table 3c. Output statistics for the B-C (splay) random replication (Fig. 11).
Run
No.
Channels
Channel
%
Channel
Connectivity
No.
Channel
Connectivity
%
Well
Connectivity
2 141 15 15 20 53
Page 30
Table 4. B-C interseam modeling results, modeled with a distributary geometry
Table 4a. Reckonnect model parameters for the B-C (distributary) interseam
Reservoir
Thickness
m
Mean
Azimuth
deg.
Channel
%
Mode
Thickness
m
Thickness
Variation
%
Mode
Width
m
Width
Variation
% Sinuosity
Sinuosity
Variation
%
30 170 17 1.59 40 59.8 50 1.3 28
Table 4b. Output statistics for the B-C (distributary) interseam
Run
No.
Channels
Channel
%
%
Single
Storey
Channel
Connectivity
No.
Channel
Connectivity
%
Well
Connectivity
1 90 15 86 38 43 83
2 94 17 84 63 68 88
3 89 15 84 51 57 80
4 89 14 90 42 48 74
5 96 17 83 51 54 83
6 90 16 86 43 45 71
7 87 16 85 43 47 80
8 98 17 79 64 70 85
9 94 15 83 45 52 77
10 93 16 82 52 59 77
Mean 92 15.8 84.2 49.2 54.3 79.8
Page 31
Table 4c. Output statistics for the B-C (distributary) random replication (Fig. 12).
Run
No.
Channels Channel %
Channel
Connectivity
No.
Channel
Connectivity
%
Well
Connectivity
1 92 12 39 45 77
Page 32
Crevasse splay complex
Tertiary splay channel
Secondary distributary channel
Lake
Channel margin/levee
Medial-to-distal
floodbasin and mire
Tertiary distributary channel
Not-To-Scale
Primary channel
Page 33
BRISBANE
SYDNEY
GalileeBasin
Cooper Basin
Bo
we
n B
asin
QLD
WA
NT
SA
NSW
VIC
ROCKHAMPTON
Syd
ney
Ba
sin
SOUTH
BLACKWATER
MINE
1000 km
Page 34
Ran
gal C
oal
Measu
res
PERIOD
EPOCH
AGE
FO
RM
AT
ION
Arc VolcanismArc Volcanism
Early Middle Late
Page 35
?
?
?
?
?
>3 m-thicknesssandstoneSharp/erosional baseFining-upBlocky or bell-shapedgamma response<90 API GR
Secondary Channel
?
?
?
?
?
<3 m-thicknesssandstoneTypically sharp-basedFining-up to clayey,silty-sandstoneSquat, blocky or bell-shaped gammaresponse<110 API GR
Tertiary Channel
?
?
Interbeddedsandstones andsiltstones withclaystone drapesPrograding(coarsening-up) logsignature attributed tolevees and crevassesplay deposits
Channel/Lake Margin
?
?
Interlaminatedsandstone, claystoneand clay-rich partingsHighly variable logpattern attributed tosplays and flooding
Proximal-Medial Floodplain
?
?
?
Laminated siltstonesand mudstonesGR log signaturegenerally >110 API GRMinor sandstonesattributed to distalcrevasse splays
Distal Floodplain
?
?
?
Interlaminatedclaystones,mudstones and siltymudstonesOccasional lenses ofsiltstone andsandstone>110 API GR
Lake
?
?
?
Coals formed in peatmiresBlocky, low GR logsignature in goodquality coalsLow DENL responsedistinguishes coalfrom sandstone
Mire
?
?
?
?
Blocky, fining-up logsignature<90 API GR>6 m-thicknesssandstone
Not seen in the A-Cinterseam
Primary Channel Key
Secondary Distributary ChannelTertiary Crevasse/Distributary ChannelChannel Margin/Lake MarginProximal-Medial FloodplainDistal FloodplainLake/Frequently Inundated FloodbasinMireSheet-like Fluvial Channel
Page 36
Architectural Element
Facies 1: Sheet-like Fluvial ChannelFacies 2: Heterolithic Distributary ChannelFacies 3: Minor Crevasse ChannelFacies 4: Channel Margin/Lake MarginFacies 5: Proximal-Medial FloodplainFacies 6: Distal FloodplainFacies 7: Lake/Frequently Inundated FloodplainFacies 8: MireFacies 9: Overbank Coarser Flood DepositsFacies 3a: Stacked Crevasse Channel/Distributary Channel
Lithology
CoalCarbonaceous ShaleMudstoneSilty MudstoneSiltstoneSilty SandstoneSandstoneCave, no data
Key 100 mScale(between well pannels)
10 m
10 m
Castor [B] seam
Pollux [C] seam
Aries [A] seam
0 500
metres
7,3
54,0
00
7,3
55,0
00
686,000 687,000 688,000
Fig. 5 wellsFig. 6 wells
Page 39
0
5
10
15
20
25
30
35
40
45
50
<0.50 0.50 - 0.9 9 1.00 - 1.49 1.50 - 1.99 2.00 - 2.49 2.50 - 2.99 = 3.00
Thickness (m)
B-C (Castor-Pollux) Interseam Tertiary Channel Body Thickness Distribution
Fre
qu
en
cy %
n = 125
0
5
10
15
20
25
30
35
40
45
50
<0.50 0.50 - 0.99 1.00 - 1.49 1.50 - 1.99 2.00 - 2.49 2.50 - 2.99
Thickness (m)
A-B (Aries-Castor) Interseam Tertiary Channel Body Thickness Distribution
Fre
qu
en
cy %
n = 13
Page 40
50 km
Fig. 9a
Ob River, Overview
Dominant splay channel:20.6 km channel length33 m-wide1.17 sinuositySupported by (sandy) levees
5 km
Ob River primary channel
Floodplain inundated by seasonal flood
Ob River, Splay Analogue
Fig. 9b
Crevasse splay
Mean channel sinuosity 1.23Mean channel width 51 m
Secondarydistributary channel183 m-wide
1350 m
20km
Ob River primarychannel
5 km
Ob River, Distributary Analogue
Fig. 9c
9b
9c
Page 41
Connectivity Scale
Cross-section, location of depth slice marked in light green
Depth slice showing orientation of channels Pseudo Well
% channels connected
Channel percentage
Channel bodies are shown as rectangles. Channel bodies in the same colour belong to the same cluster, andare connected within the modelled interval. Isolated (unconnected) channels are shown in grey.
Location of a depth slice taken through the model is shown as between 2 depth markers
A depth slice taken through the model shows the orientationand geometry of channels between the two depth markersshown on the cross-section. Channel outlines are shown,coloured according to the cluster to which they belong
A pseudo-well(location shown onthe channelpercentage output)shows whichchannel bodies maybe intersected by awell at a givenlocation.
The percentage of allchannels modelled inconnection at each pointthroughout the model isshown. Colour correspondsto the connectivity scale(above)
The proportion of themodel infilled by channelbodies ish shown at eachpoint throughout themodel. Colour correspondsto the connectivity scale(above)
Fig. 10a
Connectivity Scale
Cross-section, location of depth slice marked in light green
Depth slice showing orientation of channels Pseudo Well
Proximal Distal
% channels connected
Channel percentage
Channels coloured according to connected clusters. Isolated channels shown in grey
Fig. 10b
Page 42
Connectivity Scale
Cross-section, location of depth slice marked in light green
Depth slice showing orientation of channels Pseudo Well
Proximal Distal
% channels connected
Channel percentage
Channels coloured according to connected clusters. Isolated channels shown in grey
Page 43
Connectivity Scale
Cross-section, location of depth slice marked in light green
Depth slice showing orientation of channels Pseudo Well
% channels connected
Channel percentage
Channels coloured according to connected clusters. Isolated channels shown in grey
Page 44
Flow Direction
2000 m
30 m
Few, isolated,preserved channel elements
Raised crevassesplay with levees
2% channel infill
Primary channelTertiarycrevassechannel
A-B Interseam,Splay Geometry
Lithology
CoalCarbonaceous ShaleMudstoneSilty MudstoneSiltstoneSilty SandstoneSandstoneCave, no data
GR 120-Sand/Mud
cutoff
A
B
A
B
GR 120-Sand/Mud
cutoff
Proximal Distal
Architectural Element
Secondary Distributary ChannelTertiary (Crevasse/distributary) ChannelChannel Margin/Lake MarginProximal-/Medial FloodplainDistal FloodplainLake/Frequently Inundated FloodplainMire
Page 45
Flow Direction
2000 m
30 m
Crevassesplaycomplex
Lake
Primary channel
Tertiarycrevassechannel
Good preservationof ‘overbank’channel elements
17% channel infill
Raised crevassesplay with levees
Lateralaccretion
B-C Interseam,Splay Geometry
Proximal Distal
Lithology
CoalCarbonaceous ShaleMudstoneSilty MudstoneSiltstoneSilty SandstoneSandstoneCave, no data
Architectural Element
Secondary Distributary ChannelTertiary (Crevasse/Distributary) ChannelChannel Margin/Lake MarginProximal-Medial FloodplainDistal FloodplainLake/Frequently Inundated FloodplainMire
Page 46
Flow Dire
ction
2000 m
30 m
Good preservationof ‘overbank’channel elements
Abandoned channels
17% channel infill
Tertiarydistributarychannel
Common bifurcationof channels
Lateralaccretion
B-C Interseam,Meandering, Bifurcating Distributary Channels
Lithology
CoalCarbonaceous ShaleMudstoneSilty MudstoneSiltstoneSilty SandstoneSandstoneCave, no data
Architectural Element
Secondary Distributary ChannelTertiary (Crevasse/Distributary) ChannelChannel Margin/Lake MarginProximal-Medial FloodplainDistal FloodplainLake/Frequently Inundated FloodplainMire