+ All Categories
Home > Documents > Prediction of ocean carbon dioxide levels at observational time series nodes using satellite ocean...

Prediction of ocean carbon dioxide levels at observational time series nodes using satellite ocean...

Date post: 02-Jan-2016
Category:
Upload: marshall-welch
View: 214 times
Download: 0 times
Share this document with a friend
Popular Tags:
20
Prediction of ocean carbon dioxide levels at observational time series nodes using satellite ocean remote sensing products D. Vandemark 1 , T. Moore 1 , J. Salisbury 1 , B. Chapron 2 1 University of New Hampshire, EOS/OPAL, Durham, NH 2 IFREMER /Centre de Brest, LOS, Plouzane, France OceanFlux GHG Science Workshop, Plouzané, Sept. 2013
Transcript

Prediction of ocean carbon dioxide levels at observational time series nodes using satellite ocean remote

sensing products

D. Vandemark1, T. Moore1 , J. Salisbury1 , B. Chapron2

1University of New Hampshire, EOS/OPAL, Durham, NH2IFREMER /Centre de Brest, LOS, Plouzane, France

OceanFlux GHG Science Workshop, Plouzané, Sept. 2013

Mass flux estimation requires the driver – ΔpCO2(x,y,t)

• Standard approach = ΔpCO2 climatology from Takahashi/SOCAT pCO2 along with atm. model (e.g. CTracker)

• Pros: increasing database around globe to give mean global and seasonal estimates (> 7 M data points)

• Cons: – time coverage, very few locations yet sampled for

even one annual cycle at monthly time step– spatial coverage, many basins (e.g. SO, Indian Ocean,

and S. Pacific & Atlantic are very sparsely sampled)

OceanFlux GHG Science Workshop, Plouzané, Sept. 2013

OceanFlux GHG Science Workshop, Plouzané, Sept. 2013

US East Coastexample from

Signorini et al 2013

More than 800,000 indiv. samples,

1987-2011

Few pixels with monthly coverage

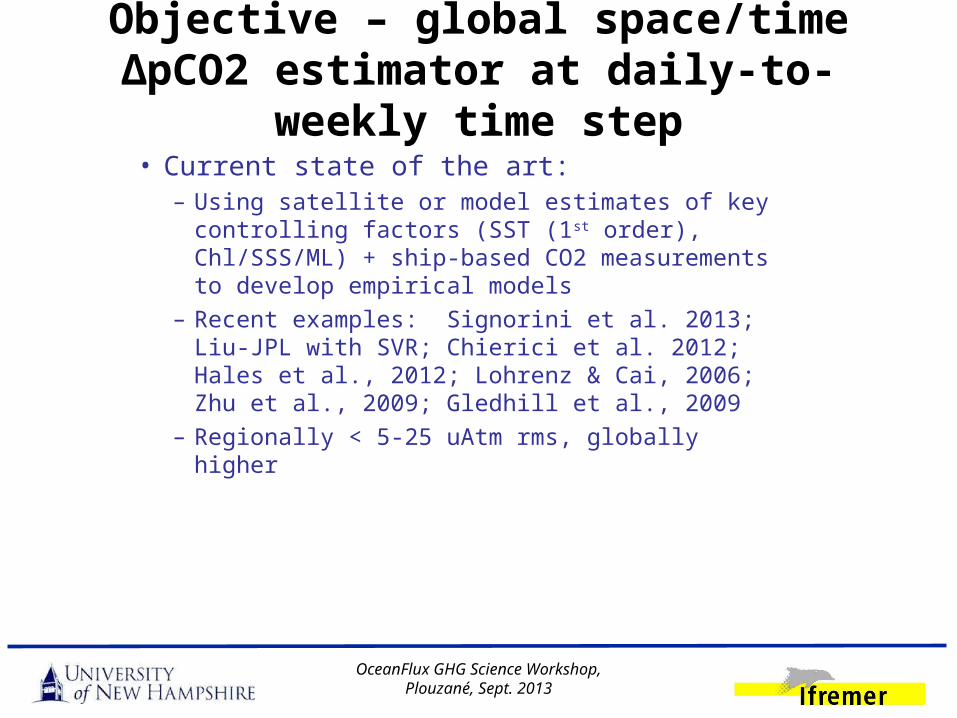
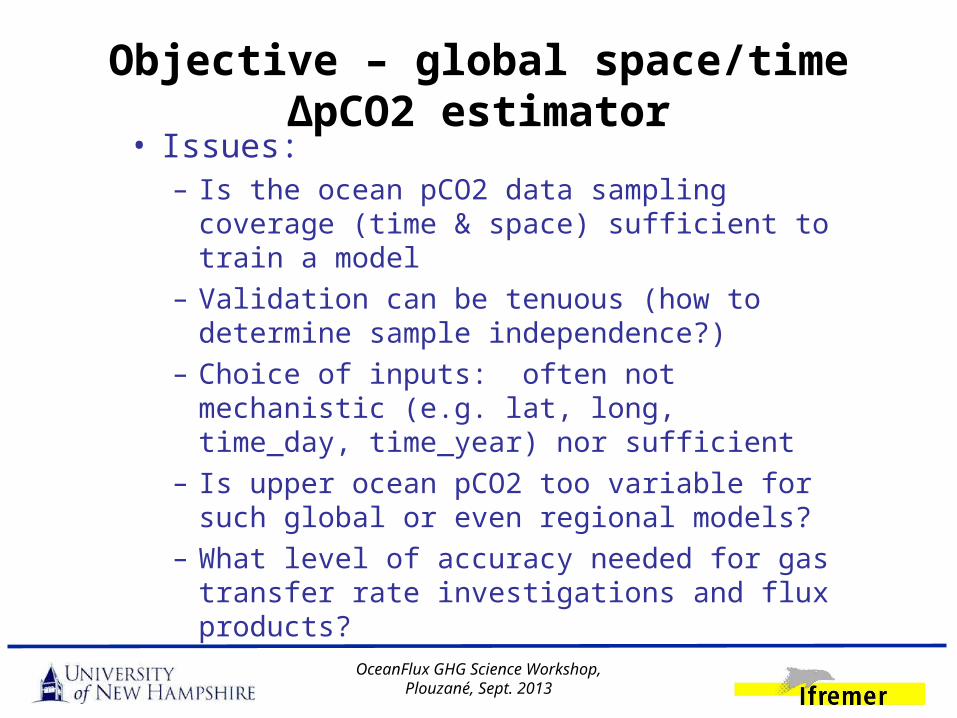
Objective – global space/time ΔpCO2 estimator at daily-to-weekly time step

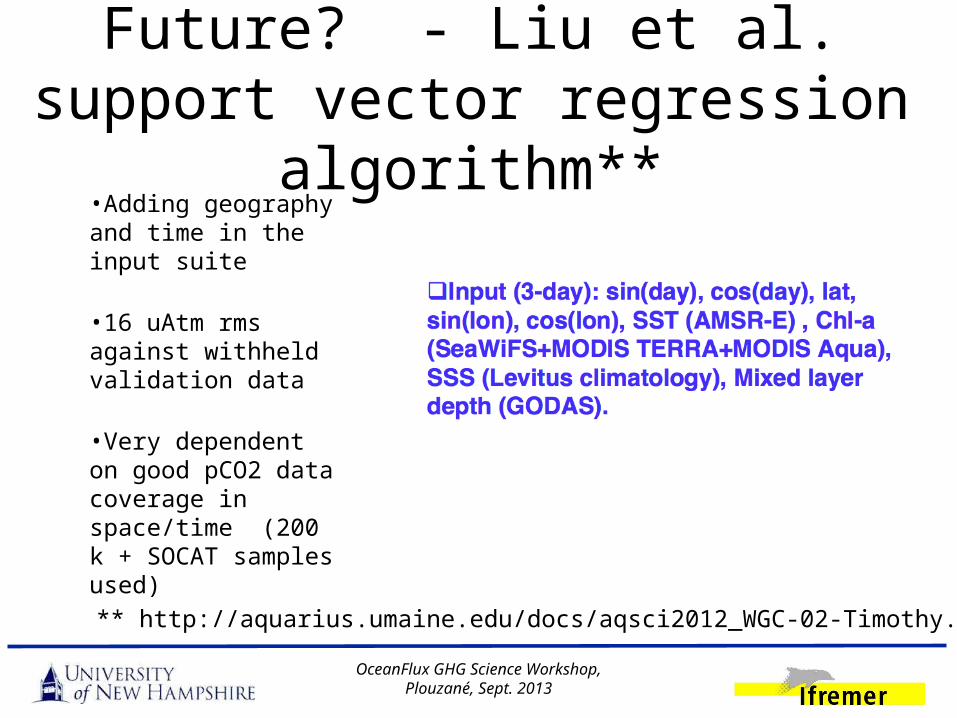
• Current state of the art:– Using satellite or model estimates of key

controlling factors (SST (1st order), Chl/SSS/ML) + ship-based CO2 measurements to develop empirical models

– Recent examples: Signorini et al. 2013; Liu-JPL with SVR; Chierici et al. 2012; Hales et al., 2012; Lohrenz & Cai, 2006; Zhu et al., 2009; Gledhill et al., 2009

– Regionally < 5-25 uAtm rms, globally higher

OceanFlux GHG Science Workshop, Plouzané, Sept. 2013

Objective – global space/time ΔpCO2 estimator

• Issues:– Is the ocean pCO2 data sampling coverage

(time & space) sufficient to train a model – Validation can be tenuous (how to determine

sample independence?)– Choice of inputs: often not mechanistic (e.g.

lat, long, time_day, time_year) nor sufficient – Is upper ocean pCO2 too variable for such

global or even regional models?– What level of accuracy needed for gas

transfer rate investigations and flux products?

OceanFlux GHG Science Workshop, Plouzané, Sept. 2013

Our approach – focus on time series

• Assumption: without time resolved algorithm training datasets, pCO2 prediction is likely under-constrained

• Desired training sets - continuous in situ pCO2 data with sub seasonal sampling and limited regional span

OceanFlux GHG Science Workshop, Plouzané, Sept. 2013

Ocean pCO2 time series data for algo input • Goal: Obtain virtual and actual time series data• Requirements

– sub seasonal resolution– at least one complete annual cycle– select several diverse ocean regions and apply consistent

algorithm development approach

OceanFlux GHG Science Workshop, Plouzané, Sept. 2013

VIRTUAL (SOCAT) MOORED

Very few regions yielding a time series, even using recent SOCAT

Several (few) of the global network have multi-month time sets online

Methods overview

OceanFlux GHG Science Workshop, Plouzané, Sept. 2013

5 site training sets: Satellite matchups + buoy pCO2

LS regression modelingMultiple Linear RegressionNeural Network

Mechanistic modeling (e.g. 1-D temp-normalized pCO2 vs. DIC_bio, carbonate closure with TA(SSS) ) NOT DISCUSSED HERE

Similar methodology at each sites, 3 N Pac, 1 S Pac, 1 N. Atlantic + an overall model for experimentation

Validation

Overall matchup dataset creation, site-by-site

OceanFlux GHG Science Workshop, Plouzané, Sept. 2013

Note: from 7 M pCO2 samples down to few hundred samples per site

Total buoy measurementsand coincident cloud-free satellite data

pCO2, in situ and satellite data used for algorithm training

Type Source Time Spatial Res.

In situ SST Mooring sub-daily m

In situ SSS Mooring sub-daily m

In situ pCO2 Mooring sub-daily m

Sat. Chl_a GlobColour daily 9 km

Sat. SST & PAR Aqua-MODIS daily 9 km

Sat. NPP OSU/MODIS 8-day 9 km

Model MLD OSU/hycom 8-day 9 km

Site-specific multiple linear regression – what inputs help?

OceanFlux GHG Science Workshop, Plouzané, Sept. 2013

Stratus Time series pCO2 modeling

Salinity drives largest variance reduction

Ocean color also contributes

Similar at each site PAPA, BATS, HOTS

Neural Network – factor 2 improvement

OceanFlux GHG Science Workshop, Plouzané, Sept. 2013

• Neural network solutions superior at each site

• Similar rms reduction as variables added up to 4 inputs (chosen best case)

• Similar reduction and results site-by-site

Stratus Time series pCO2 modeling - NN

OceanFlux GHG Science Workshop, Plouzané, Sept. 2013

Stratus Time series pCO2 model NN (SST, MLD)

OceanFlux GHG Science Workshop, Plouzané, Sept. 2013

Stratus Time series pCO2 model NN (SST, MLD, SSS, NPP)

assessment with ship data – near Stratus

OceanFlux GHG Science Workshop, Plouzané, Sept. 2013

Use independent ship data surrounding the site with same satellite matchups

In situ vs. predicted colored by distance ( log10(distance^-1)

agreement not impressive

VOCALS cruise data

Stratus

assessment with ship data – near BATS

OceanFlux GHG Science Workshop, Plouzané, Sept. 2013

Use independent ship data surrounding the site with same satellite matchups

In situ vs. predicted colored by distance ( log10(distance^-1)

SOCAT + Clivar cruise data

BTM

further assessmentrequired

OceanFlux GHG Science Workshop, Plouzané, Sept. 2013

Future? Multi-site algorithm why, why not, how successful at each site and elsewhere?

OceanFlux GHG Science Workshop, Plouzané, Sept. 2013

Pooling time series data and model training to create a single multi-site algorithm

RMS goes up factor of 1.5-2 at each site (Still all less than 8 uAtm)

Future? - Liu et al. support vector regression algorithm**

OceanFlux GHG Science Workshop, Plouzané, Sept. 2013

•Adding geography and time in the input suite

•16 uAtm rms against withheld validation data

•Very dependent on good pCO2 data coverage in space/time (200 k + SOCAT samples used)

** http://aquarius.umaine.edu/docs/aqsci2012_WGC-02-Timothy.pdf

Future? - Liu et al. support vector regression algorithm**

OceanFlux GHG Science Workshop, Plouzané, Sept. 2013

** http://aquarius.umaine.edu/docs/aqsci2012_WGC-02-Timothy.pdf

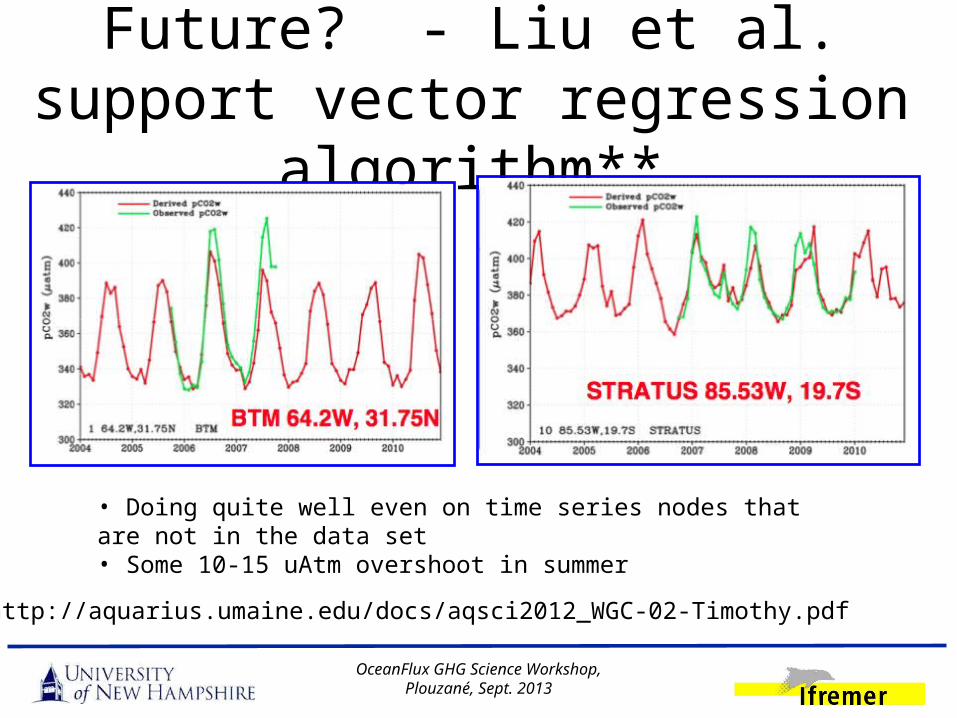
• Doing quite well even on time series nodes that are not in the data set• Some 10-15 uAtm overshoot in summer

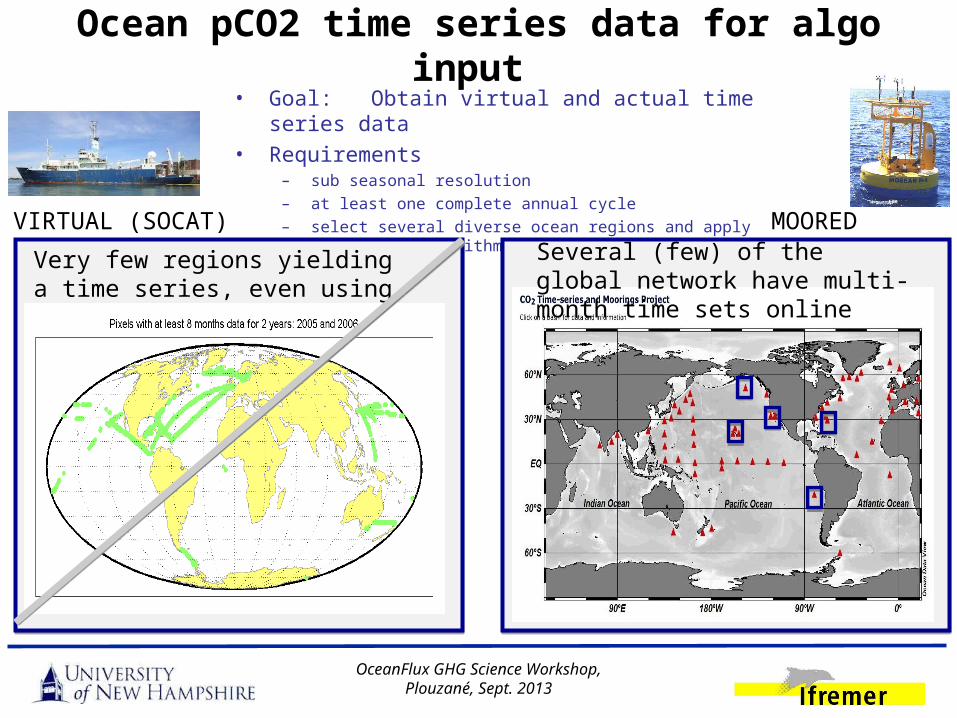
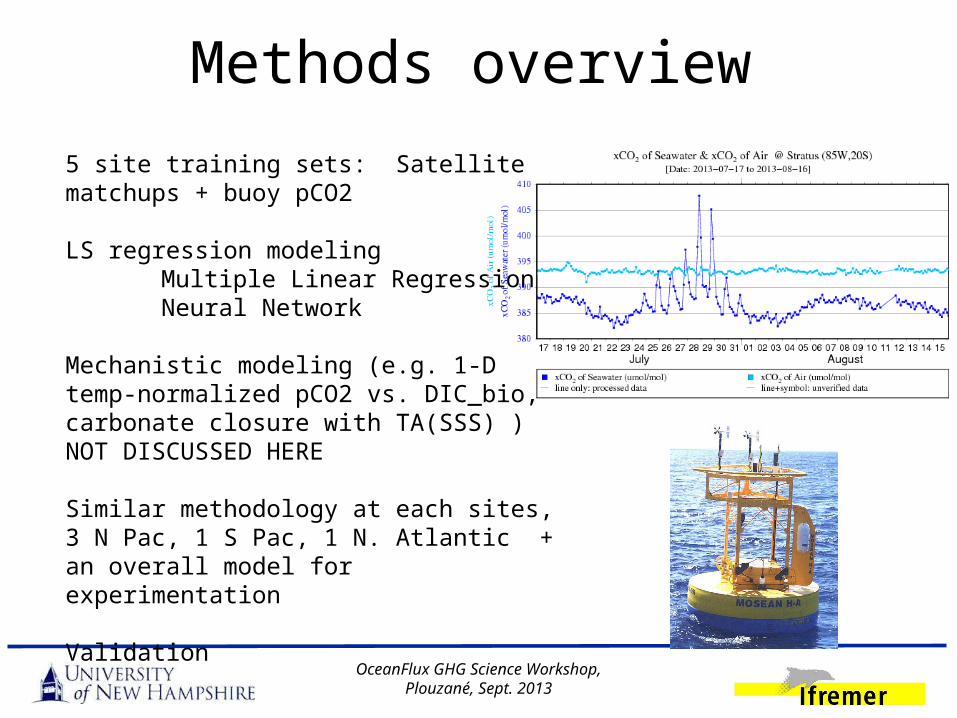
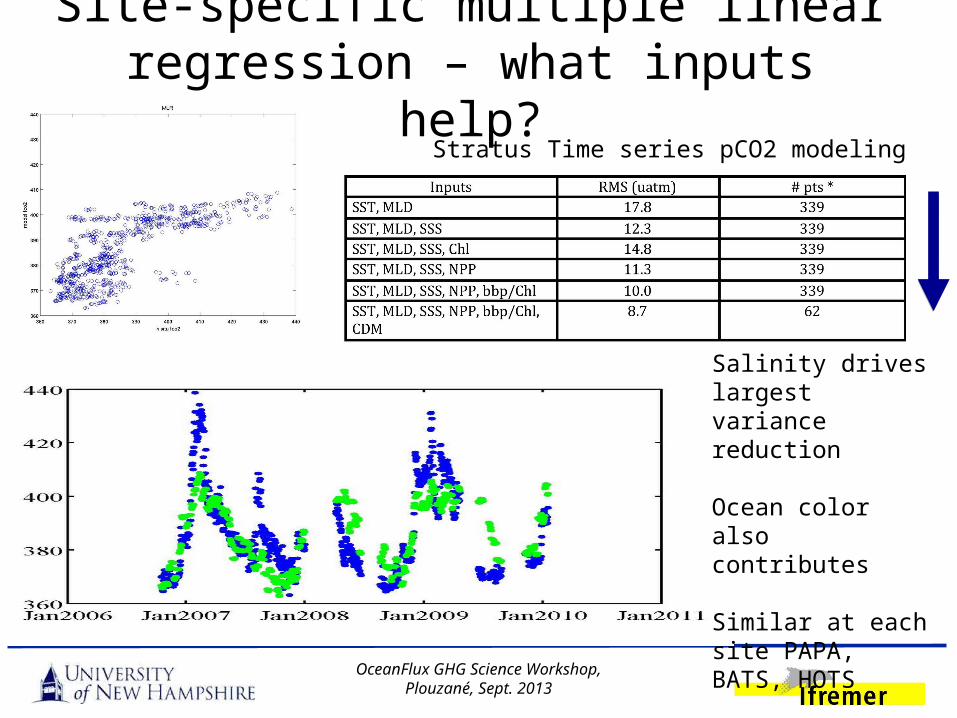
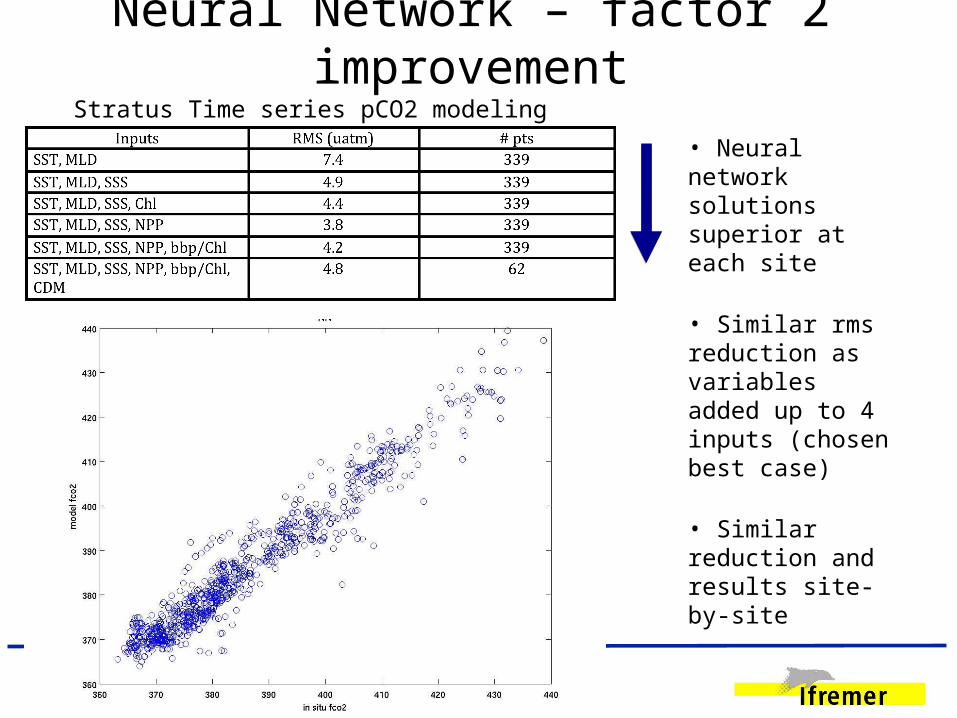
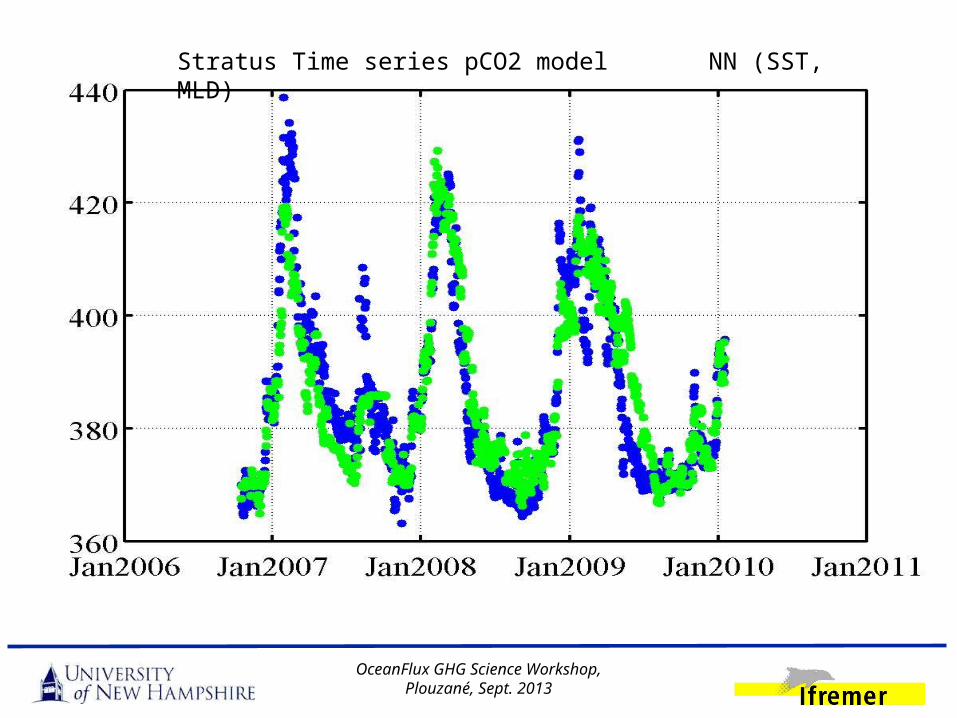
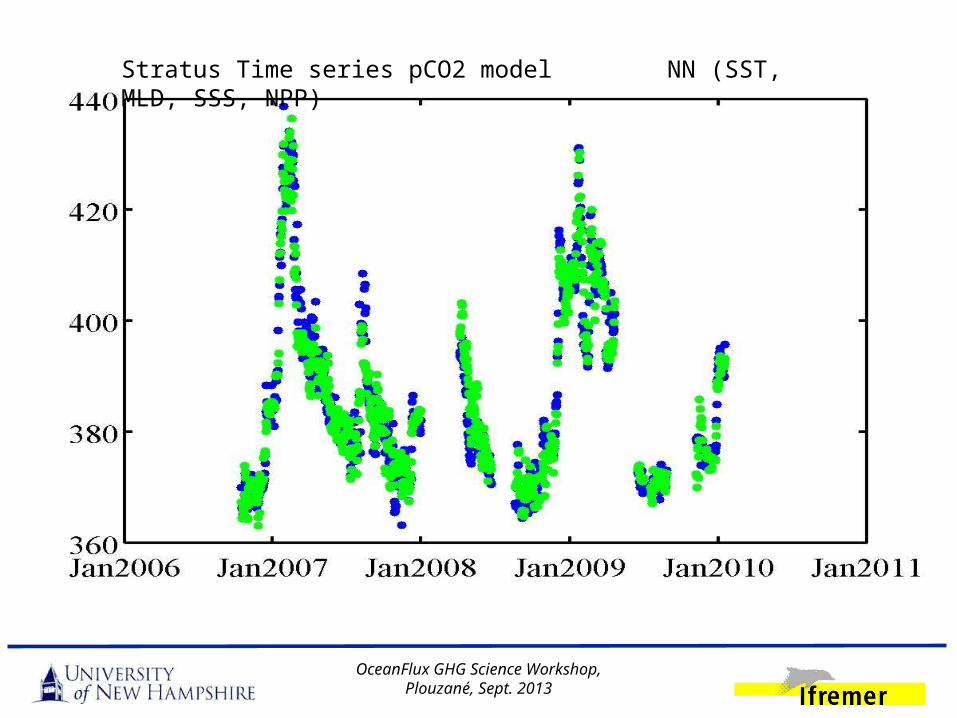
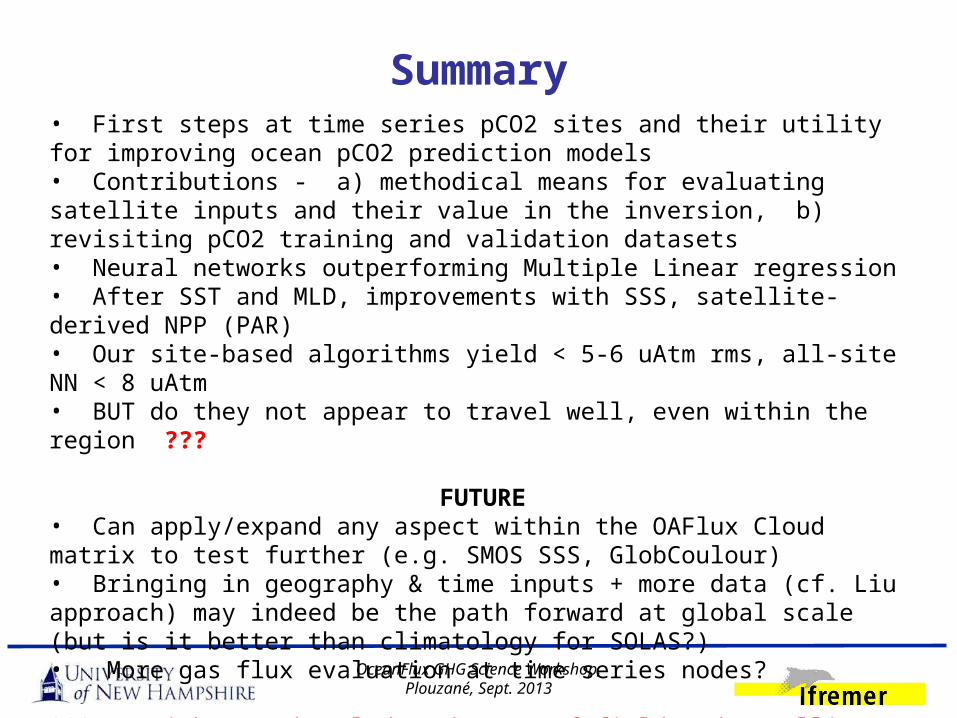
Summary• First steps at time series pCO2 sites and their utility for improving ocean pCO2 prediction models• Contributions - a) methodical means for evaluating satellite inputs and their value in the inversion, b) revisiting pCO2 training and validation datasets • Neural networks outperforming Multiple Linear regression• After SST and MLD, improvements with SSS, satellite-derived NPP (PAR)• Our site-based algorithms yield < 5-6 uAtm rms, all-site NN < 8 uAtm• BUT do they not appear to travel well, even within the region ???

FUTURE• Can apply/expand any aspect within the OAFlux Cloud matrix to test further (e.g. SMOS SSS, GlobCoulour)• Bringing in geography & time inputs + more data (cf. Liu approach) may indeed be the path forward at global scale (but is it better than climatology for SOLAS?) • More gas flux evaluation at time series nodes?

*** We wish to acknowledge the use of field and satellite data from NOAA, WHOI, SOCAT, and the space agencies. ****

OceanFlux GHG Science Workshop, Plouzané, Sept. 2013


Recommended